

Abstract
The ability to routinely identify and quantify the complete proteome from single cells will greatly advance medicine and basic biology research. To meet this challenge of single-cell proteomics, single-molecule technologies are being developed and improved. Most approaches, to date, rely on the analysis of polypeptides, resulting from digested proteins, either in solution or immobilized on a surface. Nanopore biosensing is an emerging single-molecule technique that circumvents surface immobilization and is optimally suited for the analysis of long biopolymers, as has already been shown for DNA sequencing. However, proteins, unlike DNA molecules, are not uniformly charged and harbor complex tertiary structures. Consequently, the ability of nanopores to analyze unfolded full-length proteins has remained elusive. Here, we evaluate the use of heat denaturation and the anionic surfactant sodium dodecyl sulfate (SDS) to facilitate electrokinetic nanopore sensing of unfolded proteins. Specifically, we characterize the voltage dependence translocation dynamics of a wide molecular weight range of proteins (from 14 to 130 kDa) through sub-5 nm solid-state nanopores, using a SDS concentration below the critical micelle concentration. Our results suggest that proteins’ translocation dynamics are significantly slower than expected, presumably due to the smaller nanopore diameters used in our study and the role of the electroosmotic force opposing the translocation direction. This allows us to distinguish among the proteins of different molecular weights based on their dwell time and electrical charge deficit. Given the simplicity of the protein denaturation assay and circumvention of the tailor-made necessities for sensing protein of different folded sizes, shapes, and charges, this approach can facilitate the development of a whole proteome identification technique.
Keywords: solid-state nanopores, single-molecule sensing, protein translocation, electroosmotic force, electrical charge deficit, SDS−protein complex, voltage-driven translocation
Introduction
The fast-growing demand for on-site and rapid clinical diagnostics, accelerated by the SARS-Cov-2 pandemic, has created a rising need for alternative biomolecular sensing technologies, particularly those that offer single-molecule sensing resolution. Among the various methods, nanopore sensors have carved a unique niche due to their relatively straightforward operation principle, their versatility in terms of the range of detectable analytes, and their potential integration in fully portable low-power devices.1,2 Importantly, in recent years, researchers have been able to shift nanopore research from basic proof of concept demonstration using laboratory-made synthetic analytes toward clinical applications, which often involve complex-to-analyze biofluids. The versatility of nanopore sensors has already been illustrated in multiple applications, such as sensing of DNA cancer mutations or mRNA cancer metastasis biomarkers in clinical samples, RNA of viral infections, epigenetic modifications, and native proteins, to name a few.3−11
In parallel, the development of single-molecule proteomics technologies has gained significant momentum, partly owing to emerging sensing strategies.12 Also here, nanopore sensors have been proposed for protein sequencing or protein identification, using similar principles underlying the successful nanopore DNA sequencer.13−20 Whole proteome analyses introduce significant challenges, which are considerably more complex than genome sequencing. Unlike DNA, proteins cannot be amplified to facilitate their analysis, and human proteins harbor 20 different amino acids as opposed to the DNA’s four canonical nucleotides. Similar to mass spectrometry, some of the nanopore approaches focus on analyzing short peptides produced from sheared or digested proteins,21−23 whereas other approaches are centered on the analysis of full-length proteins.24 An advantage of the latter approach is that each protein is counted once, and the full information regarding the protein identity is maintained. Hence, downstream data analysis is potentially simplified. To date, an antibody-free generic method for full-length protein identification with a single-molecule resolution has remained elusive.
The biochemical diversity and complexity of biological proteomes in terms of proteins’ structures, charge, mass, and hydrophobic nature are overwhelming. One way to tackle this challenge is to employ a denaturation protocol, which resolves the proteins’ higher-order structures while stabilizing a random coil state. The unfolded protein structure lends itself to molecule-by-molecule analysis using a single-size nanopore sensor for all the proteins regardless of their length, provided that the unfolded protein can be linearly threaded through the pore.25−29 Particularly, ionic surfactants, such as sodium dodecyl sulfate (SDS), have been extensively used in bulk for stabilization of the proteins’ denatured state. Furthermore, SDS facilitates uniform electromigration of denatured proteins, since the uniform negative charge of the SDS molecules adsorbed to the proteins supersedes by a large margin the proteins’ native net charge.30−32 Recently, it has been shown that the uniformly distributed SDS charge facilitates electrophoretic-based capture and translocation of the proteins through ∼10 nm solid-state nanopores.33 However, the mechanism governing their translocation dynamics, particularly through small nanopores, which can potentially extend the translocation dwell-times, has remained to date unclear.
Past studies of dsDNA molecules’ translocations suggested that the DNAs’ dwell-time in a solid-state nanopore is strongly dependent on the nanopore diameter.34 In particular, about an order of magnitude increase in dwell-time was observed when the pore size was reduced from roughly 5 nm to 3 nm (the mean dsDNA cross-section is 2.2 nm). Lengthening the translocation dwell-time is advantageous, as it extends the dynamic range of nanopore analysis, permitting the analysis of smaller molecular weight proteins. Here we hypothesized that substantial slowing down of the protein samples may be achieved using nanopore diameters of roughly 3–5 nm, comparable with the expected cross-section of the SDS-denatured protein complexes (roughly 1.5–2.5 nm).35 This allows us to effectively analyze the translocation dynamics of several proteins of different molecular weights starting from about 14 kDa up to 130 kDa. These proteins were analyzed under different voltages, SDS concentrations, and nanopore sizes, affording insights into the SDS-denatured protein translocation dynamics and the underlying forces governing this process. Interestingly, even when the SDS concentration is dialed below the critical micelle concentration (CMC), we observe a significant slowing down of the SDS-denatured protein complexes translocating through small nanopores. This is attributed to the interplay of the electroosmotic force and the electrophoretic force. According to our results, smaller proteins are clearly distinguishable from larger proteins by their dwell-times and their ion-current amplitudes. Moreover, the multiplications of the events’ dwell-times by their corresponding current amplitudes (the so-called electrical charge deficits, or ECDs) provide a nanopore-specific analogous measurement of the proteins’ molecular weights, hence permitting wide-range discrimination among proteins. Histograms of the ECD values for each protein display two distinct peaks, suggesting the translocations of two different populations: a complete SDS–unfolded protein complex and a partially structured SDS–protein complex.
Results and Discussion
1. Nanopore Discrimination between SDS Micelles and Proteins Translocations
Due to Debye shielding at high solution ionic strengths, SDS molecules spontaneously form spherical micelles at a significantly lower threshold concentration (the CMC) than in pure water. Specifically, at a near-physiological concentration of 200 mM NaCl, the CMC drops from roughly 6 mM (in pure water) to <1 mM (0.03% w/w).36 High ionic strength solutions are necessary for nanopore sensing assays to support ion-current measurements; hence it was necessary to characterize the translocation pattern of SDS micelles versus the translocation of SDS-denatured proteins. To this end, we performed a set of measurements using a standard “nanopore buffer” (0.4 M NaCl in 1× PBS, pH 7.4) using nanopore sizes in the range of 4–5 nm. These pores were characterized by their conductance (G = iO/V where iO is the measured open-pore current and V is the applied voltage, typically 300 mV). Here we varied the SDS concentration from 700 μM down to 175 μM, while keeping the protein concentration of bovine serum albumin protein (BSA, Mw = 66.4 kDa, and the number of amino acids Naa = 583) at 1–1.5 nM. On the basis of the literature we expected that the actual CMC at 0.4 M NaCl would be <1 mM SDS, but the exact CMC value and the optimal SDS concentration for the nanopore experiments must be determined empirically.
Starting from a stable and unperturbed nanopore open pore current (3.6 nA at V = 300 mV, G = 12 nS), upon addition of 700 μM SDS, we observed a fast and uniform ion-blockade pattern with an event amplitude of ΔI = 0.67 nA and FWHM of 0.03 nA (Figure 1a, left panel). We attributed these events to the SDS micelles’ translocations, as the individual SDS molecules are too small to be sensed in the nanopores used. Given that SDS micelles are small (Mw < 18 kDa) and highly charged (NSDS ≈ 60) spherical particles, we expected to observe an extremely fast translocation dwell-time. Our data, however, suggest that the micelles’ event dwell-times are peaked between 100 and 150 μs (Figure 1b-I), comparable to a dsDNA molecule of 300 bp, which is roughly an order of magnitude larger in size. We rationalized that the main factor contributing to the seemingly long translocation time of the SDS micelles is the increased level of electroosmotic counter flow, due to the partial coating of all surfaces, including the nanopore inner walls, by the negatively charged SDS molecules.37 Consistent with previous results, a small fraction of events (<0.5%) appears at even longer time scales (a few ms), perhaps due to the random insertion of nonspherical micelles or micelles that strongly interact with the SiN in the nanopore lumen.33
Figure 1.

Characterization of SDS micelles and SDS-denatured BSA proteins translocations using sub-5 nm ssNPs. (a) Ion current traces at different protein and SDS concentrations show two distinct events amplitudes corresponding to SDS micelles and BSA proteins (BSA concentration 1–1.5 nM). (b) Event diagrams, shown as heatmaps, of the event amplitude (ΔI) vs dwell-time (log tD) for different SDS and protein concentrations: (I) SDS only (700 μM), (II) SDS + BSA (350 μM/1 nM), (III) SDS + BSA (175 μM/1.5 nM). (c) Corresponding histograms of event amplitudes show two distinct peaks for SDS micelles (0.5–0.7 nA) and BSA proteins (1.1–1.3 nA).
Next, we used a similar pore size (G = 12 nS) to test a sample containing 700 μM SDS and 1 nM BSA protein concentration (Figure 1a). The BSA proteins were heat-denatured in the presence of a higher SDS concentration (see Methods) and diluted at room temperature (RT), 22.0 ± 0.5 °C, to the final SDS and protein concentrations before being introduced to the nanopore. As before, we primarily observe fast and uniform events with a mean amplitude of ∼0.5 nA, but unlike panel I, a second population of events with a larger mean amplitude of 0.86 nA emerged (Figure S1). Further decreasing the SDS concentration to 350 μm while keeping the BSA at 1.0 nM resulted in a clear two-peak pattern in the mean events’ amplitudes (Figure 1b-II and 1c, middle panel): (1) 0.65 ± 0.11 nA and (2) 1.3 ± 0.26 nA, as marked in the heat-map diagram. This time the fractions of the two populations were comparable. Finally, when further decreasing the SDS concentration to 175 μM, we observe primarily events at ΔI = 1.1 nA, whereas the low-amplitude population (ΔI = 0.45 nA) became the minor population of events (Figure 1b-III and 1c, right panel).
The set of experiments described in Figure 1 suggests that at high SDS concentration (>350 μM) the micelles’ translocations dominate the overall population of the events. At lower SDS concentrations, and particularly below the NaCl salt-adjusted CMC, the vast majority of events could be attributed to protein/SDS complexes, which exhibit a distinguished events pattern based on their larger ion-current blocked amplitude. Notably, the protein/SDS complex translocations exhibit a broader dwell-time and blockade current amplitude distributions than that of the SDS micelles, as shown in the heat maps (Figure 1 panels b-II and b-III).
2. SDS-Denatured Translocation Patterns at Different Nanopore Sizes Suggest Primarily Single-File Dynamics and Multiple Protein Structures
To shed more light on the translocation pattern of the protein/SDS complexes, we selected a smaller protein than BSA, carbonic anhydrase (CA, Mw = 28.9 kDa, Naa = 259), which was denatured in the presence of SDS using the same protocol. We tested the CA translocation dynamics using three different nanopore sizes at the low SDS concentration (175 μM). Starting from a G = 7 nS pore (∼3 nm), we observed long translocation events with a characteristic dwell-time of 650 ± 60 μs (Figure 2a left panel and Figure S3b). When a 12 nS pore (∼4 nm) was used, the characteristic mean dwell-time was reduced to 180 ± 40 μs (Figure 2a middle panel). Finally using a large pore of G = 21 nS (∼7 nm), we observed events with a mean dwell-time of ∼100 μs (Figure 2a right panel). Notably, in all three cases the events’ amplitudes remained invariant with a mean value of ΔI ≈ 0.9 nA and STD = 0.11 nA. This value is also consistent with the mean BSA event amplitude (1.1 and STD = 0.3 nA) shown in Figure 1.
Figure 2.

Translocation dynamics of SDS-denatured carbonic anhydrase (CA) proteins in three different nanopore sizes. (a) Translocation events diagrams shown as heat-maps for CA proteins using three nanopore sizes (left to right): ∼3 nm, G = 7 ns; ∼4 nm, G = 12 nS; and ∼7 nm, G = 21 nS. In each case, the event amplitudes (ΔI) are shown vs the event dwell-times (log tD). Typical events are displayed in insets, showing a clear shift toward longer events in the smaller nanopores, but similar event amplitudes. (b) Histograms of the electrical charge deficit (ECD) for the three experiments (shown in semilog scale). In all cases, the ECD histogram displays a prominent peak around 106e and secondary peaks at 108.3e, 107e, and 106.5e for the smaller and larger pores, respectively. Minor peaks at much lower ECD, possibly due to collisions, are also visible. Red curves are double Gaussian fits (see text).
Drawing an analogy from the translocation dynamics of dsDNA
molecules
through ssNPs, we can roughly approximate the effective analyte’s
cross-section using  , where iO is
the nanopore’s open-pore current and d is
its effective diameter.34 Accordingly,
for the three experiments displayed in Figure 2, we obtained a = 1.96 ±
0.22 nm, 2.01 ± 0.20 nm, and 2.83 ± 0.31 nm for the 3, 4,
and 7 nm pores, respectively. While these are only crude approximations,
they fall within the expected cross-sections of the SDS–polypeptide
complexes between 1.5 and 2.5 nm.35 We,
therefore, hypothesized that the main portion of the events represents
single-file translocations of the unfolded proteins through the nanopore.
Further observation of the events diagram heat-maps suggests that
the smaller pores give rise to significantly longer protein mean translocation
dwell-times. Particularly, the characteristic translocation dwell-time
of the CA proteins is 650 μs (using the ∼3 nm ssNP),
which is roughly an order of magnitude longer than previous studies
using ∼10 nm ssNPs,33 considering
similar molecular weight proteins. This finding may permit the detection
of a broader range of proteins, but the effect is not as strong as
the one observed for dsDNA translocation dynamics through ssNPs.34
, where iO is
the nanopore’s open-pore current and d is
its effective diameter.34 Accordingly,
for the three experiments displayed in Figure 2, we obtained a = 1.96 ±
0.22 nm, 2.01 ± 0.20 nm, and 2.83 ± 0.31 nm for the 3, 4,
and 7 nm pores, respectively. While these are only crude approximations,
they fall within the expected cross-sections of the SDS–polypeptide
complexes between 1.5 and 2.5 nm.35 We,
therefore, hypothesized that the main portion of the events represents
single-file translocations of the unfolded proteins through the nanopore.
Further observation of the events diagram heat-maps suggests that
the smaller pores give rise to significantly longer protein mean translocation
dwell-times. Particularly, the characteristic translocation dwell-time
of the CA proteins is 650 μs (using the ∼3 nm ssNP),
which is roughly an order of magnitude longer than previous studies
using ∼10 nm ssNPs,33 considering
similar molecular weight proteins. This finding may permit the detection
of a broader range of proteins, but the effect is not as strong as
the one observed for dsDNA translocation dynamics through ssNPs.34
Temperature-induced protein unfolding and the stabilization of the denatured state by surfactants, such as SDS, is a complex process that can lead to multiple structural states. In addition to a fully unfolded, random coil state, the protein may maintain some of the most stable secondary structural motifs, which may be resolved upon further application of force on the protein chain. To resolve multiple states of dsDNA using nanopore sensors, previous studies38 calculated the electrical charge deficit, defined as ECD = ΔI × tD/e where e is the elementary charge. For example, the ECD values of folded and unfolded forms of the same DNA were found to be strikingly different.38 Following this idea, we hypothesized that the ECD might be useful in better resolving multiple protein/SDS complexes in our measurements. Figure 2b presents the histograms of the ECD values for the three nanopore size experiments performed with CA/SDS complexes. In all three cases, two main peaks in the ECD histogram emerged: a main peak at around 106e to 106.5e and a secondary peak, which varied between ∼108.5e and ∼107e for the smaller and larger pores, respectively. Interestingly, the intermediate pore size (∼4 nm) displayed the largest fraction of secondary ECD events (∼25%), while smaller and larger pores showed smaller fractions of the secondary peak (∼10%). This observation is consistent with an interpretation in which the secondary ECD events correspond to partially folded complexes.
3. Alpha-lactalbumin Translocation Dynamics as a Function of Voltage Further Reveals the Interplay between Electrophoretic and Electroosmotic Forces
The experiments shown in Figure 1 and Figure 2 already exposed some of the additional complexities associated with the translocation dynamics of SDS/protein complexes as compared to a simpler polyelectrolyte, such as dsDNA, and the potential role of electroosmotic flow (EOF). To further isolate the effect of surface charge and EOF, we used a smaller protein, alpha-lactalbumin (α-LA, 14 kDa, Naa = 123), which is readily denatured using heat/SDS treatment. We found that at V = 300 mV the characteristic translocation dwell-time of α-LA through a G = 12 nS pore was too short for detection. Therefore, to ensure that our results are minimally biased by the experimental temporal bandwidth, particularly at larger voltages, we performed this set of experiments in the presence of 10% glycerol (v/v), which is expected to increase the solution viscosity by a factor of 1.63 (at RT).39
Notably, a higher glycerol concentration than 10% could further increase the apparent dwell-times of the proteins in the nanopore. But higher viscosities proportionally reduce the effective protein capture rate by the nanopore, hence limiting its practical use with relatively low glycerol concentrations. In Figure S6, we show a series of SDS-denatured α-LA measurements performed using an 11 nS nanopore at different voltages (450–750 mV) in 10% glycerol (v/v). The data were analyzed as in the previous cases (Figures 1 and Figure 2): first, we extracted the events’ tD and ΔI, and then we calculated the ECD histograms for each data set. Next, we fitted the log of the ECD distributions with a double Gaussian function to obtain the mean values of the two populations. A summary of our results is presented in Figure 3. The left panel shows the ECD values for the main peak (solid black circles) and for the secondary peak (solid red squares) as a function of voltage. Interestingly, the main ECD peak appears to be independent of the voltage, with a mean value of 106.0±0.03 electron units. This result aligns well with the results shown in Figure 2, suggesting that the main ECD peak is also independent of nanopore size. In other words, the increase of ΔI with voltage is offset by a similar decrease in log(td) with voltage.
Figure 3.

Voltage dependence of translocation dynamics of SDS-denatured alpha-lactalbumin proteins. (A) Electrical charge deficit (ECD) vs voltage. Black circles represent the main peak, and red squares correspond to the secondary peak. The main ECD peak is nearly independent of voltage, whereas the secondary peak shows a mild decrease with voltage. (B) Dwell-time (td) vs voltage. Black circles correspond to events in the main peak, and red squares (inset) correspond to the secondary peak. The solid lines are decaying exponential fits. The experiments were performed in 10% glycerol (v/v), 0.4 M NaCl, 1× PBS, and 175 μM SDS.
The right panel displays the events’ dwell-time dependence on the applied voltage for the translocation events of the primary and secondary ECD peaks (black circles and red squares, respectively). In both cases, we see a decrease in dwell-times as the voltage increases, reassuring evidence that these blockade events represent translocations of the proteins from the cis side (at which proteins are introduced) to the trans side of the membrane and not random collisions of the protein complexes with the pore, which would have resulted in a longer dwell-time with increasing voltage bias. Some representative events that correspond to the primary and secondary peaks are displayed in Figure S7.
For both the primary and secondary groups, exponential functions can fit our data well, as expected for a voltage-driven translocation process through small nanopores.34 The typical decay constants for the SDS-denatured proteins obtained from the exponential fitting are 10.2 ± 1.0 V–1 and 9.2 ± 3.4 V–1 for the primary and secondary peaks, respectively. Interestingly, these values are about a factor of 5 smaller than the typical decay constants for dsDNA translocations through similar ssNPs.34 The much weaker voltage dependence of the protein/SDS complexes compared with the dsDNA experiments may be attributed to a smaller effective overall charge of the former, which manifests as a smaller electrophoretic driving force. An additional important factor is the possibility of the anionic SDS molecules coating the interior of the nanopore surfaces, resulting in a significant EOF that slows down the overall translocation of proteins. The magnitude of the EOF is expected to scale linearly with voltage, and combined with the apparent decrease in dwell-times with increasing voltage (Figure 3b), we concluded that electrophoretic forces remain the dominant contributors to the protein/SDS translocation dynamics. This interpretation is consistent with the relatively long translocation dwell-times that the SDS-denatured proteins exhibit in the nanopore as compared with ssDNA (or dsDNA) of a comparable chain length: for the 123 aa α-LA we measured a dwell-time of about 250 μs (at 450 mV), whereas a similar length dsDNA would translocate in less than 10 μs using a similar ssNP size and voltage. Additionally, a previous publication reporting folded state (no SDS) translocations of similar size proteins and nanopores reported much shorter dwell-times (∼50 μs) even at a lower bias voltage.40 This again supports the important contribution of EOF to slowing down the SDS-denatured protein molecules’ translocations.
4. Translocation Dwell-Times and ECDs Correlate with Proteins’ Molecular Weights
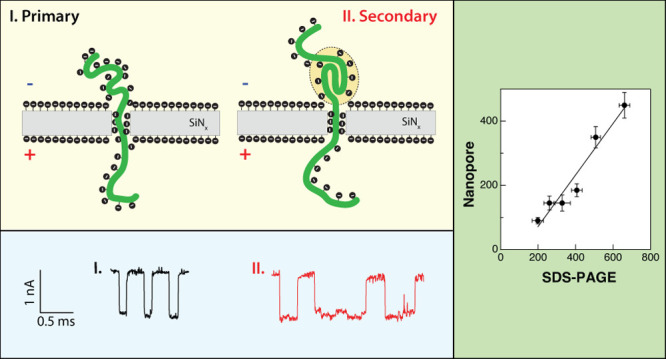
Assuming that the majority of the proteins/SDS complex events represent single-file translocations, we evaluated the capability of solid-state nanopores to discriminate among proteins having different molecular weights. To that end, we accumulated data from six different proteins spanning molecular weights between 14 and roughly 130 kDa. Figure 4a displays an SDS-PAGE (polyacrylamide gel electrophoresis) analysis of the six proteins analyzed (alpha-lactalbumin, carbonic anhydrase, ovalbumin, bovine serum albumin, phosphorylase B, and SARS-Cov-2 spike protein, labeled lanes 1 to 6, respectively), along a protein molecular weight ladder (marked with “L”). For all proteins, we observed a single band, except OVA, which consistently displayed two bands, presumably due to two alternative glycosylation states, as suggested by the vendor (Sigma). The proteins’ molecular weight versus their measured in-gel migration distance showed an exponential dependency (Figure 4b).
Figure 4.

SDS-PAGE analysis of six proteins used in this study compared with nanopore measurements. (a) PAGE analysis, from right to left: alpha-lactalbumin, carbonic anhydrase, ovalbumin, BSA, phosphorylase B, and spike protein were denatured and separated on a 4–20% Tris-glycine SDS-PAGE. The gel was fixed, stained with Flamingo fluorescent dye overnight, and imaged by the Pharos scanner (Bio-Rad). L denotes lanes with protein ladders (see Methods). (b) Dependence of the SDS-PAGE migration distance of the six proteins on their molecular weights. The solid line is an exponential fit. (c) Dependence of SDS-denatured protein translocation dwell-time on the PAGE migration distance. The solid line is a linear fit.
We analyzed the same proteins using the nanopore sensors. As before, we first calculated the ECD values for every event and then separated the events in each case according to their ECD main and secondary groups. We then plotted their characteristic dwell-time from the exponential fitting of the histograms. The characteristic mean dwell-times of the events in the primary ECD group showed a linear relationship with the in-gel bulk migration distance (Figure 4c). These results further support our interpretation of the primary peak events as single-file translocation of the unfolded proteins.
Figure 5a displays the dependencies of the primary and secondary peaks’ mean dwell-times (black circles and red squares, respectively) on molecular weight. For the primary peak, we saw a roughly linear increase of tD with molecular weight, but for the secondary peak, we observed a nonlinear increase of the dwell-time with Mw tentatively associated with the larger propensity of the larger proteins to maintain some secondary structures. In Figure 5b we show the dependence of the ECD main and secondary peaks on the proteins’ Mw. For both event populations we could fit our data with growing exponential functions (ECD = AeMw/ρ), where ρ1,2 are nanopore-characteristic molecular weight constants, ρ1 = 59.1 ± 7.1 kDa, and ρ2 = 28.1 ± 2.2 kDa, describing the rate at which the ECD grows with Mw. Accordingly, for nanopore measurements of SDS-denatured proteins, the ECD may serve as a proxy for the separation of different molecular weights or the single-molecule analog of the migration distance in SDS PAGE analysis.
Figure 5.

Translocation dynamics of SDS-denatured proteins as a function of molecular weight (Mw). (a) Characteristic dwell-times of the six proteins in the nanopore. The black solid circles represent the main peak (a, b), while the secondary peak is represented by red squares (a, b). We observe a linear increase of td on Mw for the main peak (black straight line fit) and a nonlinear dependence for the second group (red line is a guide for the eye). (b) Summary plot of the ECD as a function of Mw. The main ECD peak event (solid circle) shows a linear dependency on Mw, while the secondary peak event (red squares) exhibits a quadratic dependency. Solid lines are fits.
Conclusions
The ability to thread and analyze full-length denatured proteins using nanopores is a significant step for single-molecule protein identification and quantification and may lead to a whole proteome analysis approach.12,24,41 A crucial step toward this goal is the elucidation of the voltage-induced translocation dynamics through nanopores comparable in size to the SDS/polypeptide cross-section of 1.5–2.5 nm. To this end in this study, we used sub-5 nm solid-state nanopores and analyzed the proteins’ translocation dynamics at an SDS concentration slightly below the CMC level. Unlike simple polyelectrolytes, such as double-stranded DNA molecules, SDS–protein complexes involve additional factors that must be taken into consideration. Native proteins are not uniformly charged and pose elaborate tertiary structures, which in many cases support their biological function. SDS heat denaturation is an effective way to unfold proteins and decorate them with charged groups. However, this involves some subtleties: first, under high ionic strengths, SDS spontaneously forms micelles at relatively low concentrations, which appear as short translocation events and may be misinterpreted as proteins (Figure 1). We showed here that this issue can be addressed if SDS concentration is kept right below its salt-adjusted CMC. Second, SDS molecules coat all surfaces, including the nanopore itself, adding a significant amount of negative surface charge to the pore interfaces. The addition of surfactants increases the nanopore stability, making it more hydrophilic. But at the same time under voltage bias, it produces a stronger electroosmotic flow as compared to uncharged (or less charged) nanopore interfaces (Figure 6b). The EOF is a nanopore size-dependent phenomenon and can be exploited for slowing down or trapping the protein in a thin membrane, allowing label-free analysis of the protein dynamics.12,42,43 As suggested in Figure 3, the effect of the EOF is to slow down the proteins’ translocations, as it is directed in the reverse direction to the electrophoretic force (EP). But the EOF may also reduce the event capture rate into the nanopore;44 hence future studies may need to develop means to control the EOF effect more precisely.
Figure 6.

Model for elucidation of voltage-induced translocation of SDS/protein complexes through small solid-state nanopores. (a) Electrical charge deficit (ECD) for phosphorylase B, where two peaks can be distinguished clearly. The representative events corresponding to the first peak (represented in black color) show no sublevels in the ionic current trace during translocations. However, the event with the sublevel ionic current traces (red-colored events) corresponds to subtle secondary or tertiary motifs that exist during the protein translocations. (c) Schematic illustration for the two different scenarios. (b) Effect of SDS coating on the pore walls enhancing the EOF, resulting in the longer translocation time in comparison to a similar size dsDNA molecule.
As common in nanopore experiments, SDS-denatured proteins’ translocations dynamics were characterized using two main parameters, the events’ dwell-times and the events’ current amplitudes (tD and ΔI, respectively). We find that both parameters may exhibit multiple peaks, complicating a straightforward analysis of the results. However, their multiplication, the events’ electrical charge deficit, is a useful tool for the separation of the events into groups. Particularly, a striking feature that all our measurements suggest is the existence of a primary (where most of the events reside) and a secondary ECD group for all the proteins that were analyzed. Figure 6a shows a typical ECD histogram, measured for phosphorylase B proteins, using a 4 nm pore. The events associated with the primary ECD peak (black annotated) are typically single-level events with an amplitude around 1.2 nA. To a first approximation, this ion-current level is independent of nanopore size. In contrast, events from the secondary group (labeled in red) typically display multi-ion-current levels and are significantly longer than the events in the primary group (Figure 6a right-hand panel).
An analysis of multiple proteins ranging from about 14 to 130 kDa shows that the characteristic dwell-time of the primary ECD group events grows linearly with the proteins’ Mw, which is directly proportional to the proteins’ polypeptide chain lengths. It is therefore plausible to assume that this group of events corresponds to single-file translocation of fully linearized proteins through the nanopores, as shown schematically in Figure 6c. An analysis of the events’ current amplitude level, in this case, provides a rough estimate for the mean diameter of the polypeptide/SDS complexes of 2.0 to 2.5 nm. However, one should keep in mind that the events’ amplitude is considerably affected also by an access resistance due to increased repulsion of ions from the pore during the protein’s translocation, particularly for the long proteins.
The events of the secondary ECD peak exhibit much longer dwell-times than the primary group and often showed multiple ion-current levels during translocation. We hypothesize that, in this case, proteins are not fully denatured and contain some unresolved structures during their translocation process, as shown schematically in Figure 6c (right-hand panel). These results are supported by bulk time-resolved fluorescence measurements showing that at high SDS concentration the denatured proteins adopt an unfolded coil state, but below the SDS concentration used in our study, some local protein structure emerges (Figures S16 and S17). Further studies will be required to show that additional information on the proteins’ structure can be obtained from a detailed analysis of the ion-current time traces. Full denaturation of the polypeptide can be mediated by the EP force applied to the proteins, hence generating long dwell-times with nonlinear dependency on the proteins’ length (Figure 5a inset). In the future, more specific single-molecule studies, perhaps using electrooptical means or the inclusion of FRET probes, may be proven useful in support of this model.45 However, the fact that also the dwell-time of these secondary group events exponentially decays with voltage (Figure 3) may suggest that these events do not represent proteins that get stuck in the nanopore and retract to the cis side after some time. The latter scenario would entail growing dwell-times with increasing voltage, which is opposite to our observation.
In summary, we present a study of voltage-driven translocation dynamics of SDS-denatured proteins through solid-state nanopores with diameters that are just larger than the proteins/SDS cross-section. Small nanopores allow us to extend the dwell-times of proteins in the nanopores by nearly an order of magnitude, compared to previous studies, hence significantly extending the detectable range of molecular weights of unfolded full-length proteins. Calculation of the events’ ECD has revealed two distinct groups of events, which we attribute to the fully denatured proteins and to proteins with partially folded structures. The ECD can be used as a proxy for estimation of each protein’s Mw, in an analogous manner to the traditional analysis of proteins’ migration length in bulk SDS-PAGE. Our results constitute an essential step toward using solid-state nanopores for the identification of linearized full-length proteins, with single-molecule resolution. Furthermore, our study highlights the role of EOF in slowing down SDS-denatured proteins’ translocating through nanopores. Future studies, using fluorescently labeled proteins and computational simulations are required for elucidating its exact mode of action.
Methods
Sample Preparation for Nanopore Experiments
For experiments presented in Figures 2, 3, and 5, the denatured protein samples were prepared as follows: 100 nM of each protein was diluted in 1× PBS pH 7.4 containing 17.5 mM SDS and 5 mM tris(2-carboxyethyl)phosphine. The protein samples were allowed to shake at 300 rpm for 30 min at 25 °C to dissociate the protein’s disulfide bonds, followed by a complete denaturation of the proteins at 90 °C for 5 min. Then, the protein samples were cooled to room temperature before adding 1 μL of the protein sample to 100 μL of the nanopore buffer (400 mM NaCl, 175 μM SDS in 1× PBS, pH 7.4). Experiments in Figure 1 were prepared as described, except that the initial SDS concentration was 17.5, 35, or 70 mM. With the 100-fold dilution, the final SDS concentrations in the nanopore’s cis chamber were 175, 350, or 700 μM, accordingly, with a fixed protein concentration of 1 nM. For the SDS micelle translocation experiment (Figure 1a), the sample was prepared in the same manner without adding a protein. All proteins were purchased from Sigma-Aldrich-Merck, except the spike glycoprotein, which was purchased from ProSpec-Tany Techno-Gene Ltd.
Sample Preparation and Procedure for SDS-PAGE
For performing the SDS-PAGE experiments of proteins used in this study (Figure 4), the proteins were defrosted on ice, centrifuged at 10000 xg for 2 min at 4 °C, and kept on ice prior to sample preparation. A 20 pmol amount of alpha-lactalbumin, 6 pmol of carbonic anhydrase, 8 pmol of ovalbumin, 6 pmol of bovine serum albumin, 6 pmol of phosphorylase B and 4 pmol of spike were taken and mixed with Laemmli sample buffer containing 50 mM Tris-HCl, pH 6.8, 100 mM dithiothreitol, 2% (w/v) SDS, and 10% (v/v) glycerol. The samples were denatured at 95 °C for 5 min and separated on a 4–20% Tris-glycine gel (Bio-Rad) at a constant voltage of 150 V for 45 min using Laemmli running buffer (25 mM Tris base, 250 mM glycine, and 0.1% (w/v) SDS). The gel was fixed by incubating in 40% ethanol and 10% acetic acid for 3 h with gentle shaking and then stained using 1X Flamingo (Bio-Rad) overnight (16 h). The proteins’ bands were visualized using the 532 nm laser (532 nm excitation and 605 nm emission filters), and the gel image was acquired using the Pharos scanner (Bio-Rad).
Nanopore Fabrication and Device Assembly
A four-inch silicon wafer coated with 500 nm thermal silicon dioxide and 50 nm low-stress amorphous silicon nitride was used as a substrate for nanopore chips. The SiNx was locally thinned to 8–10 nm (∼2 μm circular wells) by reactive ion etching (RIE), followed by wet etching with buffered hydrofluoric acid (HF) etching to remove the SiO2. Following the procedure described elsewhere, the etched SiNx acted as a hard mask for subsequent anisotropic Si etching in KOH (33% m/v).46
Nanopore devices were cleaned in a hot 2:1 solution of H2SO4/H2O2 to make them hydrophilic and subsequently glued using EcoFlex 5 (smooth-on) onto a custom-made Teflon insert, immersed in buffer (1× PBS containing 400 mM NaCl, pH 7.4), and placed in a Teflon cell. The buffer was filtered using a 20 nm syringe filter before use. Nanopores were drilled in the thinned SiNx regions either using a dielectric breakdown or by laser drilling, as described previously.47,48 After drilling, the cis chamber buffer was changed to the “translocation buffer” (1× PBS containing 400 mM NaCl, 175 μM SDS, pH 7.4) and the open pore current was monitored for 5–10 min. If the pore remained stable, about 1 μL of the analyte was added to the cis chamber in each experiment.
Data Acquisition and Analysis
Before adding the sample to the nanopore’s cis chamber, a stable open-pore current was obtained by setting the bias voltage to V = 100–200 mV. The next step proceeded once a steady ionic flow and minimum noise were obtained in the nanopore device. An Axon 200B patch-clamp amplifier was used to monitor the translocation events through the nanopore, filtered with a 100 kHz low pass filter, and acquired using a custom LabVIEW program. Another LabVIEW program was used for the initial data analysis. The program identifies each event and provides information on the current blockage (ΔI), the dwell-time (tD), and the time of arrival of the event (ta) according to an electrical threshold. After obtaining ΔI and tD for each event, the ECD was calculated for each event, i.e., (ΔI × tD). The histogram plots of the ECD consist of two clearly distinguishable peaks, which are fitted with the double Gaussian function (Figure S10). Both the peaks have different event densities. The main peak of the ECD is called the primary peak, and the other one is the secondary peak. The peak values of the fitted double Gaussian function are plotted in Figure 5 with the standard deviations. Further, the event under the main peak and the secondary peak were analyzed separately, and corresponding ΔI and tD were fitted using a single Gaussian and an exponential function, respectively, as shown in Figures S11 and S12. The fitting values are plotted in Figure 5.
Acknowledgments
We thank Dr. Yulia Marom and Dr. Yana Rozevsky for their assistance in the fabrication of nanopore devices and Ms. Karawan Halabi and Mr. Jostine Joby for assistance in nanopore drilling. This project has received funding from the European Research Council (ERC) No. 833399 (NanoProt-ID) and ERC-PoC No. 966824 (OptiPore), both under the European Union’s Horizon 2020 research and innovation program grant agreements. S.O. is supported by the Azrieli Fellowship Foundation.
Supporting Information Available
The Supporting Information is available free of charge at https://pubs.acs.org/doi/10.1021/acsnano.2c05391.
Supplementary figures of additional protein translocation data, event rate, representative raw translocation data, ECD values for alpha-lactalbumin as a function of nanopore sizes, additional scatter plots and dwell-time histograms, nanopore characterizations, time-resolved fluorescence as a function of SDS concentration and tables of fluorescence lifetime fit values, ECD, and dwell-time mean values (PDF)
Author Present Address
# The WYSS Institute, Harvard University, Boston, Massachusetts 02115, United States
Author Contributions
N.S. performed nanopore measurements and analyzed data, N.F. performed bulk analysis and analyzed data, S.O. performed experiments, D.H. prepared protein samples, and A.M. designed and supervised the research. All authors co-wrote the manuscript.
The authors declare no competing financial interest.
Supplementary Material
References
- Deamer D.; Akeson M.; Branton D. Three Decades of Nanopore Sequencing. Nat. Biotechnol. 2016, 34 (5), 518–524. 10.1038/nbt.3423. [DOI] [PMC free article] [PubMed] [Google Scholar]
- Xue L.; Yamazaki H.; Ren R.; Wanunu M.; Ivanov A. P.; Edel J. B. Solid-State Nanopore Sensors. Nat. Rev. Mater. 2020, 5 (12), 931–951. 10.1038/s41578-020-0229-6. [DOI] [Google Scholar]
- Nir I.; Huttner D.; Meller A. Direct Sensing and Discrimination among Ubiquitin and Ubiquitin Chains Using Solid-State Nanopores. Biophys. J. 2015, 108 (9), 2340–2349. 10.1016/j.bpj.2015.03.025. [DOI] [PMC free article] [PubMed] [Google Scholar]
- Schmid S.; Stömmer P.; Dietz H.; Dekker C. Nanopore Electro-Osmotic Trap for the Label-Free Study of Single Proteins and Their Conformations. Nat. Nanotechnol. 2021, 16 (11), 1244–1250. 10.1038/s41565-021-00958-5. [DOI] [PubMed] [Google Scholar]
- Waduge P.; Hu R.; Bandarkar P.; Yamazaki H.; Cressiot B.; Zhao Q.; Whitford P. C.; Wanunu M. Nanopore-Based Measurements of Protein Size, Fluctuations, and Conformational Changes. ACS Nano 2017, 11 (6), 5706–5716. 10.1021/acsnano.7b01212. [DOI] [PubMed] [Google Scholar]
- Yusko E. C.; Bruhn B. R.; Eggenberger O. M.; Houghtaling J.; Rollings R. C.; Walsh N. C.; Nandivada S.; Pindrus M.; Hall A. R.; Sept D.; Li J.; Kalonia D. S.; Mayer M. Real-Time Shape Approximation and Fingerprinting of Single Proteins Using a Nanopore. Nat. Nanotechnol. 2017, 12 (4), 360–367. 10.1038/nnano.2016.267. [DOI] [PubMed] [Google Scholar]
- He L.; Tessier D. R.; Briggs K.; Tsangaris M.; Charron M.; McConnell E. M.; Lomovtsev D.; Tabard-Cossa V. Digital Immunoassay for Biomarker Concentration Quantification Using Solid-State Nanopores. Nat. Commun. 2021, 12 (1), 1–11. 10.1038/s41467-021-25566-8. [DOI] [PMC free article] [PubMed] [Google Scholar]
- Rozevsky Y.; Gilboa T.; Van Kooten X. F.; Kobelt D.; Huttner D.; Stein U.; Meller A. Quantification of MRNA Expression Using Single-Molecule Nanopore Sensing. ACS Nano 2020, 14 (10), 13964–13974. 10.1021/acsnano.0c06375. [DOI] [PMC free article] [PubMed] [Google Scholar]
- Gilboa T.; Torfstein C.; Juhasz M.; Grunwald A.; Ebenstein Y.; Weinhold E.; Meller A. Single-Molecule DNA Methylation Quantification Using Electro-Optical Sensing in Solid-State Nanopores. ACS Nano 2016, 10 (9), 8861–8870. 10.1021/acsnano.6b04748. [DOI] [PubMed] [Google Scholar]
- Burck N.; Gilboa T.; Gadi A.; Patkin Nehrer M.; Schneider R. J.; Meller A. Nanopore Identification of Single Nucleotide Mutations in Circulating Tumor DNA by Multiplexed Ligation. Clin. Chem. 2021, 10, 1–10. 10.1093/clinchem/hvaa328. [DOI] [PMC free article] [PubMed] [Google Scholar]
- van Kooten X. F.; Rozevsky Y.; Marom Y.; Ben Sadeh E.; Meller A. Purely Electrical SARS-CoV-2 Sensing Based on Single-Molecule Counting. Nanoscale 2022, 14 (13), 4977–4986. 10.1039/D1NR07787B. [DOI] [PMC free article] [PubMed] [Google Scholar]
- Alfaro J. A.; Bohländer P.; Dai M.; Filius M.; Howard C. J.; van Kooten X. F.; Ohayon S.; Pomorski A.; Schmid S.; Aksimentiev A.; Anslyn E. V.; Bedran G.; Cao C.; Chinappi M.; Coyaud E.; Dekker C.; Dittmar G.; Drachman N.; Eelkema R.; Goodlett D.; Hentz S.; Kalathiya U.; Kelleher N. L.; Kelly R. T.; Kelman Z.; Kim S. H.; Kuster B.; Rodriguez-Larrea D.; Lindsay S.; Maglia G.; Marcotte E. M.; Marino J. P.; Masselon C.; Mayer M.; Samaras P.; Sarthak K.; Sepiashvili L.; Stein D.; Wanunu M.; Wilhelm M.; Yin P.; Meller A.; Joo C. The Emerging Landscape of Single-Molecule Protein Sequencing Technologies. Nat. Methods 2021, 18 (6), 604–617. 10.1038/s41592-021-01143-1. [DOI] [PMC free article] [PubMed] [Google Scholar]
- Ouldali H.; Sarthak K.; Ensslen T.; Piguet F.; Manivet P.; Pelta J.; Behrends J. C.; Aksimentiev A.; Oukhaled A. Electrical Recognition of the Twenty Proteinogenic Amino Acids Using an Aerolysin Nanopore. Nat. Biotechnol. 2020, 38 (2), 176–181. 10.1038/s41587-019-0345-2. [DOI] [PMC free article] [PubMed] [Google Scholar]
- Rodriguez-Larrea D.; Bayley H. Multistep Protein Unfolding during Nanopore Translocation. Nat. Nanotechnol. 2013, 8 (4), 288–295. 10.1038/nnano.2013.22. [DOI] [PMC free article] [PubMed] [Google Scholar]
- Nivala J.; Marks D. B.; Akeson M. Unfoldase-Mediated Protein Translocation through an α-Hemolysin Nanopore. Nat. Biotechnol. 2013, 31 (3), 247–250. 10.1038/nbt.2503. [DOI] [PMC free article] [PubMed] [Google Scholar]
- Kennedy E.; Dong Z.; Tennant C.; Timp G. Reading the Primary Structure of a Protein with 0.07 Nm 3 Resolution Using a Subnanometre-Diameter Pore. Nat. Nanotechnol. 2016, 11 (11), 968–976. 10.1038/nnano.2016.120. [DOI] [PubMed] [Google Scholar]
- Brinkerhoff H.; Kang A. S. W.; Liu J.; Aksimentiev A.; Dekker C. Multiple Rereads of Single Proteins at Single-Amino Acid Resolution Using Nanopores. Science (80-.) 2021, 374 (6574), 1509–1513. 10.1126/science.abl4381. [DOI] [PMC free article] [PubMed] [Google Scholar]
- Zhang S.; Huang G.; Versloot R. C. A.; Bruininks B. M. H.; de Souza P. C. T.; Marrink S. J.; Maglia G. Bottom-up Fabrication of a Proteasome–Nanopore That Unravels and Processes Single Proteins. Nat. Chem. 2021, 13 (12), 1192–1199. 10.1038/s41557-021-00824-w. [DOI] [PMC free article] [PubMed] [Google Scholar]
- Hu Z. L.; Huo M. Z.; Ying Y. L.; Long Y. T. Biological Nanopore Approach for Single-Molecule Protein Sequencing. Angew. Chemie - Int. Ed. 2021, 60 (27), 14738–14749. 10.1002/anie.202013462. [DOI] [PubMed] [Google Scholar]
- Yan S.; Zhang J.; Wang Y.; Guo W.; Zhang S.; Liu Y.; Cao J.; Wang Y.; Wang L.; Ma F.; Zhang P.; Chen H. Y.; Huang S. Single Molecule Ratcheting Motion of Peptides in a Mycobacterium Smegmatis Porin A (MspA) Nanopore. Nano Lett. 2021, 21 (15), 6703–6710. 10.1021/acs.nanolett.1c02371. [DOI] [PubMed] [Google Scholar]
- Afshar Bakshloo M.; Kasianowicz J. J.; Pastoriza-Gallego M.; Mathé J.; Daniel R.; Piguet F.; Oukhaled A. Nanopore-Based Protein Identification. J. Am. Chem. Soc. 2022, 144 (6), 2716–2725. 10.1021/jacs.1c11758. [DOI] [PubMed] [Google Scholar]
- Oukhaled A.; Cressiot B.; Bacri L.; Pastoriza-Gallego M.; Betton J. M.; Bourhis E.; Jede R.; Gierak J.; Auvray L.; Pelta J. Dynamics of Completely Unfolded and Native Proteins through Solid-State Nanopores as a Function of Electric Driving Force. ACS Nano 2011, 5 (5), 3628–3638. 10.1021/nn1034795. [DOI] [PubMed] [Google Scholar]
- Lucas F. L. R.; Versloot R. C. A.; Yakovlieva L.; Walvoort M. T. C.; Maglia G. Protein Identification by Nanopore Peptide Profiling. Nat. Commun. 2021, 12 (1), 1–9. 10.1038/s41467-021-26046-9. [DOI] [PMC free article] [PubMed] [Google Scholar]
- Ohayon S.; Girsault A.; Nasser M.; Shen-Orr S.; Meller A.. Simulation of Single-Protein Nanopore Sensing Shows Feasibility for Whole-Proteome Identification. PLoS Comput. Biol. 2019, 15 ( (5), ), 10.1371/journal.pcbi.1007067. [DOI] [PMC free article] [PubMed] [Google Scholar]
- Talaga D. S.; Li J. Single-Molecule Protein Unfolding in Solid State Nanopores. J. Am. Chem. Soc. 2009, 131 (26), 9287–9297. 10.1021/ja901088b. [DOI] [PMC free article] [PubMed] [Google Scholar]
- Fologea D.; Ledden B.; McNabb D. S.; Li J. Electrical Characterization of Protein Molecules by a Solid-State Nanopore. Appl. Phys. Lett. 2007, 91 (5), 053901. 10.1063/1.2767206. [DOI] [PMC free article] [PubMed] [Google Scholar]
- Freedman K. J.; Haq S. R.; Edel J. B.; Jemth P.; Kim M. J. Single Molecule Unfolding and Stretching of Protein Domains inside a Solid-State Nanopore by Electric Field. Sci. Rep. 2013, 3 (1), 1–8. 10.1038/srep01638. [DOI] [PMC free article] [PubMed] [Google Scholar]
- Cressiot B.; Oukhaled A.; Patriarche G.; Pastoriza-Gallego M.; Betton J. M.; Auvray L.; Muthukumar M.; Bacri L.; Pelta J. Protein Transport through a Narrow Solid-State Nanopore at High Voltage: Experiments and Theory. ACS Nano 2012, 6 (7), 6236–6243. 10.1021/nn301672g. [DOI] [PubMed] [Google Scholar]
- Freedman K. J.; Jürgens M.; Prabhu A.; Ahn C. W.; Jemth P.; Edel J. B.; Kim M. J. Chemical, Thermal, and Electric Field Induced Unfolding of Single Protein Molecules Studied Using Nanopores. Anal. Chem. 2011, 83 (13), 5137–5144. 10.1021/ac2001725. [DOI] [PubMed] [Google Scholar]
- Winogradoff D.; John S.; Aksimentiev A. Protein Unfolding by SDS: The Microscopic Mechanisms and the Properties of the SDS-Protein Assembly. Nanoscale 2020, 12 (9), 5422–5434. 10.1039/C9NR09135A. [DOI] [PMC free article] [PubMed] [Google Scholar]
- Bhuyan A. K. On the Mechanism of SDS-Induced Protein Denaturation. Biopolymers 2010, 93 (2), 186–199. 10.1002/bip.21318. [DOI] [PubMed] [Google Scholar]
- Guo X. H.; Chen S. H. The Structure and Thermodynamics of Protein-SDS Complexes in Solution and the Mechanism of Their Transports in Gel Electrophoresis Process. Chem. Phys. 1990, 149 (1–2), 129–139. 10.1016/0301-0104(90)80134-J. [DOI] [Google Scholar]
- Restrepo-Pérez L.; John S.; Aksimentiev A.; Joo C.; Dekker C. SDS-Assisted Protein Transport through Solid-State Nanopores. Nanoscale 2017, 9 (32), 11685–11693. 10.1039/C7NR02450A. [DOI] [PMC free article] [PubMed] [Google Scholar]
- Wanunu M.; Sutin J.; McNally B.; Chow A.; Meller A. DNA Translocation Governed by Interactions with Solid-State Nanopores. Biophys. J. 2008, 95 (10), 4716–4725. 10.1529/biophysj.108.140475. [DOI] [PMC free article] [PubMed] [Google Scholar]
- Reynolds J. A.; Tanford C. The Gross Conformation of Protein-Sodium Dodecyl Sulfate Complexes. J. Biol. Chem. 1970, 245 (19), 5161–5165. 10.1016/S0021-9258(18)62831-5. [DOI] [PubMed] [Google Scholar]
- Thongngam M.; McClements D. J. Influence of PH, Ionic Strength, and Temperature on Self-Association and Interactions of Sodium Dodecyl Sulfate in the Absence and Presence of Chitosan. Langmuir 2005, 21 (1), 79–86. 10.1021/la048711o. [DOI] [PubMed] [Google Scholar]
- Eggenberger O. M.; Ying C.; Mayer M. Surface Coatings for Solid-State Nanopores. Nanoscale 2019, 11 (42), 19636–19657. 10.1039/C9NR05367K. [DOI] [PubMed] [Google Scholar]
- Fologea D.; Gershow M.; Ledden B.; McNabb D. S.; Golovchenko J. A.; Li J. Detecting Single Stranded DNA with a Solid State Nanopore. Nano Lett. 2005, 5 (10), 1905–1909. 10.1021/nl051199m. [DOI] [PMC free article] [PubMed] [Google Scholar]
- Fologea D.; Uplinger J.; Thomas B.; McNabb D. S.; Li J. Slowing DNA Translocation in a Solid-State Nanopore. Nano Lett. 2005, 5 (9), 1734–1737. 10.1021/nl051063o. [DOI] [PMC free article] [PubMed] [Google Scholar]
- Larkin J.; Henley R. Y.; Muthukumar M.; Rosenstein J. K.; Wanunu M. High-Bandwidth Protein Analysis Using Solid-State Nanopores. Biophys. J. 2014, 106 (3), 696–704. 10.1016/j.bpj.2013.12.025. [DOI] [PMC free article] [PubMed] [Google Scholar]
- Restrepo-Pérez L.; Joo C.; Dekker C. Paving the Way to Single-Molecule Protein Sequencing. Nat. Nanotechnol. 2018, 13 (9), 786–796. 10.1038/s41565-018-0236-6. [DOI] [PubMed] [Google Scholar]
- Melnikov D. V.; Hulings Z. K.; Gracheva M. E. Electro-Osmotic Flow through Nanopores in Thin and Ultrathin Membranes. Phys. Rev. E 2017, 95 (6), 063105. 10.1103/PhysRevE.95.063105. [DOI] [PubMed] [Google Scholar]
- Zhang Y.; Zhao J.; Si W.; Kan Y.; Xu Z.; Sha J.; Chen Y. Electroosmotic Facilitated Protein Capture and Transport through Solid-State Nanopores with Diameter Larger than Length. Small Methods 2020, 4 (11), 1900893. 10.1002/smtd.201900893. [DOI] [Google Scholar]
- Wanunu M.; Morrison W.; Rabin Y.; Grosberg A. Y.; Meller A. Electrostatic Focusing of Unlabelled DNA into Nanoscale Pores Using a Salt Gradient. Nat. Nanotechnol. 2010, 5 (2), 160–165. 10.1038/nnano.2009.379. [DOI] [PMC free article] [PubMed] [Google Scholar]
- Wang R.; Gilboa T.; Song J.; Huttner D.; Grinstaff M. W.; Meller A. Single-Molecule Discrimination of Labeled DNAs and Polypeptides Using Photoluminescent-Free TiO2 Nanopores. ACS Nano 2018, 12 (11), 11648–11656. 10.1021/acsnano.8b07055. [DOI] [PubMed] [Google Scholar]
- Squires A.; Atas E.; Meller A. Nanopore Sensing of Individual Transcription Factors Bound to DNA. Sci. Rep. 2015, 5 (1), 1–11. 10.1038/srep11643. [DOI] [PMC free article] [PubMed] [Google Scholar]
- Zrehen A.; Gilboa T.; Meller A. Real-Time Visualization and Sub-Diffraction Limit Localization of Nanometer-Scale Pore Formation by Dielectric Breakdown. Nanoscale 2017, 9 (42), 16437–16445. 10.1039/C7NR02629C. [DOI] [PubMed] [Google Scholar]
- Zvuloni E.; Zrehen A.; Gilboa T.; Meller A. Fast and Deterministic Fabrication of Sub-5 Nanometer Solid-State Pores by Feedback-Controlled Laser Processing. ACS Nano 2021, 15 (7), 12189–12200. 10.1021/acsnano.1c03773. [DOI] [PMC free article] [PubMed] [Google Scholar]
Associated Data
This section collects any data citations, data availability statements, or supplementary materials included in this article.