Abstract
Collagen is the most abundant secreted protein in vertebrates and persists throughout life without renewal. The permanency of collagen networks contrasts with continued collagen synthesis throughout adulthood and with conventional transcriptional/translational homeostatic mechanisms that replace damaged proteins with new copies. Here we show circadian clock regulation of ER-to-plasma membrane procollagen transport by sequential rhythmic expression of SEC61, TANGO1, PDE4D and VPS33B. The result is nocturnal procollagen synthesis and daytime collagen fibril assembly in mice. Rhythmic collagen degradation by CTSK maintains collagen homeostasis. This circadian cycle of collagen synthesis and degradation affects a pool of newly-synthesised collagen whilst maintaining the persistent collagen network. Disabling the circadian clock causes abnormal collagen fibrils and collagen accumulation which is reduced in vitro by NR1D1 and CRY1/2 agonists SR9009 and KL001, respectively. In conclusion, our study has identified a circadian clock mechanism of protein homeostasis wherein a sacrificial pool of collagen maintains tissue function.
Keywords: Circadian rhythm, collagen, extracellular matrix, fibroblasts, homeostasis, protein trafficking, rhythmic, secretion, translation, translocon
One-third of the eukaryote proteome enters the secretory pathway1, including the collagens that assemble into centimetre-long fibrils in the extracellular matrix (ECM) 2. The fibrils account for one-third of the mass of vertebrates3 and are sites of attachment for a wide range of macromolecules including integrins, making them essential for metazoan development3. A remarkable feature of collagen fibrils is that they are formed during embryogenesis 4 and remain without turnover for the life of the animal 5–8. This has led to the notion that collagen fibrils are static and unchanging. However, the difficulty with zero-turnover is that it does not explain the absence of fatigue failure, which would be expected in the face of lifelong cyclic loading. In contrast to the evidence of zero replacement, fibroblasts synthesise collagen in response to mechanical loading 9, and microdialysis of human Achilles tendon shows elevated levels of the C-propeptides of procollagen-I (PC-I, the precursor of collagen-I) after moderate exercise 10.
These opposing observations led to the alternative hypothesis presented in this study, in which zero turnover and continued synthesis can co-exist. We hypothesised that a pool of ‘persistent’ collagen co-exists with a pool of ‘sacrificial’ collagen, in which the latter is synthesised and removed on a daily basis under the control of the circadian clock. Support for this alternative hypothesis comes from observations of a circadian oscillation in the serum concentrations of the C-propeptides of PC-I 11 and of collagen degradation products in bone 12. However, despite physiological and clinical observations, direct mechanistic support for these observations was lacking. Whilst the suprachiasmatic nucleus of the hypothalamus is the master circadian pacemaker, almost all tissues have self-sustaining circadian pacemakers that synchronise rhythmic tissue-specific gene expression in anticipation of environmental light and dark cycles 13. Disruption of the circadian clock leads to musculoskeletal abnormalities e.g. chondrocyte-specific disruption of the circadian clock resulted in progressive degeneration of articular cartilage 14 and fibrosis in intervertebral disc 15, and mice with a global knockout (KO) of Bmal1 16 or the ClockΔ19 mutation 17 develop thickened and calcified tendons with associated immobilization. These observations were indicative of circadian control of ECM homeostasis.
Here, we performed time series electron microscopy, transcriptomics and proteomics over day/night cycles, which showed that the synthesis and transport of PC-I by the protein secretory pathway in fibroblasts is regulated by the circadian clock. We showed that SEC61, TANGO1, PDE4D and VPS33B regulate collagen secretion, are 24-hour rhythmic, and are located at the entry and exit points of the endoplasmic reticulum (ER), Golgi and post-Golgi compartments, respectively. CTSK is a collagen-degrading proteinase that is rhythmic in-phase with collagen degradation to maintain collagen homeostasis. The result is nocturnal PC-I synthesis and a daily wave of collagen-I with no net change in total collagen content of the tissue. Crucially, we discovered that arrhythmic ClockΔ19 and Scleraxis-Cre-dependent Bmal1 deletion mutant mice accumulate collagen and have a disorganised and structurally abnormal collagen matrix that is mechanically abnormal. Finally, we showed that ClockΔ19 fibroblasts in vitro amass collagen fibres compared to control cells, and, treatment of ClockΔ19 fibroblasts with the NR1D1 agonist SR900918 or the CRY1/2 agonist KL001 19 reduced collagen fibre number. Wild type fibroblasts treated with KL001 lose their circadian rhythm and generate fewer collagen fibres. Together, these results provide insights into the importance of the circadian clock in maintaining collagen homeostasis.
Results
Collagen fibril network in tendon follows a rhythmic pattern during 24 hours
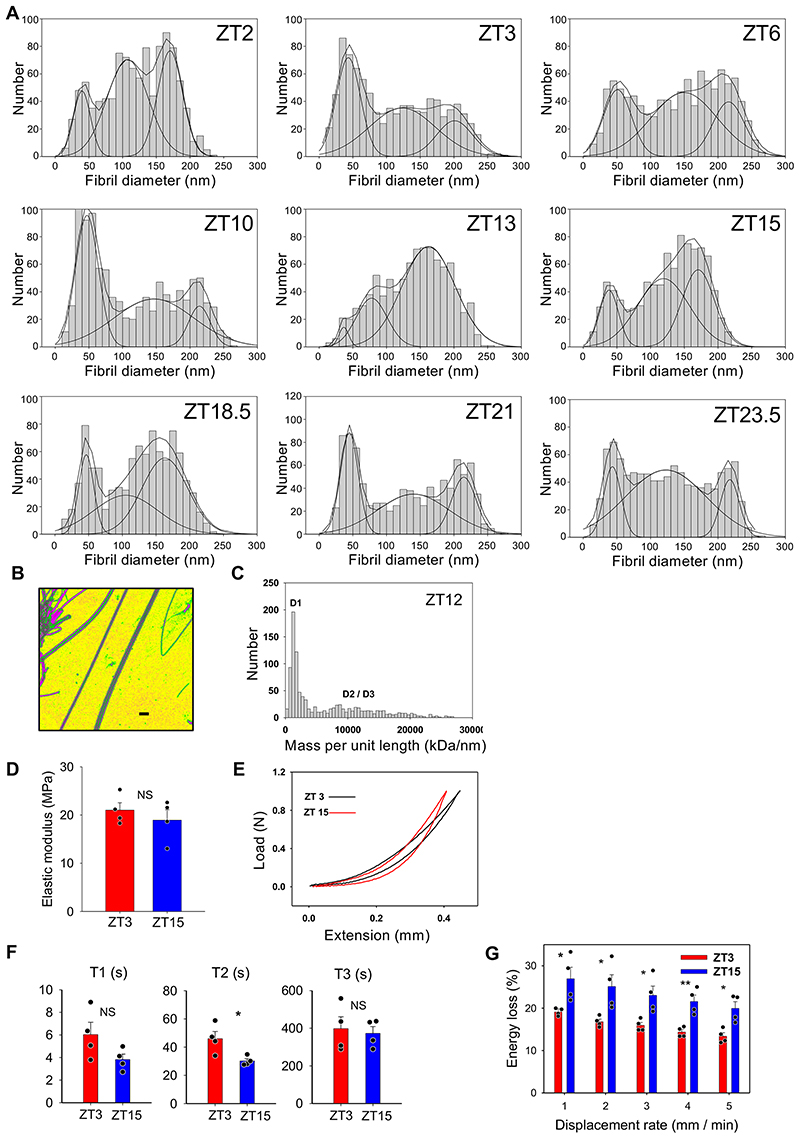
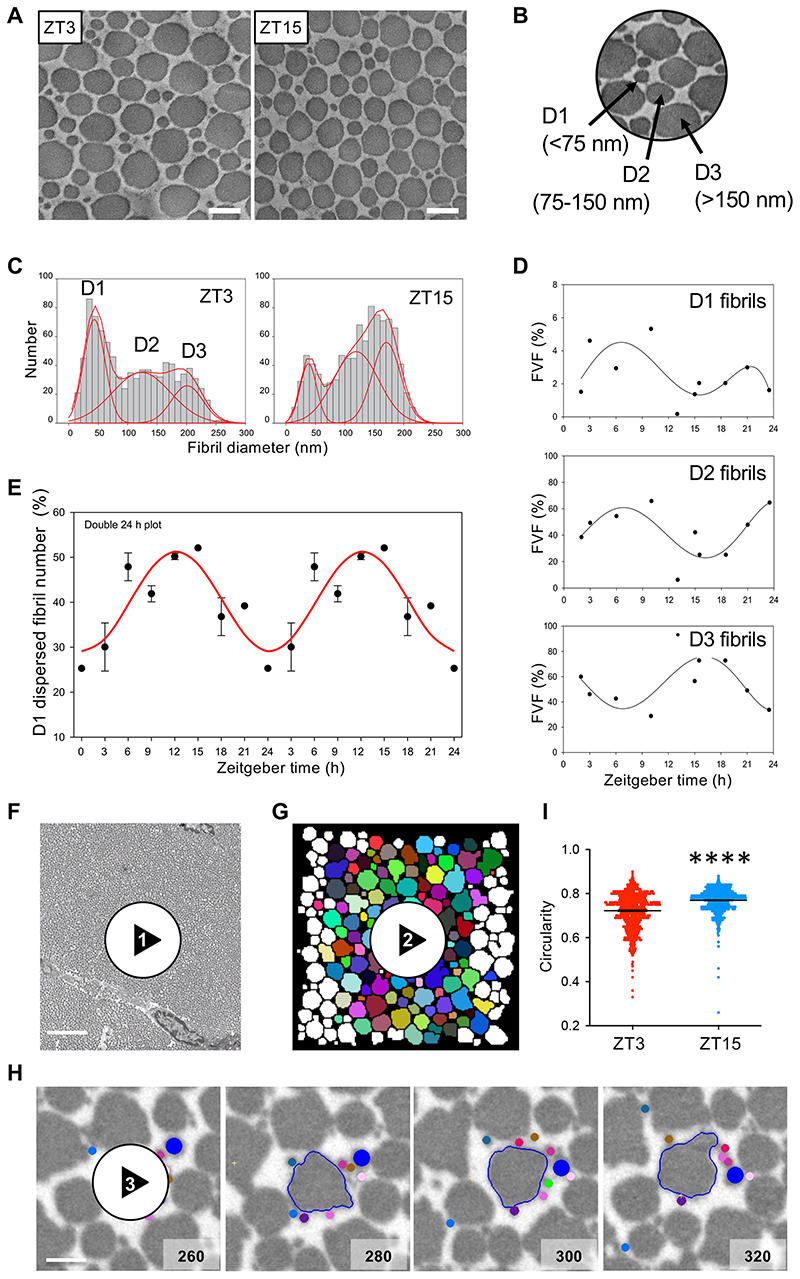
Tendon is a peripheral circadian clock tissue 17 and contains collagen fibrils that are amenable to electron microscope study. Time-series transmission electron microscopy (TEM) of wild-type C57/BL6 mice showed that the trimodal distribution of diameters (D1, <75 nm; D2, ~75-150 nm; and D3, >150 nm) varied with time of day (Figure 1A-C and Extended Data Figure 1A). The relative proportions of D1 and D2 fibrils were antiphase to that of D3 fibrils during 24 hours (Figure 1D). Thus, the distribution of collagen fibril diameters is rhythmic during 24 hours. Next, we mechanically dissociated tendons and performed time-series mass-mapping scanning transmission electron microscopy on the dispersed fibrils (Extended Data Figure 1B, C)20. The data showed an abundance of D1 fibrils when tendons were sampled at early night (Figure 1E), which corresponded to the time of day when levels of D3 fibrils were building up in undisrupted tendons. Thus, D3 fibrils can be separated into D1 fibrils by mechanical disruption. Next, we examined tendon tissue by serial block face-scanning electron microscopy (SBF-SEM) (Figure 1F). Stepping through the image stacks showed bundles of collagen fibrils in near parallel alignment with the long axis of the tendon (Video 1). Automated segmentation of the three-dimensional reconstructions showed that D2 and D3 fibrils maintained relative positions to each other (Figure 1G, Video 2) whereas D1 fibrils wrapped around and in-between D2 and D3 fibrils, and made contacts with different D2 and D3 fibrils (Figure 1H, Video 3). The tips of D1 fibrils were attached to the shafts of D3 fibrils, and D3 fibrils appeared to become loose and give rise to new D1 fibrils (Video 4). Fibrils sampled at ZT15 (zeitgeber time, 3 hours into darkness) had more circular outlines than those sampled at ZT3 (3 hours into light, Figure 1I). In further experiments we showed that tendons harvested at ZT15 exhibited more energy loss than those harvested at ZT3 independent of strain rate (Extended Data Figure 1D-G). Three distinct time constants were calculated from stress-relaxation curves, all of which were higher on average in ZT3 tendons than in ZT15 tendons (T2, in particular, was statistically significantly higher) (Extended Data Figure 1F), suggesting that mouse tendons relax more quickly at night.
Figure 1. Circadian regulation of the tendon collagen extracellular matrix.
(A) Representative transverse TEM images of Achilles tendon at ZT3 (n=1134 fibrils) and ZT15 (n=2262 fibrils) (n=6 mice.) Bars 200 nm. (B) Transverse section of Achilles tendon showing characteristic D1, D2 and D3 fibrils. (C) Shift in the trimodal distribution of fibril diameters at ZT3 and ZT15. (D) Changing fibril volume fractions of D1, D2 and D3 fibrils during 24 hours. (E) STEM mass mapping electron microscopy data from mechanically dispersed entire Achilles tendons (n=4 mice and 1000 D1 fibrils measured at each time point) showing the variation of the D1 fibril component at 3-hour time intervals during 24 hours. This is in the form of a double plot with the data repeated over 48 hours. The data were fitted by least squares minimization to a sinusoidal variation (red line). The grey panels indicate the night-time (dark) periods. (F) Still image from a step-through movie generated by serial block face-scanning electron microscopy of 6-week old mouse Achilles tendon harvested at CT3 (Supplementary Supplementary Video 1). Selected from n=12 reconstructions from 12 different mice. (G) Still from a step-through 3D reconstruction displaying individual fibrils in a small region of mouse tail tendon, showing merging of D1 fibrils onto larger D2 and D3 fibrils (Supplementary Video 2). Fibrils that appear in at least 80% of frames are coloured. Images generated from serial block face-scanning electron microscope stack of transverse TEM images. Area shown is 4 μm by 4 μm, each frame is a longitudinal step of 100 nm through the tendon. (H) Selected images from a serial block face-scanning electron microscope step-through movie stack with a D3 fibril (outlined) surrounded by a D2 (dark blue) fibril and nine D1 fibrils (shown in different colours). Cut numbers are shown. (I) Circularity of collagen fibrils examined in transverse TEM images of Achilles tendons from ZT3 and ZT15 indicate fibril cross sections from ZT3 are more irregular than fibril cross sections from ZT15 (n=1000 fibrils measured in both ZT3 and ZT15 samples ****p=2×10-48, two-tailed unpaired t-test. Bars = mean ± SEM. See also Source Data for Figure 1.
Rhythmic protein secretory pathway
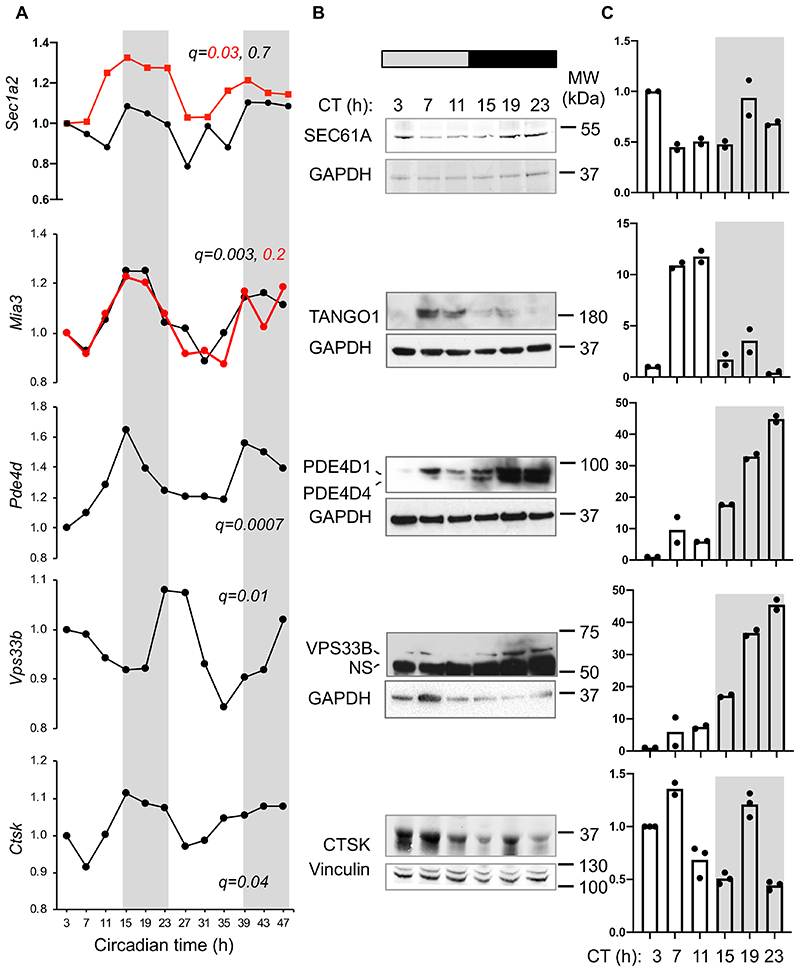
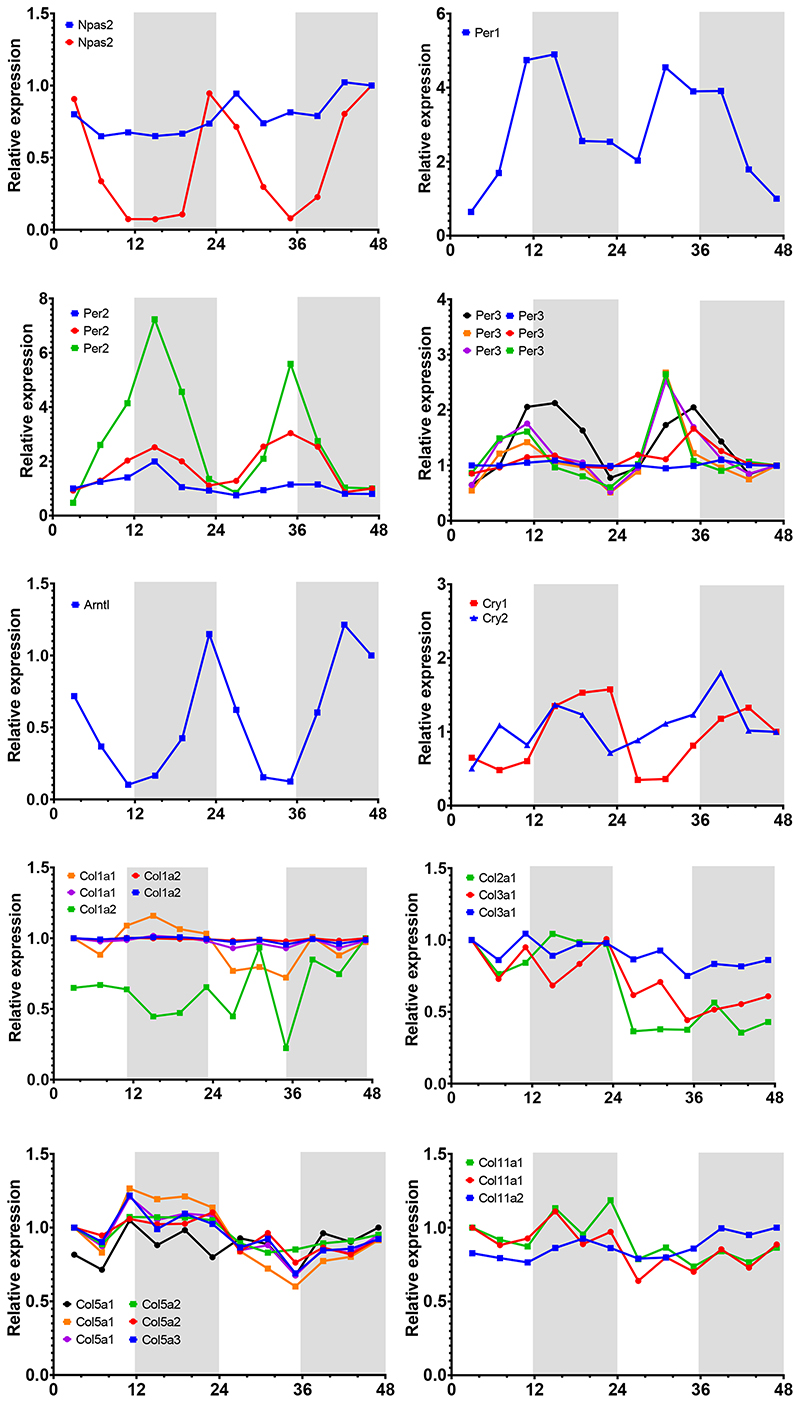
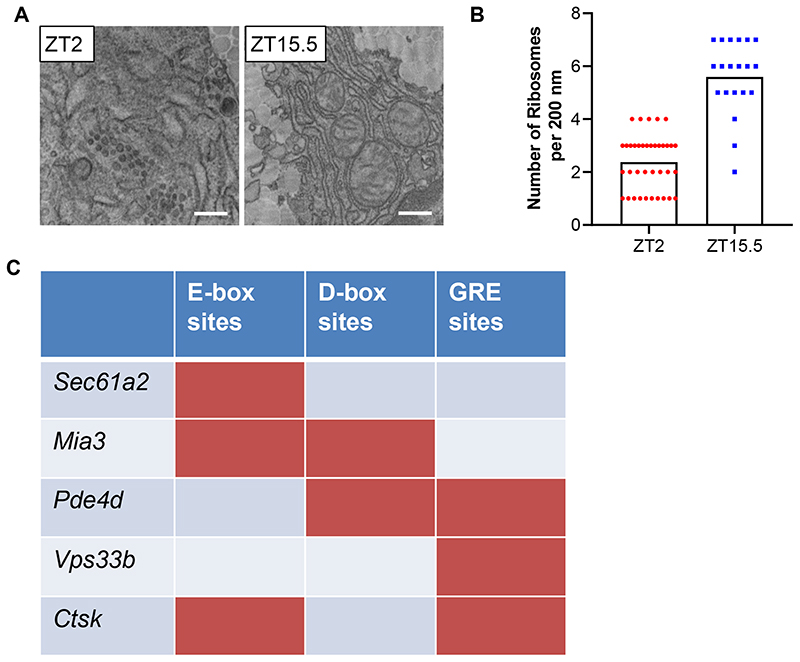
Time-series transcriptomic profiling of mouse tendon (Array Express Accession number E-MTAB-7743 and ref 17) showed circadian expression of core clock genes Npas2, Per1/2/3, Bmal1 (Arntl) and Cry1 but not fibrillar collagen genes (Extended Data Figure 2). Therefore, the diurnal behaviour of collagen fibrils could not be explained by rhythmic collagen gene transcription. However, previous studies in liver had revealed circadian clock regulation of ribosome binding of the Col1a1 transcripts 21. Here, we showed by electron microscopy that the packing of ribosomes along the ER differed between morning and night in mouse tendon fibroblasts in vivo, with greater occupancy at ZT15 than at ZT2 (Extended Data Figure 3A, B). This was a first indicator that circadian clock control of collagen homeostasis begins early in the secretory pathway by temporally regulating protein translation. Intriguingly, transcripts encoding several key secretory pathway proteins were conspicuously rhythmic (Figure 2A). These included: Sec61a2 (SEC61A2 is a core member of the translocon 22), Mia3 (which encodes TANGO1 with a proposed role in facilitating cargo loading at ER exit sites 23), Pde4d (PDE4D is functionally related to another phosphodiesterase, PDE7A1, which has been proposed to be important in regulating PC-I transport in COS7 cells 24), and Vps33b (VPS33B is important in collagen IV post-translational modification 25). The genes encoding these proteins are predicted to have binding sites in their promotor and upstream sequences for Ebox, D-box and GRE sites, as suggested by ConTra 26 (Extended Data Figure 3C). Time-series western blot analysis of mouse tendons showed that SEC61, TANGO1, PDE4D, and VPS33B are sequentially expressed during a circadian period and serially located within the secretory pathway in the direction of travel of procollagen i.e. translation into ER (SEC61, CT3), ER exit (TANGO1, CT7-11), Golgi (PDE4D, CT19), post-Golgi (VPS33B CT23), and turnover in the ECM (CTSK, CT3-7) (Figure 2B, C).
Figure 2. Rhythmic expression of genes regulating collagen trafficking and fibre assembly.
(A) Rhythmic expression of Sec61a2, Mia3, Pde4d, Vps33b and Ctsk mRNA. Transcripts were detected by microarray over a 48-h period (multiple probe sets are shown in black and red, if present); n = 2 mice. Metacycle analyses BHQ values are shown along each gene. (B) Western blot analyses of the corresponding tissue proteins assessed over a 24-h period. Levels of GAPDH or vinculin served as loading controls. (C) Densitometry analyses representative of n=2 western blots. CT, circadian time. NS, non-specific. See also Source Data for Figure 2 and Supplementary Information 1 for unprocessed western blots.
Circadian clock-synchronised cells in culture exhibit a rhythmic collagen matrix
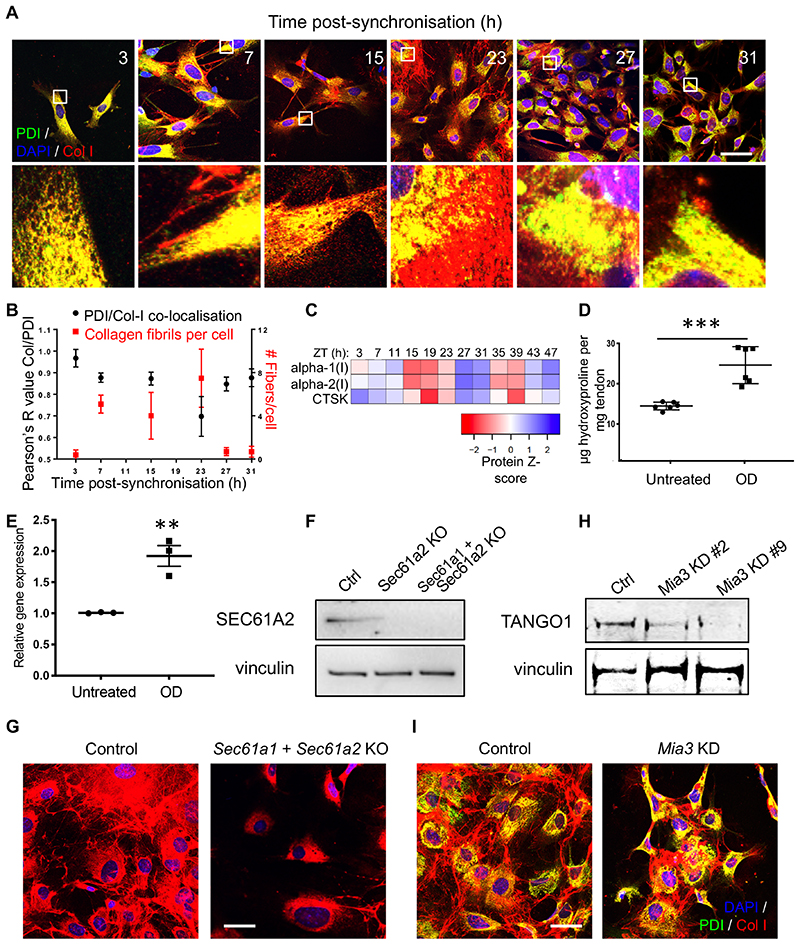
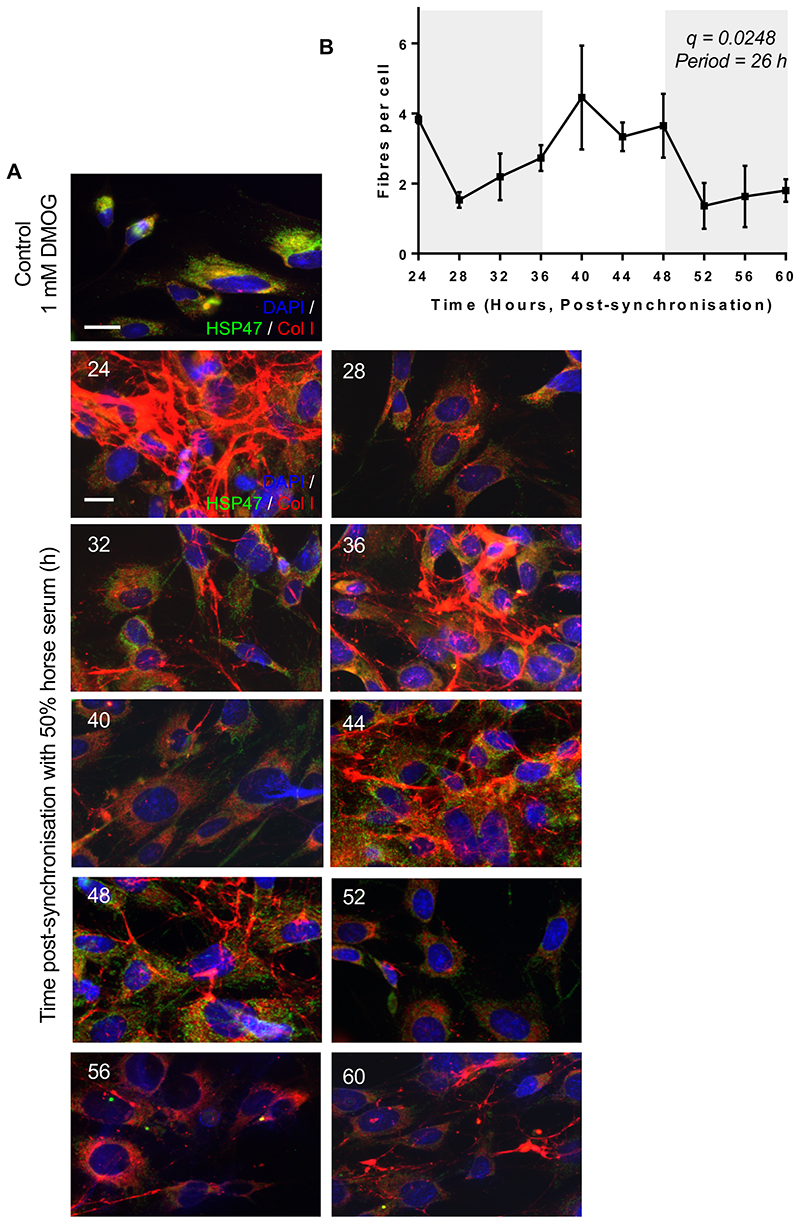
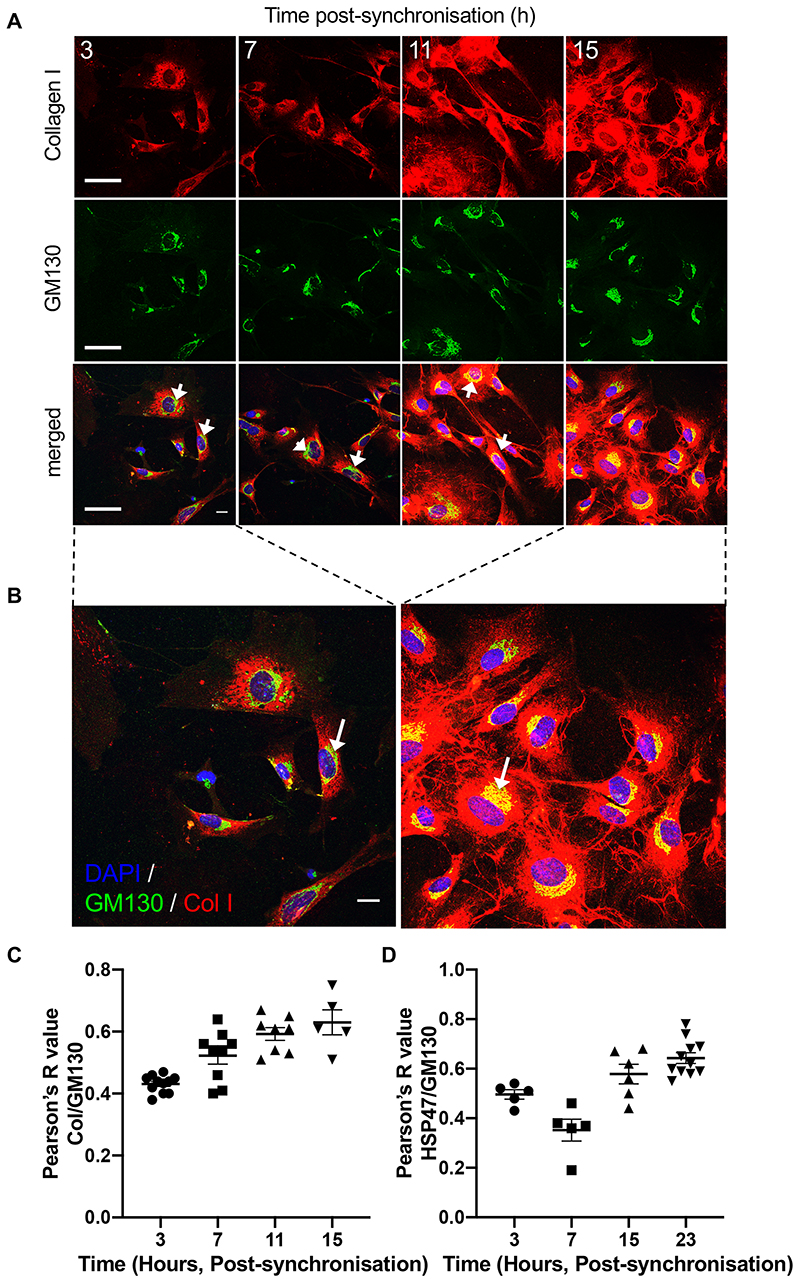
We used clock-synchronised cultured fibroblasts to evaluate the importance of Sec61a2, Tango1, Pde4d, Vps33b in collagen secretion and homeostasis. Using collagen I- and PDI- (ER-resident protein disulfide isomerase) specific antibodies, we showed that PC-I localises to the ER early after synchronisation (3 hours) and collagen fibres begin to appear 7-15 hours later (Figure 3A, B). The rhythmicity of collagen fibre assembly and disassembly continues for at least 3 days in culture (Extended Data Figure 4). Co-immunofluorescence studies using collagen I- and GM130-specific antibodies, showed a time-dependent localisation of PC-I in ERGIC/cis-Golgi compartments (Extended Data Figure 5). These experiments showed that a rhythmic secretory pathway was cell-intrinsic. Reduction in extracellular collagen at the end of the circadian cycle was indicative of a clock-regulated degradation step. We noted that the transcript encoding CTSK is 24-hour rhythmic. CTSK cleaves collagen 27 and its deficiency in pycnodysostosis results in accumulation of non-digested phagocytosed collagen in fibroblasts 28. Ctsk is transcriptionally and translationally rhythmic in tendon fibroblasts (Figure 2 and Figure 3C). Incubation of ex vivo tendons with odanacatib to inhibit CTSK resulted in collagen accumulation, as shown by hydroxyproline analysis (Figure 3D). Quantitative-PCR showed that odanacatib also led to increased expression of Col1a1 mRNA (Figure 3E) suggestive of a feedback mechanism between collagen turnover and transcription.
Figure 3. Circadian clock-regulated PC-I trafficking and collagen fibre assembly in culture.
(A) Time series immunofluorescence study using anti-collagen-I and anti-PDI-specific antibodies. Areas boxed in white are magnified in the lower panels. Representative images from each time point are shown, from three independent experiments. (B) Time-series co-localisation of collagen-I and PDI (black) and collagen fibres per cell (red), from (A) were quantified using multiple regions to assess co-localisation from 4 independent regions. Bars show mean ± SD. (C) Heat map from LC-tandem mass spectrometry analyses of protein expression showing CTSK and collagen α1(I) and collagen α2(I) oscillation over 48 hours (n = 4 biological replicates). (D) Increased hydroxyproline content of Achilles tendons dissected from mice and incubated with 1 μM odanacatib (OD) for 3 days, compared to control (n=6; ***p=0.0004, two-tailed unpaired t-test, mean and standard deviation are indicated). (E) Col1a1 mRNA expression in mouse tail tendon fibroblast incubated with OD (n=3 tendon samples, p=0.0055, two-tailed unpaired t-test). Bars show mean ± SEM. (F) Representative western blot analyses (n=2 biologically independent experiments) of CRISPR/Cas9 Sec61a2-knock out and Sec61a1/Sec61a2-double knock out MEFs (Sec61a2 KO, Sec61a1 + Sec61a2 KO). Levels of vinculin protein served as a loading control. (G) Immunofluorescence analysis of synchronised MEFs show that depletion of Sec61a1 and Sec61a2 prevent collagen-I fibre assembly in the extracellular matrix (n=6 independent tests each with similar results). (H) Representative western blot analysis of TANGO1 protein in MEFs treated with siRNA targeting Mia3. Levels of vinculin protein served as a loading control. (I) Immunofluorescence analysis of control and siMia3 cells shows collagen-I retention in the ER (PDI-staining) in cells with Mia3 knock-down (Mia3 KD). Staining of control cells show collagen-I fibres in the extracellular matrix (n=4 independent tests each with similar results). Bars 10 μm. See also Source Data for Figure 3 and Supplementary Information 2 for unprocessed western blots.
SEC61, TANGO1, PDE4D, and VPS33B are required for collagen fibre assembly
We used knockdown and knockout strategies combined with immunolocalisation fluorescence confocal microscopy to determine the requirement of these circadian clock regulated proteins in collagen fibre assembly.
SEC61
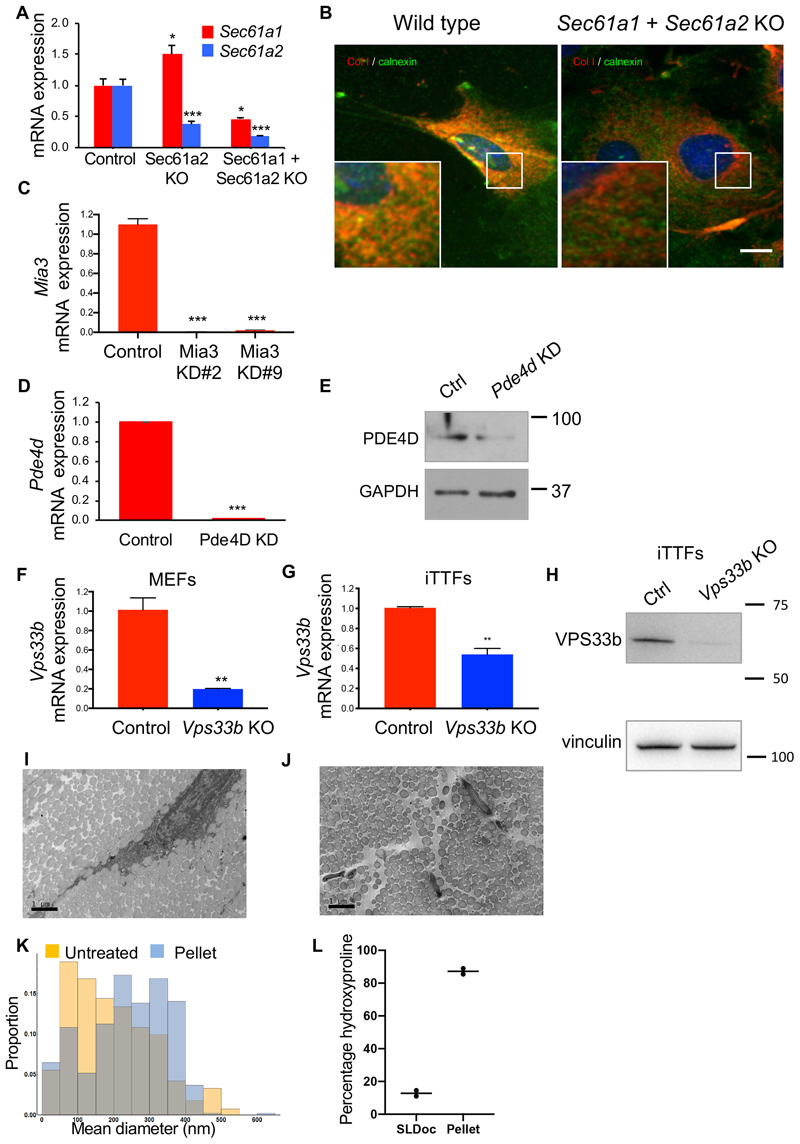
The mRNAs of Col1a1 and Col1a2 (which encode α1(I) and α2(I), respectively) have a 5’ UTR consisting of 2 stems flanked by a 5’ stem-loop that binds LARP6 and are specifically targeted to the SEC61 translocon 29. The protein-conduction pore of the translocon is formed from SEC61α which associates with a β and a γ subunit to form a heterotrimeric complex SEC61αβγ in eukaryotes 30,31. There are two Sec61a genes (Sec61a1 and Sec61a2), which encode SEC61α. CRISPR/Cas9-mediated knockout of Sec61a1 and Sec61a2 in MEFs (Figure 3F, Extended Data Figure 6A) resulted in markedly fewer collagen fibres (Figure 3G). In the absence of the SEC61 translocon, transcription from Col1a1 and Col1a2 would be expected to continue, which raised the question about the fate of the proα1(I) and proα2(I) polypeptide chains. Co-immunofluorescence using anti-collagen-I- and anti-calnexin-specific antibodies showed that collagen was translated into the cytosol in the absence of the SEC61 translocon (Extended Data Figure 6B).
TANGO1 has been suggested to corral COPII coats to accommodate PC-I 32. We showed that siRNA-mediated knockdown of Mia3/TANGO1 in MEFs (Figure 3H and Extended Data Figure 6C) resulted in fewer collagen fibres (Figure 3I). Knockdown of Mia3/TANGO1 resulted in co-localisation of PDI (ER-resident protein disulfide isomerase) and collagen-I in the absence of extracellular collagen fibres (Figure 3I).
PDE4D
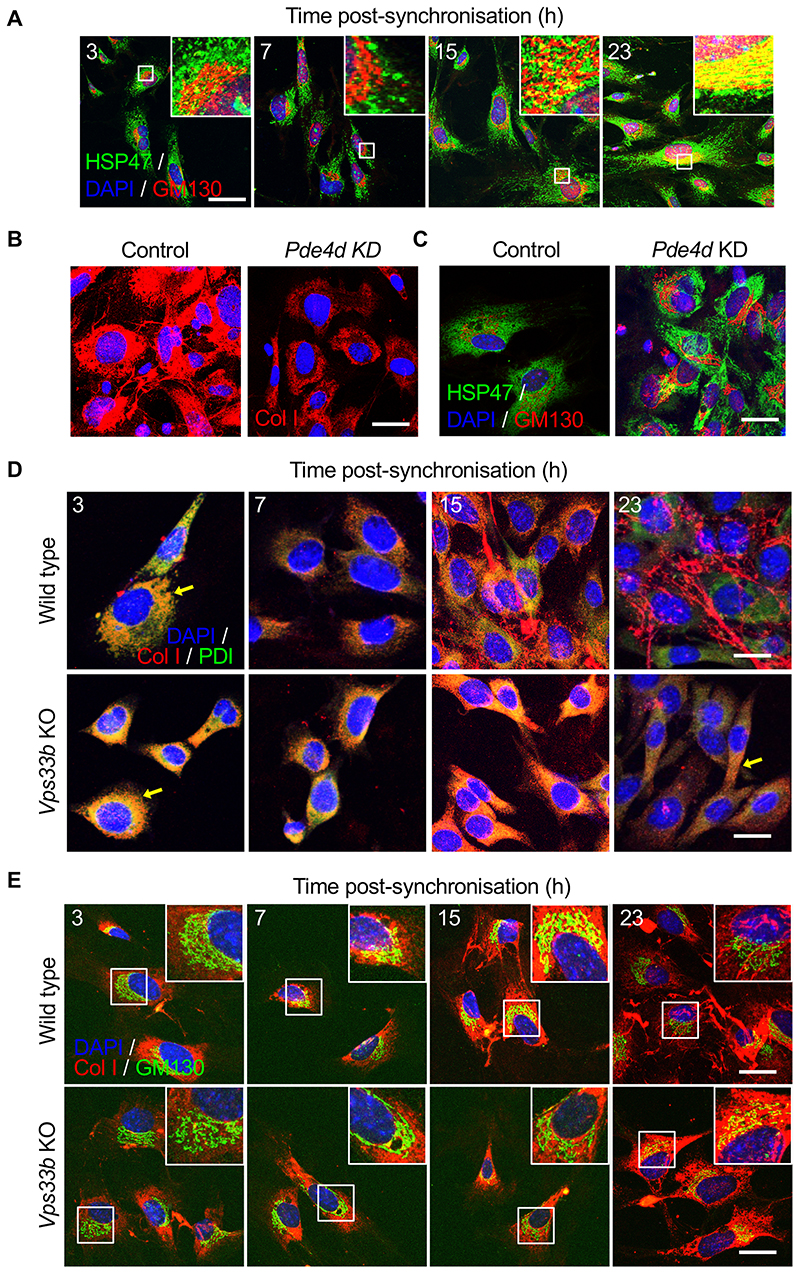
Previous studies in COS7 cells had shown that PDE7A1 regulates PKA-dependent retrograde transport of the KDELR in COS7 cells 24. HSP47 is an ER-resident molecular chaperone that contains a C-terminal KDEL signal and is required for procollagen secretion 33. Thus, we investigated if PDE4D regulated HSP47 transport. The results showed that HSP47 co-localised with GM130, mostly between 15- and 23-hours post-synchronisation (Figure 4A and Extended Data Figure 6D). RNAi was highly effective at reducing the levels of Pde4d mRNA in MEFs (Extended Data Figure 6D, E). Immunofluorescence using a collagen-I-specific antibody showed that Pde4d knockdown severely reduced the ability of cells to assemble collagen fibres and caused intracellular retention of PC-I, when compared to control cells (Figure 4B). In Pde4d KD cells, HSP47 showed poor co-localisation with GM130 (Figure 4C), indicative of a blockage of HSP47 transport.
Figure 4. Golgi and post-Golgi transport of PC-I is rhythmic.
(A) Immunofluorescence analysis of collagen chaperone HSP47, and ERGIC and the cis-Golgi (detected by marker GM130) in synchronised MEFs showed gradual co-localisation of HSP47 with GM130 (see insets), n=5. Quantification in Figure S6D. (B) Immunofluorescence analysis shows that PDE4D depletion in MEFs using siRNAs (Pde4d KD) blocked collagen-I secretion into the matrix, which was unaffected in control cells, n=3. (C) Immunofluorescence analysis of HSP47 in Pde4d KD cells show accumulation of HSP47 in GM130 compared to control MEFs, n=5. (D) Immunofluorescence analysis of synchronised iTTFs shows collagen-I secretion (white arrows) was inhibited in CRISPR-mediated Vps33b KO cells, where collagen-I was retained in the ER (PDI staining) (yellow arrows). N=4 biologically independent experiments. (E) Immunofluorescence analysis of synchronised MEFs also shows increased retention of collagen-I occurs in the Golgi (GM130 staining) when Vps33b was knocked out (see insets). N=2 biologically independent experiments. Bars 10 μm.
VPS33B
Recent studies suggest a role for VPS33B in the post-translational modification of collagen outside the ER 25. The transcript and protein for Vps33b peak at the end of the circadian cycle (Figure 2A-C). Thus, we used CRISPR-Cas9 to knockout Vps33b in MEFs (Extended Data Figure 6F) and immortalised tendon fibroblasts (iTTFs) (Extended Data Figure 6G, H), and used collagen-I-, PDI- and GM130-specific antibodies to observe transport of PC-I through the secretory pathway during the circadian cycle. In non-CRISPR treated cells, PC-I co-localised with PDI 3 hours after synchronisation (Figure 4D), with GM130 7-15 hours after synchronisation (Figure 4E), and assembled collagen fibrils between 15- and 23-hours post-synchronisation (Figure 4D, E). In contrast, PC-I colocalised with PDI throughout the circadian cycle, Also, whereas PC-I had transited through the Golgi by 23-hours post-synchronisation in control cells, PC-I co-localised with GM130 at 23-hours post-synchronisation in VPS33B knockout cells. Furthermore, numbers of collagen fibres were severely reduced in VPS33B knockout cells (Figure 4D, E).
A predictive mathematical model of the collagen secretory pathway
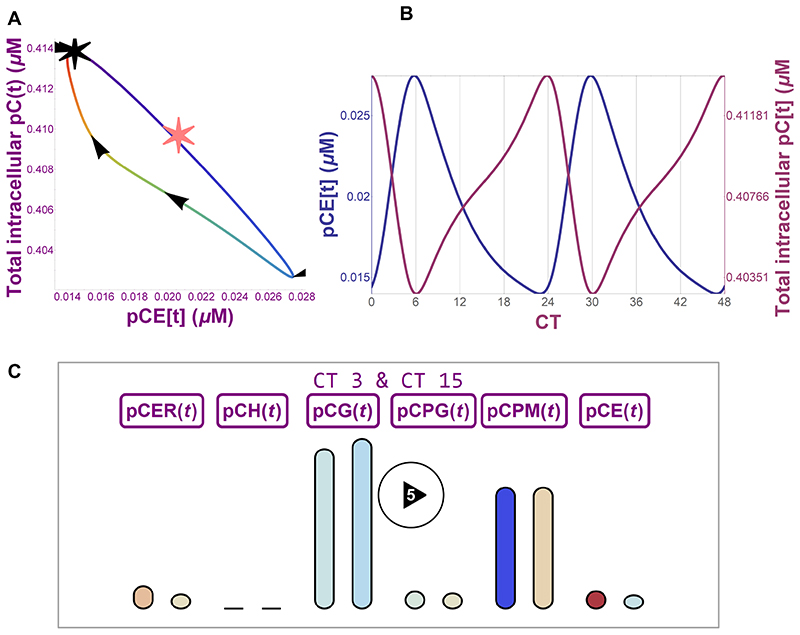
We used the above protein data, together with published data on mRNA transcriptional rates 34, to generate a predictive model of the transport of PC-I through the secretory pathway. We built a deterministic ordinary differential equation system based on the principles of mass-action enzyme kinetics, with variables representing cellular concentrations of collagen and relevant proteins in ER (translation via SEC61), ER exit sites (pathway progression controlled by TANGO1 and HSP47), Golgi (PDE4D directed transport of HSP47), post-Golgi secretion (pathway progression controlled by VPS33B) and collagen degradation (modelled on CTSK). Simulations and subsequent analysis were carried out using the differential equation solver NDSolve in Wolfram Mathematica 11.3. The simulation predicted that the relative amounts of PC-I in ER, ER exit sites, Golgi, post-Golgi compartments and the extracellular matrix varied depending on the circadian cycle (Figure 5A and Video 5). The model predicted low levels of PC-I throughout the circadian cycle in ER exit sites (compared to other transport compartments) (Video 5), which was due to the narrow window of time when TANGO1 was expressed in the circadian period and the rapidity of microtubule transport of vesicles. The model predicted an inverse relationship (to a close approximation) between intracellular PC-I and extracellular collagen concentration (Figure 5B), assuming that PC-I is converted to collagen-I during transport or in the ECM, which agreed with previous observations 35. However, the shape of the phase curve (Figure 5B) predicted a 6-hour time delay between the peak in PC-I and the peak in collagen-I. Importantly, the model predicted that extracellular collagen-I was rhythmic within a circadian period, with the peak of collagen occurring in the presumptive day (Figure 5B, C).
Figure 5. Mathematical prediction of PC-I and collagen I secretion.
(A) Phase portrait showing relationship between intracellular collagen concentration and extracellular collagen concentration over a 24-hour cycle. Black star shows CT0, and the line colour shows the circadian time increasing in the direction indicated by the arrows. The pink star indicates stationary concentration values for the model when the circadian forcing functions are removed. (B) 48-hour time plot (CT0 to CT48) of intracellular (purple) and extracellular (blue) collagen concentration fluctuations as predicted by mathematical modelling. (C) Still frame from a video representation (Supplementary Video 5) of a mathematical model of the secretory pathway showing PC-I levels in ER (SEC61-dependent translation of PC-I into ER, pCER(t)), ER exit sites (TANGO1-dependent PC-I export from ER, pCH(t)), Golgi (PDE4D-dependent transport, pCG(t)), post-Golgi (VPS33B-dependent transport, pCPG(t)), plasma membrane (pCPM(t)), and extracellular matrix (CSTK-dependent collagen degradation, pCE(t)). Bar height represents collagen concentration, and colour represents the rate of change of concentration (blue - low to red - high). The paired bars represent collagen levels at CT3 and CT15.
Rhythmic proteome revealed daily surge of collagen production in tendons in vivo
To explore the prediction that a rhythmic secretory pathway generates a wave of collagen-I in the day, we performed a time-series proteomic analysis of mouse tendon using an extraction buffer (SL-DOC) that solubilised non-covalently bound collagen whilst leaving the tightly-bound and cross-linked collagen intact. This allowed for separate analysis of newly-synthesised collagen. D2 and D3 fibrils persisted whilst D1 fibrils were depleted after SL-DOC treatment (Extended Data Figure 6I-K) which removed 18% of total collagen (Extended Data Figure 6L).
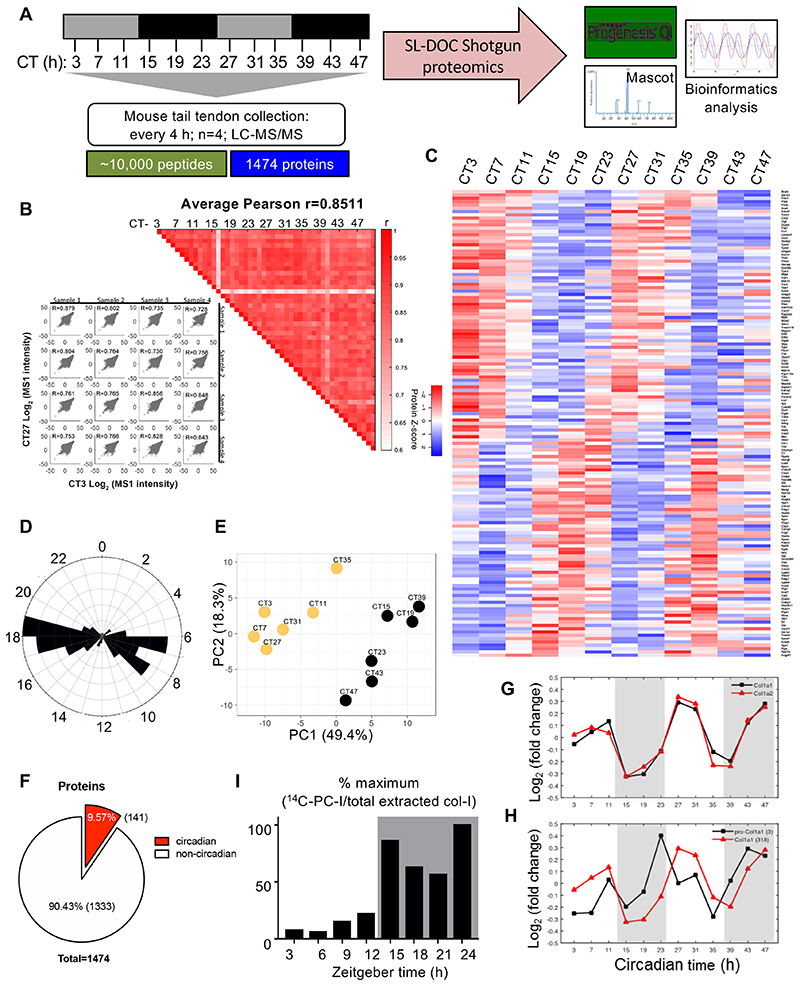
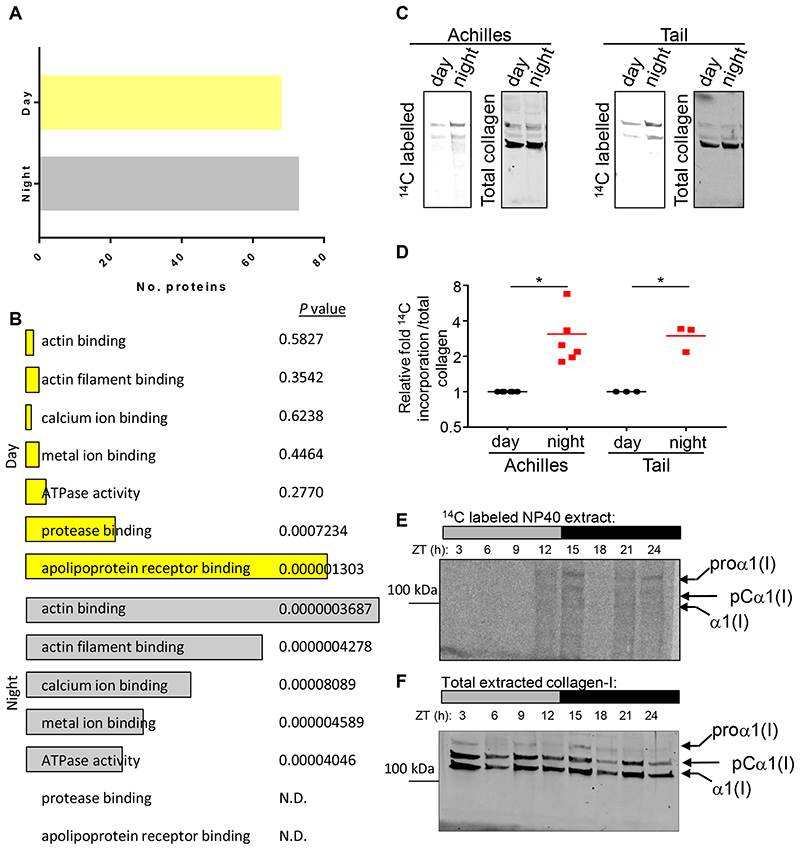
The SL-DOC soluble proteins were treated with trypsin and the resultant peptides analysed by liquid chromatography-tandem mass spectrometry (LC-MS/MS) 36. We detected ~10,000 peptides and identified 1,474 proteins with ≥ 2 peptides per protein (Figure 6A) (ProteomeXchange accession: PXD013450), with good reproducibility between biological replicates as indicated by Pearson analysis across two consecutive 24-hour periods (Figure 6B). Rhythmic profiles of protein levels were detected during 48 hours (Figure 6C), with prominent changes occurring at the night-day and day-night transitions for rhythmic and non-rhythmic proteins (Figure 6D, E and Extended Data Figure 7A). Approximately 10% of detected proteins (141) were robustly rhythmic (with periods of 20-27.5 h) (Figure 6F). Protein ontology analysis showed that actin-binding proteins were most abundant in night samples (Extended Data Figure 7B). This supports a recent proteomics study in fibroblasts, which indicated regulation of actin dynamics is under circadian control 37. α1(I) and α2(I) chains were conspicuously rhythmic and peaked during daylight hours, equivalent to 1.6-fold difference in extractable collagen-I between day and night sampling (Figure 6G). It was possible to identify peptides specific for the C-propeptides of proα1(I) proα1(I) of PC-I, which peaked ~6 hours prior to the α1(I) and α2(I) peptides, which was consistent with the slow cleavage of PC-I to collagen-I 38,39 (Figure 6H and Source Data for Figure 6.xlsx). To investigate the rate of collagen-I production during day and night, tendon tissues dissected 12 hours apart were labelled with 14C-proline ex vivo 40. Both Achilles and tail tendon tissues had significantly greater PC-I production at night (Figure 6I and Extended Data Figure 7C, D), corroborating the LC-tandem mass spectrometry data. 14C-amino acid labelling of newly-synthesised proteins every 4 hours during 24 hours confirmed that PC-I production was ramped up throughout the night (Extended Data Figure 7E, F).
Figure 6. Time-series proteomics analysis of proteins in mouse tendon.
(A) Schematic showing collection of mouse tail tendons every 4 h during 48 h for proteomics analysis. (B) Heat map of Pearson correlation coefficients (r) for pairwise comparison of each sample, calculated from normalised peptide intensities. Each square represents a single comparison with intensity of colour denoting r according to the colour bar (right). High average and minimum r values denote high reproducibility between biological replicates (left). (C) Heat map depicting the levels of the detected rhythmic proteins, organised according to the timing of peak expression in circadian time (CT). Red is downregulated and blue is up-regulated based on protein Z-score. (D) Radial plot showing the frequency distribution of the phases of the rhythmic proteome in mouse tendons. The majority of peptides were detected between CT6–9 and CT17–19. (E) Principal component analysis (PCA) of the cycling proteome. The major two components separating the data organised the samples into samples corresponding to day (left, yellow circles) and night (right, black circles) time points. (F) Pie chart indicating the percentage of circadian proteins and non-circadian proteins. (G) Relative abundance of the two collagen-I α-chains, α1 (Col1a1) and α2 (Col1a2), detected by mass spectrometry over 48 h (mean of log10 intensities for n = 4 animals). Peak abundance of collagen-I peptides was detected at CT27 and CT47. (H) Peptide counts (log2 values) of C-propeptide region of a1 (pro-Col1a1) chain and of a1 (Col1a1) detected by mass spectrometry over 48 h, based on calculations using peptides from the different sub-domains of pro-α1(I) chain. Note the abundance of C-pro-α(I) peptides peaks prior to the peak abundance of α1(I) peptides, at CT23 and CT43. N = 4 animals. (I) Achilles and tendon tissues were harvested at the day phase (zeitgeber time (ZT) 3, day) or night phase (ZT15, night) and labelled with 14C proline for 1 h in the presence of exogenous L-ascorbate. Densitometry of 14C-labelled collagen-I from western blot analysis showed significant increase in 14C-labelled collagen-I in the night phase. See also Source Data for Figure 6 and Extended Data Figure 7.
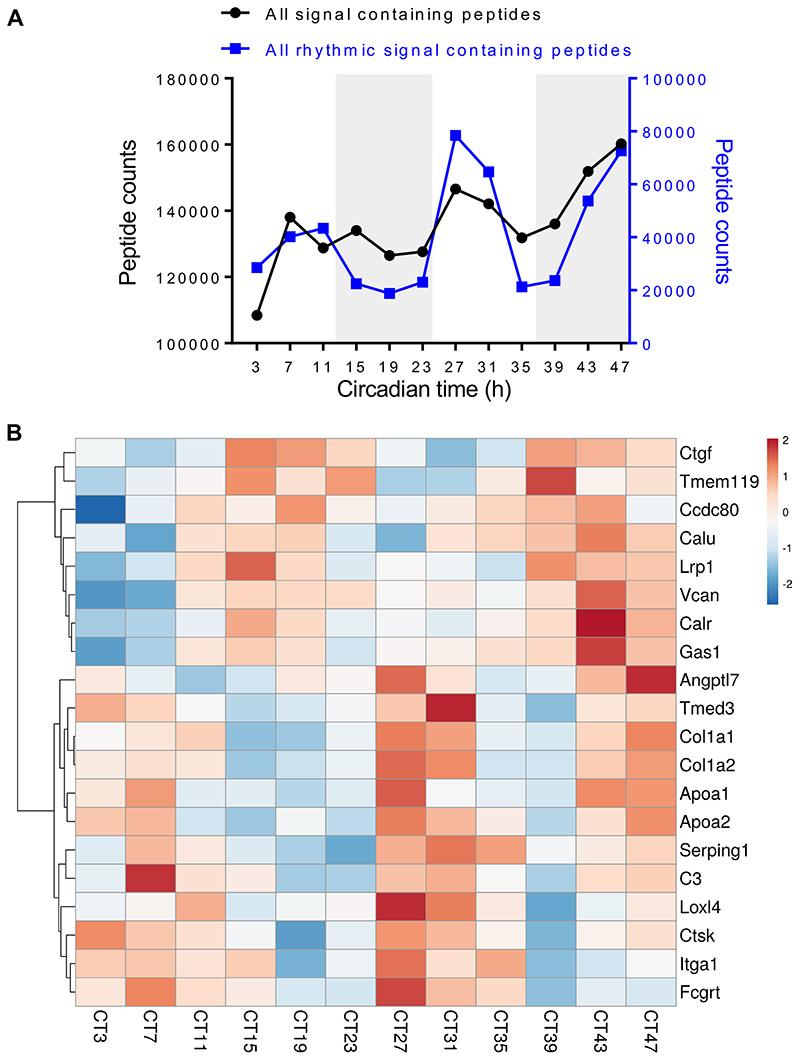
Proteins in the proteomics dataset that contained predicted signal sequences were identified by overlapping our dataset with the signal peptide database 41, and the abundance of all secreted proteins was plotted against circadian time (Extended Data Figure 8A, black). A subset of these were 24-hour rhythmic, and showed peak times of synthesis at CT7-11 and CT27-31 (Extended Data Figure 8A, blue). Lysyl oxidase like-4, CTSK and integrin α1, along with collagen α1(I) and α2(I), were amongst the top 20 signal peptide-containing rhythmic proteins that peaked in abundance at these times (Extended Data Figure 8B).
Mistiming of the secretory pathway results in collagen accumulation and abnormal fibril structure
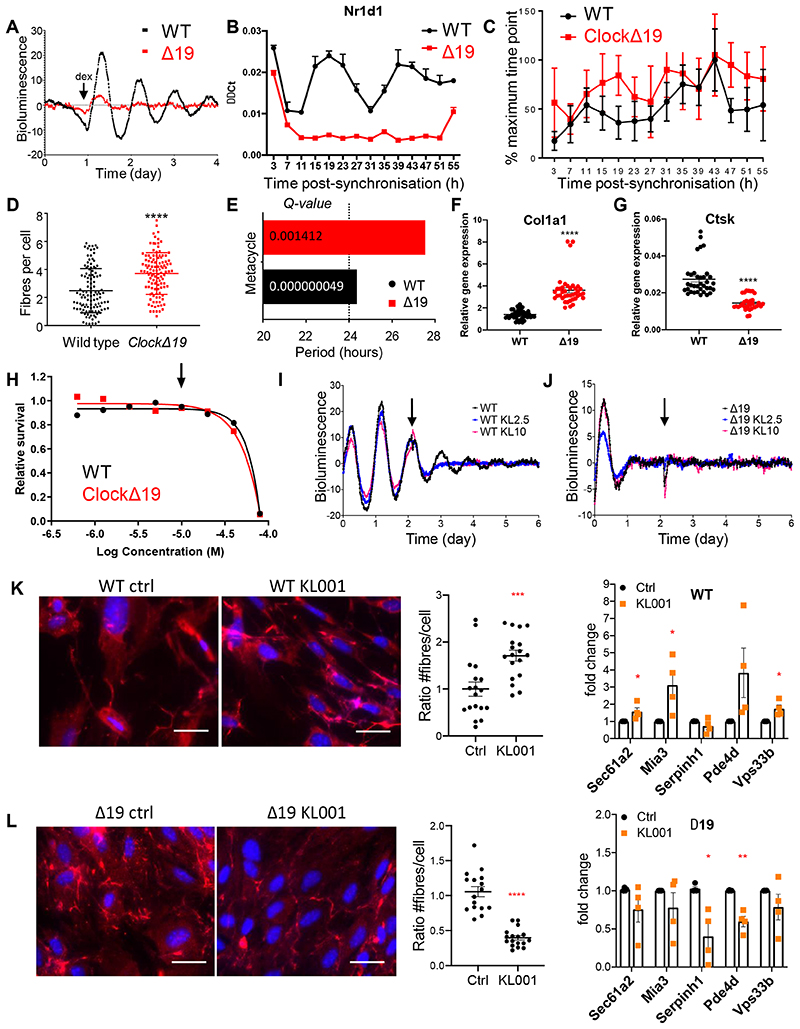
Next, we cultured fibroblasts from wild type and ClockΔ19 42 mice bred on a PER2::LUC background (which enabled direct measurement of the endogenous circadian rhythm) and treated the cells with dexamethasone to synchronise circadian rhythms. Wild type cells showed a robust bioluminescence rhythmicity that persisted for 3 days (Figure 7A). In contrast, ClockΔ19 fibroblasts did not sustain a rhythm (Figure 7A). Time-series quantitative-PCR analysis of Nr1dr1 (as a measure of circadian clock rhythmicity) confirmed that dexamethasone was effective in synchronising the clock in wild type cells only but not in ClockΔ19 cells (Figure 7B). Next, we synchronised wild type and ClockΔ19 fibroblasts and performed a time-series immunofluorescence study to quantitate the number of collagen fibres formed (Extended Data Figure 9A). The results showed that both wild type and ClockΔ19 fibroblasts synthesised collagen fibres during 55 hours in culture; therefore, a rhythmic secretory pathway is not necessary for collagen fibre formation (Figure 7C). The number of collagen fibres synthesised by wildtype cells increased and decreased to reach a steady-state level after 55 hours (Figure 7C). In contrast, the number of collagen fibrils synthesised by ClockΔ19 fibroblasts trended higher than wildtype cells over the course of 55 hours without reaching a plateau (Figure 7C). As a consequence, the number of collagen fibres per cell was greater in ClockΔ19 than in wild-type fibroblasts (Figure 7D). Metacycle analysis indicated that the increase and decrease in fibre number during days in culture in wild type and ClockΔ19 cultures was 24 and 28 hours, respectively (Figure 7E). Averaging all timepoints, the overall levels of Col1a1 mRNA were elevated (Figure 7F) and the overall levels of Ctsk mRNA were decreased (Figure 7G) in ClockΔ19 compared to wild type cells.
Figure 7. Dysregulated collagen fibre homeostasis in the absence of a circadian rhythm.
(A) Luminometry recordings of endogenous circadian rhythms and re-initiation of the rhythms with dexamethasone (arrow) evident in fibroblasts isolated from wild type (WT), but not in fibroblasts isolated from ClockΔ19 (Δ19) mice bred on a PER2::Luciferase background. Shown here is representative of n=3 independent experiments. (B) Gene expression analysis of Nr1d1 levels in WT and Δ19 fibroblasts during 55 hours. N = 3 independent repeats. Bars show mean ± SEM. (C) Plot showing percentage collagen fibre count in the same fibroblasts, corrected to the maximum percentage fibril count of the time course. Δ19 fibroblasts have lost their rhythmicity of fibril assembly. Fibres were scored by three independent investigators. The mean and standard deviation of n = 16 technical repeats at each timepoint are shown. Bars show mean ± SD. (D) Total number of fibrils per cell measured, indicating that Δ19 fibroblasts produced more fibrils overall. Values shown include technical repeats n = 16. Parametric unpaired two-tailed t-test, ****p=0.00000001. Bars show mean ± SD. (E) MetaCycle analyses of fibril counts showed a circa 24-h rhythmicity in WT fibroblasts, compared to circa 28-h rhythmicity in Δ19 fibroblasts. (F) Col1a1 (average of all time points, CT3-CT55) ****p=0.000000000001 and (G) Ctsk (average of all time points, CT3-CT55) ****p=0.0000000009 in WT and Δ19 fibroblasts. RNA was collected every 4 h over 55 h after synchronisation with dexamethasone. N = 28 independent samples used in each analysis. Bars show mean ± SD. Welch’s t-test. (H) Kill curve of KL001 showing that concentration of 10 μM (indicated with arrow) is well tolerated by WT and Δ19 fibroblasts. N = 2 biologically independent experiments. (I-J) Luminometry recordings of circadian rhythms of dexamethasone-synchronised fibroblasts isolated from PER2::Luciferase (WT) and ClockΔ 19::PER2::Luciferase (Δ19) mice. KL2.5, 2.5 μM KL001. KL10, 10 μM KL001. Arrow, addition of KL001. (K-L) Immunofluorescence analysis of (K) wild type and (L) ClockΔ19 fibroblasts either treated with 10 μM KL001 or mock-treated with DMSO (Ctrl). Blue, Dapi. Red, anti-collagen-I antibody. Number of collagen fibres per cell is shown for control and KL001-treated fibroblasts. N > 16 repeats. Bars show mean ± SEM. Parametric unpaired two-tailed t-test, ***p=0.0007 for WT, ****p=0.00000004 for Δ19. Fold change from q-PCR analysis of gene expression is shown for control and KL001-treated fibroblasts. N=4 biologically independent experiments. Mean ± SEM. Multiple t-test (FDR = 1%): Sec61a2, *p = 0.0437; Mia3, *p = 0.0352; Vps33b, *p = 0.014 for WT; Serpinh1, *p = 0.0103; PDe4d, **p = 0.00104 for Δ19. See also Source Data for Figure 7.
KL001 is a small molecule carbazole derivative that stabilizes the clock protein cryptochrome (CRY) 19. KL001 at 2.5 μM and 10 μM was well tolerated by tendon fibroblasts (Figure 7H) but led to arrhythmic bioluminescence in PER2::Luc tendon fibroblasts (Figure 7I). Addition of KL001 to control tendon fibroblasts led to increased steady state levels of Sec61a2, Mia3, Pde4d and Vps33b transcripts and increased numbers of collagen fibres per cell (Figure 7K). Conversely, KL001 did not restore rhythmic bioluminescence to PER2:Luc::ClockD19 fibroblasts (Figure 7J), and addition of KL001 to ClockΔ19 fibroblasts resulted in decreased levels of Mia3, Serpinh1, Pde4d and Vps33b and decreased numbers of collagen fibres/cell in these cells (Figure 7L). The increase in collagen fibre numbers in wild-type cells treated with KL001 (which became arrhythmic) and the decrease in collagen fibre numbers in ClockΔ19 cells treated with KL001 indicated that rhythmicity in the secretory pathway was required for collagen fibre homeostasis.
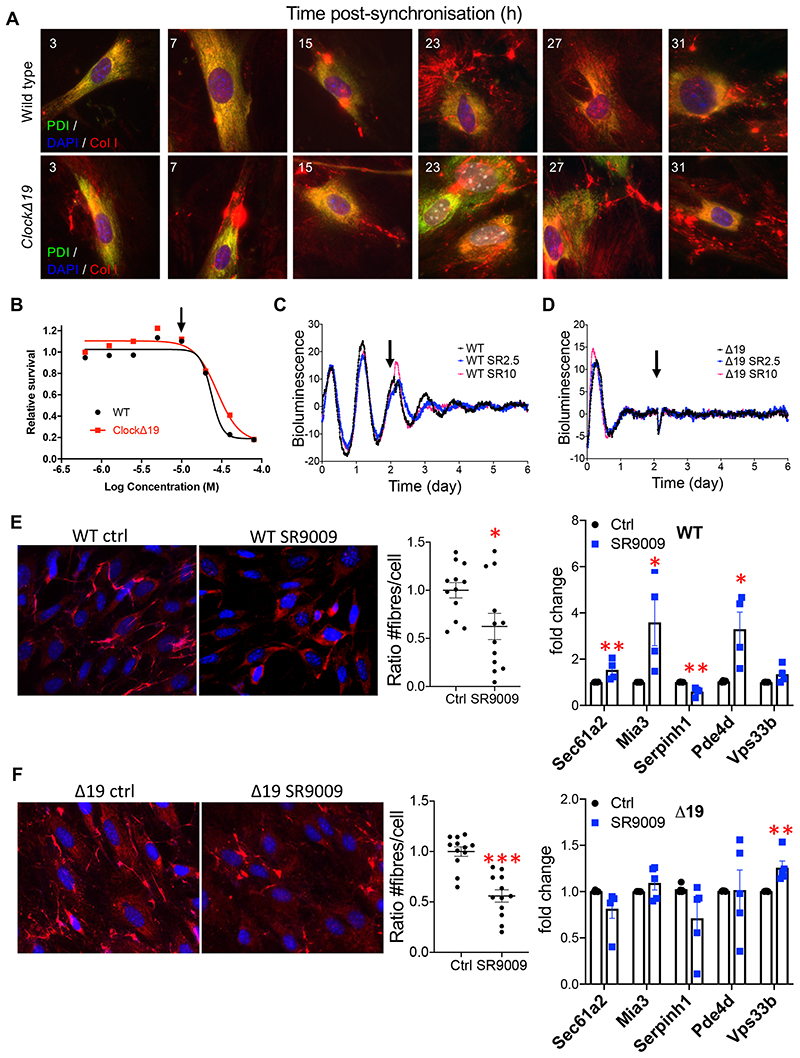
SR9009 is a small molecule agonist of NR1D1/2 with reports of NR1D1/2 independent effects on cell proliferation and metabolism 43. Here, SR9009 was well tolerated by tendon fibroblasts (Extended Data Figure 9B) and caused dampening of the rhythm in PER2::Luc tendon fibroblasts (Extended Data Figure 9B-D). SR9009 brought about a modest decrease in collagen fibres/cell in control cells and a marked decrease in collagen fibres/cell in ClockΔ19 fibroblasts. Quantitative-PCR analysis showed that SR9009 reduced Sec61a2 and SerpinH1 expression in ClockΔ19 fibroblasts (Extended Data Figure 9E, F).
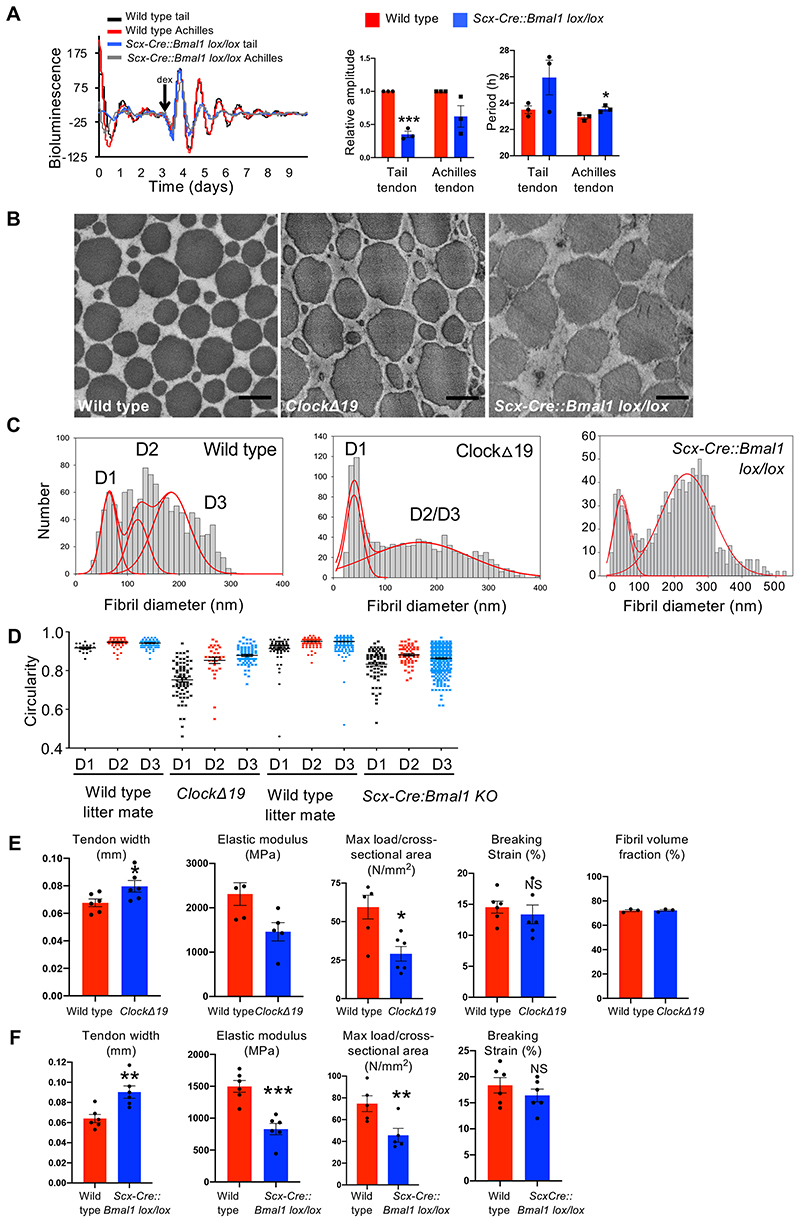
The ClockΔ19 is a global mutant mouse that shows systemic loss of rhythmicity, with potential confounding factors. To selectively disrupt circadian rhythm in tendon-lineage cells we generated a new line of Scx-Cre::Bmal1 lox/lox knockout mice that lacked circadian rhythm in tail and Achilles tendons (Figure 8A, Videos 6 (wild-type) and 7 (Scx-Cre::Bmal1 lox/lox)). We showed that the tendon fibrils in ClockΔ19 and Scx-Cre::Bmal1 lox/lox mice were irregular in outline (Figure 8B), had disrupted fibril diameter distributions (Figure 8C) and decreased circularity values (Figure 8D). Tendons in clock-disrupted mice were significantly thicker and had reduced elastic modulus and maximum load compared to wild type littermates (Figure 8E, F). There were no differences in fibril volume fraction between arrhythmic and wild type tendons (Figure 8E); hence, the increased tendon width in the mutant mice was due to an increased volume of collagen. These results showed that disrupting the circadian clock results in disrupted matrix homeostasis associated with increased collagen deposition, decreased elastic modulus, decreased maximum load, and irregular fibril structure.
Figure 8. Circadian clock deficient tendons have abnormal collagen homeostasis.
(A) Luminometry recordings of endogenous circadian rhythms and re-initiation of the rhythms with dexamethasone (arrow) evident in dissected Achilles and tail tendons of wild type mice but not of Scx-Cre::Bmal1 lox/lox mice bred on a PER2::Luciferase background. A residual rhythm observed in the Scx-Cre::Bmal1 lox/lox tendons was likely due to cells that were not derived from Scleraxis-lineage cells. Relative amplitude and period of wild type and Scx-Cre::Bmal1 lox/lox tail and Achilles tendon circadian rhythms at 6-weeks of age (n=5 tail tendons, n=4 Achilles tendons; ***p=0.002, *p=0.0431, two-tailed unpaired t-test). Bars show SEM. (B) Representative transverse transmission electron microscopy images of tail tendons from 6 weeks-old wild type, ClockΔ19 and Scx-Cre::Bmal1 lox/lox mice showing irregular fibril cross sections in mutant tendons. Bars, 200 nm. (C) Fibril diameter distributions measured from transverse TEM images of wild type, ClockΔ19 and Scx-Cre::Bmal1 lox/lox tail tendons showing abnormal distribution of fibril diameters and increase in large (>400-nm fibrils) in mutant tendons (n=3 animals measured for each genotype; 1400 fibrils measured for each mouse; representatives for each genotype are shown). Red lines show 3-Gaussian fit curves. (D) Circularity of D1, D2 and D3 collagen fibrils of tail tendons sampled from ClockΔ19 and Scx-Cre::Bmal1 lox/lox mice compared to wild type littermate controls (images from n=3 animals measured for each genotype; total of 192 wild type, 179 ClockΔ19, 663 wildtype and 506 Scx-Cre::Bmal1 lox/lox fibres measured and shown. D1, D2 and D3 populations in mutants compared to same populations in littermate controls. Bars show SEM. (E) ClockΔ19 tendons are mechanically weaker (n=6 mice (means calculated from 10 tendons measured for each mouse); two-tailed unpaired t-test, *p=0.0328, *p=0.0170 ns: p=0.5333) and) and thicker (n=6 mice (means calculated from 10 tendons measured for each mouse); **p=0.0292) than age-matched (6-weeks old) wild type mice. Fibril volume fraction is unchanged in ClockΔ19 tendons compared to wild type tendons. Bars show SEM. (F) Scx-Cre:Bmal1 lox/lox tendons are mechanically weaker (n=6 mice (means calculated from >10 tendons measured for each mouse); two-tailed unpaired t-test, **p=0.0050, ***p=0.0004, **p=0.0073, nsp=0.3317) and thicker (n=6 mice (means calculated from 10 tendons measured for each mouse); **p=0.0050) than age-matched (6-weeks old) wild type mice. Bars show SEM. See also Source Data for Figure 8.
Discussion
In our study we have identified a sacrificial pool of collagen that, via circadian clock regulation of the protein secretory pathway, is synthesised and removed whilst leaving bulk collagen unchanged. Together with rhythmic variation in collagen fibril diameters, this illustrates a surprisingly dynamic matrix and a selective mechanism of protein homeostasis that maintains tissue function and organisation.
Intracellular proteins are constantly being synthesised and degraded to replace old and damaged polypeptides with newly-synthesised copies 44. However, the extreme longevity of collagen in tissues would suggest that these conventional transcriptional and translational homeostatic mechanisms do not apply to collagen. Presumably, the energy and time required to establish extensive networks of collagen fibrils (which in humans is ~17 years7) rule out a homeostatic mechanism in which all of the collagen is turned over. Collagen-rich tissues are exposed to repeated cycles of stress and strain. Therefore, collagen molecules that are never replaced would be expected to undergo mechanical damage leading to fatigue failure. A mechanism of protein homeostasis must therefore exist to protect, rather than replace, the collagen that was assembled during growth. Such a mechanism must be able to account for the observed continued synthesis in the face of zero turnover of bulk collagen. The circadian clock mechanism described here would appear to fulfil these requirements.
Our study showed that a population of thin (D1) fibrils are interspersed between thick (D2 and D3) collagen fibrils, and make frequent contact with the surfaces of the thick fibrils. It has been suggested that the thin fibrils are part of a sheer stress loading mechanism in tendon 45. Our data would agree with this suggestion, particularly as the D1 fibrils do not appear to be under tensile strain. However, the fact that the proportion of D1 fibrils varies with time of day might suggest an additional function in maintaining matrix homeostasis in the face of bouts of activity and long-term wear and tear on the tissue. In ClockΔ19 and Scx::Bmal1fl/fl mice with a defective circadian clock, the D2 and D3 fibrils had irregular profiles and the tendons were thicker, weaker and had reduced elastic modulus. Thus, D1 fibrils, their interaction with D2 and D3 fibrils, and their regulation by the circadian clock, are important determinants of tendon tissue integrity and function.
Collagen fibrils are ‘molecular alloys’ that comprise a variety of collagen types 46 and associated molecules including small leucine rich proteoglycans (SLRPs) 47. We noted that collagen α2(V) was rhythmic in-phase with collagen a1(I) and a2(I). Collagen-V controls the initiation of collagen fibril assembly, and haplo-insufficient mice have fewer, large and irregular collagen fibrils 48. In addition, decorin (a SLRP found in a wide range of tissues) was rhythmic, peaking at CT21 (ProteomeXchange accession: PXD013450). Mice deficient in decorin have weakened tissues and abnormal collagen fibrils with irregular profiles 49. This raises the possibility that the rhythmic collagen-I-containing D1 fibrils are part of a multicomponent chronomatrix.
Finally, we propose that extrinsic control of the secretory pathway and the circadian clock may be effective at regulating collagen homeostasis in the treatment of disease, such as promoting collagen synthesis during wound healing or inhibiting collagen synthesis in fibroproliferative diseases. The CRY1/2 agonist, KL001, nullified the circadian clock in wild type fibroblasts which was associated with increased steady-state levels of Sec61a2, Mia3, Pde4d and Vps33b transcripts with increased numbers of collagen fibres/cell in vitro. Conversely, KL001 had the opposite effect on arrhythmic ClockΔ19 cells resulting in decreased levels of Sec61a2, Pde4d and Vps33b transcripts and fewer collagen fibres/cell. Thus, targeted control of the secretory pathway and circadian clock may provide new opportunities to modulate extracellular matrix secretion in the maintenance of long-term tissue health.
Mice
The care and use of all mice in this study was carried out in accordance with the UK Home Office regulations, UK Animals (Scientific Procedures) Act of 1986 under the Home Office Licence (#70/8858 or I045CA465). The permission included the generation of conditional knock out animals.
ClockΔ19 mice (C57BL/6 on a PER2::Luciferase reporter background) were as described previously 52. To generate mice in which Bmal1 is ablated in tendon-lineage cells, we crossed mice expressing Cre recombinase under the control of the Scleraxis promoter (Scx-Cre; C57BL/6) 53 with C57BL/6 mice carrying loxP sites flanking the exon encoding the BMAL1 basic helix-loop-helix domain 54 bred on a background with PER2::Luciferase reporter 55 to produce Scx-Cre::Bmal1 lox/lox mice. Six-week old wild type C57BL/6 mice housed in 12-h dark/12-h dark cycle (DD) were used for circadian time (CT) time-series microarray and time-series protein extraction for western blotting as previously described 56. Wild type C57BL/6 mice housed in 12-h light/12-h dark cycle (LD) were used for all remainder zeitgeber time (ZT) studies, including time-dependent electron microscopy experiments, cyclic loading mechanical testing, ex vivo 14C-proline labelling experiments, proteomics analyses, and ex vivo odanacatib treatment.
Preparation of Cells
Tail tendon and lung fibroblasts from wild type and ClockΔ19 were released from 6-8-week mouse tail tendons by 1000 U/ml bacterial collagenase type 4 (Worthington Biochemical Corporation) in trypsin (2.5 g/L) as previously described 57. Wild type tail tendon fibroblasts were immortalized by retroviral expression of mTERT (iTTFs) 58. Mouse embryonic fibroblasts (MEFs) were isolated from E14 wild type mouse embryos. Cells were cultured in complete media (Dulbecco’s modified Eagle’s medium: Nutrient Mixture F-12 containing 4500 mg/L glucose, L-glutamine, and sodium bicarbonate, supplemented with 10% foetal calf serum, 200 μM L-ascorbic acid 2-phosphate, 10,000 U/ml penicillin/Streptomycin) at 37°C, in 5% CO2.
To synchronise the circadian clocks of a population of cells, cells were incubated with either 100 nM dexamethasone (Merck) in complete media for 30 min at 37°C, in 5% CO2 or 50% horse serum (Thermo Fisher Scientific) in DMEM F-12 for 2 h at 37°C, in 5% CO2 and then for 24 h in complete medium at 37°C, in 5% CO2. After (at 0 h after synchronisation), cells were fixed for immunofluorescence or used for protein or RNA isolation, at 3-h or 4-h intervals.
For the clock agonist experiments, CRY agonist KL001 (Merck) or NR1D1/2 agonist SR9009 (Cayman Chemical) at 2.5 or 10 μM, or control DMSO were added to the cells and RNA was isolated after 55 h.
CRISPR-Cas9-Mediated Knockout
Cells were treated with CRISPR-Cas9 to delete Sec61a1, Sec61a2 or Vps33b genes. Ribonucleoprotein complexes of crRNA, tracrRNA and recombinant 3xNLS Cas9 were formed according to manufacturer’s protocol (Integrated DNA Technologies). Two different guides were used in combination to target Sec61a1 (g1: TCC GGC AAG ATG ACA CAG AA, g2: TCT GCA AAA AGG GTA CGG CT), Sec61a2 (g1: AGT TTA GAG AGA AGG TAC TA, g2: TTT ATG ATC GCT CAC ATT TC) or Vps33b (g1: CGT TAG CAA TTC GAT CCA AA, g2 AGT CAT CCT AAG CCC TCA GA). 60 pmol complexes (2 pmol Cas9) were nucleofected into 4 × 10⁵ MEFs using P1 Nucleofection Buffer (Lonza). Gene knockout was confirmed by western blotting and qPCR. For iTTF studies, 5 x 10⁴ cells were plated out in a 24-well plate, and the aforementioned ribonucleoprotein complexes were introduced into the culture using Lipofectamine RNAiMAX reagent (Thermo Fisher Scientific), according to manufacturer’s instructions. Clones were then generated using serial dilution in a 96-well plate. Gene knockdown was confirmed by western blotting and qPCR.
RNA Interference
Cells were treated with siRNAs to deplete Mia3 or Pde4d transcripts in mouse cells. siRNAs targeting Pde4d (SMARTpool ON-TARGETplus Pde4d siRNA; Dharmacon) or Mia3 (GeneSolution Mia3 siRNA; Qiagen) were transfected into MEFs using MEFs Nucleofector Kit (Lonza) according to the manufacturer’s instructions. Briefly, 4 x 10⁶ cells (in a well of a 6-well plate) were transfected with a 0.8 nmol of siRNA in a final volume of 3 mL (yielding a final concentration of 250 nM).
RNA isolation and Quantitative Real-Time PCR
RNA was isolated from ex vivo tendon and cells as described previously 57. In brief, tissues and cells were disrupted in TRIzol Reagent (Thermo Fisher Scientific) and RNA was isolated according to manufacturer’s protocol. DNase treatment of RNA was performed using RQ1 RNase-Free DNase (Promega Corporation) according to manufacturer’s protocol. RNA integrity was assessed by gel electrophoresis and RNA concentration was measured using a NanoDrop 2000 (Thermo Fisher Scientific). Complementary DNA was synthesised from 2 μg RNA using TaqMan Reverse Transcription Reagents (Thermo Fisher Scientific).
SensiFAST SYBR kit reagents were used in qPCR reactions. Primer sequences used were Col1a1 GCC TGC TTC GTG TAA ACT CC and TTG GTT TTT GGT CAC GTT CA, Ctsk GGA CCC ATC TCT GTG TCC AT and CCG AGC CAA GAG AGC ATA TC, Gapdh AAC TTT GGC ATT GTG GAA GG and ACA CAT TGG GGG TAG GAA CA, Mia3 AGC CAC GGA CGG CGT TTC TC and CCC CTG CCA GTT TGT AGT A, Nr1d1 CTT CCG TGA CCT TTC TCA GC and GGT AAG TGC CAG GGA GTT GA, Pde4d CCA ACT AGC CTC CCC TTG AA and GCT GTC AGA TCG GTA CAG GA, Sec61a1 CAG GTT CTT CTG CCA AAG ATG and TCA TGC ACC ATG GAG GTC T, Sec61a2 TGT ATG TCA TGA CGG GGA TG and CAA ACC AGC AAC AAA CAA CTG, and Vps33b GCA TTC ACA GAC ACG GCT AAG and ACA CCA CCA AGA TGA GGC G. Primers were validated by DNA sequencing of PCR products and verified using BLAST. For qPCR analysis, the 2-ΔΔCt method 59 was used to analyse relative fold changes in gene expression compared to the first time point or to wild type or control.
Protein Extraction and Western Blotting
Protein was extracted and analysed by western blotting as previously described 56. Briefly, tendons were snap frozen and homogenized with ice-cold cell lysis buffer (20 mM Tris/HCl pH 7.6, 150 mM NaCl, 1 mM ethylene diamine tetra-acetic acid (EDTA), 1% (v/v) Igepal CA-630, 50 mM sodium fluoride) containing complete, mini EDTA-free protease inhibitor cocktail and PhosSTOP phosphatase inhibitor cocktail (Roche). Lysates were cleared by centrifugation at 10000 x g, at 4 °C. Pierce BCA Protein Concentration Assay (Thermo Fisher Scientific) was used to determine protein concentration.
Proteins were separated on NuPAGE Novex 10% polyacrylamide Bis-Tris gels with 1x NuPAGE MOPS SDS buffer (both from Thermo Fisher Scientific) and transferred onto PVDF membranes (GE Healthcare). Membranes were blocked in 5% skimmed milk powder in 1x PBS containing 0.05% Tween 20. Antibodies were diluted in 2.5% skimmed milk powder in 1x PBS containing 0.05% Tween 20. Primary antibodies used were goat pAb to collagen a1 type I (1:1000; Santa Cruz), mouse mAb to GAPDH (1:10000; Merck), rabbit pAb to PDE4D (1:500; Santa Cruz), rabbit pAb to Sec61A (1:500; Santa Cruz), rabbit pAb to Tango1 (1:500; Santa Cruz), mouse mAb to vinculin (1:200; Oncogene), and mouse mAb to VPS33B (1:500; Proteintech). HRP-conjugated antibodies and Pierce ECL Western Blotting Substrate (both from Thermo Fisher Scientific) were used and reactivity was detected on Hyperfilm (GE Healthcare) or Biorad GelDoc imager (Biorad). Alternatively, Licor rabbit-anti-mouse 680 were used and reactivity detected on Odyssey Clx imager.
Immunofluorescence and Laser Confocal Imaging
Cells were fixed with 100% methanol at -20°C and permeabilized with 0.5% Triton-X/PBS. Collagen-I was detected using a rabbit pAb (1:500; Gentaur), HSP47 was detected using mouse mAb (1:100; Santa Cruz), ER was detected using rabbit pAb to calnexin (1:200; Abcam) or mouse mAb protein disulfide isomerase (PDI) (1:100; Abcam), cis-Golgi was detected using rabbit mAb to GM130 (1:250; Abcam) or mouse pAb to GM130 (1:500; 610822, BD Biosciences). Secondary antibodies conjugated to FITC (Abcam) and Cy5 (Thermo Fisher Scientific) were used. Stained cells were mounted using VECTASHIELD Hardset antifade mounting medium with DAPI (Vector Labs).
Images were collected on a Leica TCS SP5 AOBS inverted confocal using an [63x / 0.50 Plan Fluotar] objective [and 3x confocal zoom]. The confocal settings were as follows, pinhole [1 airy unit], scan speed [1000 Hz unidirectional], format 1024 x 1024. Images were collected using [PMT] detectors with the following detection mirror settings; [FITC 494-530 nm; Cy5 640-690 nm] using the [488 nm (20%), 594 nm (100%) and 633 nm (100%)] laser lines respectively. To eliminate crosstalk between channels, the images were collected sequentially. When acquiring 3D optical stacks the confocal software was used to determine the optimal number of Z sections. Only the maximum intensity projections of these 3D stacks are shown in the results.
Ex Vivo Tendon Culture
Following euthanasia hind legs were amputated just below the knee. The skin was removed to expose the Achilles tendon. The whole bone-muscle-tendon unit (tibia, calcaneus, gastrocnemius and soleus muscles with the Achilles tendon) was placed in complete media containing 1 μM odanacatib (Cambridge Bioscience Ltd.) or 0.1% DMSO vehicle control. Ex vivo tendons were cultured for 72 h at 37 °C, in 5% CO2.
14C-Proline Labelling of Ex Vivo Tendons
Achilles tendons were dissected from mice, rinsed in PBS, and incubated at 37°C in complete media containing 2.5 Ci/ml of 14C-proline (Perkin Elmer) for one hour, with the tubes agitated every 20 min. After incubation, tissues were washed, spun down and transferred to fresh Eppendorf tubes with 100 μL of salt extraction buffer (1 M NaCl, 25 mM EDTA, 50 mM Tris-HCl, pH7.4) containing protease inhibitors and phosphatase inhibitors. Tendons were extracted in 2 changes of salt extraction buffer – 12 h (S1), 6 h (S2) – these steps extracted collagen that was present in the extracellular fraction of the tissue. This was then followed by 12 hours in NP40 buffer (salt extraction buffer supplemented with 1% NP40 (Merck)) which allowed extraction of intracellular fractions. NP40 extracts were then analysed on 6% Tris-Glycine gels (Thermo Fisher Scientific) under reducing conditions, followed by transfer onto nitrocellulose membranes. Membranes were then dried and exposed to a phosphoimaging plate (Fuji BAS-III or BAS-MS). After 14 days of exposure, the plates were processed using a phosphoimager (Fuji BAS 2000 or 1800), and images analysed using ImageJ.
Hydroxyproline Assay
Samples were incubated in 6 M hydrochloric acid (diluted in ddH2O, (Fluka); approximately 1 mL per 20 mg of sample) in screw top tubes (StarLab) overnight in a sand-filled heating block at 100°C, covered with aluminium foil. Tubes were then allowed to cool down and centrifuged at 12000 g for 3 min. Hydroxyproline standards were prepared (starting at 0.25 mg/mL, diluted in ddH2O), and serially diluted with 6 M hydrochloric acid. Each sample and standard (50 μL) were transferred into fresh Eppendorf tubes, and 450 μL of chloramine T reagent (0.127g of chloramine T in 50% N-propanol diluted with ddH2O; bring up to 10 mL with acetate citrate buffer – 120 g sodium acetate trihydrate, 46 g citric acid, 12 mL glacial acetic acid, 34 g sodium hydroxide, pH to 6.5 then make to 1 L with dH2O. All reagents from Sigma) was added to each tube and incubated at room temperature for 25 min. After, 500 μL of Ehrlich’s reagent (1.5 g of 4-dimethylamino-benzaldehyde diluted in 10 mL of N-propanol/perchloric acid at 2:1 ratio) was added to each reaction tube and incubated at 65°C for 10 minutes and then the absorbance reading at 558 nm of 100 μL of each sample was measured in a 96-well plate format.
Mass Spectrometry
All reagents were of mass spectrometry grade. Tail tendons were homogenized with a bullet blender (with 1.6 mm steel beads; Next Advance) at maximum speed at 4°C for 5 min in 200 μL of SL-DOC buffer (1.1% SL (sodium laurate), 0.3% DOC (sodium deoxycholate), 0.5 mM dithiothreitol (DTT) in 25 mM ammonium bicarbonate) (all from Merck), supplemented with protease and phosphatase inhibitor cocktails (Roche). Samples were incubated at 4°C for 5 min, alkylated with 12 μL of 0.5 M of iodoacetamide (final concentration of 30 mM) for 20 min at RT, followed by quenching with 12 μL of 0.5 M DTT (final concentration of 30 mM). Samples were centrifuged at maximum speed for 10 min. Supernatants were transferred into LoBind Protein tubes (Eppendorf) and protein concentrations measured using a Millipore Direct Detect spectrometer.
A total of 20 μg protein per sample was digested using trypsin beads (SMART digestion kit, Thermo Fisher Scientific) with rapid agitation (1400 rpm) at 37°C overnight. Peptide/bead mixtures were centrifuged at 12000 g for 5 min and supernatants transferred into new tubes. The pH was adjusted to <3 by addition of 10% formic acid (Merck) and 400 μL of EA (ethylacetate; Merck). Samples were then spun for 5 min at 16000 g, and the upper layer of solvent (EA) was discarded. EA extraction was repeated twice and samples were lyophilized in a speed-vac centrifuge (Heto).
Samples were then mixed with 100 μL of 5% acetonitrile with 0.1% formic acid (Merck), and proceeded to R3 sample desalting clean-up. Poros R3 beads (1 mg, Applied Biosystems) were added to each well of a 96-well plate with 0.2 μM PVDF membrane (Corning), and the plate was centrifuged at 200 x g for 1 min. Centrifugation was repeated to wash the beads with 50% acetonitrile (wet solution), with the flow-through discarded each time. Beads were then washed twice with wash solution (0.1% formic acid) and flow-through discarded. Samples were added into the corresponding wells and mixed with beads on a plate mixer for 5 min at 800 rpm. Samples were washed twice with wash solution, and the flow-through was discarded after each centrifugation step. A fresh sample collection plate was then placed under the PVDF membrane plate, and samples were eluted and collected using 50 μL of elution buffer (40% acetonitrile, 0.1% formic acid). This elution step was repeated to give a total of 100 μL eluted samples. Eluted samples were transferred from the plate into individual chromatography sample vials, and dried in a speed-vac centrifuge for 60 min or until complete dryness was achieved. The resulting peptides were dissolved in 15 μL of 5% acetonitrile with 0.1% formic acid.
Digested samples were analysed using an UltiMate® 3000 Rapid Separation liquid chromatography system (RSLC, Dionex Corporation) coupled to either an Orbitrap Elite (for quality control assessment; Thermo Fisher Scientific) or Q Exactive HF (Thermo Fisher Scientific) mass spectrometer. Briefly, for the Orbitrap Elite, peptides were separated using a 75 mm x 250 μm inner diameter 1.7 μM CSH C18, analytical column (Waters) with a gradient from 92% A (0.1% formic acid, FA, Sigma, in deionized water) and 8% B (0.1% FA in acetonitrile) to 33% B, in 104 min at 300 nL/min. For the Q Exactive HF, peptides were separated in a gradient of 95% A and 5% B to 7% B at 1 min, 18% B at 58 min, 27% B in 72 min and 60% B at 74 min at 300 nL/min using a 75 mm x 250 μm inner diameter 1.7 μM CSH C18, analytical column (Waters). Peptides were selected for fragmentation automatically by data dependent analysis.
Electron Microscopy
Tendons from 5- to 6-week old mice were prepared for transmission electron microscopy (TEM) and serial block face-scanning electron microscopy (SBF-SEM) as described previously 60. In brief, tendons were fixed in 1% osmium and 1.5% potassium ferrocyanide in 0.2 M sodium cacodylate buffer for 1 h, washed with distilled water, then incubated with 1% tannic acid in 0.1 M cacodylate buffer for 1 h, washed with distilled water, then incubated with 1% osmium tetroxide in water for 30 min. Samples were then washed with distilled water and stained with 1% uranyl acetate in water for 1 h, then dehydrated in acetone and embedded into resin.
For scanning transmission electron microscopy (STEM), mouse Achilles tendons were dissected from 6-week-old mice every 3 h over a 24-h period. Four mice were sacrificed at every time point. Each entire mouse Achilles was diced into ~ 0.5 mm pieces and crushed between liquid nitrogen-cooled stainless-steel blocks. The resulting powder was then mechanically dispersed in a TRIS-EDTA buffer, pH 7.4, with added proteinase inhibitors in a hand-held Dounce homogenizer. Fibrils were adsorbed from solution on a carbon-filmed 400-mesh copper grid and washed with ultra-pure water. STEM was implemented on a Tecnai Twin (FEI, Eindhoven) electron microscope fitted with an annular dark-field detector using a camera length of 350 cm. Images were recorded at 120 kV with a sufficiently low electron dose (< 103 e/nm2) to give a negligible beam-induced mass loss. Tobacco mosaic virus was used as a standard of mass per unit length.
Mechanical Testing of Tendons
Mechanical properties of arrhythmic tendons were measured as described previously 61. In brief, tail tendons were dissected from 6-week-old mice and mounted onto a grade 100 sandpaper frame with a 1 cm length window using superglue. The sandpaper frame was clamped in an Instron 5943 fitted with a 10 N load cell (Instron Inc, UK). Only samples that failed in the mid portion of the tendon were included. Tendons were tested to failure with a displacement rate of 5 mm/min. The length and width of the samples tested were measured from a digital photograph using ImageJ software, which were used to derive corrected elastic modulus and calculate maximum load/cross sectional area. At least 10 tendons from each biological replicate were tested.
The dissected mouse Achilles tendons sampled at ZT3 and ZT15 were subjected to a cyclic test regime on an Instron 5943 fitted with a BioPuls specimen bath. Each sample was clamped at the bone and over the myotendinous junction using superglue and a sandpaper sandwich in the pneumatic clamps. The sample bath was filled with PBS and maintained at 22°C. The tendon was straightened with a tare load of 0.02 N and then subjected to successive strain cycles up to a 1 N load. A series of 30 cycles was used for each tendon sample and consisted of 6 sets of 5 cycles with a displacement rate for each set of 1, 2, 3, 4, 5 and 1 mm/min, respectively. The tendon was finally loaded to 1 N at 1 mm/min after the last strain cycle and the stress-relaxation load curve was recorded over 15 min. Energy loss measurements were obtained from the stress-strain hysteresis loop of the final cycle in each set. The elastic modulus was calculated from the linear part of the stress-strain curve on the load increasing part of the strain cycle. The length of the test portion of the tendon and the lateral dimensions were measured from calibrated images. The stress-relaxation curve was fitted to a sum of three exponential decay curves to yield 3 characteristic relaxation times (T1, T2, T3).
Bioluminescence Imaging and Recordings
Tendon explants from 6-week old mice were cultured on 0.4 μm cell culture inserts (Millipore) in recording media containing 0.1 mM luciferin (Merck) in the presence of 100 nM dexamethasone (Merck) and visualised using a self-contained Olympus Luminoview LV200 microscope (Olympus) and recorded using a cooled Hamamatsu ImageEM C9100-13 EM-CCD camera. Images were taken every hour for 3 days, and combined in ImageJ to generate movies. The recording parameters were the same for control wild type (Video 6) and Scx-Cre::Bmall lox/lox (Video 7) Achilles tendons but the brightness for the Scx-Cre::Bmal1 lox/lox recording was increased for the images and video to enable visualisation.
LumiCycle apparatus (Actimetrics) was used for real-time quantitative bioluminescence recording of tendon explants and tendon fibroblasts as described above in the absence of dexamethasone for 3 days. Then 100 nM dexamethasone was added to re-initiate the circadian rhythms. Baseline subtraction was carried out using a 24-hr moving average. Period after addition of dexamethasone was calculated using LumiCycle analysis software (Actimetrics) or using the RAP algorithm. A minimum of three peaks were used to determine period. Amplitude was calculated as peak-trough difference in bioluminescence of the second peak using baseline subtracted data.
Statistics and Reproducibility
Data are presented as mean ± SEM unless otherwise indicated in figure legends. Sample number (n) indicates the number of independent biological samples in each experiment. Sample numbers and experimental repeats are indicated in figures and figure legends or methods section above. Data were analysed as described in the legends. Data analysis was not blinded. Differences in means were considered statistically significant at p < 0.05. Significance levels are: *p<0.05; **p<0.01; ***p< 0.001; ****p< 0.0001; NS, non-significant. Actual p-values are shown where appropriate. Analyses were performed using the Graphpad Prism 7 software. N=2 biological repeats for Figure 2, Figure 4E, Figure 7H.
Morphometric Analyses of EM images
Fibril diameter, perimeter and area were measured using ImageJ software to calculate circularity and fibril volume fraction as described previously (Starborg et al., 2013). Fibril diameter distributions were plotted and fitted to 3-Gaussian distribution using Sigma Plot 12.0 software (Systat Software) as previously described (Starborg et al., 2013).
For the STEM experiments, tobacco mosaic virus (TMV) was used as standard of mass per unit length (131 kDa/nm). Mass per unit length measurements were averages of 5D-periods for each fibril. Mass per unit length measurements were made from STEM images on samples of dispersed collagen fibrils as described 62. The mass per unit length frequencies were weighted according to the individual fibril length in each image.
Proteomics Data Analysis and Protein Quantification
Spectra from multiple samples were automatically aligned using Progenesis QI (Nonlinear Dynamics) with manual placement of vectors where necessary. Peak-picking sensitivity was set to 4/5 and all other parameters were left as defaults. Only peptides with charge between +1 to +4, with 2 or more isotopes were taken for further analysis. Filtered peptides were identified using Mascot (Matrix Science UK), by searching against the SwissProt and TREMBL mouse databases. The peptide database was modified to search for alkylated cysteine residues (monoisotopic mass change, 57.021 Da), oxidized methionine (15.995 Da), hydroxylation of asparagine, aspartic acid, proline or lysine (15.995 Da) and phosphorylation of serine, tyrosine, threonine, histidine or aspartate (79.966 Da). A maximum of 2 missed cleavages was allowed. Peptide detection intensities were exported from Progenesis QI as Excel (Microsoft) spread sheets for further processing. Peptide identifications were filtered via Mascot scores so that only those with a Benjamini-Hochberg false discovery rate (FDR)-adjusted p-value < 0.05 remained. FDR filtering was performed as described 63. Raw ion intensities from peptides belonging to proteins with fewer than 2 unique peptides (by sequence) per protein in the dataset were excluded from quantification. Remaining intensities were logged and normalised per MS run by the median logged peptide intensity. Peptides assigned to different isoforms were grouped into a single “protein group” by gene name. Only peptides observed in at least 2 samples were used in quantification. Missing values were assumed as missing due to low abundance, an assumption others have shown is justified 64. Imputation was performed at the peptide level following normalization using a method similar to that employed by Perseus 65 whereby missing values were imputed randomly from a normal distribution centred on the apparent limit of detection for this experiment. The limit of detection in this instance was determined by taking the mean of all minimum logged peptide intensities and down-shifting it by 1.6σ, where σ is the standard deviation of minimum logged peptide intensities. The width of this normal distribution was set to 0.3σ as described 65. Fold-change differences in the quantity of proteins detected in different time-points were calculated by fitting a mixed-effects linear regression model for each protein with Huber weighting of residuals, as described in 64 using the fitglme Matlab (The MathWorks, USA) function with the formula: y_iptb= β_t+ β_p+ β_b; where y_iptb represents the log2(intensity) of peptide p belonging to protein i, at time-point t, in batch b. βs represents effect sizes for the indicated coefficients. Batch and peptide were entered as random effects whereas time-point was entered as a fixed effect. Standard error estimates were adjusted with Empirical Bayes variance correction as previously described 66,67. Conditions were compared with Student’s t-tests with Benjamini-Hochberg correction for false positives 68.
Periodicity Analysis
Periodicity analysis was performed using the MetaCycle package 69 in the R computing environment 70 using the default parameters. A Benjamini-Hochberg FDR<0.2 was used to detect rhythmic proteins.
Predictive Model of Collagen Homeostasis (see Supplementary Information 5)
Collagen Fibre Quantification
Collagen fibres were independently and manually scored by two independent researchers using a Zeiss fluorescence microscope. An average of at least 12 fields of views were quantified for each time point. Number of fibres were counted based on collagen-I fluorescence staining; where collagen fibres appear branched it was counted as separate fibres. For each field of view, the number of fibres were corrected to the number of cells as defined by DAPI staining. For each time point, the number of fibres per cell was corrected to the time point with the maximum value, expressing all other quantifications as a percentage of the maximum. Representative images from selected time points were presented.
Extended Data
Extended Data Fig. 1. Electron microscopy and biomechanics.
a, Collagen fibril diameter distributions measured from transverse TEM images of tail tendons sampled through a circadian period. Mice were housed in 12-hour dark/12-hour light cycles. ZT, zeitgeber time (hours into light). Fibrils (n = 1400) were measured for each panel. Black lines show 3-Gaussian fit curves. b, Typical scanning transmission electron microscopy image of fibrils from mechanically disrupted tendon. A set of 50 similar STEM images were acquired for each of 30 tendon samples. Bar, 500 nm. c, Representative mass- per-unit-length distribution measured from scanning transmission electron microscopy images of mechanically disrupted whole tendons. Time point shown is ZT12. The data shown is for n- = 997 fibrils from a single Achilles tendon. All mass-per-unit-length distributions from 30 tendon samples showed a characteristic prominent D1 peak. Percentage of D1 fibrils at all time points over 24 h is shown in Fig. 1e. d, Elastic modulus of Achilles tendon is not time-of-day dependent. Bars show mean ± s.e.m., n = 4 biological replicates, unpaired t-test, p = 0.46. e, Representative hysteresis curves from cyclic loading show the energy loss is greater in tendons taken at ZT15 compared with ZT3, n = 4 biological replicates, n = 5 hysteresis cycles for each displacement rate for each tendon sample. f, Time constants derived from stress–relaxation from an initial 1 N load of Achilles tendon sampled at ZT3 compared to ZT15 (T1, T2 and T3). Bars show mean ± s.e.m., n = 4 biological replicates; the p-values were 0.114, 0.026 and 0.75 for the time constants T1, T2 and T3, respectively. g, Comparison of energy loss values of Achilles tendons at ZT3 versus ZT15 for a 5-fold range of strain rates showing a consistent ~ 40% greater energy loss at ZT15 compared with ZT3. Bars show mean ± s.e.m., n = 4 biological replicates, p-values using the unpaired t-test are 0.27, 0.26, 0.21, 0.004, 0.01 for displacement rates of 1, 2, 3, 4 and 5 mm/min, respectively. See also Statistical Source Extended Data Fig. 1
Extended Data Fig. 2. Time-series transcriptomics.
a,b, Expression of core clock genes (Npas2, Perl, Per2, Per3, Arntl, Cry1, and Cry2) mRNA. Transcripts were detected by microarray over a 48-h period. If present, multiple probe sets are shown, n = 2 mice. Metacycle analyses BHQ (Benjamini–Hochberg q-63) values indicated on top right-hand corner. ArrayExpress Accession number E-MTAB-7743 and ref. 17. c, Expression of fibrillar collagen genes in wild-type mouse tail tendon tissue detected by different probe sets in a time series microarray study were not rhythmic, n = 2 mice. Grey shadow indicates subjective night phase. ArrayExpress Accession number E-MTAB-7743 and ref. 17. See also Statistical Source Extended Data Fig. 2
Extended Data Fig. 3. Rhythmic ribosome docking.
a, Images of electron microscopy of transverse sections across mouse tendons fibroblasts in vivo showing the endoplasmic reticulum (ER) at different time points, n = 2 biological repeats. Bars 500 nm. b, Quantification of ribosome docking onto ER show differences at ZT2 and ZT15.5 in tendon fibroblasts in vivo, n = 2 biological repeats with 37 (ZT2) and 20 ZT15.5 regions scored across the two samples. Samples were scored by two independent researchers, all samples were blinded (p = 0.00000000034, two-tailed unpaired t-test). The mean and SD for each sample is shown. c, The transcription factor binding site prediction tool Contra v3 http://bioit2.irc.ugent.be/contra/v3 was used to search for binding sites in the promoter and upstream sequences of the genes shown. The default (pragmatic)positional weight matrices (PWMs) score matching stringency in a 500 base promoter region was used. E-box: Ebox, CLOCK/BMAL, Myc, Myc/Max. Cry1/Cry2 binding sites are E- boxes/CLOCK/BMAL and ROR/REV-ERB. D-box: E4BP, NFIL3, ATF2, CEBP. GRE: GRE, NR3C1. ROR: RORA, RORB, RORC. See also Statistical Source Extended Data Fig. 3. Source data
Extended Data Fig. 4. Rhythmic collagen fibril assembly.
a, MEFs were synchronized and collagen-I deposition was assessed by indirect immunofluorescence every 4 h during 60 h. Representative images from n = 3 for each time point are shown with similar results. Culture of synchronized cells was cultured in the presence of 1 mM DMOG as a control for no collagen secretion. Bars, 10 μm. b, Metacycle analyses values are shown (n = 3 independent experiments; mean ± SD). See also Statistical Source Extended Data Fig. 4. Source data
Extended Data Fig. 5. Collagen-I intracellular localization.
a, MEFs were synchronized and collagen-I co-localization with GM130 was assessed by indirect immunofluorescence every 4 h during 24 h (up to 15 h post synchronization shown). Arrows point to the Golgi. Bars 10 μm. n = 4 biological repeats. b, Enlarged frames. c, Quantification of the co-localization of collagen-I and GM130 after circadian clock synchronization. d, Quantification of the co-localization of HSP47 and GM130 after circadian clock synchronization. N = 4 independent experiments, mean ± s.e.m. See also Statistical Source Extended Data Fig. 5. Source data
Extended Data Fig. 6. Secretory pathway protein knockdown.
a, Relative expression of Sec61a1 and Sec61a2 mRNA was reduced in MEFs after CRISPR- Cas9-mediated deletion of both Sec61a1 and Sec61a2 compared to control wild-type MEFs (representative results from n = 3 biological repeats; mean and SD errors are shown *p = 0.0159, p = 0.0143 for Sec61a1 levels; ***p = 0.0007, p = 0.0002 for Sec61a2 levels, two-tailed unpaired t-test). b, Immunofluorescence analysis of collagen-I entry into the ER (detected via the marker calnexin) showed little co-localization of collagen-I and calnexin in Sec61a1 and Sec61a2 KO MEFs compared to wild-type MEFs. c, Relative expression of Mia3 mRNA was reduced in MEFs treated with siRNA targeting Mia3 compared to cells treated with scrambled control siRNA (representative results each showing similar degree of knockdown, n = 3 independent experiments, mean and SD errors are shown; ***p = 0.0004 for KD#2 and #9, two-tailed unpaired t-test). d, Relative expression of Pde4d mRNA was reduced in MEFs treated with siRNA targeting Pde4d compared to cells treated with scrambled control siRNA (n = 3 independent experiments; mean and SD errors shown, ***p = 0.0001, two-tailed unpaired t-test). e, Western blot analysis of MEFs treated with siRNAs targeting Pde4d showed depletion of PDE4D protein (Pde4d KD). Levels of GAPDH protein served as a loading control. f, Relative expression of Vps33b mRNA was significantly reduced in MEFs treated with CRISPR/Cas9n targeting Vps33b compared to control. Controls were wild-type MEFs that underwent electroporation with Cas9 protein but without gRNA (n = 3 biologically independent experiments; mean and SD errors are shown, **p = 0.021, two-tailed t-test). g, Relative expression of Vps33b mRNA in iTTFs after CRISPR/Cas9- mediated deletion of Vps33b (n = 3 biologically independent experiments; mean and SD errors shown, **p = 0.024, two-tailed t-test). h, Western blot analysis of VPS33b protein from Vps33b KO immortalized tail tendon fibroblasts (iTTFs). Vinculin protein served as a loading control. i, TEM of mouse tail tendons prepared in PBS, n = 2. Bar, 1 μm. j, TEM of mouse tail tendons after disruption in SL-DOC and collection by centrifugation, n = 2. Bar, 1 μm. k, Diameter distribution of collagen fibrils in unextracted tendon (untreated) and after extraction by SL-DOC (pellet). l, Hydroxyproline content of dissected tail tendons from mice incubated with SL-DOC. Data are expressed in percentage of total collagen extracted from tendons demonstrating that SL-DOC extracts ~ 18% of total collagen in the tendon (n = 2 animals). See also Statistical Source Extended Data Fig. 6 and Unprocessed Blots Extended Fig. 6. Source data
Extended Data Fig. 7. Rhythmic procollagen synthesis.
a, The 141 rhythmic proteins were separated into CT1-12 (day) and CT13-24 (night). The numbers of proteins in each group are shown. These two lists were analysed using ENRICHR, the significance of the enrichment of proteins within an ontology is shown on the right and is computed using Fisher’s exact test63. b, Gene ontology terms based on molecular function for each group are shown. c,d, Achilles and tail tendon tissues were harvested at the day phase (ZT3, day) or night phase (ZT15, night) and labelled with 14C-proline for 1 h in the presence of exogenous L-ascorbate. Higher incorporation of 14C was observed in the night phase in both Achilles (n = 6 animals; *p = 0.0423 two-tailed unpaired t-test) and tail tendons (tendons isolated from n = 3 animals; *p = 0.0395 two-tailed unpaired t-test). The central point indicates the mean values for each time point. e, Phosphoimager analysis of 1 h 14C-proline labelling of mouse Achilles tendon. Proteins were extracted into neutral buffer containing NP40 buffer extraction. Higher incorporation of 14C is observed in the night phase. f, Western blot analysis of the samples shown in e. Collagen-I was observed with an anti-collagen-I antibody. e and f are representative blots from two independent experiments consisting of all 8 time points. See also Statistical Source Data Extended Fig. 7 and Unprocessed Blots Extended Fig. 7. Source data
Extended Data Fig. 8. Rhythmic signal peptide-containing proteins.
a, Peptides in the time-series proteomics analysis (tail tendons from n = 4 independent animals) that contained a signal peptide were identified by overlapping the dataset with the signal peptide database41. The abundance of all signal peptide containing proteins was plotted as a function of circadian time (black). The abundance of the subset of rhythmic proteins (blue) exhibits two peaks at CT7–11 and CT27–31. b, A heat map of the twenty rhythmic signal peptide-containing proteins. See also Statistical Source Extended Data Fig. 8. Source data
Extended Data Fig. 9. SR9009 affects collagen fibril assembly.
a, Immunofluorescence analysis showed more collagen-I fibres assembled by the fibroblasts of ClockΔl9 mice. N = 3 biological repeats. Bars 10 μm. b, Kill curve of SR9009 showing that concentration of 10 μM (indicated with arrow) is well tolerated by WT and Δ19 fibroblasts. c,d, Luminometry recordings of circadian rhythms of dexamethasone-synchronized fibroblasts isolated from PER2::Luciferase (WT) and ClockΔ19::PER2::Luciferase (Δ19) mice. SR2.5, 2.5 μM SR9009. SR10, 10 μM SR9009. Arrow indicates addition of SR9009. e,f, Immunofluorescence analysis of wild-type and ClockΔ19 fibroblasts either treated with 10 μM SR9009 or mock-treated with dimethylsulfoxide (Ctrl). Blue, DAPI. Red, anti-collagen-I antibody. Number of DAPI-stained nuclei (that is number of cells) and number of fibres were blind scored from randomly- selected regions from n = 3 biological repeats by 3 observers. Number of collagen fibres per cell is shown for control and SR9009-treated fibroblasts. Fold change from qPCR analysis of gene expression is shown for control and SR9009-treated fibroblasts. *p = 0.0127, WT Ctrl vs WT + SR9009; ***p = 0.0005 Δ19Ctrl vs Δ19SR9009. Q-PCR analysis for SR9009-treated WT cells: *p = 0.0476, Sec61a2; *p = 0.0072, Mia3; **p = 0.0042, Serpinh1; *p = 0.0226, Pde4d. Q-PCR analysis for SR9009-treated Δ19 cells: **p = 0.0072, Vps33b; two-tailed paired t-test, n = 4 biological replicates. Bars show s.e.m.
Supplementary Material
Acknowledgements
The research was funded by Wellcome (110126/Z/15/Z and 203128/Z/16/Z), MRC (MR/P010709/1) and Arthritis Research UK (20875). VM was supported by a studentship from the Sir Richard Stapley Educational Trust. JS was funded by a Biotechnology and Biological Sciences Research Council (BBSRC) David Phillips Fellowship (BB/L024551/1). BC is supported by a Wellcome 4-year PhD studentship (210062/Z/17/Z). HR-H is supported by a University of Manchester 4-year PhD studentship. The authors would like to thank Ronen Schweitzer (Shriners Hospital for Children, Portland, OR, USA) for Scx-Cre mice, Alison Hallworth and Raymond Hodgkiss and the University of Manchester Biological Support Facility for assistance in animal welfare and husbandry, and Michal Dudek and Nan Yang (University of Manchester) for assistance with bioluminescence imaging. The proteomics was performed at the Biological Mass Spectrometry Facility in the Faculty of Biology, Medicine and Health (University of Manchester) with the assistance of Stacey Warwood and Ronan O’Cualain, and electron microscopy was performed in the Electron Microscopy Facility, Faculty of Biology, Medicine and Health (University of Manchester).
Footnotes
Author contributions
JC, AP, C-YCY and RG designed and performed experiments, interpreted data and drafted the manuscript. DFH, YL, BC and HR-H designed and performed experiments and interpreted data. VM, JS and AA contributed materials and analysis tools. OJ and TS supervised the mathematical aspects of the research. Q-JM and KEK conceived the project, and supervised the experiments. KEK wrote the manuscript.
Competing interests
The authors declare no competing interests.
Code availability
The code for the secretory pathway model was written in Mathematica (version 11.3) and is available from GitHub at this address: https://github.com/bcalvr/Col1_005
Data and Software Availability
The mouse tail tendon time-series microarray data 56 have been deposited to Array Express repository with the dataset identifier (ArrayExpress accession number E-MTAB-7743). The mass spectrometry proteomics data have been deposited to the ProteomeXchange Consortium via the PRIDE [1] partner repository with the dataset identifier PXD013450. All other data supporting the study is available from the corresponding authors on reasonable request.
References
- 1.Thul PJ, et al. A subcellular map of the human proteome. Science. 2017;356 doi: 10.1126/science.aal3321. [DOI] [PubMed] [Google Scholar]
- 2.Parry DA, Craig AS. Quantitative electron microscope observations of the collagen fibrils in rat-tail tendon. Biopolymers. 1977;16:1015–1031. doi: 10.1002/bip.1977.360160506. [DOI] [PubMed] [Google Scholar]
- 3.Wickstrom SA, Fassler R. Regulation of membrane traffic by integrin signaling. Trends Cell Biol. 2011;21:266–273. doi: 10.1016/j.tcb.2011.02.003. [DOI] [PubMed] [Google Scholar]
- 4.Kalson NS, et al. A structure-based extracellular matrix expansion mechanism of fibrous tissue growth. Elife. 2015;4 doi: 10.7554/eLife.05958. [DOI] [PMC free article] [PubMed] [Google Scholar]
- 5.Verzijl N, et al. Effect of collagen turnover on the accumulation of advanced glycation end products. J Biol Chem. 2000;275:39027–39031. doi: 10.1074/jbc.M006700200. [DOI] [PubMed] [Google Scholar]
- 6.Thorpe CT, et al. Aspartic acid racemization and collagen degradation markers reveal an accumulation of damage in tendon collagen that is enhanced with aging. J Biol Chem. 2010;285:15674–15681. doi: 10.1074/jbc.M109.077503. [DOI] [PMC free article] [PubMed] [Google Scholar]
- 7.Heinemeier KM, Schjerling P, Heinemeier J, Magnusson SP, Kjaer M. Lack of tissue renewal in human adult Achilles tendon is revealed by nuclear bomb (14)C. FASEB J. 2013;27:2074–2079. doi: 10.1096/fj.12-225599. [DOI] [PMC free article] [PubMed] [Google Scholar]
- 8.Sivan SS, et al. Collagen turnover in normal and degenerate human intervertebral discs as determined by the racemization of aspartic acid. J Biol Chem. 2008;283:8796–8801. doi: 10.1074/jbc.M709885200. [DOI] [PubMed] [Google Scholar]
- 9.Dideriksen K, et al. Effect of acute exercise on patella tendon protein synthesis and gene expression. Springerplus. 2013;2:109. doi: 10.1186/2193-1801-2-109. [DOI] [PMC free article] [PubMed] [Google Scholar]
- 10.Langberg H, Skovgaard D, Petersen LJ, Bulow J, Kjaer M. Type I collagen synthesis and degradation in peritendinous tissue after exercise determined by microdialysis in humans. J Physiol. 1999;521(Pt 1):299–306. doi: 10.1111/j.1469-7793.1999.00299.x. [DOI] [PMC free article] [PubMed] [Google Scholar]
- 11.Pedersen BJ, Schlemmer A, Rosenquist C, Hassager C, Christiansen C. Circadian rhythm in type I collagen formation in postmenopausal women with and without osteopenia. Osteoporos Int. 1995;5:472–477. doi: 10.1007/BF01626611. [DOI] [PubMed] [Google Scholar]
- 12.Bollen AM, Martin MD, Leroux BG, Eyre DR. Circadian variation in urinary excretion of bone collagen cross-links. J Bone Miner Res. 1995;10:1885–1890. doi: 10.1002/jbmr.5650101207. [DOI] [PubMed] [Google Scholar]
- 13.Cermakian N, Sassone-Corsi P. Multilevel regulation of the circadian clock. Nat Rev Mol Cell Biol. 2000;1:59–67. doi: 10.1038/35036078. [DOI] [PubMed] [Google Scholar]
- 14.Dudek M, et al. The chondrocyte clock gene Bmal1 controls cartilage homeostasis and integrity. J Clin Invest. 2016;126:365–376. doi: 10.1172/JCI82755. [DOI] [PMC free article] [PubMed] [Google Scholar]
- 15.Dudek M, et al. The intervertebral disc contains intrinsic circadian clocks that are regulated by age and cytokines and linked to degeneration. Ann Rheum Dis. 2017;76:576–584. doi: 10.1136/annrheumdis-2016-209428. [DOI] [PMC free article] [PubMed] [Google Scholar]
- 16.Bunger MK, et al. Progressive arthropathy in mice with a targeted disruption of the Mop3/Bmal-1 locus. Genesis. 2005;41:122–132. doi: 10.1002/gene.20102. [DOI] [PubMed] [Google Scholar]
- 17.Yeung CY, et al. Gremlin-2 is a BMP antagonist that is regulated by the circadian clock. Sci Rep. 2014;4:5183. doi: 10.1038/srep05183. [DOI] [PMC free article] [PubMed] [Google Scholar]
- 18.Sulli G, et al. Pharmacological activation of REV-ERBs is lethal in cancer and oncogene-induced senescence. Nature. 2018;553:351–355. doi: 10.1038/nature25170. [DOI] [PMC free article] [PubMed] [Google Scholar]
- 19.Hirota T, et al. Identification of small molecule activators of cryptochrome. Science. 2012;337:1094–1097. doi: 10.1126/science.1223710. [DOI] [PMC free article] [PubMed] [Google Scholar]
- 20.Sherratt MJ, Graham HK, Kielty CM, Holmes DF. Mass-mapping of ECM macromolecules by scanning transmission electron microscopy. Methods Mol Biol. 2009;522:151–161. doi: 10.1007/978-1-59745-413-1_9. [DOI] [PubMed] [Google Scholar]
- 21.Janich P, Arpat AB, Castelo-Szekely V, Lopes M, Gatfield D. Ribosome profiling reveals the rhythmic liver translatome and circadian clock regulation by upstream open reading frames. Genome Res. 2015;25:1848–1859. doi: 10.1101/gr.195404.115. [DOI] [PMC free article] [PubMed] [Google Scholar]
- 22.Meacock SL, Greenfield JJ, High S. Protein targeting and translocation at the endoplasmic reticulum membrane--through the eye of a needle? Essays Biochem. 2000;36:1–13. doi: 10.1042/bse0360001. [DOI] [PubMed] [Google Scholar]
- 23.Saito K, et al. TANGO1 facilitates cargo loading at endoplasmic reticulum exit sites. Cell. 2009;136:891–902. doi: 10.1016/j.cell.2008.12.025. [DOI] [PubMed] [Google Scholar]
- 24.Cancino J, et al. Control systems of membrane transport at the interface between the endoplasmic reticulum and the Golgi. Dev Cell. 2014;30:280–294. doi: 10.1016/j.devcel.2014.06.018. [DOI] [PubMed] [Google Scholar]
- 25.Banushi B, et al. Regulation of post-Golgi LH3 trafficking is essential for collagen homeostasis. Nat Commun. 2016;7:12111. doi: 10.1038/ncomms12111. [DOI] [PMC free article] [PubMed] [Google Scholar]
- 26.Kreft L, et al. ConTra v3: a tool to identify transcription factor binding sites across species, update 2017. Nucleic Acids Res. 2017;45:W490–W494. doi: 10.1093/nar/gkx376. [DOI] [PMC free article] [PubMed] [Google Scholar]
- 27.Bromme D, Okamoto K, Wang BB, Biroc S. Human cathepsin O2, a matrix proteindegrading cysteine protease expressed in osteoclasts. Functional expression of human cathepsin O2 in Spodoptera frugiperda and characterization of the enzyme. J Biol Chem. 1996;271:2126–2132. doi: 10.1074/jbc.271.4.2126. [DOI] [PubMed] [Google Scholar]
- 28.Everts V, et al. Cathepsin K deficiency in pycnodysostosis results in accumulation of non-digested phagocytosed collagen in fibroblasts. Calcif Tissue Int. 2003;73:380–386. doi: 10.1007/s00223-002-2092-4. [DOI] [PubMed] [Google Scholar]
- 29.Stefanovic L, Longo L, Zhang Y, Stefanovic B. Characterization of binding of LARP6 to the 5’ stem-loop of collagen mRNAs: implications for synthesis of type I collagen. RNA Biol. 2014;11:1386–1401. doi: 10.1080/15476286.2014.996467. [DOI] [PMC free article] [PubMed] [Google Scholar]
- 30.Park E, Rapoport TA. Mechanisms of Sec61/SecY-mediated protein translocation across membranes. Annu Rev Biophys. 2012;41:21–40. doi: 10.1146/annurev-biophys-050511-102312. [DOI] [PubMed] [Google Scholar]
- 31.Van den Berg B, et al. X-ray structure of a protein-conducting channel. Nature. 2004;427:36–44. doi: 10.1038/nature02218. [DOI] [PubMed] [Google Scholar]
- 32.Raote I, et al. TANGO1 builds a machine for collagen export by recruiting and spatially organizing COPII, tethers and membranes. Elife. 2018;7 doi: 10.7554/eLife.32723. [DOI] [PMC free article] [PubMed] [Google Scholar]
- 33.Ishida Y, Nagata K. Hsp47 as a collagen-specific molecular chaperone. Methods Enzymol. 2011;499:167–182. doi: 10.1016/B978-0-12-386471-0.00009-2. [DOI] [PubMed] [Google Scholar]
- 34.Schwanhausser B, et al. Global quantification of mammalian gene expression control. Nature. 2011;473:337–342. doi: 10.1038/nature10098. [DOI] [PubMed] [Google Scholar]
- 35.Humphries SM, Lu Y, Canty EG, Kadler KE. Active negative control of collagen fibrillogenesis in vivo. Intracellular cleavage of the type I procollagen propeptides in tendon fibroblasts without intracellular fibrils. J Biol Chem. 2008;283:12129–12135. doi: 10.1074/jbc.M708198200. [DOI] [PubMed] [Google Scholar]
- 36.Lin Y, et al. Sodium laurate, a novel protease- and mass spectrometry-compatible detergent for mass spectrometry-based membrane proteomics. PLoS One. 2013;8:e59779. doi: 10.1371/journal.pone.0059779. [DOI] [PMC free article] [PubMed] [Google Scholar]
- 37.Hoyle NP, et al. Circadian actin dynamics drive rhythmic fibroblast mobilization during wound healing. Sci Transl Med. 2017;9 doi: 10.1126/scitranslmed.aal2774. [DOI] [PMC free article] [PubMed] [Google Scholar]
- 38.Hojima Y, McKenzie JA, van der Rest M, Prockop DJ. Type I procollagen N-proteinase from chick embryo tendons. Purification of a new 500-kDa form of the enzyme and identification of the catalytically active polypeptides. J Biol Chem. 1989;264:11336–11345. [PubMed] [Google Scholar]
- 39.Hojima Y, van der Rest M, Prockop DJ. Type I procollagen carboxyl-terminal proteinase from chick embryo tendons. Purification and characterization. J Biol Chem. 1985;260:15996–16003. [PubMed] [Google Scholar]
- 40.Canty EG, et al. Coalignment of plasma membrane channels and protrusions (fibripositors) specifies the parallelism of tendon. J Cell Biol. 2004;165:553–563. doi: 10.1083/jcb.200312071. [DOI] [PMC free article] [PubMed] [Google Scholar]
- 41.Choo KH, Tan TW, Ranganathan S. SPdb--a signal peptide database. BMC Bioinformatics. 2005;6:249. doi: 10.1186/1471-2105-6-249. [DOI] [PMC free article] [PubMed] [Google Scholar]
- 42.Vitaterna MH, et al. Mutagenesis and mapping of a mouse gene, Clock, essential for circadian behavior. Science. 1994;264:719–725. doi: 10.1126/science.8171325. [DOI] [PMC free article] [PubMed] [Google Scholar]
- 43.Dierickx P, et al. SR9009 has REV-ERB-independent effects on cell proliferation and metabolism. Proc Natl Acad Sci U S A. 2019;116:12147–12152. doi: 10.1073/pnas.1904226116. [DOI] [PMC free article] [PubMed] [Google Scholar]
- 44.Toyama BH, Hetzer MW. Protein homeostasis: live long, won’t prosper. Nat Rev Mol Cell Biol. 2013;14:55–61. doi: 10.1038/nrm3496. [DOI] [PMC free article] [PubMed] [Google Scholar]
- 45.Szczesny SE, Fetchko KL, Dodge GR, Elliott DM. Evidence that interfibrillar load transfer in tendon is supported by small diameter fibrils and not extrafibrillar tissue components. J Orthop Res. 2017;35:2127–2134. doi: 10.1002/jor.23517. [DOI] [PMC free article] [PubMed] [Google Scholar]
- 46.Hansen U, Bruckner P. Macromolecular specificity of collagen fibrillogenesis: fibrils of collagens I and XI contain a heterotypic alloyed core and a collagen I sheath. J Biol Chem. 2003;278:37352–37359. doi: 10.1074/jbc.M304325200. [DOI] [PubMed] [Google Scholar]
- 47.Iozzo RV. Matrix proteoglycans: from molecular design to cellular function. Annu Rev Biochem. 1998;67:609–652. doi: 10.1146/annurev.biochem.67.1.609. [DOI] [PubMed] [Google Scholar]
- 48.Wenstrup RJ, et al. Type V collagen controls the initiation of collagen fibril assembly. J Biol Chem. 2004;279:53331–53337. doi: 10.1074/jbc.M409622200. [DOI] [PubMed] [Google Scholar]
- 49.Danielson KG, et al. Targeted disruption of decorin leads to abnormal collagen fibril morphology and skin fragility. J Cell Biol. 1997;136:729–743. doi: 10.1083/jcb.136.3.729. [DOI] [PMC free article] [PubMed] [Google Scholar]
- 50.Benjamini Y, H Y. Controlling the False Discovery Rate: A Practical and Powerful Approach to Multiple Testing. Journal of the Royal Statistical Society Series B (Methodological) 1995;57:289–300. [Google Scholar]
- 51.Kuleshov MV, et al. Enrichr: a comprehensive gene set enrichment analysis web server 2016 update. Nucleic Acids Res. 2016;44:W90-97. doi: 10.1093/nar/gkw377. [DOI] [PMC free article] [PubMed] [Google Scholar]
- 52.Vitaterna MH, et al. Mutagenesis and mapping of a mouse gene, Clock, essential for circadian behavior. Science. 1994;264:719–725. doi: 10.1126/science.8171325. [DOI] [PMC free article] [PubMed] [Google Scholar]
- 53.Blitz E, et al. Bone ridge patterning during musculoskeletal assembly is mediated through SCX regulation of Bmp4 at the tendon-skeleton junction. Dev Cell. 2009;17:861–873. doi: 10.1016/j.devcel.2009.10.010. [DOI] [PMC free article] [PubMed] [Google Scholar]
- 54.Storch KF, et al. Intrinsic circadian clock of the mammalian retina: importance for retinal processing of visual information. Cell. 2007;130:730–741. doi: 10.1016/j.cell.2007.06.045. [DOI] [PMC free article] [PubMed] [Google Scholar]
- 55.Yoo SH, et al. PERIOD2::LUCIFERASE real-time reporting of circadian dynamics reveals persistent circadian oscillations in mouse peripheral tissues. Proc Natl Acad Sci U S A. 2004;101:5339–5346. doi: 10.1073/pnas.0308709101. [DOI] [PMC free article] [PubMed] [Google Scholar]
- 56.Yeung CY, et al. Gremlin-2 is a BMP antagonist that is regulated by the circadian clock. Sci Rep. 2014;4:5183. doi: 10.1038/srep05183. [DOI] [PMC free article] [PubMed] [Google Scholar]
- 57.Yeung CY, et al. Chick tendon fibroblast transcriptome and shape depend on whether the cell has made its own collagen matrix. Sci Rep. 2015;5:13555. doi: 10.1038/srep13555. [DOI] [PMC free article] [PubMed] [Google Scholar]
- 58.Alvarez MB, et al. Immortalization and characterization of osteoblast cell lines generated from wild-type and Nmp4-null mouse bone marrow stromal cells using murine telomerase reverse transcriptase (mTERT) J Cell Physiol. 2012;227:1873–1882. doi: 10.1002/jcp.22915. [DOI] [PMC free article] [PubMed] [Google Scholar]
- 59.Livak KJ, Schmittgen TD. Analysis of relative gene expression data using real-time quantitative PCR and the 2(-Delta Delta C(T)) Method. Methods. 2001;25:402–408. doi: 10.1006/meth.2001.1262. [DOI] [PubMed] [Google Scholar]
- 60.Starborg T, et al. Using transmission electron microscopy and 3View to determine collagen fibril size and three-dimensional organization. Nat Protoc. 2013;8:1433–1448. doi: 10.1038/nprot.2013.086. [DOI] [PMC free article] [PubMed] [Google Scholar]
- 61.Kalson NS, et al. An experimental model for studying the biomechanics of embryonic tendon: Evidence that the development of mechanical properties depends on the actinomyosin machinery. Matrix Biol. 2010;29:678–689. doi: 10.1016/j.matbio.2010.08.009. [DOI] [PMC free article] [PubMed] [Google Scholar]
- 62.Sherratt MJ, Graham HK, Kielty CM, Holmes DF. Mass-mapping of ECM macromolecules by scanning transmission electron microscopy. Methods Mol Biol. 2009;522:151–161. doi: 10.1007/978-1-59745-413-1_9. [DOI] [PubMed] [Google Scholar]
- 63.Bekker-Jensen DB, et al. An Optimized Shotgun Strategy for the Rapid Generation of Comprehensive Human Proteomes. Cell Syst. 2017;4:587–599.:e584. doi: 10.1016/j.cels.2017.05.009. [DOI] [PMC free article] [PubMed] [Google Scholar]
- 64.Goeminne LJ, Gevaert K, Clement L. Peptide-level Robust Ridge Regression Improves Estimation, Sensitivity, and Specificity in Data-dependent Quantitative Label-free Shotgun Proteomics. Mol Cell Proteomics. 2016;15:657–668. doi: 10.1074/mcp.M115.055897. [DOI] [PMC free article] [PubMed] [Google Scholar]
- 65.Tyanova S, et al. The Perseus computational platform for comprehensive analysis of (prote)omics data. Nat Methods. 2016;13:731–740. doi: 10.1038/nmeth.3901. [DOI] [PubMed] [Google Scholar]
- 66.Kammers K, Cole RN, Tiengwe C, Ruczinski I. Detecting Significant Changes in Protein Abundance. EuPA Open Proteom. 2015;7:11–19. doi: 10.1016/j.euprot.2015.02.002. [DOI] [PMC free article] [PubMed] [Google Scholar]
- 67.Smyth GK. Linear models and empirical bayes methods for assessing differential expression in microarray experiments. Stat Appl Genet Mol Biol. 2004;3 doi: 10.2202/1544-6115.1027. Article3. [DOI] [PubMed] [Google Scholar]
- 68.Benjamini Y, H Y. Controlling the False Discovery Rate: A Practical and Powerful Approach to Multiple Testing. Journal of the Royal Statistical Society Series B (Methodological) 1995;57:289–300. [Google Scholar]
- 69.Wu G, Anafi RC, Hughes ME, Kornacker K, Hogenesch JB. MetaCycle: an integrated R package to evaluate periodicity in large scale data. Bioinformatics. 2016;32:3351–3353. doi: 10.1093/bioinformatics/btw405. [DOI] [PMC free article] [PubMed] [Google Scholar]
- 70.Ihaka R, Gentleman R. R: A Language for Data Analysis and Graphics. Journal of Computational and Graphical Statistics. 1996;5:299–314. [Google Scholar]
Associated Data
This section collects any data citations, data availability statements, or supplementary materials included in this article.
Supplementary Materials
Data Availability Statement
The code for the secretory pathway model was written in Mathematica (version 11.3) and is available from GitHub at this address: https://github.com/bcalvr/Col1_005
The mouse tail tendon time-series microarray data 56 have been deposited to Array Express repository with the dataset identifier (ArrayExpress accession number E-MTAB-7743). The mass spectrometry proteomics data have been deposited to the ProteomeXchange Consortium via the PRIDE [1] partner repository with the dataset identifier PXD013450. All other data supporting the study is available from the corresponding authors on reasonable request.


