Abstract
Spectral similarity calculation is widely used in protein identification tools and mass spectra clustering algorithms while comparing theoretical or experimental spectra. The performance of the spectral similarity calculation plays an important role in these tools and algorithms especially in the analysis of large-scale datasets. Recently, deep learning methods have been proposed to improve the performance of clustering algorithms and protein identification by training the algorithms with existing data and the use of multiple spectra and identified peptide features. While the efficiency of these algorithms is still under study in comparison with traditional approaches, their application in proteomics data analysis is becoming more common. Here, we propose the use of deep learning to improve spectral similarity comparison. We assessed the performance of deep learning for spectral similarity, with GLEAMS and a newly trained embedder model (DLEAMSE), which uses high-quality spectra from PRIDE Cluster. Also, we developed a new bioinformatics tool (mslookup - https://github.com/bigbio/DLEAMSE/) that allows users to quickly search for spectra in previously identified mass spectra publish in public repositories and spectral libraries. Finally, we released a human database to enable bioinformaticians and biologists to search for identified spectra in their machines.
Keywords: Spectral Similarity, Scoring function, Deep Learning, Mass Spectra Embedder
1. Introduction
Mass spectrometry (MS) based proteomics has become an indispensable tool for protein identification.[1] In a typical MS-based bottom-up proteomics experiment, proteins are extracted from samples and enzyme-digested into peptides, which are separated by chromatography, ionized, and resolved in tandem mass spectrometry, resulting in millions of tandem mass spectrometry (MS/MS) scans [2]. The resulted MS/MS spectra are assigned peptide sequences using different computational methods with spectral similarity scoring as the core calculation [3]. These spectral similarity scorings compare each query MS/MS spectrum against a target MS/MS spectrum set obtained either theoretically derived from peptide sequences (database search algorithms), or from previously acquired MS/MS spectra (spectral library algorithms). The first kind of approaches is typically adopted in database searching engines, such as Mascot [4], MaxQuant [5], MS-GF+ [6], while the latter is used in spectral clustering tools such as MaRaCluster [7], PRIDE Cluster [8, 9] and MS-Cluster [10], or spectral library searching engines such as SpectraST [11–15], pMatch [16], and Pepitome [17]. Spectral similarity calculation even allowed the differential expression analysis of proteins without a reference sequence [18]. Therefore, the performance of spectral similarity calculation plays an important role in proteomics data analyzes.
Multiple methods are used to compare theoretical or experimental mass spectra during clustering or peptide identification algorithm. Dot product (DP) based algorithm is one of the most widely used methods for MS/MS spectral similarity scoring, especially in many spectrum library search algorithms [11, 19–24]. Shao et al. summarized 12 spectral library search tools and 10 of which used the DP-based method in 2017 [25]. To assess the performance of the scoring algorithms, Yilmaz et al. evaluated 5 of them in 2017 and concluded that Pearson’s r, as well as normalized dot product (NDP), is the best performance and most robust approaches [3]. The conventional process of general spectral similarity scoring methods includes three steps [25, 26]: features extraction, ion peak intensity transformation, and the core scoring function. These steps are repeated in every analysis job for each spectrum, which could cause the waste of computing resources and time. Even inside a single analysis job, the core scoring function is applied many times (e.g., in spectral clustering processes). Reducing these repeated calculations in the large-scale spectral analysis would significantly improve computing efficiency.
Deep learning-based [27] tools for mass spectrometry-based proteomics has been proposed including: (DeepNovo [28]) for de novo identification, (pDeep [29, 30], Prosit [31]) for peptide-protein identification using predicted theoretical spectra and simulating spectra for spectral library generation, and (GLEAMS - deep neural network-based learning model) [32] for spectral clustering. GLEAMS enable embedding the high-dimensional spectra features into a low-dimensional hidden space in which spectra generated by the same peptide are close to each other. GLEAMS’s results can be further clustered into “communities” for detecting groups of unidentified, proximal spectra representing the same peptide, revealing misidentified or assigning peptide sequences to the consistently unidentified spectra. With a deep learning network’s ability to learn the implicit and effective features from large-scale training datasets, this model is hoped to have good prediction performance. However, the direct performance comparison between the deep learning model and the traditional method in spectral similarity scoring is still unknown though interesting.
Here, we extended the learning embedder models for spectral similarity search. We assessed the performances of deep learning embedder models (GLEAMS) and a new proposed model (DLEAMSE - Deep LEArning-based Mass Spectra Embedder) trained by using the PRIDE Cluster [9] data) on spectral similarity, and compared them with five traditional spectral similarity scoring methods: Pearson's r, Spearman's rho, NDP, DP, mean squared error (MSE). Experiments show that the deep learning model is computationally more efficient, without a major difference in the accuracy compared to the best traditional methods: NDP and Pearson's r. Besides, we developed a new bioinformatics tool (mslookup - https://github.com/bigbio/DLEAMSE/) to enable bioinformaticians and biologists to search unidentified spectra on previously identified spectra. Finally, we released a human database to enable bioinformaticians and biologists to search for identified spectra in their machines.
2. Materials and Method
GLEAMS
GLEAMS [32] (GLEAMS is a Learned Embedding for Annotating Mass Spectra - https://bitbucket.org/noblelab/gleams), its main idea is using a deep neural network to embed tandem mass spectra into a 32-dimensional hidden space in such a way that spectra generated by the same peptide, with the same post-translational modifications and charge, are close together. Preprocessing before GLEAMS’ embedding is encoding, in which each input spectrum is encoded to a vector of 3,010 features in three types: precursor attributes (61 features), binned fragment intensities (2,449 features), and NDP similarities to a set of 500 reference spectra (500 features). Then the outputs of them are concatenated and passed to a final, fully connected layer with dimension 32, as the final output. Siamese network [33] is adopted for training the weights of the deep learning model, with positive and negative spectral pairs as the training and test data. More than five million mass spectra from 22 publicly available experiments, were used to train and validate the GLEAMS model.
Similarity scoring methods for benchmark
In addition to the GLEAMS and the proposed method DLEAMSE, the Euclidean distance between the pair of embedded vectors in the hidden space is calculated as the similarity measure of the pair of spectra using:
-
1-
Normalized dot product (NDP): After the top n peaks are binned, the spectral pair can be considered as two n dimension vectors, and the cosine distance between the vectors is calculated as the spectral similarity.
-
2-
Correlation coefficients: Some statistical correlation coefficients, such as Pearson’s r and Spearman’s rho, have also been used to calculate spectral similarities [34, 35]. Correlation coefficients provide the measuring of the linear relationship between two random variables.
-
3-
Mean squared error (MSE): is an estimator based on the differences between two datasets. For MS/MS spectra, let x and y represent two spectra with n binned peaks’ intensity. The differences between x and y are squared and then divided by the number of elements [3].
For convenience, we used the Spectrum_similarity-1.0 tool [3] (https://github.com/compomics/spectrum_similarity) to calculate these similarity scoring functions (except the deep learning models). This tool allows users to compare spectra in .mgf files, its result file contains spectra pairs and their corresponding five similarity scores (Pearson's r, Spearman's rho, NDP, DP, MSE).
Benchmark datasets to assess scoring
The benchmark data comes from three species: Yeast-UPS, Arabidopsis, and Mouse. The Yeast-UPS data comes from study-6 of CPTAC (Clinical Proteomic Technology Assessment for Cancer). The others come from PXD000223 [36] (Arabidopsis) and PXD000625 [37] (Mouse). Positive and negative spectral pairs are prepared from these species for assessing the performance of scoring functions, based on the MaxQuant searching results (see details of the building of these test data for spectral similarity assessing in Supplementary Note 3).
Performance evaluation metrics
To assess the performance of DLEAMSE and other spectral similarity scoring methods, we used the receiver-operating characteristic (ROC) curve as well as AUC (the area under the roc curve). The closer the ROC curve to the left corner or the closer the AUC value to 1, the performance is better. And overall accuracy (ACC) [38] is employed in this study too, which is defined as:
| (1) |
Here, TP and TN represent the numbers of positive or negative spectral pairs that are correctly classified in prediction, FP and FN represent the numbers of positive or negative spectral pairs that be classified to wrong types, respectively.
3. Results
DLEAMSE
We first developed a new deep learning model (DLEAMSE - https://github.com/bigbio/mslookup) with an adjusted network (see the details of determining the deep learning network structure in Supplementary Note 1) based on the GLEAMS approach. PRIDE Cluster [9] was used to train and test the new model for the following reasons: i) the spectra in high-quality clusters contain consistently identified spectra; ii) the mass spectra from PRIDE Cluster covers more species and instrument types. Two filters were used for retrieving high confidence spectra. The first filter controls the quality of the collected clusters. We customized clustering-file-converter (https://github.com/spectra-cluster/clustering-file-converter) to retain the high-quality spectral clusters (cluster size >= 30, cluster ratio >= 0.8, and the total ions current (TIC) >= 0.2). The second filter eliminates duplicate clusters assigned with the same peptide sequence, only one in the duplicates has been chosen, to ensure that the retained clusters are from different peptides. Then 113,362 clusters have been retrained from PRIDE Cluster release 201504. The needed spectra in clusters are acquired from the PRIDE Archive. The training network of DLEAMSE is based on the Siamese network, which needs labeled spectral pairs as input. A pair of spectra coming from the same cluster is defined as positive spectral pair and labeled "1"; a pair of spectra coming from different clusters but within the precursor mass window is defined as negative spectral pair and labeled "0". Finally, a set of 730,823 spectra pairs was built, with 363,853 positive pairs and 366,970 negative pairs. According to the ratio around 9:1, the set was randomly divided into a training dataset and a test dataset (see details of training and testing dataset’s building process for deep learning model in Supplementary Note 2).
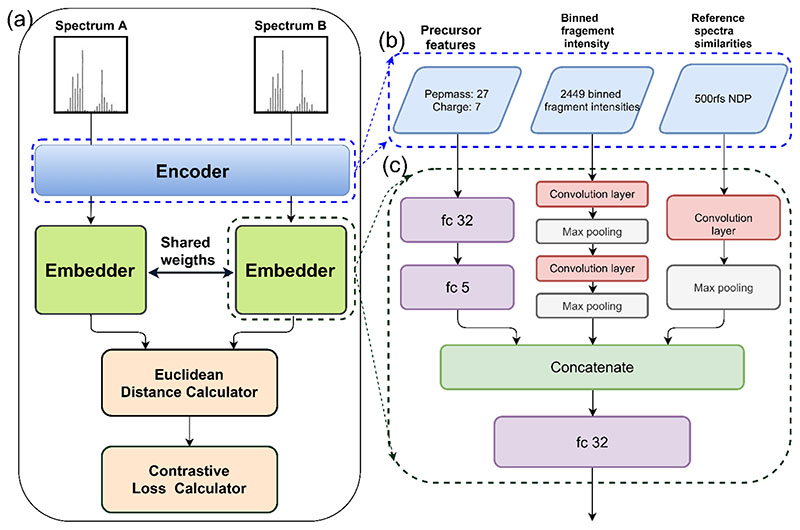
In DLEAMSE, the Siamese network (Figure 1a) trains two same embedding models (Figure 1c) with shared weights, and spectra are encoded by the same encoder (Figure 1b) before the embedding. (see details of determining of network structure and the final determined model in Supplementary Note 1). Based on the Euclidean distance between the pair of embedded spectra, the weights of the embedding model are learned by contrastive loss function that penalizes far-apart same-label spectra (label=1) and nearby different-label spectra (label=0). Backpropagation from the loss function is used to update the weights in the network. The codes are implemented in Python3 with the PyTorch framework [39].
Figure 1. The structure of the training Siamese network.
(a) The Siamese network: Spectrum A and spectrum B are firstly encoded by the encoder and passed to two instances of the embedder network, with tied weights. The Euclidean distance between the resulted embedded vectors is calculated and passed to a contrastive loss function that penalizes far-apart same-label spectra and nearby different-label spectra. (b) The encoder: each spectrum is encoded to a vector of 2,983 features in three types: 34 precursor attributes, 2,449 binned fragment intensities, and similarities to 500 reference spectra. (c) The embedder: three types of features are processed separately at first (precursor features are processed through a fully connected (fc) network, while the binned peaks are passed through a two-layer convolution and max pooling, and 500 similarities are processed through a single-layer convolution and max-pooling), then outputs are concatenated and passed through a final fc layer to generate 32D-vector.
Deep learning models vs traditional similarity methods
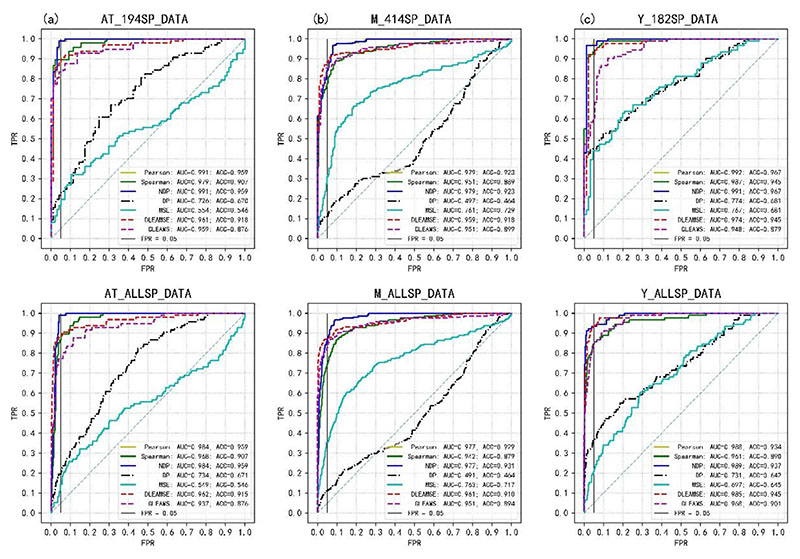
The accuracy of the two deep-learning models and the other five spectral similarity scorings (Pearson's r, and Spearman's rho, NDP, DP, MSE) were compared. Six datasets from three species are used in spectral similarity comparison, ROC curves of seven methods on these six datasets are shown in Figure 3, and their AUC and ACC values are presented in Supplementary Table 4. Pearson’s r and the NDP are the best performing methods while DP and MSE performed relatively poorly. This matches the results reported by Yilmaz et al. [3]. Supplementary Table 4 shows that the difference between DLEAMSE to NDP in AUCs ranged from -0.03 to - 0.004, and the differences in ACCs range from -0.041 to 0.008. This shows that DLEAMSE’s is slightly less accurate than the best traditional methods, such as NDP and Pearson’s r. Compare with GLEAMS, DLEAMSE shows superior performance in both measurements (AUC and ACC).
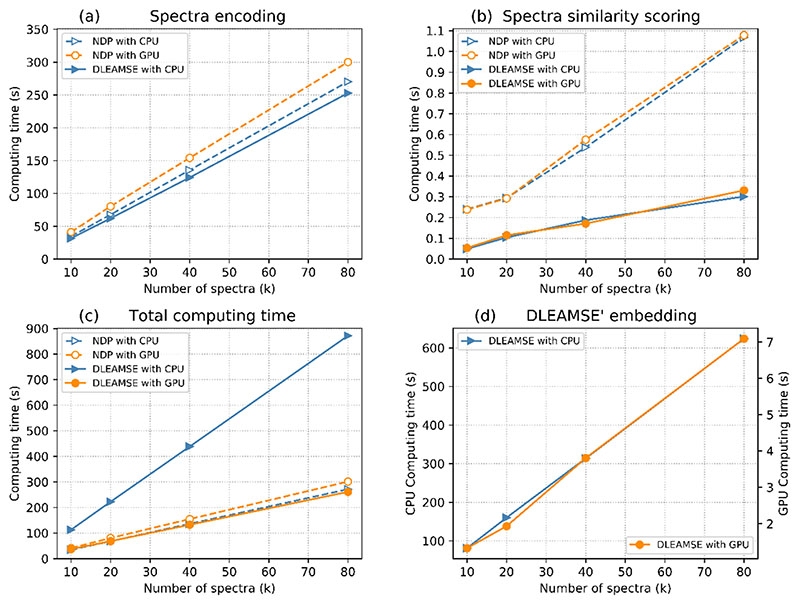
Figure 3. Computing time of all tasks (in CPU and GPU environments) as the number of spectra increase for NDP and DLEAMSE methods.
Computing performance benchmark
When analyzing large scale datasets, the computational cost of the mass spectra similarity function becomes increasingly important [9]. To evaluate the computing performance of deep learning models, compared with traditional methods, we recorded the running times (wall clock time) of normalized dot product similarity and DLEAMSE similarity scoring. Four spectra datasets containing 10,000, 20,000, 40,000, 80,000 (758 peaks in each spectrum on average) spectral pairs respectively were used. We thought the peak number in spectra also affects the computing performance of both methods. Hence a dataset contains 40,000 spectral pairs with 39 peaks in each spectrum on average, has been retrieved from contaminants spectral libraries provided by PRIDE Cluster for testing. Training, testing, and performance benchmark tasks were run on a computer with 48 Intel (R) Xeon (R) Gold 6126 CPU @ 2.60 GHz, a Tesla V100 Data Center GPU, and 128GB memory. The running environment was Ubuntu 18.04 LTS (GNU/Linux 4.15.0-20-generic x86_64), Anaconda3 (with Python 3.7.4), PyTorch-1.0.0. All run-times in this study are wall-clock time. Table 4 shows the run-times of NDP’s and GLEAMSE’s major subtasks on five data sets in CPU and GPU environments. The “encoding” subtask in NDP represents the preprocessing, which includes binning to 2449 bins and picking the top 100 peaks. Besides, the DLEAMSE has “embedding” and “model loading” subtasks rather than NDP.
Figure 3 illustrates the comparison in total run-time and subtasks’ run-times between NDP and DLEAMSE. DLEAMSE (on GPU) outperforms NDP (on CPU), while DLEAMSE on CPU is much slower than NDP in most of the tasks. The “encoding” subtasks are compared in Figure 3a. As shown, the “encoding” of NDP took more run-time than DLEAMSE’s in both CPU and GPU environments. The “similarity calculation” of NDP (dot product calculation on 2449 bins) took more time than DLEAMSE’s (Euclidean distance on 32-D vectors) in both CPU and GPU environment on four data sets (Figure 3b). The computing time in the GPU version is about 80 times faster than the CPU versions (Figure 3d). Compare NDP and DLEAMSE on the CPU environment, DLEAMSE outperforms NDP on “encoding” and “similarity calculation” in the first four test data sets (Supplementary Table 5). However, the “embedding” subtask, which contains computing on the deep network computing, slowed DLEAMSE down and multiplied the total computing times.
Besides the computing advantage on GPU servers, a deep learning-based model has another advantage for large-scale analysis: the encoding and embedding are only needed to run once for each spectrum and the output from embedding can be reused in subsequent analyses. The final similarity scoring is only based on Euclidean distance calculation, which is proved to be faster than the other part and takes about 1/3 of the NDP’s core calculation time.
mslookup tool
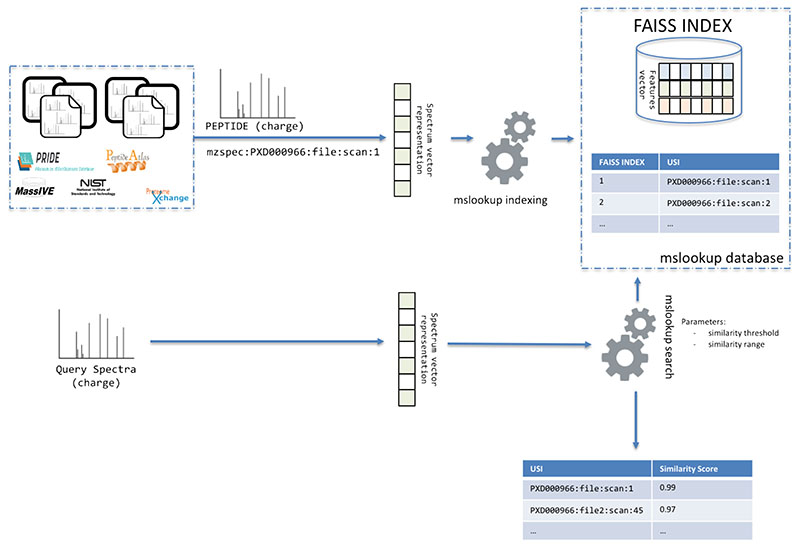
We used the new model DLEAMSE to implement a novel tool (mslookup - https://github.com/bigbio/DLEAMSE) for fast searching of MS/MS spectra previously identified in public proteomics databases (Figure 4). Spectra are encoded into a 32-feature vector as originally proposed by GLEAMS and the DLEAMSE model trained with PRIDE Cluster data. The vectors are stored in a faiss database (https://github.com/facebookresearch/faiss). In summary, faiss is a library for efficient similarity search and clustering of dense vectors. It contains algorithms that search in sets of vectors of any size, up to ones that possibly do not fit in RAM. faiss is written in C++ with complete wrappers for Python/NumPy and many algorithms support GPU. Also, a key-value pair file allows mslookup to retrieve for every faiss vector the unified spectrum identifier (USI - http://www.psidev.info/usi) of the spectra in ProteomeXchange [40]. By using the USI of each spectrum, the system does not need to store the actual MS/MS data after indexing but can use the respective ProteomeXchange resources to retrieve the MS/MS information (e.g., precursor charge and mz, or peak lists).
Figure 4.
mslookup creates a database from MS spectra by encoding peaks, charge and precursor mass into a 32-D vector. Additionally, the tool creates a key-value database that contains the 32-D representation and the Universal Spectrum Identifier (USI). When a user queries a spectra file against the database using the mslookup search tool, the query spectra is encoded and compare against the vector database (faiss) and a list of USIs are returned with the corresponding similarity score.
The indexing of the spectra can be distributed, incremental, and is extremely scalable for big datasets. The first step (embedder) allows transforming the spectra into a vector representation and USI. The mslookup command generates a USI file and an embedder file for each input spectra file. Then, the command makes faiss can be used to add the generated vectors to the database. These two steps will generate a ready to use the database for searching spectra against a database of identified spectra. mslookup is not a search engine or a spectral library identification tool but a fast-searching tool that suggests to the user previously identified spectra for their query spectra (e.g., unidentified and biological interested spectra). The search tool allows filtering by similarity score from 0 to 1, where higher scores are for more similar spectra. The output of the search tool is a JSON file with the USI in ProteomeXchange of all the spectra similar to the query spectra and the similarity score. A database of human identified spectra from PRIDE Cluster and NIST spectral libraries was created (ftp://ftp.pride.ebi.ac.uk/pride/data/proteogenomics/projects/mslookup/human-092020/). The original file size of all the spectra library files (MSP) data was 47G while the mslookup database is only 1G for the 32-feature vector database and more than 7 million for the USIs database. The mslookup tool allows having a centralized small database of previously published identified or unidentified spectra with references (USIs) to spectra in ProteomeXchange or other services that support USIs.
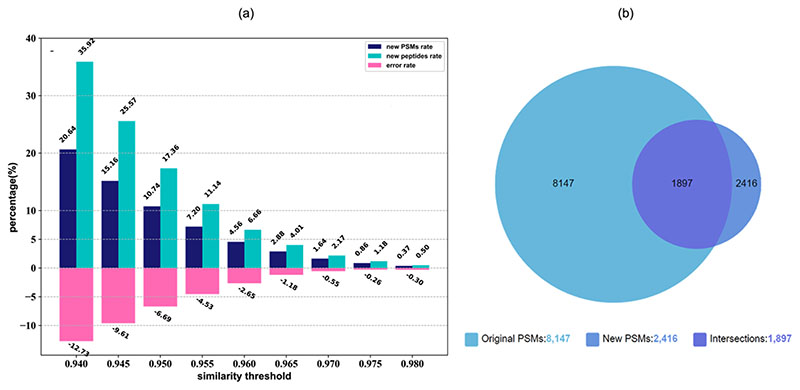
The accuracy of mslookup has been tested by querying an example Human proteomics experiment dataset against the mslookup database (version 092020). Peak and database search result files are collected from PXD002600, then the mslookup query results of these spectra have been compared with the original Mascot search results. Spectra matched by mslookup on similarity score thresholds from 0.94 to 0.99 have been tested, and each result set has been spliced into two subsets: (i) intersection with the original search results for calculating the error rates (the relative number of the spectra in intersection spectra, whose peptide assigned by mslookup is different from the original peptide); (ii) the rest as the new PSMs assigned by mslookup. Figure 5(a) shows that with a smaller similarity threshold, newer PSMs can be identified, but at an increased error rate. When threshold = 0.955, the error rate is 4.5%. At this error rate, we can identify about 9.7% new PSMs, and 15.9% new peptides compared to the original results. Figure 5(b) shows the numbers of PSMs in original searching, mslookup querying, and their intersection when the threshold = 0.955.
Figure 5.
(a) error rates, new PSMs rates, new peptides rates of mslookup queries on similarity thresholds from 0.94 to 0.98; (b) the Venn diagram to compare the number of original PSMs and new PSMs when threshold = 0.955.
Computing performance on searching
To evaluate if mslookup fit large scale spectral analysis, we tested the run-times of mslookup at different data scales and compared them to that of a popular spectral library software SpectraST. Four spectral libraries from the NIST human library (https://chemdata.nist.gov/mass-spc/ftp/download/peptide_library/libraries/human) are used as a library and query data (Supplementary Table 6). The server used for the test is a Linux server with 2 Intel(R) Xeon(R) Gold 6126 CPUs @2.60 GHz (each has 12 cores), a Tesla V100 Data Center GPU, and 128G memory. The operating environment is Ubuntu 18.04 LTS (GUN/Linux 4.15.0-20-generic x86 s64), Anaconda 4.5.11 (with Python3.7.0), torch-1.0.0. SpectraST in TPP (version 5.2.0), is compiled from source code.
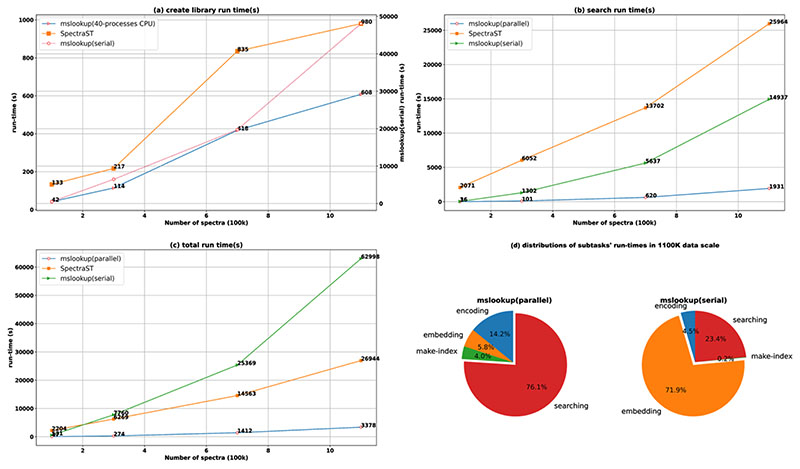
mslookup includes four subtasks: (i) encoding, (ii) embedding, (iii) creating-library (faiss indexing), (iv) and searching. SpectraST has two subtasks: (i) creating-library (from .msp file to. splib file), (ii) and searching. The searching in SpectraST includes the pre-processing of query spectra, which is similar to the encoding part in mslookup. This pre-processing step for each spectrum will be repeated in every search, though encoding and embedding for each spectrum are one-time subtasks and could be reused in the future. Supplementary Table 7 shows the run-times of SpectraST (serial), and that of mslookup both in serial and in parallel (with CPUs and GPUs). The searching step in mslookup only includes range-search (search database) in the faiss index, preparing the output in format is included in total times.
We found when running in serial (Supplementary Table 7 and Figure 6), mslookup is slower than SpectraST at all scales, its total run-time on 1000K data is 2.6-fold slower than SpectraST. The main reason is embedding by the deep network is a heavy subtask which accounts for most (72%) of the total time. For SpectraST, library searching accounts for most (96%) of the time, which includes the NDP calculation for candidate spectral pairs. However, with the support of parallel computing (using GPU in embedding, multi-process/multi-threads in other subtasks), mslookup gets a significant advantage in total run-time. As Figure 5(d) shows, as the number of spectra increases, the advantages of mslookup are getting more significant. At 1000K level, mslookup takes only 12.5% of SpectraST’s total time. The performance advantages mostly get from the time of mslookup's faiss index searching, which is only 7.4% that of SpectraST’s "spectra library searching" part. And this advantage could get more significant as the computing power increases, based on the faiss’ scalable feature.
Figure 6. Run-times of mslookup (in serial and parallel), and SpectraST.
(a) run-times of Encoding and Embedding in mslookup; (b) run-times of building a spectral library; (c) run-times of searching spectral library; (d) total run-times (includes creating a spectral library and searching the spectral library).
In serial computing, mslookup takes about doubled times than SpectraST, because of the expensive cost of deep network embedding. However, with the parallel computing support of GPUs, and with the powerful faiss indexing system, mslookup has better performance on large scale spectral data. Besides, the heavier subtasks (encoding + embedding) for each spectrum is a one-time calculation, which means when these spectra are analyzed in multi-times, the cost will be diluted as the number of analyses increases.
Conclusion
We assessed the deep learning-based models’ performance on spectral similarity and compared them with the traditional spectral similarity methods such as normalized dot product. Results showed that some traditional methods still have an advantage over the deep learning-based models. The performance deep learning model DLEAMSE is following the best methods (NDP and Pearson’s r) but even outperforms them in the Yeast-UPS datasets. Besides we also find there is some difference in the performances between GLEAMS and DLEAMSE, DLEAMSE outperformed GLEAMS in the tests, this may because of their different network structure or different training data.
While deep learning methods are outperformed inaccuracy by traditional similarity methods, they are better suited for big data analyses such as spectral clustering or similarity searching across millions of spectra. The main reason is that after the one-off embedding for each spectrum, the similarity between two spectra is a very simple Euclidean distance calculation on two 32-D vectors. Besides, our tests have shown that the deep learning model DLEAMSE can outperform NDP on the popular GPU servers on both “encoding + embedding” and core similarity calculation. Based on these results, we argue that it should be possible to leverage existing big data for the processing of all available proteomics data by using the deep learning model to embed the existing big number of spectra data to low-dimensional vectors and enable more big data analysis jobs with it. We explored the use of the DLEAMSE model to create a bioinformatic tool that allows searching spectra into previously identified spectra in ProteomeXchange. The mslookup can be used to create a database of spectra with links to stored spectra in ProteomeXchange, the size of the database is 40 times smaller than the original data. We created a database of 1 Gigabyte of 7.8 million human identified spectra from PRIDE Cluster and NIST libraries. The mslookup will enable the development of new architectures for large scale searching of identified spectra in ProteomeXchange.
Supplementary Material
Significance Statement.
Spectral similarity calculation plays an important role in proteomics data analysis. With deep learning’s ability to learn the implicit and effective features from large-scale training datasets, deep learning-based MS/MS spectra embedding models has emerged as a solution to improve mass spectral clustering similarity calculation algorithms. We compare multiple similarity scoring and deep learning methods in terms of accuracy (compute the similarity for a pair of the mass spectrum) and computing-time performance. The benchmark results showed no major differences in accuracy between DLEAMSE and normalized dot product for spectrum similarity calculations. The DLEAMSE GPU implementation is faster than NDP in preprocessing on the GPU server and the similarity calculation of DLEAMSE (Euclidean distance on 32-D vectors) takes about 1/3 of dot product calculations. The deep learning model (DLEAMSE) encoding and embedding steps needed to run once for each spectrum and the embedded 32-D points can be persisted in the repository for future comparison, which is faster for future comparisons and large-scale data. Based on these, we proposed a new tool mslookup that enables the researcher to find spectra previously identified in public data. The tool can be also used to generate in-house databases of previously identified spectra to share with other laboratories and consortiums.
Figure 2. ROC curves of seven spectral similarity scoring methods on Arabidopsis, Mouse, and Yeast-UPS datasets.
(a) ROC curves of seven spectral similarity scoring methods on AT_194SP_DATA and AT_ALLSP_DATA of Arabidopsis Thaliana. “Pearson” represents Pearson’s r; “Spearman” represents Spearman’s rho. (b) ROC curves of seven spectral similarity scoring methods on two datasets of Mouse. (c) ROC curves of seven spectral similarity scoring methods on two datasets of Yeast-UPS.
Funding
This work was funded by the Natural Science Foundation of Chongqing, China(cstc2018jcyjAX0225), State Key Laboratory of Proteomics (SKLP-K2017,05), and National Key Research and Development Program of China (2017YFA0505002 and 2017YFC0906602]. YPR is supported by Wellcome Trust [WT101477MA, 208391/Z/17/Z].
Abbreviation
- AUC
Area under the roc curve
- DP
Dot product
- MS
Mass spectrometry
- MS/MS
Tandem mass spectrometry
- MSE
Mean square error
- NDP
Normalized dot product
- Pearson’s r
Pearson’s correlation coefficients
- ROC
Receiver-operating characteristic
- Spearman’ rho
Spearman’s correlation coefficients
Footnotes
Conflict of Interest
The authors declare no conflict of interest.
References
- [1].Aebersold R, Mann M. Mass-spectrometric exploration of proteome structure and function. Nature. 2016;537:347. doi: 10.1038/nature19949. [DOI] [PubMed] [Google Scholar]
- [2].Manes NP, Nita-Lazar A. Application of targeted mass spectrometry in bottom-up proteomics for systems biology research. Journal of Proteomics. 2018;189:75–90. doi: 10.1016/j.jprot.2018.02.008. [DOI] [PMC free article] [PubMed] [Google Scholar]
- [3].Yilmaz Ş, Vandermarliere E, Martens L. In: Proteome Bioinformatics. Keerthikumar S, Mathivanan S, editors. Springer New York; New York, NY: 2017. Methods to Calculate Spectrum Similarity; pp. 75–100. [DOI] [PubMed] [Google Scholar]
- [4].Perkins DN, Pappin DJC, Creasy DM, Cottrell JS. Probability-based protein identification by searching sequence databases using mass spectrometry data. ELECTROPHORESIS. 1999;20(18):3551–3567. doi: 10.1002/(SICI)1522-2683(19991201)20:18<3551::AID-ELPS3551>3.0.CO;2-2. [DOI] [PubMed] [Google Scholar]
- [5].Cox J, Mann M. MaxQuant enables high peptide identification rates, individualized p.p.b.-range mass accuracies and proteome-wide protein quantification. Nat Biotechnol. 2008;26:1367. doi: 10.1038/nbt.1511. [DOI] [PubMed] [Google Scholar]
- [6].Kim S, Pevzner PA. MS-GF+ makes progress towards a universal database search tool for proteomics. Nat Commun. 2014;5:5277. doi: 10.1038/ncomms6277. [DOI] [PMC free article] [PubMed] [Google Scholar]
- [7].The M, Käll L. MaRaCluster: A fragment rarity metric for clustering fragment spectra in shotgun proteomics. Journal of proteome research. 2016;15(3):713–720. doi: 10.1021/acs.jproteome.5b00749. [DOI] [PubMed] [Google Scholar]
- [8].Griss J, Foster JM, Hermjakob H, Vizcaíno JA. PRIDE Cluster: building a consensus of proteomics data. Nature Methods. 2013;10:95. doi: 10.1038/nmeth.2343. [DOI] [PMC free article] [PubMed] [Google Scholar]
- [9].Griss J, Perez-Riverol Y, Lewis S, Tabb DL, Dianes JA, del-Toro N, Rurik M, Walzer M, Kohlbacher O, Hermjakob H, Wang R, et al. Recognizing millions of consistently unidentified spectra across hundreds of shotgun proteomics datasets. Nature Methods. 2016;13:651. doi: 10.1038/nmeth.3902. [DOI] [PMC free article] [PubMed] [Google Scholar]
- [10].Frank AM, Bandeira N, Shen Z, Tanner S, Briggs SP, Smith RD, Pevzner PA. Clustering millions of tandem mass spectra. Journal of proteome research. 2007;7(01):113–122. doi: 10.1021/pr070361e. [DOI] [PMC free article] [PubMed] [Google Scholar]
- [11].Lam H, Deutsch EW, Eddes JS, Eng JK, King N, Stein SE, Aebersold R. Development and validation of a spectral library searching method for peptide identification from MS/MS. Proteomics. 2007;7(5):655–667. doi: 10.1002/pmic.200600625. [DOI] [PubMed] [Google Scholar]
- [12].Shao W, Zhu K, Lam H. Refining similarity scoring to enable decoy-free validation in spectral library searching. PROTEOMICS. 2013;13(22):3273–3283. doi: 10.1002/pmic.201300232. [DOI] [PubMed] [Google Scholar]
- [13].Baumgardner LA, Shanmugam AK, Lam H, Eng JK, Martin DB. Fast parallel tandem mass spectral library searching using GPU hardware acceleration. Journal of proteome research. 2011;10(6):2882–2888. doi: 10.1021/pr200074h. [DOI] [PMC free article] [PubMed] [Google Scholar]
- [14].Mohammed Y, Mostovenko E, Henneman AA, Marissen RJ, Deelder AM, Palmblad M. Cloud parallel processing of tandem mass spectrometry based proteomics data. Journal of proteome research. 2012;11(10):5101–5108. doi: 10.1021/pr300561q. [DOI] [PubMed] [Google Scholar]
- [15].Ma CWM, Lam H. Hunting for unexpected post-translational modifications by spectral library searching with tier-wise scoring. Journal of proteome research. 2014;13(5):2262–2271. doi: 10.1021/pr401006g. [DOI] [PubMed] [Google Scholar]
- [16].Ye D, Fu Y, Sun R-X, Wang H-P, Yuan Z-F, Chi H, He S-M. Open MS/MS spectral library search to identify unanticipated post-translational modifications and increase spectral identification rate. Bioinformatics (Oxford, England) 2010;26(12):i399–i406. doi: 10.1093/bioinformatics/btq185. [DOI] [PMC free article] [PubMed] [Google Scholar]
- [17].Dasari S, Chambers MC, Martinez MA, Carpenter KL, Ham A-JL, Vega-Montoto LJ, Tabb DL. Pepitome: Evaluating Improved Spectral Library Search for Identification Complementarity and Quality Assessment. Journal of Proteome Research. 2012;11(3):1686–1695. doi: 10.1021/pr200874e. [DOI] [PMC free article] [PubMed] [Google Scholar]
- [18].Yilmaz Ş, Victor B, Hulstaert N, Vandermarliere E, Barsnes H, Degroeve S, Gupta S, Sticker A, Gabriёl S, Dorny P, Palmblad M, et al. A Pipeline for Differential Proteomics in Unsequenced Species. Journal of Proteome Research. 2016;15(6):1963–1970. doi: 10.1021/acs.jproteome.6b00140. [DOI] [PubMed] [Google Scholar]
- [19].Burke MC, Mirokhin YA, Tchekhovskoi DV, Markey SP, Heidbrink Thompson J, Larkin C, Stein SE. The hybrid search: A mass spectral library search method for discovery of modifications in proteomics. Journal of proteome research. 2017;16(5):1924–1935. doi: 10.1021/acs.jproteome.6b00988. [DOI] [PubMed] [Google Scholar]
- [20].Craig R, Cortens JC, Fenyo D, Beavis RC. Using Annotated Peptide Mass Spectrum Libraries for Protein Identification. Journal of Proteome Research. 2006;5(8):1843–1849. doi: 10.1021/pr0602085. [DOI] [PubMed] [Google Scholar]
- [21].Li H, Zong NC, Liang X, Kim AK, Choi JH, Deng N, Zelaya I, Lam M, Duan H, Ping P. A novel spectral library workflow to enhance protein identifications. Journal of proteomics. 2013;81:173–184. doi: 10.1016/j.jprot.2013.01.026. [DOI] [PMC free article] [PubMed] [Google Scholar]
- [22].Wang J, Tucholska M, Knight JD, Lambert J-P, Tate S, Larsen B, Gingras A-C, Bandeira N. MSPLIT-DIA: sensitive peptide identification for data-independent acquisition. Nature methods. 2015;12(12):1106. doi: 10.1038/nmeth.3655. [DOI] [PMC free article] [PubMed] [Google Scholar]
- [23].Horlacher O, Lisacek F, Müller M. Mining large scale tandem mass spectrometry data for protein modifications using spectral libraries. Journal of proteome research. 2015;15(3):721–731. doi: 10.1021/acs.jproteome.5b00877. [DOI] [PubMed] [Google Scholar]
- [24].Cho J-Y, Lee H-J, Jeong S-K, Paik Y-K. Epsilon-Q: an automated analyzer interface for mass spectral library search and label-free protein quantification. Journal of proteome research. 2017;16(12):4435–4445. doi: 10.1021/acs.jproteome.6b01019. [DOI] [PubMed] [Google Scholar]
- [25].Shao W, Lam H. Tandem mass spectral libraries of peptides and their roles in proteomics research. Mass Spectrometry Reviews. 2017;36(5):634–648. doi: 10.1002/mas.21512. [DOI] [PubMed] [Google Scholar]
- [26].Yu D, Ma J, Xie Z, Bai M, Zhu Y, Shu K. Progress in the spectral library based protein identification strategy. Sheng wu gong cheng xue bao = Chinese journal of biotechnology. 2018;34(4):525. doi: 10.13345/j.cjb.170321. [DOI] [PubMed] [Google Scholar]
- [27].LeCun Y, Bengio Y, Hinton G. Deep learning. Nature. 2015;521(7553):436–444. doi: 10.1038/nature14539. [DOI] [PubMed] [Google Scholar]
- [28].Tran NH, Zhang X, Xin L, Shan B, Li M. De novo peptide sequencing by deep learning. Proceedings of the National Academy of Sciences. 2017;114(31):8247–8252. doi: 10.1073/pnas.1705691114. [DOI] [PMC free article] [PubMed] [Google Scholar]
- [29].Zhou X-X, Zeng W-F, Chi H, Luo C, Liu C, Zhan J, He S-M, Zhang Z. pDeep: Predicting MS/MS Spectra of Peptides with Deep Learning. Analytical Chemistry. 2017;89(23):12690–12697. doi: 10.1021/acs.analchem.7b02566. [DOI] [PubMed] [Google Scholar]
- [30].Zeng W-F, Zhou X-X, Zhou W-J, Chi H, Zhan J, He S-M. MS/MS Spectrum Prediction for Modified Peptides Using pDeep2 Trained by Transfer Learning. Analytical Chemistry. 2019;91(15):9724–9731. doi: 10.1021/acs.analchem.9b01262. [DOI] [PubMed] [Google Scholar]
- [31].Gessulat S, Schmidt T, Zolg DP, Samaras P, Schnatbaum K, Zerweck J, Knaute T, Rechenberger J, Delanghe B, Huhmer A, Reimer U, et al. Prosit: proteome-wide prediction of peptide tandem mass spectra by deep learning. Nature Methods. 2019;16(6):509–518. doi: 10.1038/s41592-019-0426-7. [DOI] [PubMed] [Google Scholar]
- [32].May DH, Bilmes J, Noble WS. A learned embedding for efficient joint analysis of millions of mass spectra. bioRxiv. 2018:483263. doi: 10.1038/s41592-022-01496-1. [DOI] [PMC free article] [PubMed] [Google Scholar]
- [33].Zhang C, Liu W, Ma H, Fu H. Siamese neural network based gait recognition for human identification; 2016 IEEE International Conference on Acoustics, Speech and Signal Processing (ICASSP); 2016. pp. 2832–2836. [Google Scholar]
- [34].Frank AM. Predicting Intensity Ranks of Peptide Fragment Ions. Journal of Proteome Research. 2009;8(5):2226–2240. doi: 10.1021/pr800677f. [DOI] [PMC free article] [PubMed] [Google Scholar]
- [35].Degroeve S, Maddelein D, Martens L. MS2PIP prediction server: compute and visualize MS2 peak intensity predictions for CID and HCD fragmentation. Nucleic Acids Research. 2015;43(W1):W326–W330. doi: 10.1093/nar/gkv542. [DOI] [PMC free article] [PubMed] [Google Scholar]
- [36].MacLean AM, Orlovskis Z, Kowitwanich K, Zdziarska AM, Angenent GC, Immink RGH, Hogenhout SA. Phytoplasma Effector SAP54 Hijacks Plant Reproduction by Degrading MADS-box Proteins and Promotes Insect Colonization in a RAD23-Dependent Manner. PLOS Biology. 2014;12(4):e1001835. doi: 10.1371/journal.pbio.1001835. [DOI] [PMC free article] [PubMed] [Google Scholar]
- [37].Bracht T, Hagemann S, Loscha M, Megger DA, Padden J, Eisenacher M, Kuhlmann K, Meyer HE, Baba HA, Sitek B. Proteome Analysis of a Hepatocyte-Specific BIRC5 (Survivin)-Knockout Mouse Model during Liver Regeneration. Journal of Proteome Research. 2014;13(6):2771–2782. doi: 10.1021/pr401188r. [DOI] [PubMed] [Google Scholar]
- [38].Huang J, Ling CX. Using AUC and accuracy in evaluating learning algorithms. IEEE Transactions on knowledge and Data Engineering. 2005;17(3):299–310. [Google Scholar]
- [39].Paszke A, Gross S, Massa F, Lerer A, Bradbury J, Chanan G, Killeen T, Lin Z, Gimelshein N, Antiga L. Pytorch: An imperative style, high-performance deep learning library. Advances in neural information processing systems. 2019:8026–8037. [Google Scholar]
- [40].Deutsch EW, Bandeira N, Sharma V, Perez-Riverol Y, Carver JJ, Kundu DJ, Garcia-Seisdedos D, Jarnuczak AF, Hewapathirana S, Pullman BS, Wertz J, et al. The ProteomeXchange consortium in 2020: enabling ‘big data’ approaches in proteomics. Nucleic Acids Res. 2019 doi: 10.1093/nar/gkz984. [DOI] [PMC free article] [PubMed] [Google Scholar]
Associated Data
This section collects any data citations, data availability statements, or supplementary materials included in this article.


