Abstract
Apart from the well-defined factors in neuronal cells1, only few reports consider that variability of sporadic ALS progression can depend on the less-defined contributions from glia2,3 and blood vessels4. In this study we use an expression weighted cell-type enrichment method to infer cell activity in spinal cord samples from sporadic ALS patients and mouse models of this disease. Here we report that sporadic ALS patients present cell activity patterns consistent with two mouse models in which enrichments of vascular cell genes preceded the microglial response. Notably, during the presymptomatic stage, perivascular fibroblast cells showed the strongest gene enrichments and their marker proteins SPP1 and COL6A1 accumulated in enlarged perivascular spaces in sporadic ALS patients. Moreover, in plasma of 574 ALS patients from four independent cohorts, increased levels of SPP1 at disease diagnosis repeatedly predicted shorter survival with stronger effect than the established risk factors of bulbar onset or neurofilament levels in cerebrospinal fluid. We propose that the activity of the recently-discovered perivascular fibroblast can predict ALS patient survival and provide a novel conceptual framework to re-evaluate definitions of ALS etiology.
Introduction
Although the defining clinical features of amyotrophic laterals sclerosis (ALS) focus on the common degeneration of upper and lower motor neurons, substantial variability is reported for patient’s age at disease onset, contribution of non-motor systems and survival duration5. This variability considerably complicates accurate prognosis of life expectancy and interpretations of clinical trial outcomes. Lack of reliable early diagnostics means that treatments are given only in advanced stages; and further highlights that studies aiming to understand early sporadic disease mechanisms are intrinsically challenging and incomplete6.
From the first description of familial ALS forms7 which affect 5-10% of patients, there have been remarkable advances in discovery of novel gene variants. These variants provided insight into dysfunction of neuron-centric pathological mechanisms including protein misfolding7, RNA maturation8 and axonal transport9. However, increasing evidence indicates that the dynamics of neurodegeneration in both familial and sporadic ALS is also influenced by other cell type functions that include glia response2,3, oligodendrocyte metabolism10 and integrity of blood vessels4,11. These observations challenged the neuron-centric theory and initiated redefinition of our understanding of disease variability. Recent efforts to comprehend cellular complexity of the nervous system using single cell RNA sequencing provided detailed maps of novel cell types12–14 but also add another level of challenge to interpret individual cell-type input during multiple stages of disease. Unless we improve our understanding of contributions from non-neuronal cells and mechanisms preceding disease onset, the clinical variability of the progression dynamics will continue to confound design and evaluation of ALS treatments. We therefore aimed to decode the temporal activity for gene expression within ten major central nervous system cell types in post-mortem transcriptomes of patients with sporadic ALS and in a presymptomatic timeline of the transgenic SOD1G93A and TARDBPQ331K/Q331K mouse models.
Cell activity timeline in ALS
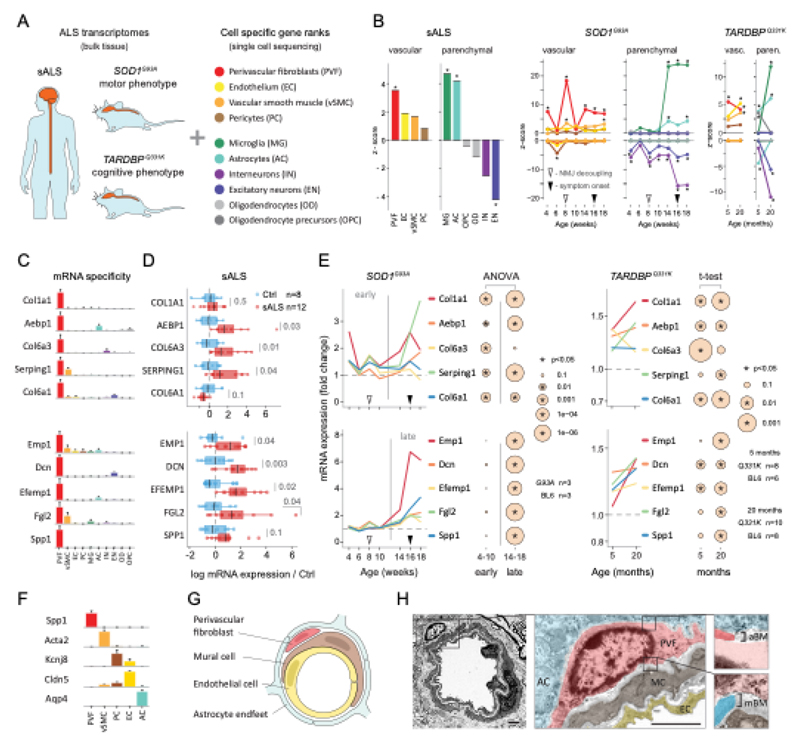
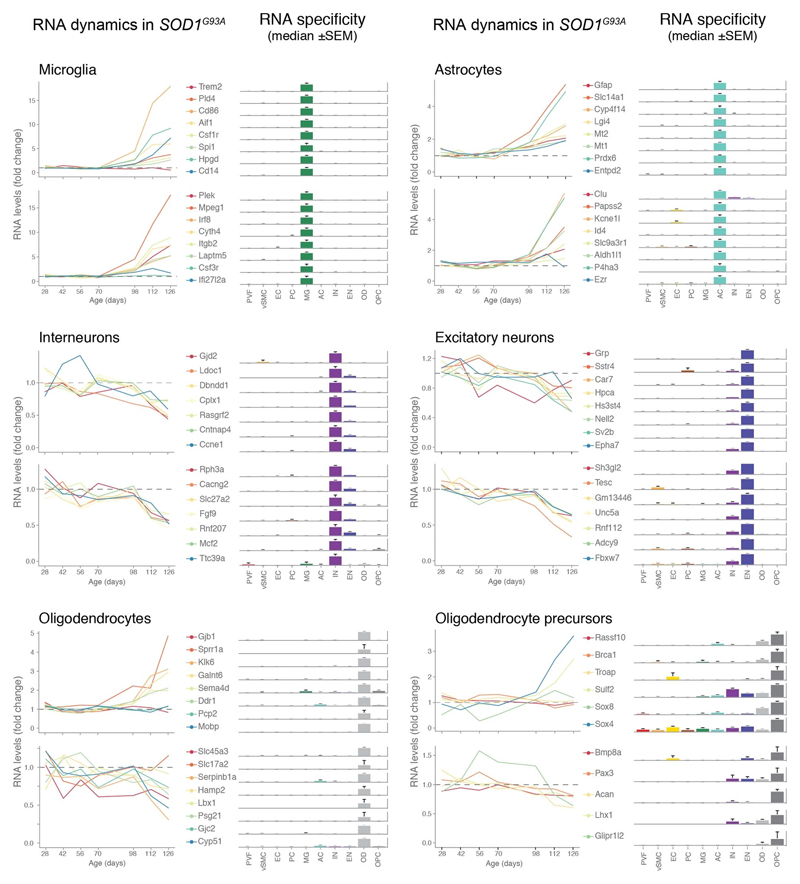
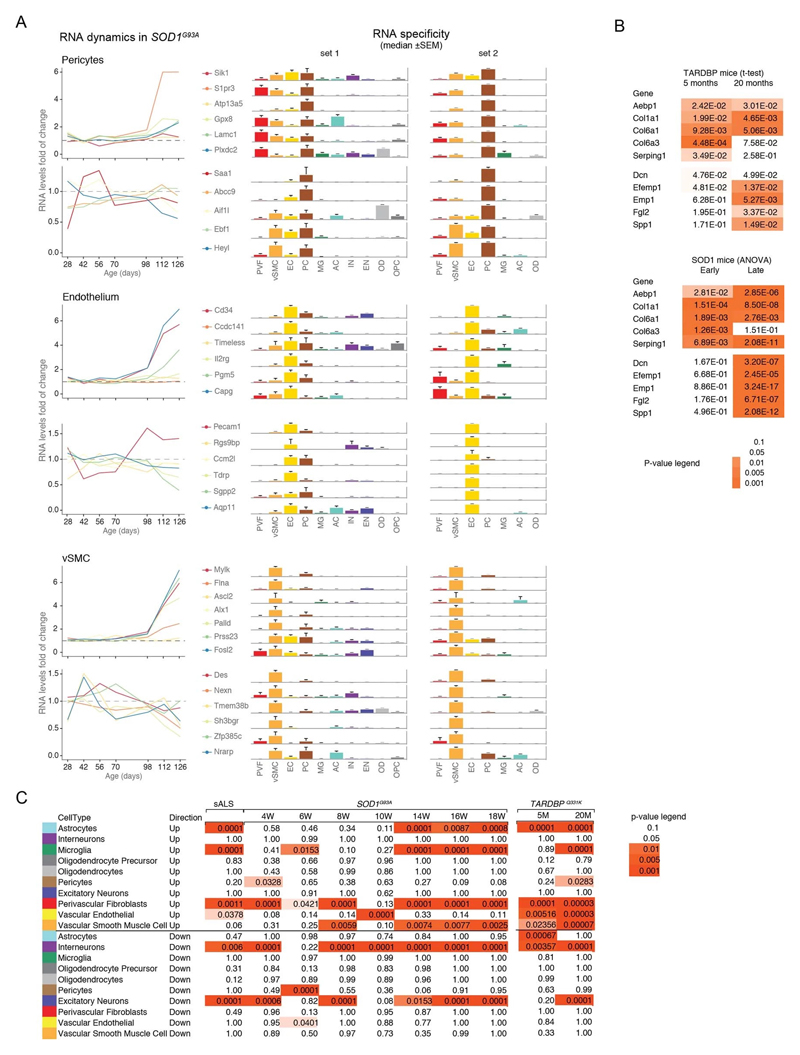
We used single-cell central nervous system transcriptomes12,13 and an expression weighted cell-type enrichment (EWCE)15 method to infer the cell activity in bulk tissue. This form of inferred activity is represented as a z-score which measures the degree of transcript increase and specificity within a given cell category derived from single-cell sequencing. In our analysis we included transcriptomes from spinal cords of sporadic ALS patients (n=12) and two transgenic mouse models: SOD1G93A (n=3) and TARDBPQ331K/Q331K (n≥8) (Fig. 1 a, b Extended Data Fig. 1, 2). The results from sporadic ALS patient tissues revealed increased enrichments of microglia and astrocyte-specific genes together with a marked reduction of excitatory neuron and interneuron transcripts likely reflecting neurodegeneration (Fig. 1 b). Notably we observed increased activity of vascular cell-specific genes in sporadic ALS patients with the highest enrichments for perivascular fibroblast cells (Fig. 1 b). To complement the endpoint patient data and to explore presymptomatic patterns of cell activity we analyzed gene enrichments for the same ten cell types in SOD1G93A and TARDBPQ331K/Q331K mice. We analyzed SOD1G93A mice at ages of 4, 6 (asymptomatic); 8 (neuromuscular junction decoupling16); 10 (pre-onset); 14 (onset of neuroinflammation17); 16 (peak body weight - clinical onset with loss of motor neuron count18) and 18 weeks (symptomatic stage). TARDBPQ331K/Q331K mice were analyzed at 5 month (no MN loss or NMJ denervation with partial behavior phenotype19) and 20 month (with behavioral phenotype) timepoints. We observed a remarkable consistency in cell type activity between end-stage sporadic ALS patients and symptomatic SOD1G93A or TARDBPQ331K/Q331K mice with similar increased expression of microglia and astrocyte associated genes as well as a reduction of neuron and interneuron transcripts (Fig. 1b, Extended Data Fig. 1). Our observations in SOD1G93A mice were consistent with previously published FACS sorting20 and RNA pulldown21 approaches, which also aimed to identify cell type-specific transcripts. For instance, we identified Trem2, Ctss with Cd86 as well as Sprr1a with Klk6 as respective microglia and oligodendrocyte-specific regulated genes, similarly to the previous reports from in SOD1G93A 20 and SOD1G37R 21 models (Extended Data Fig. 1). In comparison with those reports, our dataset not only includes novel cell types, but also resolves with a more refined timescale to demonstrate that microglia and astrocytes become induced at pre-onset week 14, while neuron and interneuron genes already show decreased activity in presymptomatic 8 week-old mice.
Figure 1. ALS patients show increased transcriptional activity of perivascular fibroblast cell gene markers which occur at presymptomatic disease stage in SOD1G93A and TARDBPQ331K mice.
(A) Schematic of expression weighted cell type enrichment (EWCE) analysis. Cell type-specific gene rankings from single cell sequencing data allow to infer cell type activity in bulk tissue transcriptomes. (B) Enrichment z - scores for up and down-regulated genes in ten cell type classes in sALS patients, SOD1G93A and TARDBPQ331K mice. In the SOD1G93A mice, onset of neuromuscular junction decoupling (8 weeks) and clinical symptoms (peak body weight - 16 weeks) are indicated with arrowheads. P-values are specified in Ext. data Fig. 2. (C) Cell type RNA specificity for genes enriched in perivascular fibroblasts. N number of cells per category is described in Ext. data Fig. 1. Bars show median count of RNA per cell ± SEM. (D) Perivascular fibroblast specific gene activity in sALS patient spinal cords. sALS n=12, Ctrl n=8. Boxplots show median, 2nd-3rd quartile and whiskers show +/-1.5 of the IQR. Two-tailed t-test p-values are indicated next to brackets. (E) Expression of perivascular fibroblast enriched genes in SOD1G93A (p-value for ANOVA in early (4-10 weeks) and late (14-18 weeks) timepoints) and TARDBPQ331K mice (p-values for two-tailed t-test). (F) Perivascular fibroblasts have distinct mRNA expression markers (median RNA molecule count with ±SEM). (G) Schematic illustration represents reported PVF location between astrocytes and mural/endothelial cells. (H) Transmission electron microscopy of mouse spinal cord tissue points to location of perivascular fibroblasts cells (PVF - shaded red) between basement membrane layers that delineate astrocyte endfeet (AC - blue) and mural cells (MC - brown), (EC - yellow: endothelial cell, aBM - astrocyte basement membrane, mBM - mural basement membrane). Scale bar 2μm.
Remarkably, in the SOD1G93A model the response of vascular cells including pericyte- (4-6 weeks), smooth muscle- (8 weeks) and endothelial cell-specific genes (10 weeks) largely occurred before the microglial response (week 14-18) and showed strongest enrichment for perivascular fibroblast-specific genes (4, 8, 14, 16 and 18 weeks) (Fig. 1b and Extended Data Fig. 2a). A similar increase of perivascular fibroblast-specific genes was also evident and preceded microglial transcriptional activity in 5 month-old TARDBPQ331K/Q331K mice (Fig. 1 b). The timing and degree of perivascular fibroblast-specific gene expression could imply that the extent of their activity is similar to microglia, but they become induced at much earlier stages of disease. We therefore focused our analysis on the perivascular fibroblast-specific expression patterns and defined several activated genes in human sporadic ALS patients as well as in SOD1G93A and TARDBPQ331K/Q331K mice (Fig. 1c, d, e). The timing of expression for perivascular fibroblast-specific genes in SOD1G93A mice (Fig. 1e) implies that one group becomes active during the presymptomatic stage of 4-8 weeks, while another group become active together with the microglial response initiated at week 14. We found similar patterns of early and late responses of perivascular fibroblast-specific genes in TARDBPQ331K/Q331K mice (Fig. 1 e).
Perivascular fibroblasts were recently identified as a unique nervous system cell type by other groups using single-cell RNA sequencing efforts13,22 (Fig. 1f) and are also referred to as vascular leptomeningeal cells13,14. These cells were previously reported to locate within the perivascular Virchow–Robin space between the mural cells and astrocyte end-feet22 (Fig. 1g). Our transmission electron microscopy observations further specify the location of perivascular fibroblasts between the astrocyte and mural cell basement membranes (Fig. 1h). Perivascular fibroblast-specific genes (e.g. Col6a1, Col1a1 and Mmp2)13,22 imply that their main functions include composition and remodeling of the basement membrane extracellular matrix22. However, as current tools are inadequate to perform recombinant cell-specific interventions, the precise role of these cells in the nervous system remains highly debated. To enable the exploration of our dataset we have built a web resource with cell type-specific enrichment rankings, transcript specificity and expression dynamics in sporadic ALS patients, SOD1G93A and TARDBPQ331K/Q331K mice at http://alscellatlas.org).
Vascular remodeling in ALS
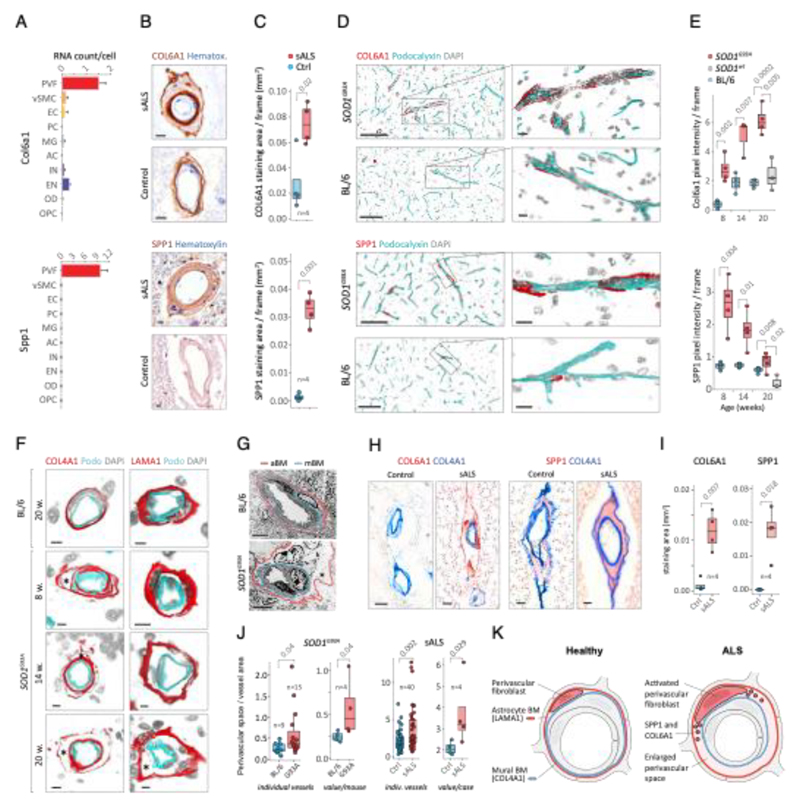
Since perivascular fibroblast cells in our data were the first to induce gene expression before ALS onset and their function is largely unknown, we focused on addressing their potential contributions to disease processes. Our computational predictions were based on RNA expression specificity in a healthy state and we needed to verify if perivascular fibroblast protein expression indeed localized within blood vessels in ALS tissues. We performed a histological screen with antibodies targeting 15 perivascular fibroblast-specific proteins. The analysis confirmed vascular location for several proteins, in particular COL6A1 and SPP1 (osteopontin) (Fig. 2a, b and Extended Data Fig. 3). Stainings of both proteins were increased in spinal cords of sporadic ALS patients as compared with age-matched non-neurological controls (Fig. 2c, Extended Data Fig. 3a). In addition, vessel-specific increase of Spp1 and Col6a1 protein expression in SOD1G93A mice spinal cords (Fig. 2d) was consistent with those observed in sporadic ALS patients. Accumulation of both proteins already occurred at an early timepoint of 8 weeks (Fig. 2e), which supports the inferred notion from the RNA transcriptomics data that perivascular fibroblasts become induced at presymptomatic stage of ALS.
Figure 2. Perivascular fibroblast marker proteins COL6A1 and SPP1 accumulate in enlarged perivascular spaces during ALS progression.
(A) Col6a1 and Spp1 mRNA specificity within CNS cell types. Bars represent relative count of RNA per cell ± SEM. (B) COL6A1 and SPP1 histochemistry in sALS and control spinal cords, bar: 10μm. (C) Quantifications of human tissue histochemistry from full frame 4x photos. sALS and Ctrl n=4 individuals (2-tailed t-test p-value). All boxplots show median, 2nd-3rd quartile and whiskers show +/-1.5 of the IQR. (D) Col6a1 and Spp1 accumulate around blood vessels (outlined with podocalyxin - cyan) in 14 week SOD1G93A mouse spinal cords. Immunofluorescence z-stack renderings of 16μm thick sections, bars: 100μm (overview), 10μm (insert). (E) Quantifications of immunofluorescence stainings in mice from full-frame 20x photos. SOD1G93A and BL/6 n=4, SOD1wt n=3 mice (2-tailed t-test p-value). (F) Increased perivascular spaces appear in presymptomatic (8 weeks) SOD1G93A mice spinal cords. Immunofluorescence for vascular (Col4a1) and astrocyte (Lama1) basement membranes, bar: 10μm. (G) Electron microscopy (tEM) of increased perivascular spaces in 14 week SOD1G93A mice. Astrocyte (red) and vascular (blue) basement membranes are indicated with lines. Perivascular space is indicated with asterisk, bar: 5μm. (H) COL6A1 and SPP1 accumulate within increased perivascular spaces (outlined with COL4A1) in spinal cords of sALS patients. 2 color histochemistry, bar: 10μm. (I) Quantifications of COL6A1 and SPP1 immunostainings from panel H. sALS and Ctrl n=4 individuals (two-tailed t-test p-value). (J) Quantifications of perivascular space increase in SOD1G93A mice from panel G (SOD1G93A and BL/6 n=4 mice) and in sALS patients from panel H (sALS and Ctrl n=4 individuals) (two-tailed t-test p-value). (K) Schematic representation of perivascular fibroblast activity and enlarged perivascular spaces in ALS.
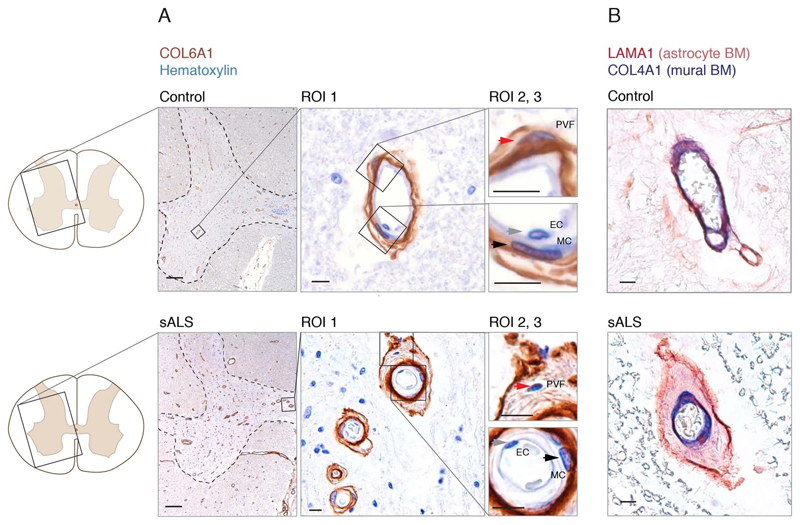
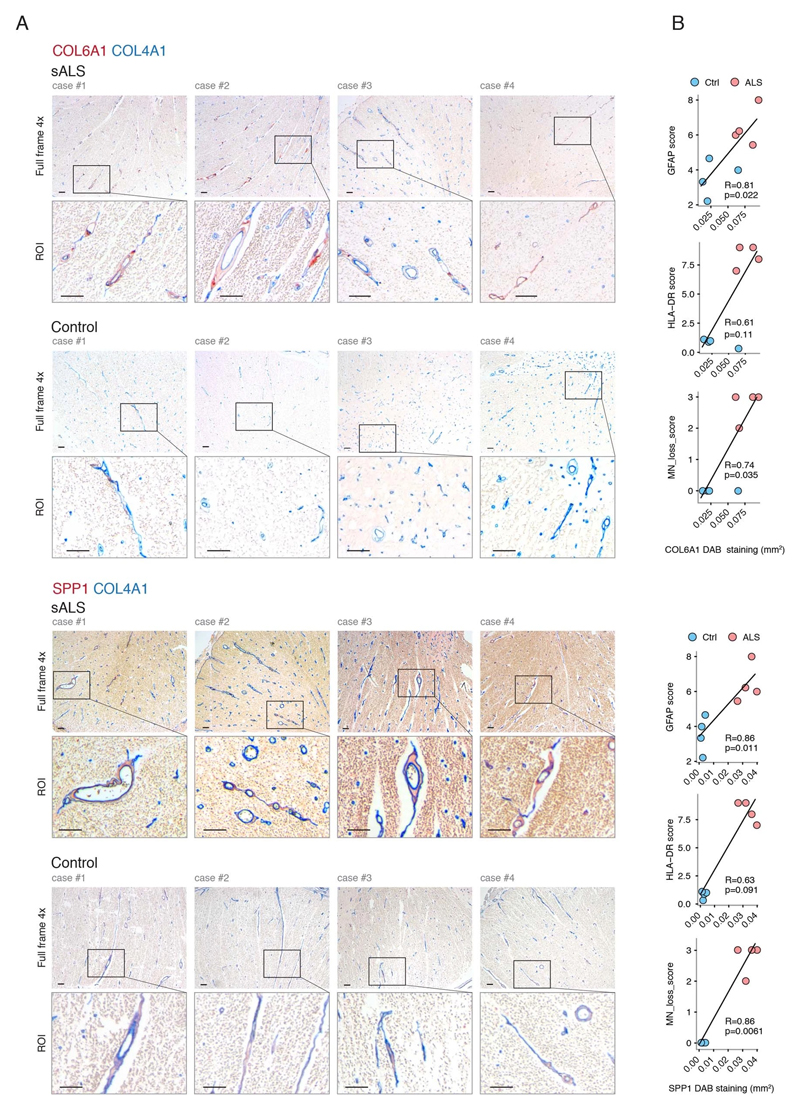
Notably, staining for COL6A1, a component of the vascular basement membrane, did not outline endothelial or mural cells, but indicated enlarged perivascular spaces in ALS patients (Fig. 2b and Extended Data Fig. 3a) suggesting that astrocyte and mural basement membranes become separated during ALS progression. We confirmed that separation of mural basement membrane (marked with COL4A1) and astrocyte basement membrane (marked with LAMA1) does indeed occur in spinal cord vessels in sporadic ALS patients (Extended Data Fig. 3b). A similar separation of Col4a1 and Lama1-delineated basement membranes already occurred in presymptomatic (8 week-old) SOD1G93A mice (Fig. 2f) at a timepoint consistent with increased transcriptional activity and protein accumulation of perivascular fibroblast-specific markers. We resolved the ultrastructure of basement membrane separation using transmission electron microscopy and observed that perivascular fibroblasts were present within enlarged perivascular spaces in 14 week-old SOD1G93A mice (Fig. 2g). We found that these perivascular spaces accumulate perivascular fibroblast-specific COL6A1 and SPP1 proteins in spinal cord vessels of sporadic ALS patients (Fig. 2h, i and Extended Data Fig. 4a). The enlargement of perivascular spaces was substantial in both end-stage ALS patients and in 14 week-old SOD1G93A mice (Fig. 2j). This form of basement membrane remodeling is likely regulated by multiple genes, as indicated by enriched gene ontologies which occurred early and were exacerbated in symptomatic stages of ALS (Extended Data Fig. 5). Taken together, these findings indicate that perivascular fibroblasts become active during presymptomatic ALS stages and can participate in remodeling of cerebral blood vessels by increased expression of the COL6A1 and SPP1 proteins within enlarged perivascular spaces (Fig. 2k).
Prognostic value of perivascular fibroblast proteins in plasma
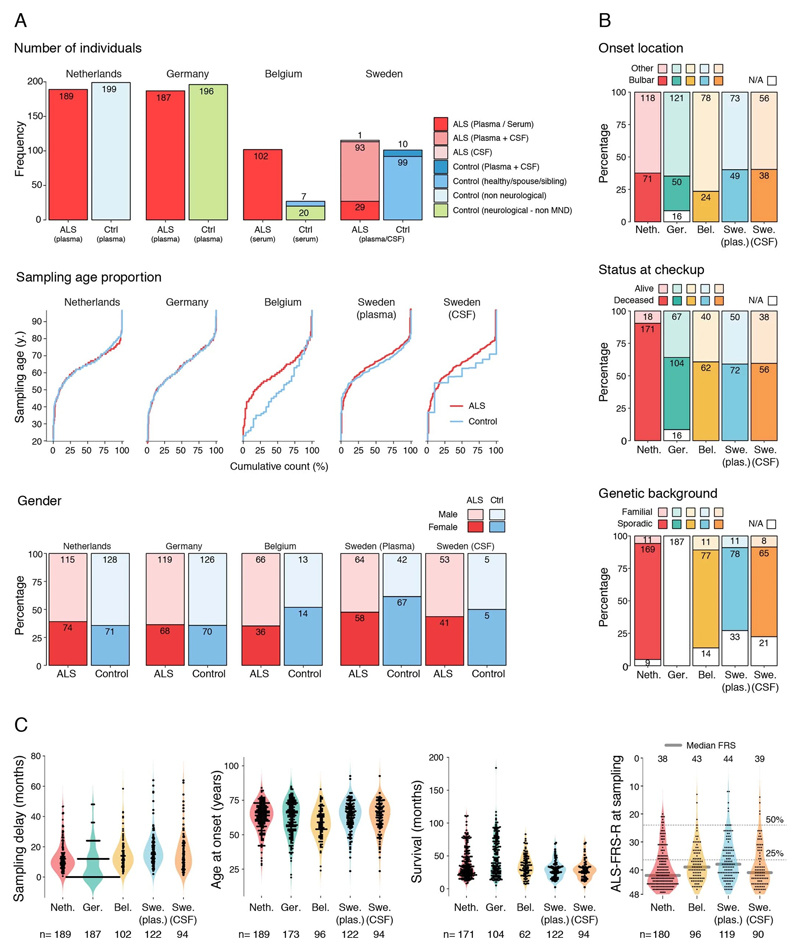
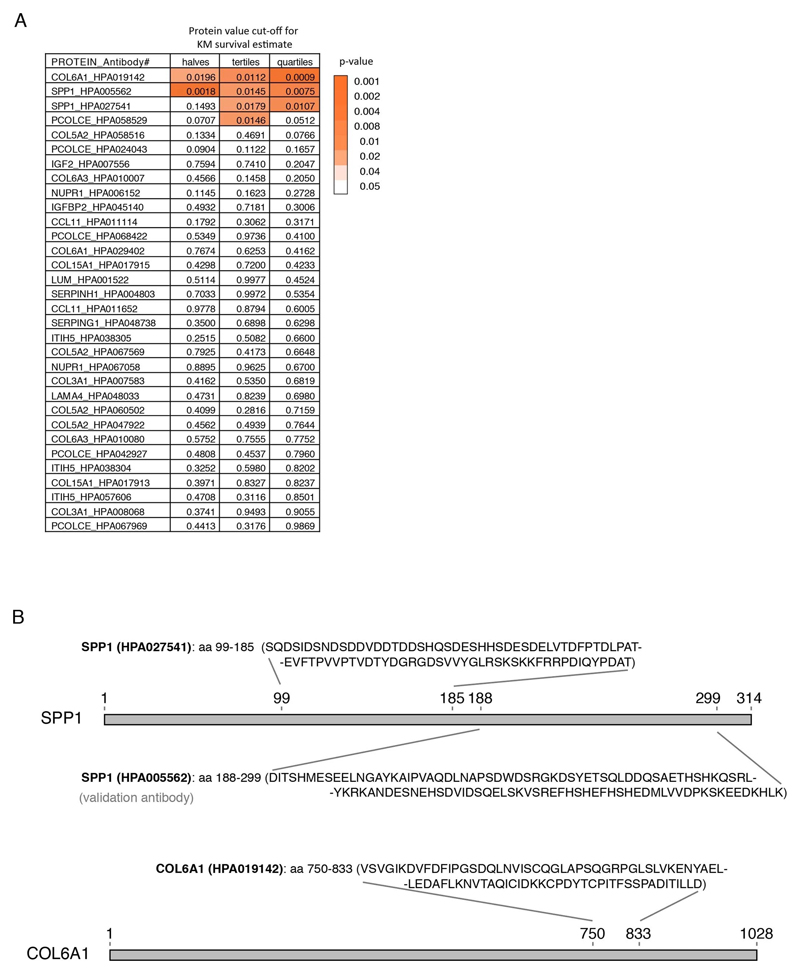
Since perivascular spaces are responsible for clearance from cerebrospinal fluid to lymphatic23 and blood24 circulations, we anticipated that an increase of COL6A1 and SPP1 in ALS patient plasma could have potential informative value for clinical disease dynamics. We performed targeted suspension bead array profiling using 32 antibodies against 15 perivascular fibroblast proteins in blood plasma. Initial screening revealed a that higher quartile values of COL6A1 and SPP1 proteins indicated shorter survival of ALS patients in a pilot cohort from the Netherlands (189 ALS patients and 199 controls) (Extended Data Fig. 7a). We have combined the Netherlands cohort with groups from Germany and Belgium (a total of 452 ALS patients and 395 controls) and analyzed it as a discovery cohort with internal replication between countries. We have also recruited samples from Sweden (122 ALS patients and 109 controls) as a replication cohort with independent labeling of beads with antibodies. Cohort summary statistics are presented in Extended Data Fig. 6.
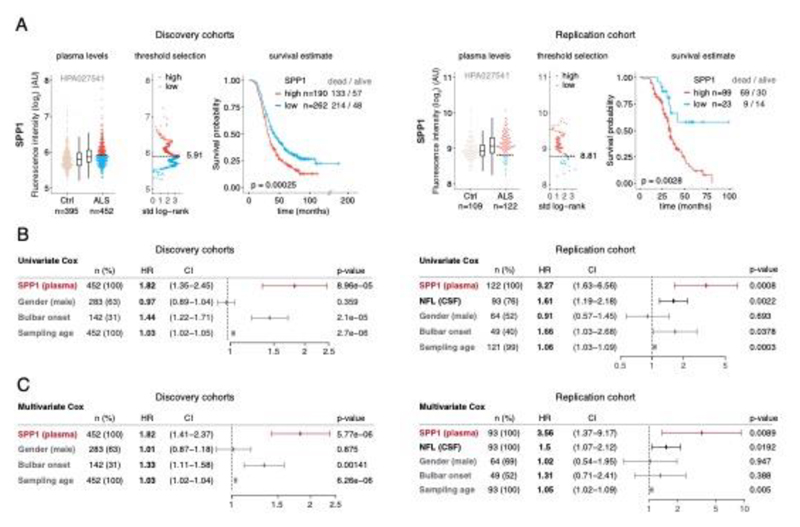
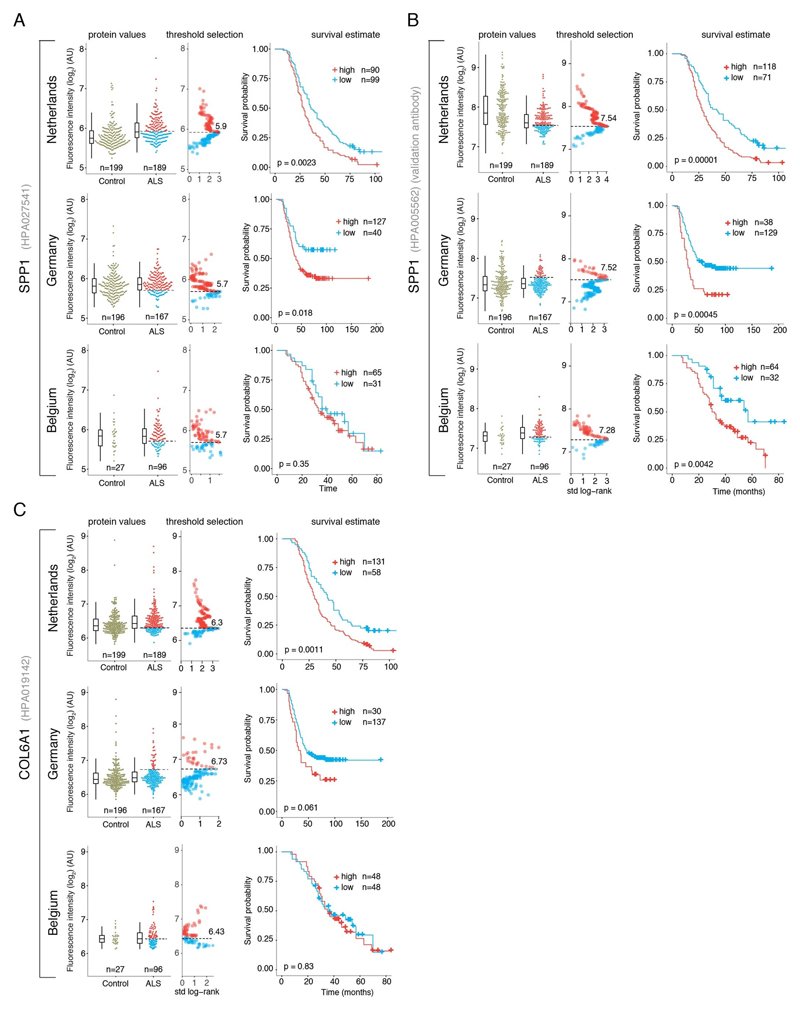
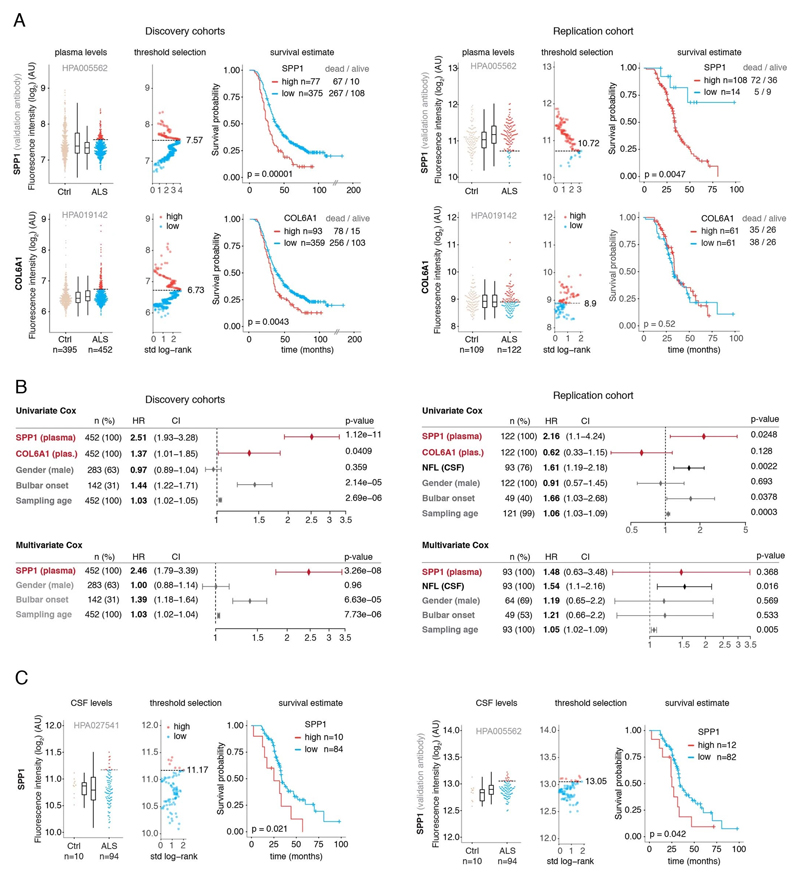
SPP1 levels above empirically optimized thresholds indicated shorter survival in the discovery and replication cohorts (Fig. 3a). These associations of high SPP1 and shorter survival were reproduced within the individual cohorts from Netherlands and Germany but not in the smaller cohort from Belgium with less complete survival data (Extended Data Fig. 8). We also performed a validation using a second SPP1 antibody targeting an independent protein domain (Extended Data Fig. 7b). This antibody showed similar association between high SPP1 values and short patient survival in each country cohort (Extended Data Fig. 7, 8b, 9a). Plasma COL6A1 level increase also associated with shorter survival in the grouped discovery cohort and within the larger groups from Netherlands (n=189) and Germany (n=187), but not in the smaller cohorts with less complete survival data from Belgium (n=102) and Sweden (n=122) (Extended Data Fig. 8c, 9a).
Figure 3. Prognostic value of SPP1 protein in plasma of ALS patients.
(A) Relative levels of SPP1 protein in plasma as measured by the HPA027541 antibody. Threshold selection and Kaplan-Meier survival estimates of ALS patients in discovery cohorts (Netherlands, Germany and Belgium, n=452) and in the replication cohort (Sweden, n=122). Red color indicates thresholded protein level. Thresholds are established using maximally selected log rank statistics. Boxplots show median, 2nd-3rd quartile and whiskers show +/-1.5 of the IQR. Survival probability graphs show proportion of censored patients within each arm and Kaplan-Meier logrank p-values. (B-C) Uni- and multivariate Cox proportional hazard models for continuous increase of plasma SPP1 relative to hazard ratios indicated by bulbar onset type, neurofilament light (NFL) in CSF (in the replication cohort), gender and plasma sampling age. Whiskers represent 95% CI. Cohort identity was additionally used as covariate in multivariate models.
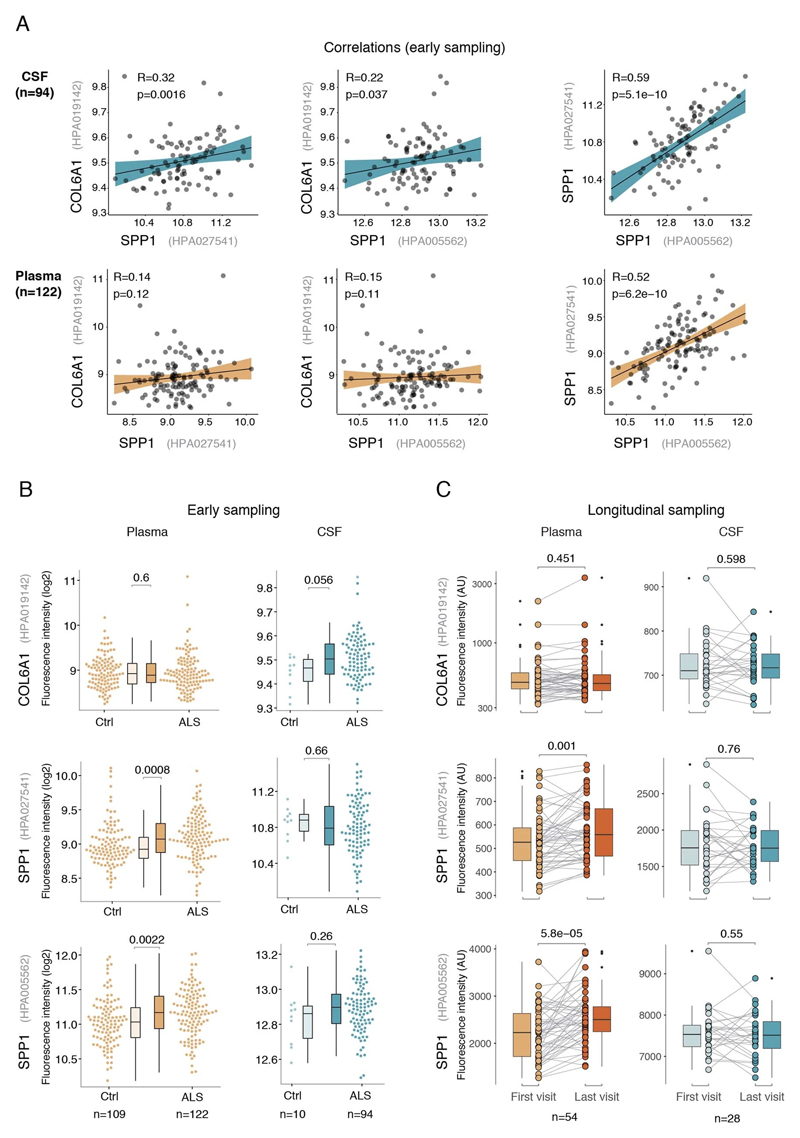
Besides the comparison of patient groups defined by protein level threshold, we also evaluated the prognostic risk for continuous increase of plasma SPP1 and COL6A1 in univariate and multivariate Cox models. We compared their hazard ratios to the effects of bulbar onset and, when available, neurofilament light (NFL) levels. Using a univariate model, the hazard ratio for continuous plasma increase of SPP1 in the grouped discovery cohort was higher (HR=1.82 p=8.96e-05) than the risk mediated by the bulbar onset (HR=1.44 p=2.1e-05) (Fig. 3c). This effect of univariate risk increase was consistent in the Swedish replication cohort in which SPP1 increase had higher hazard ratio (HR=3.27 p=0.0008) than bulbar onset (HR=1.66 p=0.0378) or NFL increase in CSF (HR=1.61 p=0.002) (Fig. 3c). We have further confirmed these observations using the second antibody for SPP1 and univariate Cox models in discovery and replication cohorts (Extended Data Fig. 9b). In addition to the univariate model, we cross-examined the effects of continuous protein increase using a multivariate Cox model in which SPP1 persisted to give stronger survival hazard ratios (HR=1.82 p=8.96e-05) than the bulbar onset in the discovery cohort (Fig. 3c). Strikingly, in the replication cohort where matched CSF samples were available, the multivariate effect of SPP1 increase in plasma had stronger indication for short survival (HR=3.56 p=0.009) than did the NFL increase in CSF as measured using a clinical grade ELISA kit (HR=1.5 p=0.02) (Fig. 3c). The increase of SPP1 in CSF also indicated shorter survival in the Swedish cohort, albeit at much higher threshold and to a lesser extent than did the plasma values (Extended data Fig. 9c). The correlations between SPP1 and COL6A1 were more apparent in CSF than in plasma (Extended Data Fig. 10a), which could support the proposed CNS origin of these proteins as indicated by our transcriptomics and histological data. However, the relative and longitudinal increase of SPP1 was more evident in ALS patient plasma rather than in CSF (Extended data Fig. 10 b, c) which was concordant with a higher predictive value in plasma.
Discussion
Our findings indicate the interdependence of vascular and neuronal systems and illustrate the novel, early contributions from perivascular fibroblast cells which were not previously considered in interpretations of ALS etiology. We propose that inclusion of vascular cell-specific inputs will likely improve prognostic accuracy at disease diagnosis and can help to re-evaluate the current view on mechanisms that facilitate neurodegeneration. Although the current neuron-centric view is valid from the motor phenotype standpoint, it may not be sufficient to explain the reported variety of sporadic ALS phenotypes5,25 and disease dynamics26. The existing assessments of disease dynamics, which are often based on neuronal axon-derived inputs (e.g. neurofilaments), general epidemiological descriptions (e.g. age at onset, diagnostic delay) or physiological factors (e.g. bulbar onset, functional rating scales), provide limited perspective for at least two reasons.
Firstly, current prognostic and causative assumptions are based on indicators of outcome (e.g. neurofilament proteins and disease progression scales) which likely reflect the damage already occurred, but not necessarily the early mechanisms and cell types that precede symptom onset. These presymptomatic mechanisms may not be directly reflected by motor phenotypes, as indicated by our mouse model observations, and are intrinsically difficult to observe in sporadic ALS patients. In addition, a recent attempt to stage ALS has defined its neuronal onset in the motor cortex but, in contrast to Alzheimer’s and Parkinson’s disease, showed no preclinical stages for neuronal cells27. Our report therefore focuses on cellular activity in presymptomatic ALS mice and demonstrates that induction of perivascular fibroblast transcripts, and deposition of the respective proteins largely precede neuroinflammation17 and neuronal loss28.
Secondly, considering the interdependency of cell types in the nervous system, the net outcome for ALS neurodegeneration dynamics is not only associated with, but also relies on support mechanisms from multiple cell types including blood vessels. However, current molecular factors that indicate survival variability in the clinics are mostly based on neuron-derived proteins and only recently on concurrent microglia-derived29 proteins which reflect late symptomatic stages of disease. Input from these cell types likely represents only partial accuracy of early prognosis and limits the design of therapeutic or preventive clinical trials. Herein we showed that the SPP1 protein alone had a stronger indication on survival prediction than did standard physiological or neuron-based inputs when measured at first clinical visit. Moreover, the increase of SPP1 remained the strongest indicator for poor survival when compared against bulbar onset and neurofilament levels in CSF using multivariate models.
We thus propose that the vascular response is a major independent indicator for ALS patient survival. Even though vascular dysfunction has previously been proposed as an epidemiological risk factor in humans30,31 and is observed in animal models4,11 our results instead provide a plausible molecular explanation for these associations, a potential target for therapy as well as practical prognostic tools for the wide population of sporadic ALS patients. Although speculative at this point, vascular remodeling may be important to ALS neurodegeneration because of its reported associated effects on the blood-brain barrier function4, reduced blood flow32,33, and/or decreased cerebral glucose uptake34. The prognostic value of SPP1 levels likely represents a general vascular injury response and has been reported beyond ALS neurodegeneration in several publications showing an increase of SPP1 as a reflection of the severity of cardiovascular35, inflammatory36 and malignant37 conditions. These conditions are all likely also represented in the age-matched non-motor neuron disease control group, and could explain the low relative difference in SPP1 levels between such controls and ALS patients.
From now on, it will be important to refine the descriptions of mechanisms in presymptomatic stages of ALS. Our data resource allows exploration of early cell-specific events and also highlights the unanticipated role of perivascular fibroblast proteins in survival prognosis. We propose that detailed studies of blood vessel-derived mechanisms should become a major focus in order improve prognostic accuracy. This could help to re-evaluate ALS etiology and to inform appropriate future therapeutic approaches although validity of SPP1 as a therapeutic target remains to be addressed with interventions. Since enlarged perivascular spaces are repeatedly observed in aging brains38, in dementia39 and in other neurological disorders40, perivascular fibroblast cell activity within those spaces could represent a common therapeutic target in cerebral injury.
Materials and methods
Bioinformatics
-. Expression weighted cell type enrichment (EWCE)
Top 250 genes regulated in bulk tissue transcriptomics datasets were analyzed for overrepresentation of cell-specific transcripts derived from single cell RNA-sequencing. Single cell RNA-seq data from two separate publications were used. The cortex mRNA expression data was downloaded from the associated website on the Linnarsson lab home (URL, https://storage.googleapis.com/linnarsson-lab-www-blobs/blobs/cortex/expression_mRNA_17-Aug-2014.txt)12. Duplicated gene symbols were dropped. Additional single cell RNA-seq data was obtained from the Marques et al 13 and downloaded from the associated webpage (http://www.ncbi.nlm.nih.gov/geo/download/?acc=GSE75330&format=file&file=GSE75330%5FMarques%5Fet%5Fal%5Fmol%5Fcounts2%2Etab%2Egz). Cells which were annotated as belonging to the cell class “(none)” were dropped from both datasets. The two single cell datasets were joined using the merge_two_expfiles() function from the EWCE package41. The level1class for the following cells were modified: Vsmc to “Vascular Smooth Muscle Cell” (n=62); Peric to “Pericytes” (n=21); Vend1 and Vend2 to “Vascular Endothelial” (n=137); astrocytes_ependymal to “Astrocytes”(n=224); pyramidal SS and CA1 to “Excitatory Neurons” (n=1338); NFOL*, MFOL* and MOL* to “Oligodendrocytes” (n=4528); OPC and COP to “Oligodendrocyte progenitors” (n=449); and PPR (Vascular and Leptomeningeal Cells) to “Perivascular Fibroblasts” (n=76). The labeling of “Microglia” (n=98) and “Interneuron” (n=290) cell categories were unchanged. Specificity data was calculated for the single cell dataset using the EWCE R package (available from github.com/NathanSkene/EWCE)41.
A third single-cell dataset from Vanlandewijck et al.22 was used for visual reference of vascular cell transcript specificity.
The mouse SOD1G93A spinal cord dataset42 was downloaded from GEO (accession GSE18597). Raw cell files were obtained and loaded into R using the affy package43. Probe annotations and mapping to HGNC symbols was done using the biomaRt R package44. All arrays were analyzed together, with a separate column included in the design matrix for each age and mutants at each age. Differential expression analysis was performed using the limma package45. The TARDBPQ331K/Q331K mouse dataset19 RNA-seq data files were obtained from GEO (accessions GSE99353 and GSE112575). Files were combined, feature names were corrected manually. Differential expression analysis was performed using edgeR and limma packages. The human spinal cord dataset46 was downloaded from GEO (accession GSE18920). The data from enriched motor neurons was dropped and only anterior horn samples were kept. Differential expression analysis was again performed using the limma package45 controlling for gender. EWCE analysis was performed on the top 250 up/down-regulated genes, sorted based on the t-statistic, using 10,000 bootstrap replicates for each analysis.
-. Gene ontology analysis
Human and mouse gene sets for gene ontology analysis were downloaded from geneontology.org. Enrichment of the gene sets within the ALS patient and mouse SOD1G93A expression data was analyzed with the mroast function from the limma R package, limiting for each platform the genes analyzed to the genes where data was available on the respective platform.
ALS mouse models
-. Mouse strains, housing
The SOD1G93A (B6SJL-Tg(SOD1*G93A)1Gur/J) strain used as an ALS model were a kind gift from Prof. Stefan Marklund, Tomas Brännström and Peter Andersen at Umeå University, Sweden. B6SJL-Tg(SOD1)2Gur/J mice overexpressing wild-type SOD1 were purchased from the Jackson Laboratory. Mice were housed in individually ventilated cages in a specific pathogen free facility and given free access to food and water with 12/12hour light cycle ambient room temperature 19-23°C and air humidity 40-60%. Symptomatic mice were given solid drink (#95-23-100) from Nova SCB. Transgene-bearing mice were identified by PCR genotyping as described previously7. SOD1 copy number was determined with qPCR using fluorescent probes for hSOD1 and mApoL and was carried as described in guidelines by the Jackson Laboratory47. Mice with more than a 0.5 dCt differences from the SOD1G93A reference DNA (Jackson Laboratories) were discarded from the colony.
Ethical approval
All the work involving animal or human subjects or tissues has been carried out in accordance with the Code of Ethics of the World Medical Association (Declaration of Helsinki) and with national legislation as well as our institutional guidelines. Animal experiments were approved and performed according to the guidelines of the North Stockholm Animal Ethics Committee. ALS patient plasma or CSF collection was approved by the ethics committees at Ulm University (application number 20/10), UMC Utrecht (SL/nb/16/004075) Leuven University (ML4073) and Karolinska Institute (2018/1605).
Immunostaining
-. ALS Subjects
Post-mortem material (Table 1.) https://figshare.com/s/4c89e57b39620d020f8d was obtained at autopsy from ALS patients at the department of (Neuro)pathology of the Amsterdam UMC, Academic Medical Center, University of Amsterdam, the Netherlands. All patients fulfilled the diagnostic criteria for ALS (El Escorial criteria)48 as reviewed independently by two neuropathologists. All patients with ALS died from respiratory failure. Control spinal cord tissue was obtained from patients who had died from a non-neurological disease. Both ALS and control patients included in the study displayed no signs of infection before death. Informed consent was obtained for the use of brain tissue and for access to medical records for research purposes and approval was obtained from the relevant local ethical committees for medical research. All autopsies were performed within 12 hours after death.
-. Tissue preparation
Paraffin-embedded tissue was sectioned at 6 μm and mounted on pre-coated glass slides (StarFrost, Waldemar Knittel Glasbearbeitungs GmbH, Braunschweig, Germany). Representative sections of all specimens were processed for haematoxylin and eosin and Klüver-Barrera.
-. Immunohistochemistry on spinal cord samples from sporadic ALS patients
For immunohistochemistry on human spinal cord samples, formalin-fixed paraffin-embedded 6 μm thick sections were deparaffinized in xylene and rinsed in graded ethanol (100%, 95%, 70%). Antigen retrieval was performed in 0.01M HCl with 0,5% Pepsin (Sigma Aldrich, Darmstadt, Germany, #P7012) at 37°C for 15 minutes in a water bath followed by incubation with a given primary antibody (Collagen IV, MS-747-S, Thermo Sci, 1:50; COL6A1, HPA019142, Atlas antibodies, 1:500; SPP1, AF1433, R&D, 1:50; LAMA1, Sigma L9393, 1:50). Incubation with primary antibody was performed overnight at 4°C. After washing in PBS, sections were stained with a polymer based peroxidase immunohistochemistry detection kit (Brightvision plus kit, ImmunoLogic, Duiven, the Netherlands) according to the manufacturer’s instructions. Staining was performed using Bright DAB substrate solution (ImmunoLogic, Duiven, the Netherlands). Sections were dehydrated in alcohol and xylene and coverslipped.
For double immunohistochemistry, sections were incubated with Brightvision poly-alkaline phosphatase-goat-anti mouse (Immunologic, Duiven, The Netherlands) for 30 min at RT and washed with PBS. Sections were washed with Tris–HCl buffer (0.1 M, pH 8.2) to adjust the pH. Alkaline phosphatase activity was visualized with the alkaline phosphatase substrate kit III Vector Blue (SK-5300, Vector laboratories Inc., CA, USA). The first primary antibody was cooked off by cooking in 10mM citrate buffer pH6.0 for 10 min at 100°C in a pressure cooker and subsequently incubated with the second primary antibody overnight at 4°C. The next day the sections were incubated with rabbit-anti-goat (SouthernBiotech #SBA 6164-01) for SPP1 for 15 min and then with Brightvision goat-anti-rabbit poly HRP for 30 min at RT, and washed with PBS. Horseradish peroxidase was visualized with filtered 5x10⁻⁴ % w/v AEC in in 0.05M acetate buffer pH 4,9 and 1x10⁻⁴ % H2O2. Sections incubated without primary antibodies were blank.
Sporadic ALS was defined as without the presence of C9ORF72 hexanucleotide repeat expansion or mutations analyzed by targeted NGS analysis. The NGS panel consists of TARBP, ALS2, ErbB4, NEK1, MATR3, VCP, SIGMAR1, c9orf72, c19orf12, OPTN, HNRNPA1, DAO, SPG11, FUS, GRN, PNPLA6, SOD1, CHCHD10, NEFH and UBQLN2.
For histopathological scoring, all labeled tissue sections were evaluated by two independent observers blinded to clinical data for the presence or absence of various histopathological parameters and specific immunoreactivity (IR) for the different markers. Hematoxylin-Eosin (HE) and Nissl stained slides were used to evaluate the neuronal and glial components of the tissues. The intensity of GFAP and HLA-DR (MHC-II) immunoreactive staining was evaluated using a scale of 0-3 (0: -, no; 1: +/-, weak; 2: +, moderate; 3: ++, strong staining). The frequency of GFAP and HLA-DR positive cells [(1) rare; (2) sparse; (3) high] was also evaluated to give information about the relative number of positive cells within the spinal cord (lumbal region). As proposed before49,50, the product of these two values (intensity and frequency scores) was taken to give the overall score (total score; immunoreactivity score; IRS). Key scoring: Frequency: (1)< 1-10 % (2) 11-50 % moderate; (3) > 50 %. Intensity: 0: not present; 1+, weak; 2+, moderate; 3+, strong.
Antibodies used for scoring included: Glial fibrillary acidic protein (GFAP; polyclonal rabbit, Z0334, DAKO, Glostrup, Denmark; 1:4000), neuronal nuclear protein (NeuN; mouse clone A60, MAB377 Merck-Millipore), major histocompatibility complex (MHC) class II antigen (HLA)-DP, DQ, DR (mouse clone CR3/43; M0775, DAKO, Glostrup, Denmark; 1:400) and CD68 (mouse clone PG-M1, M0876, DAKO; 1:200).
-. Mouse tissue immunofluorescence and confocal microscopy
Following PBS and PFA perfusion, mouse tissues were incubated with 30% sucrose solution overnight, embedded in frozen section media and snap frozen on dry ice. 16 μm sections were cut on a Micron cryostat for histology staining and quantifications. The following antibodies were used for immunostainings: Podocalyxin (AF1556 R&D; 1:250), Collagen IV (2150-1470 Serotec; 1:250), SPP1 (HPA027541, Atlas antibodies 1:250), COL6A1 (HPA019142, Atlas antibodies, 1:250) and LAMA1 (L9393, Sigma, 1:500). Secondary goat antibodies conjugated to Alexa Fluor 488, 555, 594 or 647 were purchased from Life Technologies and used at 1:500. Images were acquired using Zeiss LSM 700 confocal microscope and Zen software.
Transmission electron microscopy
Transmission electron microscopy was performed according to standard protocols. Briefly, mice were anesthetized and perfused with PBS. Spinal cords were excised and fixed in the fixation solution buffer (2% glutaraldehyde, 0.5% paraformaldehyde, 0.1 M cacodylate, 0.1 M sucrose, 3 mM CaCl2) and washed in 0.1 M cacodylate buffer (pH, 7.4) before staining in 2% OsO4 in cacodylate buffer for 1 hour at room temperature. Samples were dehydrated and en bloc staining was performed in 2% uranyl acetate in absolute ethanol for 1 hour at room temperature; samples were then taken through an Epon 812/acetone series and embedded at 60°C in pure Epon 812. Thin sections of 70 nm thickness were made on a Leica EM UC6 Ultratome and mounted on Formvar-coated copper slot grids. Post staining was done with 2% aqueous acetate (pH, 3.5) and Venable and Coggleshall lead citrate. Grids were analyzed on an FEI TECNAI electron microscope.
Image analysis
Quantifications of DAB and two-colour staining area from were performed with IHC image analysis toolbox for ImageJ. Two full frame 4x pictures adjusted for white background from each patient spinal cord tissue were analyzed to get per-patient average n result. Quantification for immunofluorescence in mouse spinal cords were performed by setting a common pixel intensity threshold and calculating pixel-intensity within positive area using ImageJ. A typical 3-4 frames taken at 20x objective were used to obtain per mouse average intensity. Pictures are presented as 3D renderings of 16μm thick sections from 10 z stacks and presented on white background using open source Icy software ver. 1.9.9.1. Perivascular space area in electron microscopy images was calculated from 3-5 regions of interest within the ventral horn grey matter that contained blood vessels acquired once from a group of 4 mice per genotype. First, we measured the areas outlined by mural and astrocyte basement membrane (BM). The gap was then calculated by subtracting the mural from astrocyte BM areas and divided by the mural BM area to normalize for individual vessel diameter.
Statistics and reproducibility
For immunostaining and transmission electron microscopy quantifications blinding was performed by third party concealment of treatments or genotypes and assignment of numeric codes to each group. Experiments were performed twice unless indicated otherwise. Representative graphs such as basement membrane structure presented by transmission electron microscopy or by histology stainings were based on observations found in 4 out of 4 analyzed animals or human cases or quantified in respective data panels. Data are expressed as median ± SEM. Box plots represent median, Statistical comparisons were made with GraphPad Prism or R analysis software using Student’s or Wilcoxon tests (2-tailed unless otherwise indicated). For all tests, a p-value of 0.05 or less was considered significant.
Patient cohorts for proteomics plasma profiling
Netherlands (Utrecht). Plasma samples and patient selection from Utrecht UMC was performed as described previously51. In short: patients diagnosed with suspected, possible, probable or definite ALS according to the El Escorial criteria were included. Patients with progressive muscular atrophy, primary lateral sclerosis and progressive bulbar palsy were excluded from analysis. In order to determine whether a patient fulfilled the El Escorial criteria, the correspondence of the neurologist, including results of neurophysiological examination, was scrutinized. The controls included plasma from general hospital admission from patients without motor neuron disease.
Germany (Ulm). Patients were diagnosed according to the El Escorial criteria including possible ALS. The controls were patients were sampled because of headache, differential diagnoses subarachnoid hemorrhage or differential diagnoses meningitis.
Belgium (Leuven). A total of 134 patients with ALS and 27 control patients were consecutively included in a prospective manner between April 2014 and September 2016. All patients were seen at the Neuromuscular Reference Center (NMRC) of the University Hospitals Leuven. The patients with ALS were diagnosed according to the Awaji and revised El Escorial criteria. Sampling occurred during the diagnostic phase of the patient with ALS. The control cohort consisted out of 20 neurologic non–motor neuron disease controls and 7 patients with nonspecific subjective complaints for whom an underlying neurologic condition was ruled out upon neurologic examination.
Blood samples were obtained during the first visit to the NMRC. Serum was extracted after 10 minutes of centrifugation at 1955g, transferred into coded cryovials of 1mL and stored at -80°C.
Sweden (Stockholm). Recruited patients received a diagnosis of ALS the Karolinska ALS center, an outpatient clinic that manages all ALS patients in the Greater Stockholm area. ALS patients who met the revised El Escorial criteria for definite, probable and probable laboratory-supported ALS were included.52 Patients that emigrated from the Stockholm region during the study period were excluded. ALS patients were regularly evaluated by a neurologist, who registered their clinical characteristics in the Swedish Motor Neuron Disease Quality Register.53 We further included siblings and partners of the ALS patients as healthy controls. We performed a neurological exam of the controls but did not assess their health status further. Healthy controls were recruited shortly after the diagnosis of the index patient (usually within six months). Of the included siblings, one sibling was related to an ALS patient that carried a C9orf72 repeat expansion, and one sibling was related to an ALS patient with a SOD1 mutation. For ALS patients, CSF and blood were collected at the time of diagnosis (+/- 90 days). All patients were offered repeated blood (once every three to six months) and CSF sampling (once per year). CSF and blood were collected from the ALS mimics during the diagnostic work-up, and from the healthy controls shortly after the diagnosis of the index patient. CSF was obtained through lumbar puncture directly into polypropylene tubes. The CSF samples were centrifugated for ten minutes at 400 g at room temperature. Plasma was collected close to the date of the lumbar puncture, and centrifugated for ten minute at 2,000 g at room temperature. Aliquots of 1 ml (CSF) and 800 μL (plasma) were directly frozen and stored in -80°C. NFL content in CSF was measured using the UmanDiagnostics ELISA kit, Sweden (cat no 10-7001).
Affinity proteomics of plasma
-. Antibody selection
Protein targets for plasma analysis were chosen based on mRNA transcript specificity to perivascular fibroblasts, their induction in the human or mouse transcriptomics and based on antibody availability within the Human Protein Atlas (HPA) project. A total of 32 antigen-purified and protein microarray validated antibodies were selected for 15 unique proteins. Results presented in the figures were based on antibodies against COL6A1 (HPA019142), SPP1 (HPA005562 or HPA027541).
-. Suspension bead array
The procedure for suspension bead arrays was performed as described previously54,55. In short, samples were distributed in 96-well microtiter plates, diluted 1:10 in phosphate buffered saline, and the protein content directly labeled with biotin. For the bead array, antibodies were immobilized onto magnetic color-coded beads with one bead identity corresponding to a certain antibody. Samples were then further diluted 1:50 in an assay buffer, heat treated at 56°C for 30 min, combined into a 384-well microtiter plate, and incubated with the bead array at RT on a shaker overnight. Unbound proteins were removed by washing and proteins on the beads were detected through a streptavidin-conjugated fluorophore (Invitrogen.com). Results from the FlexMap3D instrument (Luminex Corp.Com) were reported per bead identity as median fluorescence intensities (MFI). The CSF analysis was performed similar as for plasma with some minor adjustments as reported previously in (Pin et al 2019 (PMID 31432421). First, 15 ul of the samples were labelled with biotin in a protein containing buffer (PBS supplemented with 0.5% (w/v) bovine serum albumin and 0.1% (w/v) rabbit IgG at an end dilution of 1/2. For the assay, the samples were diluted 1/8 in assay buffer to and end volume of 50 ul before heat treatment.
-. Antibody validation
The SPP1 antibody was validated with Western blot. Plasma samples were diluted 1:40 in MilliQ and proteins separated on a gel before blotted on a membrane (all Invitrogen). Detection antibody was applied at 1 μg/mL and binding allowed at 4°C overnight followed by readout through a chemiluminescent substrate (BioRad.Com).
-. Suspension bead array data processing and statistical analysis
Data were processed and visualized in R (v. 3.6.1). Samples with less than 20 counted beads per identity as well as technically failed samples were excluded from further analysis. To diminish any plate effect, multidimensional normalization was applied with the assumption that the mean of each plate for each antibody should be close. MA-LOESS normalization was thereafter applied to reduce effects associated to the different assay plates followed by log transformation of the datasets. Coefficients of variation were calculated based on a pool of samples analyzed in triplicate in each 96-well plate. For combined cohort analysis the datasets were median scaled. Association between groups was assessed by Wilcoxon rank sum tests.
-. Optimization of plasma value cut-offs
To consider the effect of elevated protein levels, we determined optimal cut points to divide cohorts in “low” or “high” level groups for the proteins in question. Cut points were based on patient protein fluorescence intensity values in respect to survival. We used maximally selected rank statistics with the logrank test similar to Kaplan-Meier analysis using the “maxstat” package v.0.7-25 (https://CRAN.R-project.org/package=maxstat). All patient protein values were tested and considered as cut points excluding 10 percent from the upper and lower end of the protein values range. Survival was analyzed using “A Package for Survival Analysis in S” version 2.38. https://CRAN.R-project.org/package=survival. Kaplan-Meier graphs were plotted based on the empirical threshold groups using “survminer” package v. 0.4.4 (https://CRAN.R-project.org/package=survminer). The protein values for COL6A1 in the Belgian and Swedish cohorts yielded no clear cut point for survival groups and results shown are based on the threshold at the median value.
-. Cox proportional hazard
In order to assess the risk of having elevated protein levels in comparison to other variables we created univariate and multivariate Cox proportional hazard models. Variables tested were disease onset type, gender and age at sampling. Both univariate and multivariate models were corrected for sampling delay and cohort effect whenever applicable. Sampling delay was added as a stratification term, whereas we used a cluster term on cohort identities to adjust for possible unknown correlations within cohorts. The latter being a generalized estimating equation (GEE) term. Above analyses were performed in R version 3.6.1 (https://www.R-project.org/). Patient plasma data and analysis scripts for cut-off optimization and Cox proportional hazard are available at: https://github.com/lewandowskilab/PVF_Manuscript
Analysis of ALSFRS data at the time of plasma/CSF sampling
In this analysis, we aimed to assess the ALSFRS value at the time point of plasma/CSF sampling. Table 2 https://figshare.com/s/4c89e57b39620d020f8d displays the numbers of ALS patients who had ALSFRS data available in each of the cohorts, and who were included in the analysis. Patients were included if their date of clinical onset was known (at which point the ALSFRS = 48) and they had at least one ALSFRS measurement available with known date.
For each cohort, a subset of patients had ALSFRS available on the same date as the plasma/CSF sampling or within ± 10 days. For these patients, we used the actual ALSFRS measure.
For the remaining patients, we estimated the ALSFRS at the plasma/CSF sampling time point by fitting the available ALSFRS experimental data with a model. When only two data points were available (clinical onset at ALSFRS = 48 and one more ALSFRS), we performed a linear fit through the two points, and used that formula to estimate ALSFRS at the plasma/CSF sampling time point. When we had three or more ALSFRS data points, we used a sigmoid curve, following a method recently published56. This study has determined that when patients are followed longitudinally over multiple time points, the ALSFRS data follows a sigmoidal curve, being characterized by an initial phase of relatively gradual decline near the initial point of disease onset, followed by a time interval of relatively fast decline, and leading to a final stage of slower decline when patients are at a severe stage. The sigmoid function allows describing the whole ALSFRS temporal progression using two parameters, D50 and dx, as expressed by the following formula56:
where:
-
y
= individual ALSFRS scores over time for a given patient
-
x
= time point, number of months after clinical onset
-
numerator
= corresponds to the ALSFRS score (48) assumed at the time of clinical onset
-
D50
= parameter that is equal to the number of months after clinical onset (x) when the ALSFRS score (y) drops to half of its value at clinical onset, i.e., when y drops to 24
-
dx
= slope of the sigmoid curve at x = D50, with low dx values corresponding to steeper decline, and high dx values corresponding to slower decline at x = D50
For each individual patient, the ALSFRS-R scores were fitted to the sigmoid function using Microsoft® Excel Add-In Solver tool, by an iterative procedure used to simultaneously estimate the D50 and dx values that provide the best fit for the longitudinal ALSFRS-R data. The sigmoid model was applied if there were at least 3 time points for each patient.
Extended Data
Extended data Figure 1.
Extended data Figure 2.
Extended data Figure 3.
Extended data Figure 4.
Extended data Figure 5.
Extended data Figure 6.
Extended data Figure 7.
Extended data Figure 8.
Extended data Figure 9.
Extended data Figure 10.
Supplementary Material
Acknowledgements
S.A.L. is supported by the Olle Engkvist Byggmästare Foundation (SLS-499431), Ulla-Carin Lindquists stiftelse för ALS-forskning, Åhléns foundation (mA2/h17, 203074), Thierry Latran Foundation (FIB-ALS) and Neuroförbundet. N.S. was supported by Wellcome Trust (108726/Z/15/Z), Edmond J. Safra Foundation, Lily Safra and UK Dementia Research Institute. We thank the ALS Stichting grant “The Dutch ALS Tissue Bank” (E.A.) and Netherlands Brain Bank (E.H.) for providing the ALS tissue samples. We acknowledge the team who helped in the collection of ALS tissue samples (Prof. dr. D. Troost, Prof. dr. M. de Visser, Dr. A.J. van der Kooi and Dr. J. Raaphorst). U.K. and C.I. are supported by Björklunds Fund, the Ulla-Carin Lindquist Foundation, Neuro Sweden, SLL Halsa Medicin och Teknik. E.R-V. is supported by Swedish Alzheimer Foundation (Alzheimerfonden), Swedish Dementia Association (Demensfonden), Gun & Bertil Stohne’s Foundation, and Gamla Tjänarinnor Foundation. This project has received funding from the European Research Council (ERC) under the European Union’s Horizon 2020 research and innovation program (grant agreement n° 772376 – EScORIAL awarded to J.V. R.A.H. is supported by Alltid Litt Sterkere, AlzheimerFonden, Swedish Medical Research Council, Swedish brain foundation and Karolinska Institutet. M.L. was supported by a grant from the Knut and Alice Wallenberg Foundation (2012.0091). This study was also supported by grants to P.N. from the Swedish FTD initiative funded by the Schörling Family Foundation and the KTH Center for Applied Precision Medicine (KCAP) funded by the Erling-Persson Family Foundation. P.V.D. holds a senior clinical investigatorship of FWO-Vlaanderen and is supported by E. von Behring Chair for Neuromuscular and Neurodegenerative Disorders, the ALS Liga België and the KU Leuven funds “Een Hart voor ALS”, “Laeversfonds voor ALS Onderzoek” and the “Valéry Perrier Race against ALS Fund”. Several authors of this publication are member of the European Reference Network for Rare Neuromuscular Diseases (ERN-NMD). We would also like to thank Kjell Hultenby at Karolinska Institutet EM facility, Gudný Ella Thorlacius, Mun-Gwan Hong Sofia Bergström, Jamil Yousef, Heela Sarlus and Ali Manouchehrinia for support with data analysis and Tomas Brännström with Matthew Marklund for assistance with selection and harvest of SOD1G93A mouse tissues. S.A.L would like to thank the unpaid interns on Erasmus scholarships for their efforts and contributions.
Footnotes
Author contributions
N.S. and S.A.L. designed transcriptomics enrichment experiments.
N.S. and A.S. performed the computational analysis of enrichment experiments.
M.T., I.S.A., A.D. and P.L. performed additional transcriptomics analysis.
M.L., J.D.G. and S.A.L. facilitated and performed mouse histology and immunostaining.
I.V.G.A. performed histology validation experiments.
L.E., M.T. and S.A.L. performed electron microscopy imaging and quantifications.
R.A.H., E.H., J.A., C.M. and E.A., facilitated and performed human histology staining.
Clinical centers in: Ulm (A.H., A.L.), Utrecht (H.V.B., J.V.), Leuven (J.D.V., M.D.S., K.P., P.V.D.) and Stockholm (C.I., U.K.) - designed patient and control cohorts and provided plasma or CSF samples. S.A.L., A.M. and J.R. designed and chose protein targets for plasma profiling.
A.M., J.R., J.O., F.S., S.W. M.U., P.N., E.R-W. and C.I. facilitated and performed plasma profiling, survival associations, and clinical parameter statistics.
S.A.L. wrote the manuscript with input from the co-authors.
P.N., and S.A.L. oversaw all aspects of the study.
Competing Interests. We declare that the authors do not have competing interests.
Data availability
Human ALS patient transcriptome datasets and analysis scripts are available at: https://github.com/NathanSkene/ALS_Human_EWCE
SOD1G93A mouse transcriptome datasets and analysis scripts are available at: https://github.com/NathanSkene/ALS_Mouse_EWCE
TARDBPQ331K/Q331K mouse transcriptome datasets and analysis scripts are available at: https://github.com/szczepinskaa/ALS_TDP-43.git
Images and analysis scripts for human histology are deposited and available under the following links:
SPP1 in Red - https://figshare.com/s/3ad17913ca4fb2e99b80
COL6A1 in Red - https://figshare.com/s/f318c332f4fbc31b48a0
SPP1 in DAB - https://figshare.com/s/ee294c7715f77db7df14
COL6A1 in DAB - https://figshare.com/s/8c0ecbe9b3fbc63cfef0
Additional data tables are available at: https://figshare.com/s/4c89e57b39620d020f8d
Patient plasma data and analysis scripts for cut-off optimization and Cox proportional hazard are available at: https://github.com/lewandowskilab/PVF_Manuscript
Code availability
Human ALS patient transcriptome analysis scripts are available at: https://github.com/NathanSkene/ALS_Human_EWCE
SOD1G93A mouse transcriptome analysis scripts are available at: https://github.com/NathanSkene/ALS_Mouse_EWCE
TARDBPQ331K/Q331K mouse transcriptome analysis scripts are available at: https://github.com/szczepinskaa/ALS_TDP-43.git
Images and analysis scripts for human histology are deposited and available under the following links:
SPP1 in Red training model - https://figshare.com/s/3ad17913ca4fb2e99b80
COL6A1 in Red training model - https://figshare.com/s/f318c332f4fbc31b48a0
SPP1 in DAB training model - https://figshare.com/s/ee294c7715f77db7df14
COL6A1 in DAB training model and macro - https://figshare.com/s/8c0ecbe9b3fbc63cfef0
Patient plasma analysis scripts for cut-off optimization and Cox proportional hazard are available at: https://github.com/lewandowskilab/PVF_Manuscript
References
- 1.Cook C, Petrucelli L. Genetic Convergence Brings Clarity to the Enigmatic Red Line in ALS. Neuron. 2019;101:1057–1069. doi: 10.1016/j.neuron.2019.02.032. [DOI] [PubMed] [Google Scholar]
- 2.Spiller KJ, et al. Microglia-mediated recovery from ALS-relevant motor neuron degeneration in a mouse model of TDP-43 proteinopathy. Nat Neurosci. 2018;21:329–340. doi: 10.1038/s41593-018-0083-7. [DOI] [PMC free article] [PubMed] [Google Scholar]
- 3.Boillée S, et al. Onset and progression in inherited ALS determined by motor neurons and microglia. Science. 2006;312:1389–1392. doi: 10.1126/science.1123511. [DOI] [PubMed] [Google Scholar]
- 4.Lewandowski SA, et al. Presymptomatic activation of the PDGF-CC pathway accelerates onset of ALS neurodegeneration. Acta Neuropathol. 2016;131:453–64. doi: 10.1007/s00401-015-1520-2. [DOI] [PMC free article] [PubMed] [Google Scholar]
- 5.Brown RH, Al-Chalabi A. Amyotrophic Lateral Sclerosis. N Engl J Med. 2017;377:162–172. doi: 10.1056/NEJMra1603471. [DOI] [PubMed] [Google Scholar]
- 6.Al-Chalabi A, et al. Analysis of amyotrophic lateral sclerosis as a multistep process: A population-based modelling study. Lancet Neurol. 2014;13:1108–1113. doi: 10.1016/S1474-4422(14)70219-4. [DOI] [PMC free article] [PubMed] [Google Scholar]
- 7.Rosen DR, et al. Mutations in Cu/Zn superoxide dismutase gene are associated with familial amyotrophic lateral sclerosis. Nature. 1993;362:59–62. doi: 10.1038/362059a0. [DOI] [PubMed] [Google Scholar]
- 8.Sreedharan J, et al. TDP-43 mutations in familial and sporadic amyotrophic lateral sclerosis. Science. 2008;319:1668–72. doi: 10.1126/science.1154584. [DOI] [PMC free article] [PubMed] [Google Scholar]
- 9.Wu C-H, et al. Mutations in the profilin 1 gene cause familial amyotrophic lateral sclerosis. Nature. 2012;488:499–503. doi: 10.1038/nature11280. [DOI] [PMC free article] [PubMed] [Google Scholar]
- 10.Kang SH, et al. Degeneration and impaired regeneration of gray matter oligodendrocytes in amyotrophic lateral sclerosis. Nat Neurosci. 2013;16:571–9. doi: 10.1038/nn.3357. [DOI] [PMC free article] [PubMed] [Google Scholar]
- 11.Zhong Z, et al. ALS-causing SOD1 mutants generate vascular changes prior to motor neuron degeneration. Nat Neurosci. 2008;11:420–422. doi: 10.1038/nn2073. [DOI] [PMC free article] [PubMed] [Google Scholar]
- 12.Zeisel A, et al. Cell types in the mouse cortex and hippocampus revealed by single-cell RNA-seq. Science (80-) 2015;347:1138–42. doi: 10.1126/science.aaa1934. [DOI] [PubMed] [Google Scholar]
- 13.Marques S, et al. Oligodendrocyte heterogeneity in the mouse juvenile and adult central nervous system. Science (80-) 2016;352:1326–1329. doi: 10.1126/science.aaf6463. [DOI] [PMC free article] [PubMed] [Google Scholar]
- 14.Zeisel A, et al. Molecular Architecture of the Mouse Nervous System. Cell. 2018;174:999–1014.:e22. doi: 10.1016/j.cell.2018.06.021. [DOI] [PMC free article] [PubMed] [Google Scholar]
- 15.Skene NG, Grant SGN. Identification of vulnerable cell types in major brain disorders using single cell transcriptomes and expression weighted cell type enrichment. Front Neurosci. 2016;10:1–11. doi: 10.3389/fnins.2016.00016. [DOI] [PMC free article] [PubMed] [Google Scholar]
- 16.Clark JA, Southam KA, Blizzard CA, King AE, Dickson TC. Axonal degeneration, distal collateral branching and neuromuscular junction architecture alterations occur prior to symptom onset in the SOD1G93A mouse model of amyotrophic lateral sclerosis. J Chem Neuroanat. 2016;76:35–47. doi: 10.1016/j.jchemneu.2016.03.003. [DOI] [PubMed] [Google Scholar]
- 17.Hall ED, Oostveen JA, Gurney ME. Relationship of microglial and astrocytic activation to disease onset and progression in a transgenic model of familial ALS. Glia. 1998;23:249–56. doi: 10.1002/(sici)1098-1136(199807)23:3<249::aid-glia7>3.0.co;2-#. [DOI] [PubMed] [Google Scholar]
- 18.Weydt P, Hong SY, Kliot M, Möller T. Assessing disease onset and progression in the SOD1 mouse model of ALS. Neuroreport. 2003;14:1051–4. doi: 10.1097/01.wnr.0000073685.00308.89. [DOI] [PubMed] [Google Scholar]
- 19.White MA, et al. TDP-43 gains function due to perturbed autoregulation in a Tardbp knock-in mouse model of ALS-FTD. Nat Neurosci. 2018;21:552–563. doi: 10.1038/s41593-018-0113-5. [DOI] [PMC free article] [PubMed] [Google Scholar]
- 20.Chiu IM, et al. A Neurodegeneration-Specific Gene-Expression Signature of Acutely Isolated Microglia from an Amyotrophic Lateral Sclerosis Mouse Model. Cell Rep. 2013;4:385–401. doi: 10.1016/j.celrep.2013.06.018. [DOI] [PMC free article] [PubMed] [Google Scholar]
- 21.Sun S, et al. Translational profiling identifies a cascade of damage initiated in motor neurons and spreading to glia in mutant SOD1-mediated ALS. Proc Natl Acad Sci U S A. 2015;112:E6993-7002. doi: 10.1073/pnas.1520639112. [DOI] [PMC free article] [PubMed] [Google Scholar]
- 22.Vanlandewijck M, et al. A molecular atlas of cell types and zonation in the brain vasculature. Nature. 2018;554:475–480. doi: 10.1038/nature25739. [DOI] [PubMed] [Google Scholar]
- 23.Ma Q, Ineichen BV, Detmar M, Proulx ST. Outflow of cerebrospinal fluid is predominantly through lymphatic vessels and is reduced in aged mice. Nat Commun. 2017;8 doi: 10.1038/s41467-017-01484-6. [DOI] [PMC free article] [PubMed] [Google Scholar]
- 24.Kapoor KG, Katz SE, Grzybowski DM, Lubow M. Cerebrospinal fluid outflow: An evolving perspective. Brain Res Bull. 2008;77:327–334. doi: 10.1016/j.brainresbull.2008.08.009. [DOI] [PubMed] [Google Scholar]
- 25.Tam OH, et al. Postmortem Cortex Samples Identify Distinct Molecular Subtypes of ALS: Retrotransposon Activation, Oxidative Stress, and Activated Glia. Cell Rep. 2019;29:1164–1177.:e5. doi: 10.1016/j.celrep.2019.09.066. [DOI] [PMC free article] [PubMed] [Google Scholar]
- 26.Westeneng H-J, et al. Prognosis for patients with amyotrophic lateral sclerosis: development and validation of a personalised prediction model. Lancet Neurol. 2018;17:423–433. doi: 10.1016/S1474-4422(18)30089-9. [DOI] [PubMed] [Google Scholar]
- 27.Braak H, et al. Amyotrophic lateral sclerosis—a model of corticofugal axonal spread. Nat Publ Gr. 2013;9:708–714. doi: 10.1038/nrneurol.2013.221. [DOI] [PMC free article] [PubMed] [Google Scholar]
- 28.Chiu AY, et al. Age-Dependent Penetrance of Disease in a Transgenic Mouse Model of Familial Amyotrophic Lateral Sclerosis. Mol Cell Neurosci. 1995;6:349–362. doi: 10.1006/mcne.1995.1027. [DOI] [PubMed] [Google Scholar]
- 29.Gille B, et al. Inflammatory markers in cerebrospinal fluid : independent prognostic biomarkers in amyotrophic lateral sclerosis? 2019:1–9. doi: 10.1136/jnnp-2018-319586. [DOI] [PubMed] [Google Scholar]
- 30.Turner MR, Goldacre R, Talbot K, Goldacre MJ. Cerebrovascular injury as a risk factor for amyotrophic lateral sclerosis: Table 1. J Neurol Neurosurg Psychiatry. 2016;87:244–246. doi: 10.1136/jnnp-2015-311157. [DOI] [PMC free article] [PubMed] [Google Scholar]
- 31.Garton FC, Trabjerg BB, Wray NR, Agerbo E. Cardiovascular disease, psychiatric diagnosis and sex differences in the multistep hypothesis of amyotrophic lateral sclerosis. Eur J Neurol. 2020:1–10. doi: 10.1111/ene.14554. [DOI] [PubMed] [Google Scholar]
- 32.Rule RR, Schuff N, Miller RG, Weiner MW. Gray matter perfusion correlates with disease severity in ALS. Neurology. 2010;74:821–827. doi: 10.1212/WNL.0b013e3181d3e2dd. [DOI] [PMC free article] [PubMed] [Google Scholar]
- 33.Murphy MJ, et al. Widespread cerebral haemodynamics disturbances occur early in amyotrophic lateral sclerosis. Amyotroph Lateral Scler. 2012;13:202–9. doi: 10.3109/17482968.2011.625569. [DOI] [PubMed] [Google Scholar]
- 34.Van Laere K, et al. Value of 18fluorodeoxyglucose-positron-emission tomography in amyotrophic lateral sclerosis: a prospective study. JAMA Neurol. 2014;71:553–61. doi: 10.1001/jamaneurol.2014.62. [DOI] [PubMed] [Google Scholar]
- 35.Wolak T. Osteopontin - a multi-modal marker and mediator in atherosclerotic vascular disease. Atherosclerosis. 2014;236:327–37. doi: 10.1016/j.atherosclerosis.2014.07.004. [DOI] [PubMed] [Google Scholar]
- 36.Chiocchetti A, et al. Osteopontin Bridging Innate and Adaptive Immunity in Autoimmune Diseases. J Immunol Res. 2016;2016:1–15. doi: 10.1155/2016/7675437. [DOI] [PMC free article] [PubMed] [Google Scholar]
- 37.Zhao H, et al. The role of osteopontin in the progression of solid organ tumour. Cell Death Dis. 2018;9:356. doi: 10.1038/s41419-018-0391-6. [DOI] [PMC free article] [PubMed] [Google Scholar]
- 38.Ding J, et al. Large Perivascular Spaces Visible on Magnetic Resonance Imaging, Cerebral Small Vessel Disease Progression, and Risk of Dementia. JAMA Neurol. 2017;74:1105. doi: 10.1001/jamaneurol.2017.1397. [DOI] [PMC free article] [PubMed] [Google Scholar]
- 39.Smeijer D, Ikram MK, Hilal S. Enlarged Perivascular Spaces and Dementia: A Systematic Review. J Alzheimer’s Dis. 2019;72:247–256. doi: 10.3233/JAD-190527. [DOI] [PMC free article] [PubMed] [Google Scholar]
- 40.Brown R, et al. Understanding the role of the perivascular space in cerebral small vessel disease. Cardiovasc Res. 2018;114:1462–1473. doi: 10.1093/cvr/cvy113. [DOI] [PMC free article] [PubMed] [Google Scholar]
- 41.Skene NG, Grant SGN. Identification of vulnerable cell types in major brain disorders using single cell transcriptomes and expression weighted cell type enrichment. Front Neurosci. 2016;10:1–11. doi: 10.3389/fnins.2016.00016. [DOI] [PMC free article] [PubMed] [Google Scholar]
- 42.Lerman BJ, et al. Deletion of galectin-3 exacerbates microglial activation and accelerates disease progression and demise in a SOD1 G93A mouse model of amyotrophic lateral sclerosis. Brain Behav. 2012;2:563–575. doi: 10.1002/brb3.75. [DOI] [PMC free article] [PubMed] [Google Scholar]
- 43.Gautier L, Cope L, Bolstad BM, Irizarry RA. affy--analysis of Affymetrix GeneChip data at the probe level. Bioinformatics. 2004;20:307–315. doi: 10.1093/bioinformatics/btg405. [DOI] [PubMed] [Google Scholar]
- 44.Durinck S, Spellman PT, Birney E, Huber W. Mapping identifiers for the integration of genomic datasets with the R/Bioconductor package biomaRt. Nat Protoc. 2009;4:1184–1191. doi: 10.1038/nprot.2009.97. [DOI] [PMC free article] [PubMed] [Google Scholar]
- 45.Ritchie ME, et al. limma powers differential expression analyses for RNA-sequencing and microarray studies. Nucleic Acids Res. 2015;43:e47-e47. doi: 10.1093/nar/gkv007. [DOI] [PMC free article] [PubMed] [Google Scholar]
- 46.Rabin SJ, et al. Sporadic ALS has compartment-specific aberrant exon splicing and altered cell-matrix adhesion biology. Hum Mol Genet. 2009;19:313–328. doi: 10.1093/hmg/ddp498. [DOI] [PMC free article] [PubMed] [Google Scholar]
- 47.Harbor B. Working with ALS Mice. Jax. 2009:1–28. [Google Scholar]
- 48.Ludolph A, et al. A revision of the El Escorial criteria - 2015. Amyotroph Lateral Scler Front Degener. 2015;16:291–292. doi: 10.3109/21678421.2015.1049183. [DOI] [PubMed] [Google Scholar]
- 49.van Vliet EA, et al. Expression and Cellular Distribution of P-Glycoprotein and Breast Cancer Resistance Protein in Amyotrophic Lateral Sclerosis Patients. J Neuropathol Exp Neurol. 2020;79:266–276. doi: 10.1093/jnen/nlz142. [DOI] [PMC free article] [PubMed] [Google Scholar]
- 50.Casula M, et al. Toll-like receptor signaling in amyotrophic lateral sclerosis spinal cord tissue. Neuroscience. 2011;179:233–243. doi: 10.1016/j.neuroscience.2011.02.001. [DOI] [PubMed] [Google Scholar]
- 51.Huisman MHB, et al. Population based epidemiology of amyotrophic lateral sclerosis using capture-recapture methodology. J Neurol Neurosurg & Psychiatry. 2011;82:1165 LP-1170. doi: 10.1136/jnnp.2011.244939. [DOI] [PubMed] [Google Scholar]
- 52.Brooks BR, Miller RG, Swash M, Munsat TL. El Escorial revisited: Revised criteria for the diagnosis of amyotrophic lateral sclerosis. Amyotroph Lateral Scler Other Mot Neuron Disord. 2000;1:293–299. doi: 10.1080/146608200300079536. [DOI] [PubMed] [Google Scholar]
- 53.Wallin N, et al. The Swedish motor neuron disease quality registry. 2018 doi: 10.1080/21678421.2018.1497065. [DOI] [PubMed] [Google Scholar]
- 54.Schwenk JM, Gry M, Rimini R, Uhlén M, Nilsson P. Antibody Suspension Bead Arrays within Serum Proteomics. J Proteome Res. 2008;7:3168–3179. doi: 10.1021/pr700890b. [DOI] [PubMed] [Google Scholar]
- 55.Häggmark A, et al. Plasma profiling reveals three proteins associated to amyotrophic lateral sclerosis. Ann Clin Transl Neurol. 2014;1:544–53. doi: 10.1002/acn3.83. [DOI] [PMC free article] [PubMed] [Google Scholar]
- 56.Poesen K, et al. Neurofilament markers for ALS correlate with extent of upper and lower motor neuron disease. Neurology. 2017;88:2302–2309. doi: 10.1212/WNL.0000000000004029. [DOI] [PubMed] [Google Scholar]
Associated Data
This section collects any data citations, data availability statements, or supplementary materials included in this article.
Supplementary Materials
Data Availability Statement
Human ALS patient transcriptome datasets and analysis scripts are available at: https://github.com/NathanSkene/ALS_Human_EWCE
SOD1G93A mouse transcriptome datasets and analysis scripts are available at: https://github.com/NathanSkene/ALS_Mouse_EWCE
TARDBPQ331K/Q331K mouse transcriptome datasets and analysis scripts are available at: https://github.com/szczepinskaa/ALS_TDP-43.git
Images and analysis scripts for human histology are deposited and available under the following links:
SPP1 in Red - https://figshare.com/s/3ad17913ca4fb2e99b80
COL6A1 in Red - https://figshare.com/s/f318c332f4fbc31b48a0
SPP1 in DAB - https://figshare.com/s/ee294c7715f77db7df14
COL6A1 in DAB - https://figshare.com/s/8c0ecbe9b3fbc63cfef0
Additional data tables are available at: https://figshare.com/s/4c89e57b39620d020f8d
Patient plasma data and analysis scripts for cut-off optimization and Cox proportional hazard are available at: https://github.com/lewandowskilab/PVF_Manuscript
Human ALS patient transcriptome analysis scripts are available at: https://github.com/NathanSkene/ALS_Human_EWCE
SOD1G93A mouse transcriptome analysis scripts are available at: https://github.com/NathanSkene/ALS_Mouse_EWCE
TARDBPQ331K/Q331K mouse transcriptome analysis scripts are available at: https://github.com/szczepinskaa/ALS_TDP-43.git
Images and analysis scripts for human histology are deposited and available under the following links:
SPP1 in Red training model - https://figshare.com/s/3ad17913ca4fb2e99b80
COL6A1 in Red training model - https://figshare.com/s/f318c332f4fbc31b48a0
SPP1 in DAB training model - https://figshare.com/s/ee294c7715f77db7df14
COL6A1 in DAB training model and macro - https://figshare.com/s/8c0ecbe9b3fbc63cfef0
Patient plasma analysis scripts for cut-off optimization and Cox proportional hazard are available at: https://github.com/lewandowskilab/PVF_Manuscript


