Abstract
Primary sensory cortex is thought to process incoming sensory information, while decision variables important for driving behavior are assumed to arise downstream in the processing hierarchy. We used population two-photon calcium imaging and targeted two-photon optogenetic stimulation of neurons in layer 2/3 of mouse primary somatosensory cortex (S1) during a texture discrimination task to test for the presence of decision signals and probe their behavioral relevance. Small but distinct populations of neurons carried information about the stimulus irrespective of the behavioral outcome (‘stimulus neurons’), or about the choice irrespective of the presented stimulus (‘decision neurons’). Decision neurons show categorical coding that develops during learning, and lack a conclusive decision signal in miss trials. All-optical photostimulation of decision neurons improves behavioral performance, establishing a causal role in driving behavior. The fact that stimulus and decision neurons are intermingled challenges the idea of S1 as a purely sensory area, and causal perturbation suggests a direct involvement of S1 decision neurons in the decision-making process.
Introduction
Understanding the neural circuit mechanisms that transform sensory information into behavior is a fundamental goal of neuroscience. Where and how decision signals, i.e. internal variables that carry choice-relevant activity, are generated along the pathway to make an informed choice is key to understanding this transformation. The anatomical and conceptual separation of input-related sensory areas and output-related motor areas, has led to the prevailing idea that sensory areas extract information about the stimulus1–3 while higher cortical areas use this information to generate decision variables 4–8. This framework of hierarchical and anatomically-defined processing steps has fostered ground-breaking studies in the visual system describing the transformation of sensory signals along the visual pathway1,9. In the somatosensory system of monkeys seminal work by Romo and colleagues suggested that neurons in S1 primarily represent stimulus information while decision signals appear downstream in secondary somatosensory cortex (S2)4,10–12. As a consequence, S1 has only rarely been discussed as a potential locus of decision variables in perceptual decision-making5–8.
These findings were corroborated by work in rats and mice that reported stimulus-specific coding and a lack of decision coding activity in S113–15. However, a series of recent studies found that activity of neurons in L2/3 of S1 in mice performing a “go/no go” task can be correlated with behavioral choice16–19. These demonstrations of choice-related activity in S1 appear to be in direct conflict with earlier work in monkeys, rats and mice. In these more recent studies, the behavioral report of detecting a stimulus is either a response (‘go’) or the withhold of a response (‘no go’). In trials where the animals responded, L2/3 S1 neurons exhibited higher activity. It is unclear whether this signal difference across trial types reflects behaviorally-relevant decision coding, or a modulation of neural activity by action-related variables – such as motivation, movement preparation, feedback from the movement, sensory input that results from the movement, or reward-related activity – which have been shown to be widespread across the brain20–22. For example in primary visual cortex (V1), similar choice-related activity was observed during a go/no go task23, which has been challenged by studies reporting the absence of choice-related activity in symmetric choice tasks that avoid the imbalance in behavior across trial types22,24. In summary, studies across mice, rats and monkeys suggest that neurons in S1 only carry stimulus information2,13,15,25 in line with the idea of a strict processing hierarchy. However, recent studies reported putative choice signals in superficial neurons in S116–18 referring to a difference in activity in trials with a different choice action (go vs no go).
To test whether neurons in L2/3 of S1 carry behaviorally-relevant decision information, it is crucial to use a task that features choice actions with symmetrical movement patterns. Moreover, we need a cued task design to separate the stimulus period from the choice action, as well as population recordings to allow dense sampling from as many neurons in L2/3 as possible. In a task with symmetric choice actions, differential neural activity before the motor action that aligns with the behavioral outcome can be distinguished from modulation of neural activity by action-related variables. Finally, to establish whether choice-related neural activity is indeed causally involved in the decision-making process, it is necessary to directly manipulate neuronal activity26,27 during behavior.
Here, we have addressed these challenges by training mice to perform a cued two-choice texture discrimination task in which the behavioral choice was indicated by licking one of two lickports19. Mice had to discriminate different texture stimuli while we recorded neuronal activity simultaneously from hundreds of neurons using two-photon calcium imaging of L2/3 neurons spanning multiple barrels. We then used an all-optical combination of two-photon optogenetic stimulation and two-photon calcium imaging in behaving mice to specifically activate ensembles of neurons that encode task-related information while reading out the activity from nearby neurons 28–31. We show that in Correct trials, where stimulus and choice are correlated, the activity of many neurons (‘trial-coding neurons’) in L2/3 is modulated by the trial type (‘Smooth’ (S) or ‘Rough’ (R)). When comparing the activity of trial-coding neurons in Correct and Incorrect trials across the two stimuli, we find that the activity of the majority of trial-coding neurons in Incorrect trials was either aligned to the same stimulus as in Correct trials, or to the other stimulus. Activity in a subset of trial-coding neurons tracked stimulus identity irrespective of behavioral choice (‘stimulus neurons’) while a different subset encoded behavioral choice irrespective of stimulus identity (‘decision neurons’). On miss trials, stimulus information was variable but a conclusive decision signal across the decision neuron population was absent. We find that stimulus and decision neurons exhibit differential activity patterns over time during the trial with the peak of activity of decision neurons following stimulus neuron activity. We also demonstrate that activity in decision neurons is not encoding a directional lick signal. Using targeted photostimulation and analysis of shared trial-by-trial variability we show that stimulus and decision neurons exhibit different functional connectivity and local circuit integration. We further train animals to discriminate four textures and find that categorical coding of the choice develops during learning, which might reflect the formation of a stimulus-choice association. Finally, to test the behavioral relevance of decision-related activity in L2/3 S1, we use targeted photostimulation during behavior and find that this early decision variable in L2/3 S1 is causally involved in perceptual decision making. Thus, S1 is not just a sensory area extracting stimulus information, but also encodes choice-related information that is directly involved in the decision-making process.
Results
Task-dependent activity in L2/3 of barrel cortex
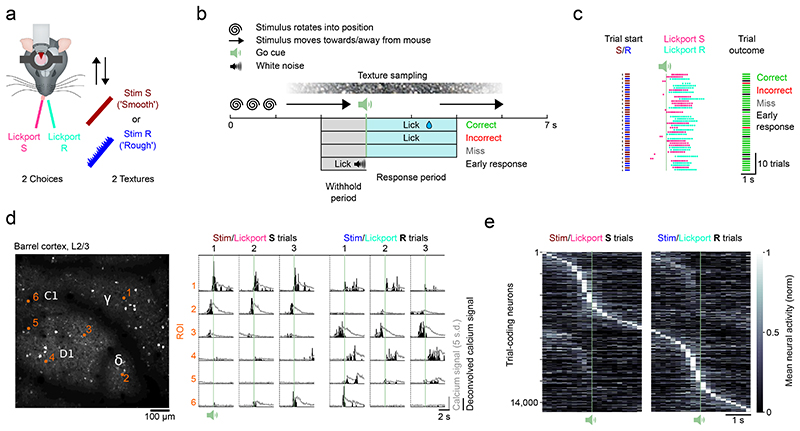
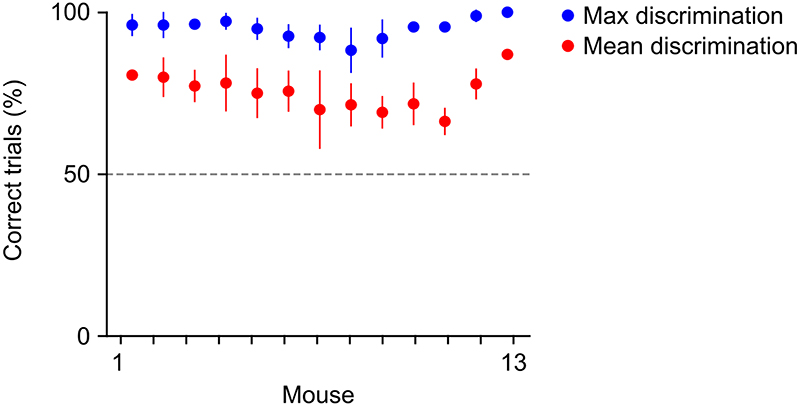
We trained head-fixed mice to perform a two-choice texture discrimination task in which one of two textures was presented in each trial. Mice reported the identity of the stimulus by licking one of two lickports associated with each stimulus (Fig. 1a). At the start of each trial, one texture was moved into contact with the whiskers of the mouse to allow free sampling. 3 seconds after the beginning of the trial and approximately 1 second after the first touch between whiskers and the texture, an auditory go cue signaled the start of the response window (2 s) (Fig. 1b). Licking the lickport associated with the texture within the response window resulted in a ‘Correct’ trial and released a sugar water reward. Licking the wrong lickport was neither rewarded nor punished (‘Incorrect’). Licking a lickport within the sampling period but before the go cue triggered an auditory punishment (1 s white noise) and the trial was aborted (‘Early response’). Failure to lick any lickport during the withhold window or response window resulted in a ‘Miss’ trial. Thirteen mice learned to perform the two-texture discrimination task with high accuracy (Fig. 1c and Extended Data Fig. 1). Mice performed 436 ± 114 (mean ± s.d.) trials per session. Analysis was performed on Correct and Incorrect trials in periods during which the mouse did not show a consistent lickport bias (trials without lickport bias: 355 ± 99 (mean ± s.d.), see Methods), amounting to on average 197 ± 57 (mean ± s.d.) Correct trials and 80 ± 44 (mean ± s.d.) Incorrect trials per session.
Figure 1. Imaging task-dependent activity in L2/3 barrel cortex during a two-choice texture discrimination task.
a) Experimental set-up of the two-choice texture discrimination task with simultaneous two-photon imaging. Stim S = Smooth sandpaper, Stim R = Rough sandpaper. b) Trial structure and trial outcomes. c) Behavioral data from 44 consecutive trials of a single session with two textures. d) Left, Imaging field of view (depth = 140 μm) with located barrel centers (C1, D1, γ, δ) and selected neurons (orange numbers). Repeated for all mice (n = 13). Right, fluorescence (grey) and deconvolved fluorescence (black) traces from selected neurons. Traces are aligned to the trial start. Fluorescence traces have been corrected for neuropil contamination, baselined and z-scored. e) Normalized mean activity of all trial-coding neurons, i.e. neurons that distinguish between correct Stim/Lickport S and correct Stim/Lickport R trials. Neurons sorted by trial type preference and time of maximum activity. Single-plane recordings (30 Hz sampling rate) have been binned to match multi-plane recordings (5 Hz sampling rate).
We used two-photon calcium imaging to record population activity in barrel cortex across multiple barrels from excitatory neurons expressing GCaMP6s17,18,32 in a 798 μm × 798 μm field-of-view (FOV) (Fig. 1d, left). We captured the activity of 774 ± 240 (mean ± s.d.) neurons per imaging plane in each recording (total number of neurons: 61,895). We found that a subset of neurons in L2/3 barrel cortex showed trial-type-dependent responses (Fig. 1d, right). We then applied receiver operating characteristic (ROC) analysis to find neurons whose activity in the second before the lick differed between Correct trials with the smooth stimulus (‘Stim S’) and Correct trials with the rough stimulus (‘Stim R’) presented. We found that the activity of 25.2% ± 7.9% (mean ± s.d.) of neurons within a FOV encoded the trial type in Correct trials (Stim/Lickport S vs Stim/Lickport R trials) and refer to them as trial-coding neurons (Fig. 1e).
Stimulus and decision coding in L2/3 barrel cortex neurons
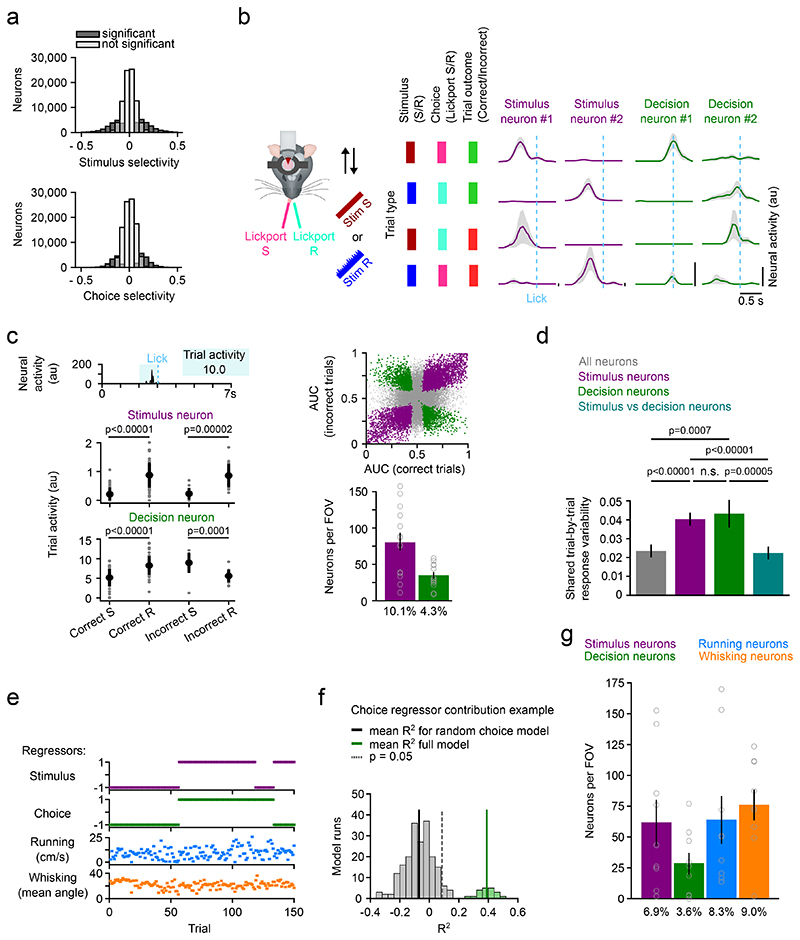
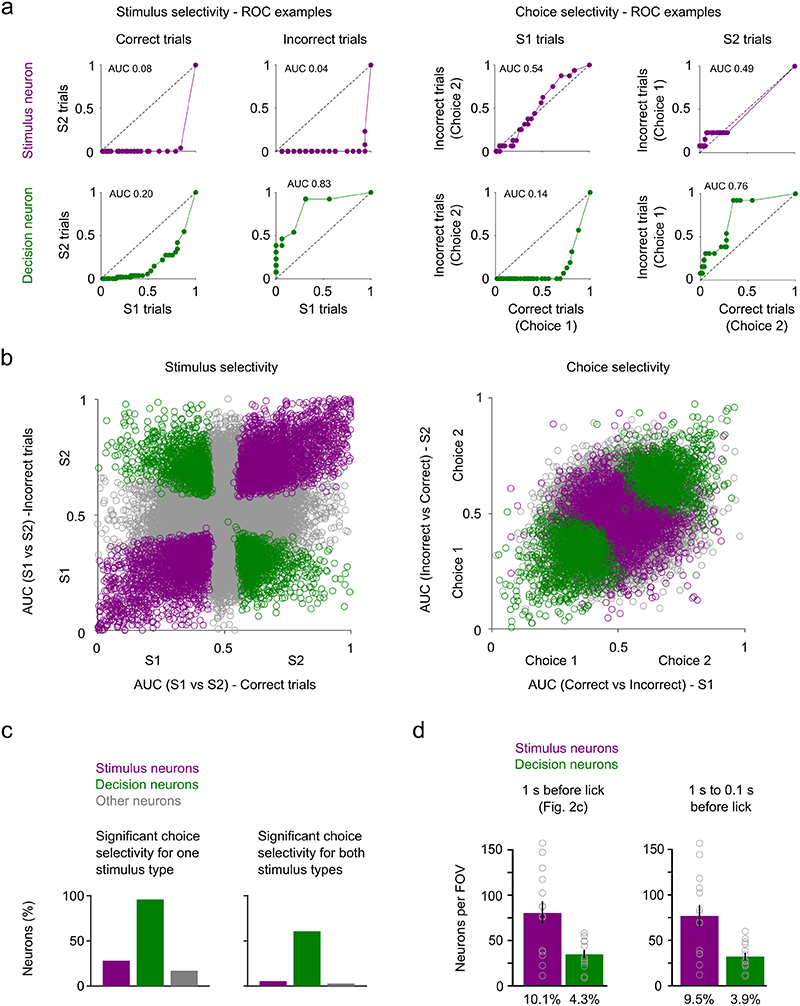
It is unclear whether a trial-coding neuron encodes the stimulus identity or the choice because a priori stimulus and choice are perfectly aligned in Correct trials. To test for choice coding in comparison to stimulus coding in the neural activity we calculated stimulus and choice selectivity for all neurons using a similar ROC analysis as described above but separated by trial type33 (Fig. 2a, Extended Data Fig. 2a-c; Stimulus selectivity: Stim S vs Stim R in Correct or Incorrect trials; Choice selectivity: Correct vs Incorrect in Stim S or Stim R trials). We found that 36% of all neurons encoded the Stimulus type and 31% of all neurons encoded the Choice. To assess whether neurons with high stimulus selectivity encode the same stimulus in Correct and Incorrect trials, we looked at the activity patterns across trial types and found that a subset of these neurons encoded the same stimulus identity irrespective of the animal’s choice (Fig. 2b). We refer to these neurons as “stimulus neurons”. The activity of a different subset of neurons aligned with the behavioral choice of the mouse across different trial types. We refer to these neurons that exhibit selective firing to a specific choice irrespective of the type of stimulus that was presented as “decision neurons “ (Fig. 2b). We reliably found stimulus and decision neurons across all mice performing the two-choice texture discrimination task and stimulus and decision neurons show higher response reliability than other neurons in the FOV (Supplementary Fig. 1). Using ROC analysis (Stim S vs Stim R in Correct and Incorrect trials), we find that 10.1% ± 1.7% (mean ± s.e.m.) of all neurons in the FOV identify as stimulus neurons and 4.3% ± 0.6% (mean ± s.e.m.) as decision neurons (Fig. 2c).
Figure 2. Stimulus and decision coding in L2/3 barrel cortex neurons.
a) Stimulus and choice selectivity for all neurons. Two conditions for each neuron (Stimulus selectivity: Correct and Incorrect trials; Choice selectivity: Stim S and Stim R trials). Neurons with significant selectivity in a condition are labelled in dark grey. b) Trial-averaged activity of four example neurons recorded during the two-choice two-texture task. Activity split by trial type. Activity was aligned to the lick of the mouse. Mean ± s.e.m. Neural activity is neuropil-corrected and deconvolved calcium signals. c) Top left, Trial activity is calculated by averaging neural activity 1 s before the lick. Bottom left, Trial activity of an example stimulus and an example decision neuron across trial types. Top right, ROC AUC values for all neurons. Neurons with significant stimulus coding in purple and neurons with significant decision coding in green. Bottom right, Number and percentage of stimulus and decision coding neurons per FOV (693 × 693 μm). N = 14 FOVs (13 mice), mean ± s.e.m.. Grey open circles denote individual FOVs. d) Pairwise correlation of the response to repeated presentations of identical stimuli for all neurons, stimulus neurons, decision neurons, and between stimulus and decision neuron pairs. N = 63 FOVs, two-sided Wilcoxon signed-rank test, mean ± s.e.m.. e) The four regressors, sorted by stimulus and choice across trials, used to train the gaussian GLM: Stimulus, choice, running, and whisking. f) Identification of variance uniquely explained by each of the regressors using semi-partial regression. The mean variance explained for each neuron using all regressors is compared to the performance of a model with one randomized regressor. In this example the choice regressor was randomized 400x to generate a distribution of random choice regressor models. Neurons whose activity is predicted better with the regressor of interest (p < 0.05, one-sided t-test) are considered to encode information about the regressor of interest. g) Number and percentage of neurons identified to contain information on each of the four regressors per FOV. Grey open circles denote indiviual mice. N = 9 mice, mean ± s.e.m.
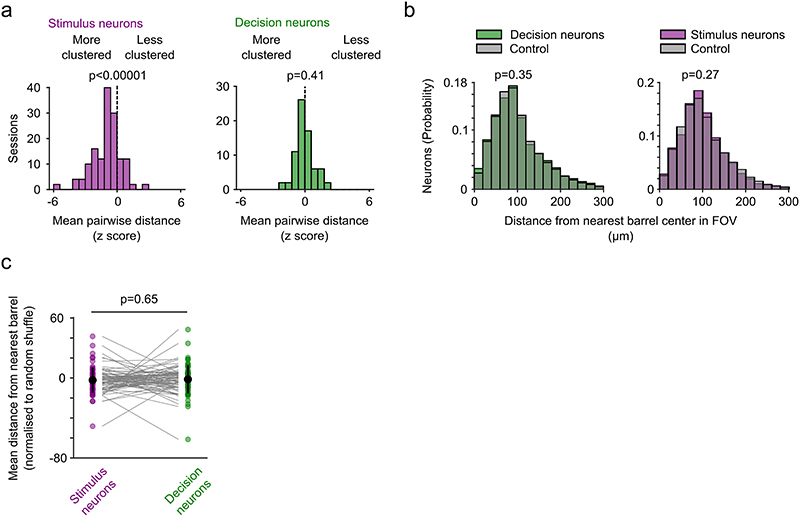
To further characterize the local network integration of stimulus and decision neurons in S1 we analyzed their shared variability and spatial clustering. If stimulus and decision neurons are part of distinct functional subnetworks within L2/3 barrel cortex, we hypothesized that shared trial-by-trial response variability between neuron pairs would be stronger within each group compared to across group34–36. Indeed, we found that trial-by-trial response variability is stronger within either group than across groups or across all neurons in L2/3 (Fig. 2d). Despite no obvious clustering with respect to barrel centers in either subgroup, the population of stimulus neurons exhibits a slight spatial clustering across the FOV whereas decision neurons are distributed uniformly (Extended Data Fig. 3). Together, these results suggest that stimulus and decision neurons form distinct subgroups that are distinguishable in more than just the trial-coding dimension.
To rule out that the decision signal in decision neurons is primarily driven by movements associated with the choice action, we performed a series of analyses. First, we repeated our ROC analysis of stimulus and decision neurons but restricted the analysis window to 100 ms before the lick and show that we can detect similar numbers of decision neurons (Extended Data Fig. 2d, 9.5% ± 1.6% stimulus neurons and 3.9% ± 0.5% decision neurons, mean ± s.e.m.). This means that the decision signal is present before a potential motor signal. To test the possibility that the decision signal in decision neurons is driven by whisking or running we tracked whisker movement and running in a subset of sessions and built a generalized linear model (GLM) to dissect the impact of four regressors: Stimulus type, behavioral choice, running speed and whisking (9 mice, 2 sessions each, Fig. 2e, Extended Data Fig. 4a-b). To identify the unique contribution of each regressor we calculated how much of the average trial activity of a given neuron is explained by any of the regressors using semi-partial regression with randomized regressors (Fig. 2f, Extended Data Fig. 4c-d). We found that 8.3% ± 2.5% (mean ± s.e.m.) of neurons encode running information, 9.0% ± 1.5% (mean ± s.e.m.) encode whisking information and 6.9% ± 2.0% (mean ± s.e.m.) encode stimulus information. However, in 3.6% ± 1.2% (mean ± s.e.m.) of neurons, the choice regressor was able to explain neural activity that was not explained by stimulus, running, or whisking (Fig. 2g, Extended Data Fig. 4e-f). Therefore, decision signals in L2/3 are not simply a result of licking, running or whisking movements correlated with the choice of the mouse.
Distinct activity patterns in stimulus and decision neurons
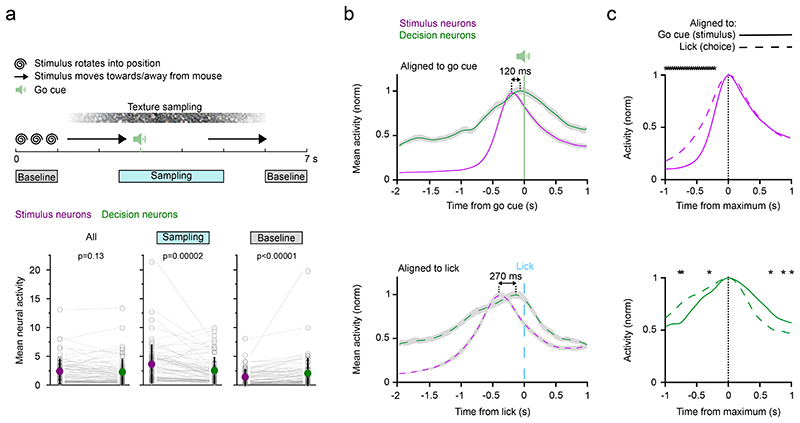
We found that stimulus neurons are more active during the sampling period than decision neurons, whereas decision neurons show more activity outside of the sampling period compared to stimulus neurons (Fig. 3a). However, activity in both neuron types rises sharply after the onset of sensory input and the majority of stimulus and decision neurons peak before the go cue and the lick (Extended Data Fig. 5a). When we aligned the activity of stimulus and decision neurons to the go cue as a proxy for stimulus presentation as well as to the lick of the mouse (Fig. 3b), the activity in both stimulus and decision neurons rose more quickly when aligned to the stimulus presentation than when aligned to the lick (Fig. 3c; stimulus neuron activity rise time (Stimulus): 400 ms; rise time (Lick): 633 ms; decision neuron activity rise time (Stimulus): 600 ms; rise time (Lick): 767 ms; rise time from 10% to 90% of peak activity). Aligning stimulus and decision neuron activity to the first whisker touch in a subset of sessions in which whisker kinematics were recorded reveals similar results (Extended Data Fig. 5b-d). This suggests that activity in both neuron types is driven preferentially by stimulus presentation. The peak of decision neuron activity followed the peak of stimulus neurons in both conditions with a difference in peak time of 120 ms or 270 ms when aligned to the stimulus or the lick, respectively. For the decay of the signal, decision neuron activity fell more quickly when aligned to the lick than the stimulus and started to decay before the first lick (decision neuron activity decay time (Stimulus): 567 ms; decay time (Lick): 433 ms; decay to 50% of peak activity). Together, these analyses indicate that stimulus and decision neuron activity follows sensory input and precedes the lick, that decision neuron activity decays quickly once the lick is initiated and that stimulus neuron activity peaks before decision neuron activity.
Figure 3. Subset-specific activity patterns and timing in stimulus and decision neurons.
a) Top, Trial structure to indicate “Baseline” and “Sampling” periods. Bottom, mean neural activity of stimulus and decision neurons throughout the trial and during the Sampling and Baseline period. Neural activity is neuropil-corrected and deconvolved calcium signals. N = 63 sessions, mean ± s.e.m., , two-sided Wilcoxon signed-rank test. Grey open circles denote indiviual sessions. b) Activity of stimulus and decision neurons averaged across sessions and aligned to the go cue/stimulus onset (top) or the lick/choice of the mouse (bottom). The go cue serves as a proxy for the stimulus onset which is perfectly correlated with the go cue but with a small jitter due to trial-specific whisker movements. Line and shaded area represent mean ± s.e.m.. c) The same activity traces but sorted by neuron type and aligned to the peak. Top, the sharp activity onset in stimulus neurons aligned to the stimulus differs from the rise in activity when aligned to the lick. Bottom, Decision neuron activity falls off faster when activity is aligned to the lick in comparison to activity aligned to the stimulus. But activity rises more sharply when aligned to the go cue in comparison to activity aligned to the lick. Bin-wise comparison, n = 35 sessions, stars indicate bins with p < 8.2 × 10⁻⁴ (Bonferroni corrected significance level), two-sided Wilcoxon signed-rank test.
Categorical code in decision neurons develops with learning
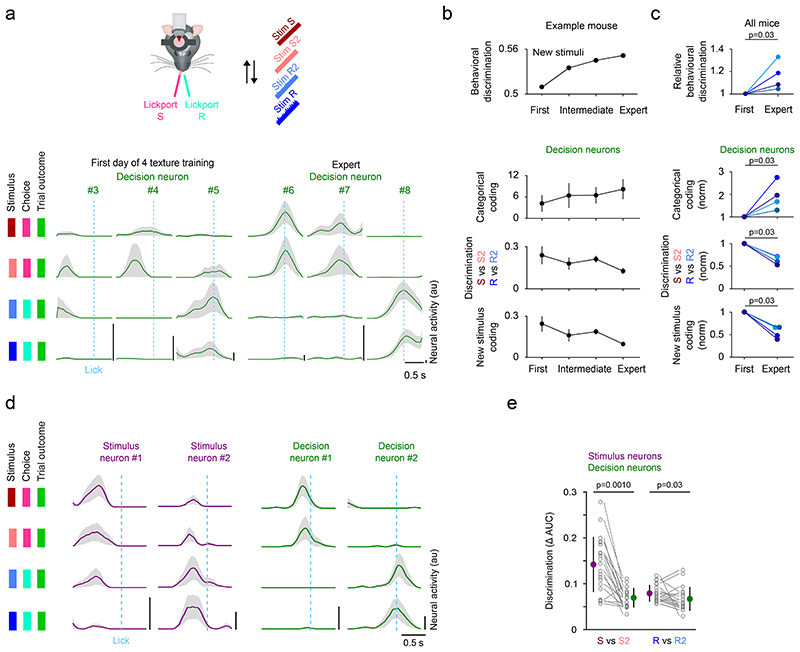
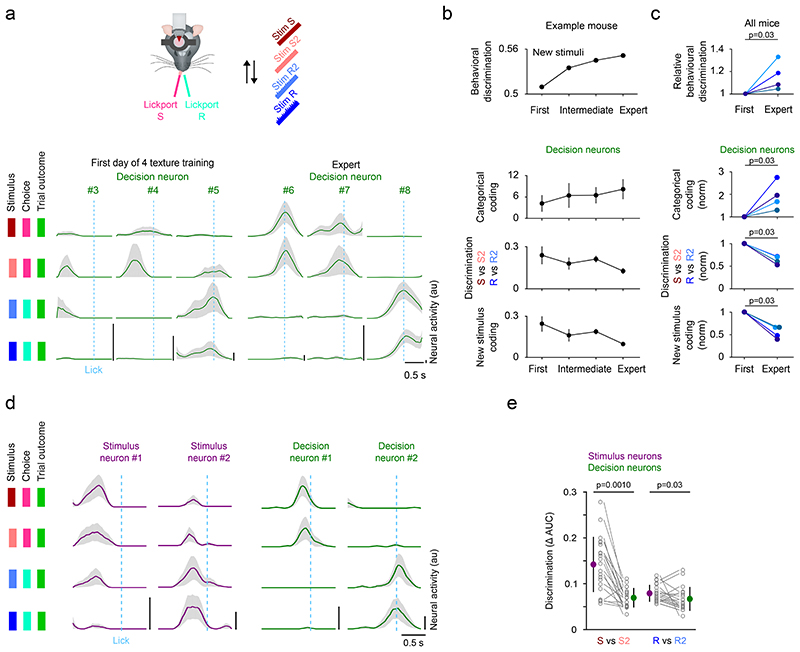
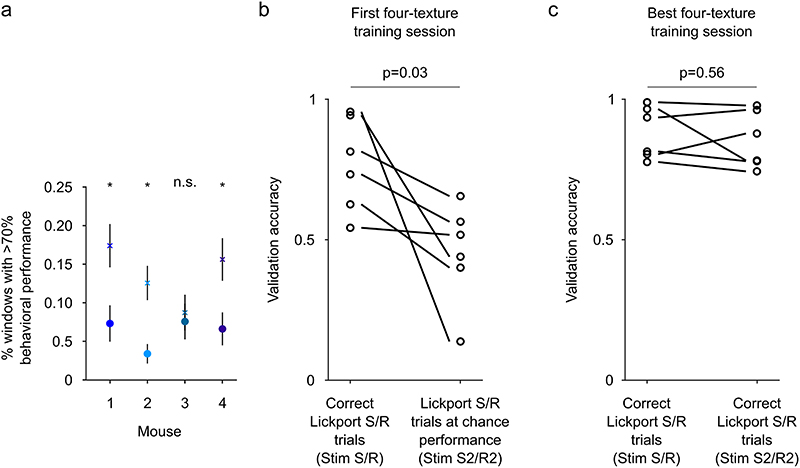
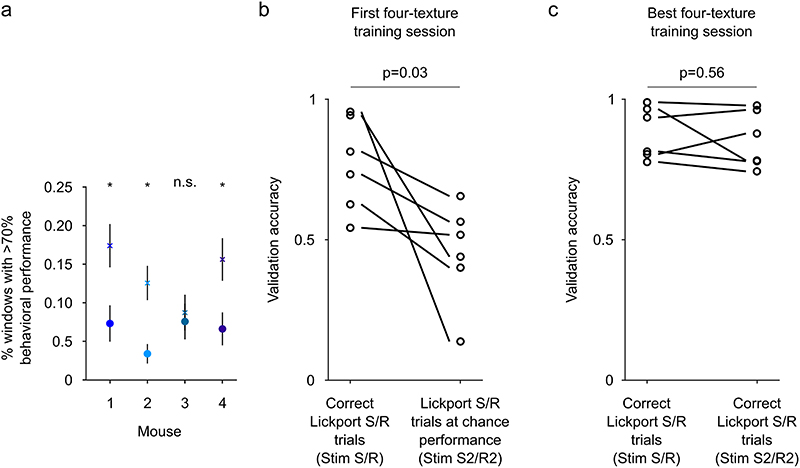
If stimulus neurons encode stimulus properties, and decision neurons are associated with the categorical choice of the mouse, then a selective extension of the stimulus space should predominantly affect stimulus neurons while decision neurons encode the binary choice. To study specifically how the decision signal develops during the formation of a stimulus-choice association, it is necessary to separate learning of this association from the initial stages of task learning accompanied by changes affecting whisking and running patterns that directly influence the incoming sensory signal32,37,38. To this end, we trained four two-texture discrimination expert mice to associate an additional intermediate texture (S2 and R2) to each of the lickports (Fig. 4, Extended Data Fig. 6a). On the first day of four-texture training, we identified decision neurons based on their responses to the previously trained textures (S and R). Their responses to the newly introduced stimuli (S2 and R2) were variable and they lacked a binary response across the four textures (Fig. 4a). After training, decision neurons in four-texture mice showed categorical coding across the four stimuli reflecting the association of two different stimuli to one lickport. During learning, the categorical coding of decision neurons, i.e. the difference of responses between stimuli associated with either lickport (Stim S and S2 vs Stim R and R2) increased with an improvement of behavioral texture discrimination, whereas the discrimination between textures associated with the same lickport decreased in all four mice (Fig. 4b-c). This categorical coding was specific to decision neurons while stimulus neurons differentiated more strongly between textures associated with the same lickport (Fig. 4d-e). Furthermore, to test that the decision signal is dissociable from a lick-related signal, we took advantage of the fact that at the beginning of the four-texture training, mice initially randomly lick the right and left lickport in the presence of a texture. We find that during this initial learning phase, before an association between the stimulus and the lickport has been made, decision neurons do not encode the lickport identity (Extended Data Fig. 6b-c).
Figure 4. Categorical coding in decision neurons develops with learning.
a) Activity of decision neurons across trial types in 6 example neurons - 3 example neurons on the first day of four-texture training and 3 example neurons in expert mice. Mean activity sorted by trial type. Line and shaded area represent mean ± s.e.m.. b) Change in behavioral performance (n = 1 mouse) and coding of decision neurons (n = 5/6/43/16 decision neurons in first, 2 intermediate and expert session, mean ± s.e.m..) during learning in an example mouse. c) Change in behavioral performance and coding of decision neurons in all mice that improved in performance during learning (colors indicate different mice). The first session with four textures (‘First’) is compared to the session with the best performance (‘Expert’). N = 4 mice, two-sided Wilcoxon signed-rank test. The coding parameters are the strictly standardized mean difference (μ1-μ2 / √(s.d.12+ s.d.22)) for Stim S and Stim S2 vs Stim R and Stim R2 (Categorical coding), Stim S vs Stim S2 and Stim R vs Stim R2 (Discrimination), and Stim S and Stim R vs Stim S2 and Stim R2 (New stimulus coding). Behavioral discrimination = Number of Correct trials / (Number of Correct + Incorrect trials) for S2 and R2. d) Trial-averaged activity for four example neurons recorded during the four-texture discrimination task. Activity split by trial types. Activity was aligned to the lick of the mouse. Mean ± s.e.m.. e) Discrimination of textures associated to the same lickport in decision neurons and stimulus neurons. 21 FOVs, mean ± s.d., two-sided Wilcoxon ranksum test.
In summary, decision neurons exhibit categorical coding, while stimulus neurons encode stimulus identity and the occurrence of categorical decision coding in decision neurons develops with learning. Therefore, the existence of a categorical decision signal in decision neurons in L2/3 barrel cortex is likely to be crucial for behavioral performance in our texture discrimination task.
Miss trials lack a conclusive decision signal
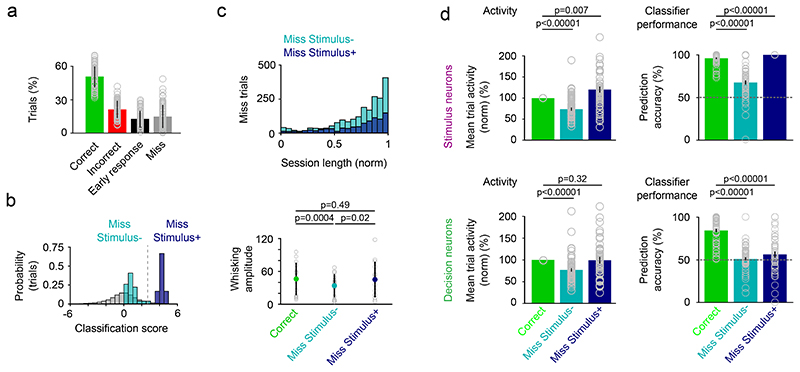
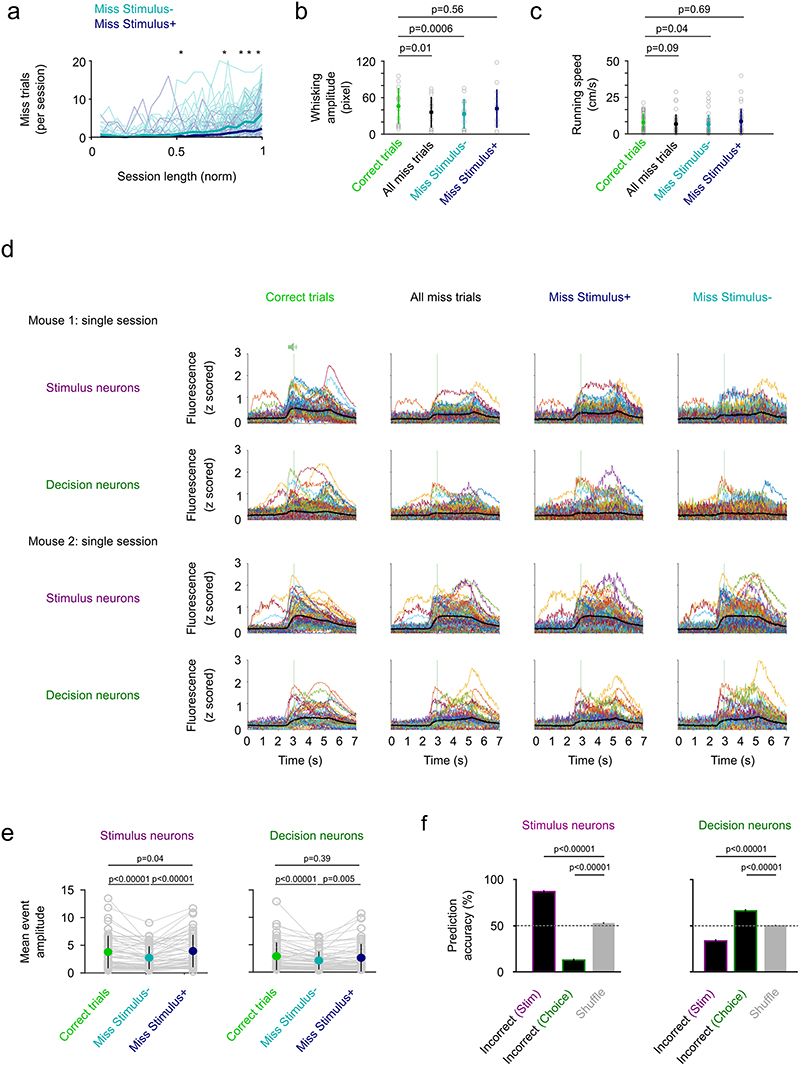
If the decision signal is relevant for the mouse to make a choice, we wondered whether an inconclusive decision signal would inhibit the mouse from making a choice on a trial-by-trial basis. To test this possibility, we analyzed stimulus and decision neuron activity in Miss trials (15% ± 10% (mean ± s.d.) of trials across all sessions, Fig. 5a). To distinguish trials in which the lack of a lick response was accompanied by a lack of stimulus information (e.g. due to insufficient whisking at the end of the session), we separated Miss trials into “Miss Stimulus+“ and “Miss Stimulus-” trials based on whether a linear classifier trained on stimulus neuron activity in Correct trials could predict the stimulus type in Miss trials (Fig. 5b). Miss Stimulus-trials are accompanied with a lower whisking amplitude, lower running speed and lower overall activity in stimulus neurons compared to Correct trials. In contrast, on Miss Stimulus+ trials behavioral variables are unchanged and stimulus neuron activity is even higher compared to Correct trials (Fig. 5c-d, Extended Data Fig. 7). The overall activity in decision neurons is similar in Correct and Miss Stimulus+ trials. Therefore, a reduction in activity alone does not explain the lack of a lick in Miss Stimulus+ trials. But what if the decision signal across the decision neuron population is inconclusive? To address this, we used a classifier trained on decision neuron activity in Correct trials and asked if it can predict choice on Miss Stimulus+ or – trials. Performance was at chance level for both trial types (Fig. 5d, bottom right). Thus, an informative sensory signal in stimulus neurons in L2/3 barrel cortex is not sufficient for the mouse to trigger a choice action. However, the lack of a decision signal is associated with the absence of a choice action in Miss trials.
Figure 5. Miss trials lack a conclusive decision signal.
a) Percentage of miss trials across all sessions (n = 66 sessions, 13 mice, see Figure 1 & 2, mean ± s.d.). Grey open circles denote indiviual sessions. b) Example session to show classification of miss trials into Miss Stimulus- (Linear classifier trained with stimulus neuron activity predicts stimulus type at chance level) and Miss Stimulus+ trials (Linear classifier trained with stimulus neuron activity predicts stimulus). Dotted line represents z-score = 1.64. Grey distribution are classification scores achieved by a linear classifier trained with shuffled trial labels (500x). c) Top, Distribution of Miss Stimulus+ and Miss Stimulus- trials across the normalized session length (n = 66 sessions). Miss Stimulus- trials without stimulus information ramp up towards the end of the session. Bottom, whisking before the go cue in Correct, Miss Stimulus- and Miss Stimulus+ trials in a subset of sessions with whisker kinematics. n = 14 sessions, mean ± s.d., two-sided Wilcoxon signed-rank test. d) Left, mean trial activity in stimulus neurons (top) and decision neurons (bottom) in Miss Stimulus- and Miss Stimulus+ trials relative to activity in Correct trials. Mean ± s.e.m., n = 51 sessions. Two-sided Wilcoxon signed-rank test. Right, Prediction accuracy of a classifier trained to predict stimulus type with stimulus neuron activity (top) or decision neuron activity (bottom) in Correct trials. Decision neurons carry no trial information in Miss Stimulus- and Miss Stimulus+ trials and the classifiers perform at chance level in Miss trials. Mean ± s.e.m., n = 57 sessions. Grey open circles denote indiviual sessions. Testing against chance: n = 57 sessions, Stimulus neurons: Miss Stimulus- trials vs chance, p = 1.1 × 10⁻⁸; Miss Stimulus+ trials vs chance, p = 2.3 × 10⁻¹⁰. Decision neurons: Miss Stimulus- trials vs chance, p = 0.37; Miss Stimulus+ trials vs chance, p = 0.08. Two-sided Wilcoxon signed-rank test.
Cell-type specific functional connectivity in L2/3 neurons
To test if the decision signal we observed is indeed causally involved in decision making and not due to feedback related to the choice action, it is important to directly manipulate the activity of selected neurons in L2/3 of barrel cortex. Therefore, we performed targeted photostimulation and simultaneous two-photon calcium imaging in behaving mice28–31,39–41 to probe the network integration of stimulus and decision neurons, and to establish causal links between neural activity and behavior.
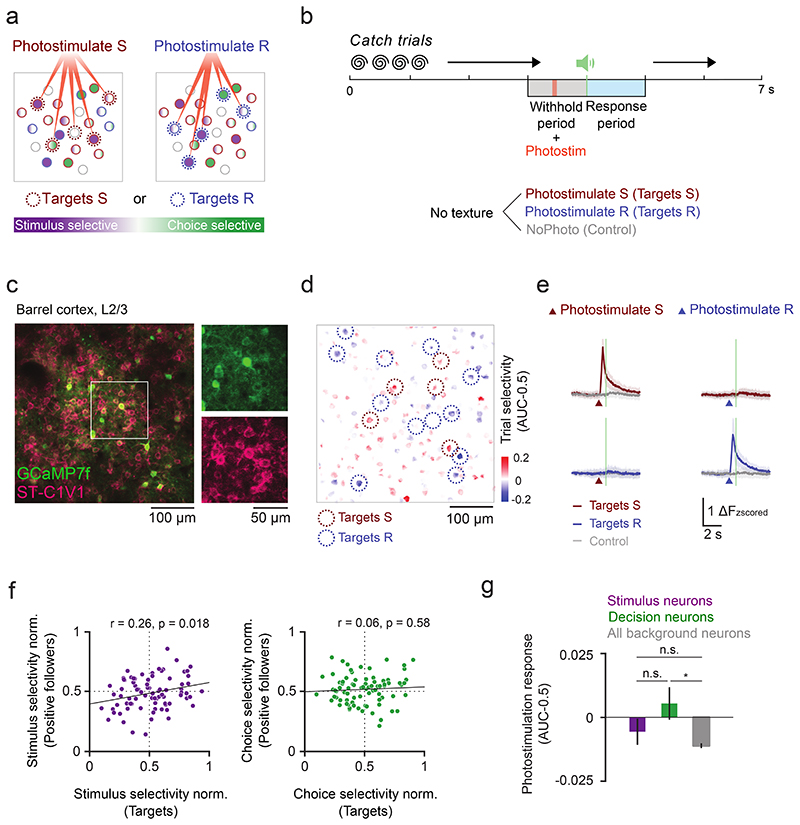
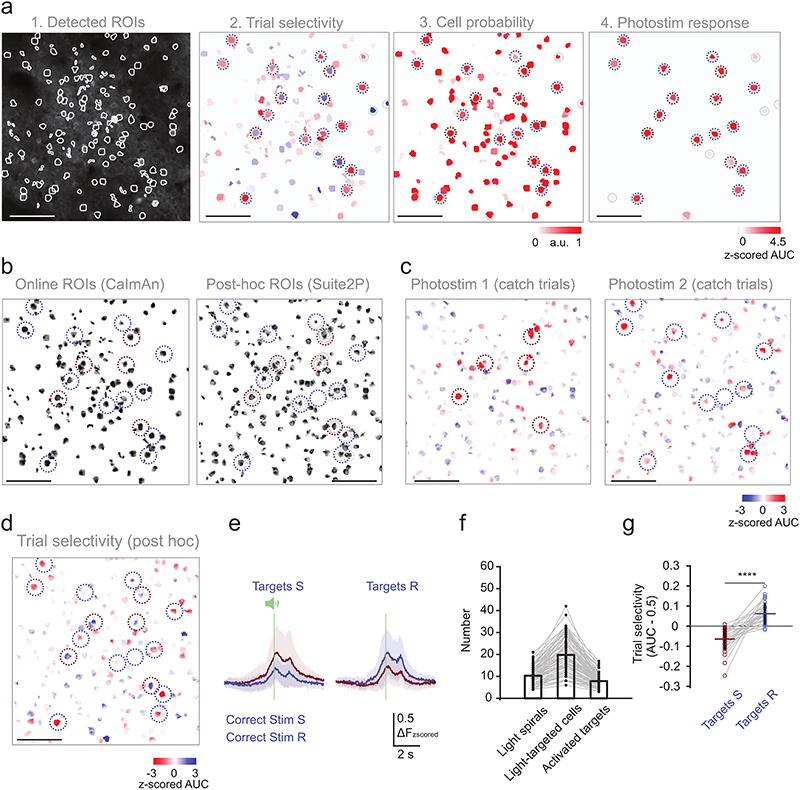
Stimulus and decision neurons show higher shared trial-by-trial response variability within than between subgroups which could be due to increased recurrent connectivity or common feedback (Fig. 2d). To directly probe the local network integration, we selectively stimulated either of two different subsets of trial-coding neurons in a subset of ‘catch’ trials where no texture stimulus was presented to study the recruitment of stimulus and decision neurons depending on the activated target ensemble (Targets S and Targets R, Fig. 6a, Extended Data Fig. 8). We trained mice co-expressing the calcium indicator GCaMP7f and the excitatory soma-targeted opsin C1V1 in L2/3 barrel cortex to perform the two-choice texture discrimination task (Fig. 6b-c). Neurons were selected for target ensembles based on trial selectivity, and target ensembles could be activated with cellular resolution40,42 (Fig. 6d-e). Each target ensemble across experiments contains neurons with a varying degree of stimulus and choice selectivity. We then analyzed the functional properties of “followers”, i.e. neurons across the FOV that were not directly activated by the photostimulation laser but were activated or suppressed as a consequence of activating the target ensemble, with respect to the stimulus and choice selectivity in the target ensemble (Extended Data Fig. 9a).
Figure 6. Cell-type specific functional connectivity in stimulus and decision coding.
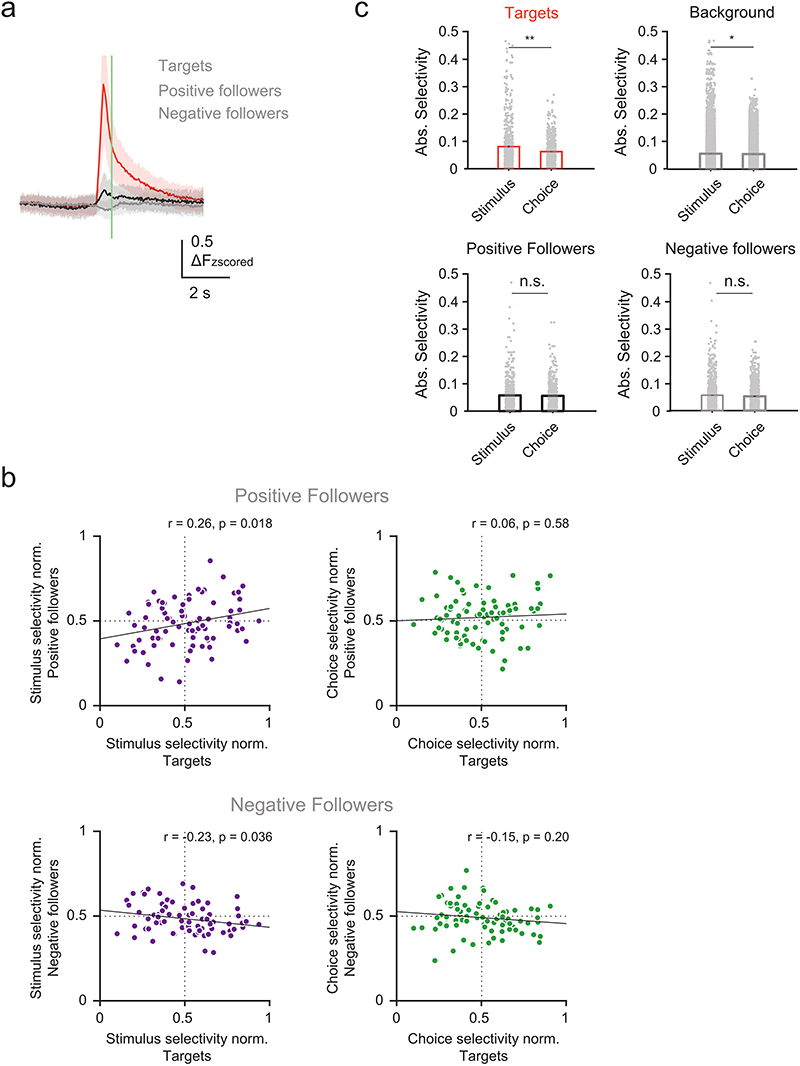
a) Schematic of targeted photostimulation experiment. A subset of trial-coding neurons preferring correct Stim S/Lickport S trials or correct Stim R/Lickport R trials was selectively activated by two-photon optogenetic photostimulation. b) Task structure for catch trial experiments. Two-photon photostimulation (9 × 10 ms spirals) of either target ensemble was enabled in a subset of trials in the middle of the withhold period. c) An example FOV (depth = 200 μm) with neurons co-expressing calcium indicator (GCaMP7f) and soma-targeted opsin (ST-C1V1). Representative results of 31/60 surgeries. d) Trial selectivity of neurons in the FOV in c). Red and blue circles mark the two trial selective target ensembles. e) Calcium time courses of the two target ensembles during different trial types (mean ± s.d.). N = 80 target ensembles, 40 sessions, 7 mice. f) Left: The stimulus selectivity of the target ensemble is positively correlated with the stimulus selectivity of indirectly photo-activated neurons (positive followers). Right: There is no significant correlation between the choice selectivity of the followers and that of the targets (r and p are the Pearson correlation coefficient and the p-value, respectively). Selectivity was normalized to all other background cells in the same FOV. g) Photostimulation response of stimulus and decision neurons (excluding targets) compared with all background cells (boxes are mean, whiskers are s.e.m.). N = 363 stimulus, 248 decision and 10458 background neurons, 40 sessions, 7 mice. Kruskal-Wallis one-way ANOVA test with Tukey-Kramer critical values were used for multiple comparisons, n.s. stimulus vs. decision neurons p = 0.53; n.s. stimulus vs background neurons; p = 0.27; *p stimulus vs background neurons p = 0.022.
We found that the stimulus selectivity of followers that showed a positive (or negative) response to photostimulation is positively (or negatively) correlated with the average stimulus selectivity of the target ensemble, whereas the choice selectivity of targets and positive followers was not correlated (Fig. 6f, Extended Data Fig. 9b). This implies that the network encoding the stimulus involves more like-to-like functional connectivity, where neurons encoding the same stimulus are more strongly connected, than the local circuit encoding the decision. With a difference in intra-group functional connectivity, we wondered if local activation of our target ensembles triggers different responses in stimulus and decision neurons. The global effect of photostimulation on background neurons across the FOV is suppressive42 (Fig. 6g). When dissecting the effect of photostimulation on stimulus and decision neurons, however, we found that while stimulus neurons follow the overall trend, decision neurons on average showed a positive response to photostimulation (Fig. 6g). This indicates that decision neurons might receive more net excitatory inputs when local targets are activated than stimulus neurons. This cannot be explained by a bias in the target ensembles because the targets and background cells tend to be more selective to stimulus than choice (Extended Data Fig. 9c). Taken together, the network effects following targeted photostimulation suggest a higher like-to-like functional connectivity between neurons encoding the same stimulus, while choice-selective neurons show lower recurrent connectivity but can be more effectively recruited by the local network.
Targeted optogenetic activation modulates behavior
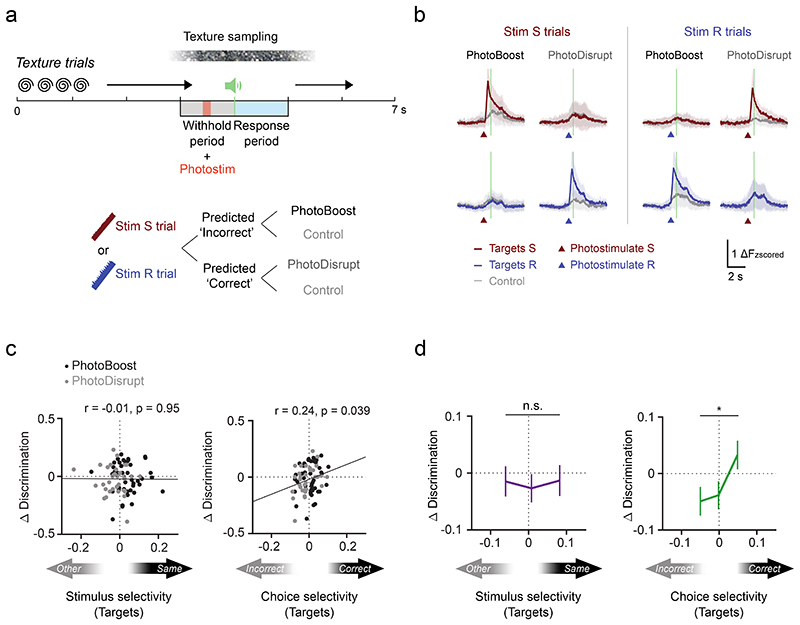
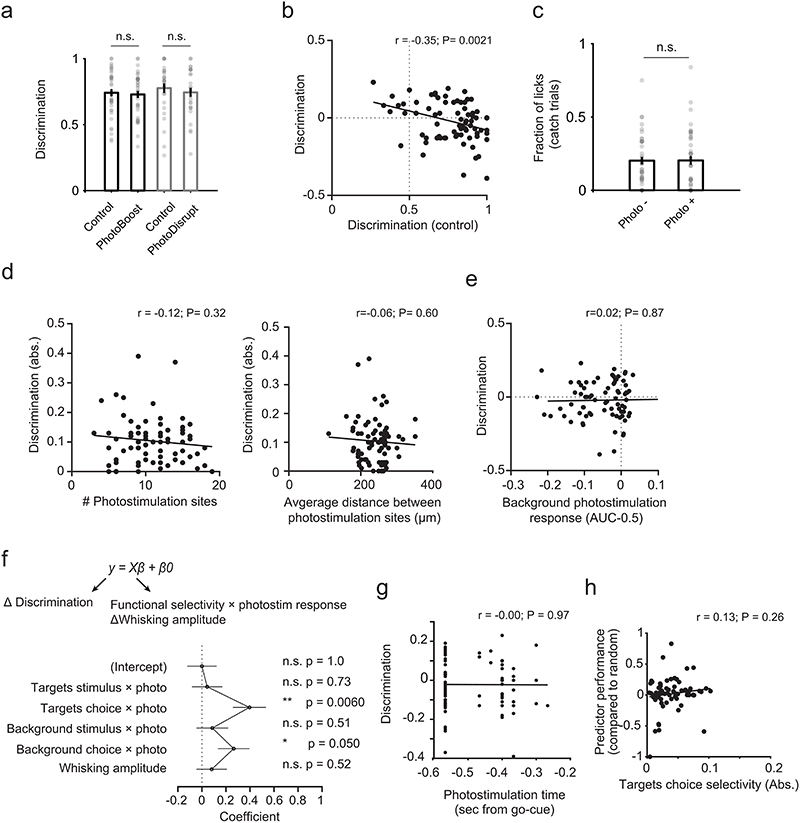
Next, we tested how targeted photostimulation affects behavioral outcome during the task. Here, we stimulated the same ensembles as before, but in trials with texture presentation (“Texture trials”, Fig. 7a). We either stimulated the target ensemble whose trial preference aligns with the correct choice (‘PhotoBoost’) or the target ensemble that prefers the opposite trial type (‘PhotoDisrupt’) with a brief photostimulation during the withhold period (10.5 ± 3.9 targets per photostimulation pattern, Fig. 7a-b; see Methods). On average, behavioral performance did not change consistently in photostimulation trials compared to control trials (where photostimulation was set to zero) (Extended Data Fig. 10a-b). However, target ensembles across sessions and photostimulation conditions differ with respect to the amount of stimulus and choice selectivity present in the target neurons. We therefore asked if the stimulus and choice coding properties of the target cells can explain the seemingly heterogeneous behavioral effect. We found that a change in performance is positively correlated with the choice selectivity, but not the stimulus selectivity of the activated targets (Fig. 7c-d). The more the target population preferred the correct choice on that trial, the greater was the positive effect of stimulation. Thus, targeted photostimulation of choice-selective neurons improves behavioral performance selectively, depending on the functional properties of the targeted neurons. The behavioral effect size and sign does not depend on the number or the spatial clustering of the target neurons or the response in the background population (Extended Data Fig. 10c-e). A linear regression model that takes into account the functional selectivity and photostimulation response of individual target neurons, background neuron activity and whisking state of the animal confirms our finding that the behavioral effect of photostimulation depends on the choice selectivity of directly activated targets and not stimulus selectivity or whisking (Extended Data Fig. 10f). These results provide direct evidence that the decision signal in L2/3 barrel cortex is causally involved in decision making.
Figure 7. Activation of neurons with correct choice selectivity improves behavioral performance.
a) Task structure for texture trial experiments. Two-photon photostimulation (9 × 10 ms spirals) of either target ensemble was enabled in a subset of trials in the middle of the withhold period. Before the photostimulation, activity of trial-coding neurons was readout online to generate a prediction on the trial outcome (Predicted Correct or Predicted Incorrect). Trials predicted Incorrect either received PhotoBoost or Control photostimulation. Trials predicted Correct received either PhotoDisrupt or Control photostimulation (see Methods). b) Calcium time courses of the two target ensembles during different trial types (mean ± s.d.). N = 67 target ensembles, 37 sessions, 7 mice. c) Photostimulation-induced change in task performance is positively correlated with the choice selectivity but not the stimulus selectivity of directly activated targets. N = 77 photostimulation conditions, 37 sessions, 7 mice. Discrimination = Correct trials / (Correct + Incorrect trials). R and p are the Pearson correlation coefficient and the p-value, respectively. d) Same data as in (c) but binned into three groups by ascending selectivity with equal number of samples per bin. Data are presented as mean ± s.e.m., Wilcoxon rank-sum test, *p = 0.038.
Discussion
Understanding where and how behaviorally relevant decision signals are present in neural circuits is key to unraveling how sensory information is transformed into behavioral output, one of the most fundamental questions in neuroscience. Using population two-photon imaging and targeted photostimulation of neurons in S1 of mice performing a cued two-choice texture discrimination task, we have identified a decision signal in L2/3 neurons of S1 that is causally linked to behavior. Decision neurons, a small but distinct subgroup, carry the strongest decision signal within the population. The categorical decision signal that develops with learning, is temporally aligned to sensory input, and is lacking in trials when animals fail to make a choice. Using targeted photostimulation, we demonstrate that stimulus and decision neurons are differentially integrated into the local circuit, providing independent confirmation that they represent functionally distinct groups of cells. Crucially, targeted optogenetic activation of the decision signal improves behavioral performance and therefore directly links the decision signal to behavior. These findings provide conclusive evidence that a decision signal is present at the level of primary sensory cortex and that it is not merely a copy of a decision signal generated elsewhere in the brain, but rather a signal that is read out by downstream circuits to drive behavior.
Experimental requirements to identify decision signals
There is strong evidence that the details of task design can crucially affect cortical computations as well as the involvement of brain areas necessary for task performance12,13,23,32,43,44. Perceptual decision-making tasks differ with respect to the stimuli presented, the number of choices, the actions associated with the choices, delay periods, as well as general environmental features. Task design and species differences might explain why a series of earlier studies in monkey and rodents reported only stimulus coding in S12,10,11,13–15,25.
We refer to choice-relevant activity as decision signals to emphasize that this activity is not a motor signal that triggers the choice action, but rather a signal that is used to make a choice. We consider decisions to be internal variables that carry task-relevant information e.g. on the identity of the lickport associated to the stimulus presented, the occurrence of the go cue, or the motivational state. Mice may make a decision with respect to the lickport that needs to be licked in a given trial but choose not to lick because the go cue has not occurred, or because they are not motivated to lick.
The hallmarks of the task we used to study decision signals in L2/3 of S1 are: complex texture stimuli that require temporal integration by active sampling, two choices that are reported in similar ways, and a cued task design with a temporal delay between stimulus and choice action. We favored the discrimination of complex stimuli due to the observation that simple tactile tasks might not critically depend on barrel cortex45. Unlike the detection of a touch event by a single whisker, the discrimination of textures of different roughness requires active sampling and temporal integration of complex whisker kinetics such as acceleration and curvature3,46. In line with this, lesion studies in rats have shown that the ability to discriminate textures depends on barrel cortex47. Texture discrimination might require computations in L2/3 of S1 to convert complex and varying patterns of whisker kinetics into a simpler object-related code. Stimulus neurons, as described in our study, could report the output of that transformation. The detection of a decision signal in S1 may be related to the fact that task-relevant signal transformation from sensory to an early and abstract decision variable is located in L2/3 S1 under these task conditions.
To identify decision signals in primary sensory cortex, we need to be able to dissociate signals triggered by the choice action from decision signals that inform the choice. In widely used go/no go tasks, only one choice is associated with an action whereas the other choice is signaled by withholding of movement. A consistent activity modulation favoring ‘go’ trials16–19 could reflect choice-relevant activity or other aspects related to the choice action in ‘go’ trials, such as movement preparation, motivation, feedback from the movement or sensory input that results from the movement22. In V1, studies have demonstrated the existence of an activity difference between ‘go’ and ‘no go’ trials23 but an absence of choice-related activity in symmetric choice tasks22,24. Therefore, go/no go tasks cannot definitively identify choice-related activity. Here, we recorded neural activity in mice performing a cued two-choice texture discrimination task featuring choice actions with nearly identical motor patterns, which allowed us to extract decision signals in S1. We also used large-scale recordings across multiple barrels to detect even small functional subgroups of neurons. Furthermore, we used a GLM to demix running, whisking and choice signals and find that the timing of decision neurons is temporally aligned to the stimulus rather than the lick. We consider it unlikely that decision neurons are indeed sensory neurons weakly correlated with the choice action given the numerous categorical differences we find between stimulus and decision neurons, i.e. differences in spatial clustering, temporal activity patterns, trial-by-trial response variability, and their functional connectivity within the local network. This distinguishes the stimulus neurons described here from sensory neurons found in e.g. monkey area MT that carry sensory information and show a weak correlation to the choice of the monkey48,49.
The ultimate support for the claim that the decision signal described here is indeed involved in the decision-making process, and is not a signal carrying motor feedback or sensory input related to the choice action after the decision was made, is provided by our direct manipulation of the decision signal during behavior50,51. We find that when we increase the correct decision signal in L2/3 S1 using targeted photostimulation in behaving mice that behavioral performance is improved. This experiment establishes a causal link between neural activity and behavior and confirms a functional role of the decision signal in decision making.
The circuit organization of stimulus and decision neurons
Does the identification of stimulus and decision neurons imply two distinct neuronal subnetworks in S1? Classical literature suggests that decision signals could be generated in a purely feedforward manner along the cortical processing stream by pooling across large groups of weakly choice-selective sensory neurons51,52. This implies that stimulus signals and a weak decision signal are encoded in the same neurons and that the strength of the choice signal increases as we move along the processing hierarchy. Here we find that L2/3 of barrel cortex, a supposedly purely sensory processing area, contains neurons with stimulus and choice-related information – more akin to what has been found in associative cortices like LIP48. Even though stimulus and decision neurons are intermingled within the same local circuit they show differences in their local network integration. Stimulus neurons exhibit some spatial clustering, while decision neurons in the same FOV are distributed randomly. Both subgroups show higher trial-by-trial response variability within each group than between groups, which could be due to recurrent connectivity or common feedback34–36.
Using targeted photostimulation to directly probe the functional connectivity in the local circuit, we find that stimulus selectivity of the photostimulation targets and their followers correlates. This suggests high like-to-like recurrent connections for stimulus coding in L2/3, and is consistent with recent studies in S1, V1, and ALM29–31,53. The recurrent excitation in L2/3 S1 may support stimulus identification by maintaining and amplifying the ‘bottom-up’, feedforward inputs from L4 containing information about the stimulus features relevant to the task. In contrast, choice coding of the followers does not depend on that of the targets, which implies that the recurrent connectivity among neurons representing the same decision might be lower than those encoding the same stimulus. The shared trial-by-trial response variability between decision neurons might in this case be driven by common inputs from the local circuit, with contributions from long-range feedback connections from S1, M1, M2, higher-order thalamus and neuromodulatory inputs37,54. This idea is further supported by higher activity of decision neurons outside of the sampling period in comparison to stimulus neurons, as well as the existence of more efficient excitatory inputs from local trial-coding neurons when activating trial-coding neurons. Taken together, although there is likely to be a continuum with respect to stimulus and choice coding across L2/3 S1, the ends of this putative continuum, i.e. stimulus and decision neurons, show categorical differences not only in the trial-coding dimension, but also in spatial clustering, activity patterns, timing, network integration and functional connectivity.
Implications for sensory processing
The classical concept of hierarchical processing involving a step-by-step feature extraction before a decision is made in higher-order areas has been extremely influential in guiding the field to explore the computations performed during sensory processing1,9,55. Recent studies have suggested the possibility that choice coding might already be present in L2/3 of S1 but were either lacking appropriate task design or direct manipulation to establish causal relevance of these signals for behavior. Our results show that a decision signal can indeed be present as early as L2/3 of S1, and crucially that the signal in decision neurons is causally relevant for task performance. This decision signal appears to represent a transformation of the sensory signal into choice categories. Freedman and Assad suggested the existence of such a categorical and abstract early decision signal in the primate brain, in contrast to intentional decision signals that are directly linked to the motor action56. We suggest that the signal carried by decision neurons in L2/3 S1 might represent such an abstract categorical decision signal.
Instead of just feature extraction following a strict processing hierarchy, primary sensory cortex might be passing on information about extracted features in parallel with a categorical and task-relevant interpretation of the sensory signal. Following the concept suggested by Panzeri and colleagues57, this would mean that decision neurons carry features with a high intersection information and are therefore directly involved in driving behavior whereas stimulus neurons only present the stimulus identity and carry little intersection information. Alternatively, as suggested by Churchland and colleagues58, feature extraction along the sensory pathway may not be isolated but could be modulated by top-down projections very early in the pathway. Interim decision variables could then influence downstream feature extraction as well as modulate behavior such as whisking to optimize task performance. The decision signals we describe could reflect the output of an intersection between sensory feature extraction and task-specific top-down modulation entering L2/3 S1. Studying the task-dependence of our results, the influence of top-down modulation on decision neuron activity as well as the temporal relationship between stimulus and decision neurons measured with high-density electrophysiological recordings will provide many avenues for future experiments.
In summary, our results demonstrate the existence and behavioral relevance of decision coding as early as S1, challenging the longstanding idea that S1 provides information on sensory inputs only2,10,11,13,14. Instead, an early decision signal carried by neurons intermingled with stimulus neurons within the same circuit which has a direct impact on behavior suggests a key involvement of S1 in the decision-making process through the encoding of an early categorical decision signal.
Methods
Mice
All animal procedures approved by the local Animal Welfare and Ethical Review Board at University College London and performed under license from the UK Home Office in accordance with the Animal (Scientific Procedures) Act 1986. We used transgenic mice expressing GCaMP6s59 in excitatory neurons (EMX1-Cre; Camk2a-tTA; Ai94 (Jax #027784; #007004; #024104) and Camk2a-tTA; tetO-G6s (Jax #007004; #024742)) for calcium imaging experiments and C57Bl/6J (Charles River Laboratories) for targeted photostimulation experiments. All EMX1-Cre; Camk2a-tTA; Ai94 mice were treated with doxycycline administered orally via the drinking water to prevent expression of GCaMP6s during development60 and were checked for aberrant activity (see Wide-field imaging). A solution of 5% sucrose and 2 mg/ml doxycycline in tap water was given as drinking water from birth up until 7 weeks of age. Mouse age ranged from 8-36 weeks on the days of experiments and were of either sex. Mice were group-housed before surgery and singlehoused after surgery. Mice were kept at normal or reversed 12h dark/light cycle at a temperature of 22° Celsius and 62% humidity.
Surgery
Mice were anaesthetized using Isoflurane (0.5-2%) and injected with 0.1 mg/kg buprenorphine hydrochloride (Vetergesic) and 5 mg/kg Carprofen (Rimadyl). A metal headplate with a 5 mm circular imaging well was fixed to the skull overlying somatosensory cortex with dental acrylic (Super-Bond C&B, Sun-Medical). A craniotomy was drilled above S1 (right hemisphere, 1.6 mm posterior and 3.5 mm lateral of bregma). For targeted photostimulation experiments, 0.9-1 μl of a mixture of AAV1-syn-jGCaMP7f-WPRE61 (dilution 1:15), AAV9-FLEXED-C1V1-Kv2.1-mRuby242 (dilution 1:30), and pENN-AAV-CAMKII-0.4Cre-SV40 (dilution 1:15) at a ratio of 2:1:2 was injected into L2/3 (~300 μm deep at 0.1 μl/min). The dura was removed after virus injection A cranial window, composed of either a 3 mm circular glass coverslip glued to a 2 mm square glass with UV-curable optical cement (NOR-61, Norland Optical Adhesive) or a 4 mm circular glass coverslip was press-fit into the craniotomy and sealed using Vetbond before fixing it with dental acrylic. At the earliest one week after the surgery mice were water restricted to increase motivation for task training.
Wide-field imaging
After a minimum of one week after surgery wide-field imaging was performed at 15 Hz using a 470 nm LED (M470L3, Thorlabs) to illuminate the area. Imaging was performed using an ORCA-Flash 4.0 V3 (Hamamatsu) camera and a 4x microscope objective (4x Nikon Plan Fluorite Imaging Objective, 0.13 NA, 17.2 mm WD). Excitation light passed through an aspheric condenser lens (ACL2520U-DG15, Thorlabs), a filter (ET470/40, Chroma) and was reflected into the light path by a 495 nm longpass dichroic (FF495-Di03-25x36, Semrock) to reach the brain. Emitted light passed through the same 495 nm longpass dichroic as well as a 749 nm shortpass dichroic (FF749SDi01-25x36x3, Semrock,) and an emission filter (HQ525/50, Chroma) before reaching the camera. Spontaneous activity of awake mice running freely on a treadmill was acquired for 2-4 minutes to exclude the occurrence of aberrant activity in transgenic mice60. Calcium signal time series were obtained from the average pixel intensity.
To locate the barrels in the FOV single whiskers were threaded into a glass capillary and deflected 10-30× for 1 s with a piezo oscillating at 10 Hz (sinusoidal) every 10 s whilst performing wide-field imaging as described above. To locate the barrel centers, we calculated event-triggered averages of the movies by aligning the frames to the start of the whisker deflections using custom-written Python scripts.
High-speed videography
We used a Mako U-029B (Allied Vision) camera to record whisker movements under IR illumination at 100-200 Hz. The data was streamed and recorded using the software package 2ndLook (IO Industries). We used DeepLabCut 1.062 to label the two most prominent whiskers in every frame across a subset of sessions (9 mice, 2 sessions each). We calculated the average whisker angle based on the average of the angle of the two whiskers in each frame to reflect the movement of the whisker pad. To extract the first whisker touch we trained another set of models to detect the texture stimulus in the movie. First whisker touch was defined as the first imaging frame of the trial in which texture stimulus and whiskers were closer than 22 pixels (based on visual inspection).
Texture discrimination task
Behavioral training was carried out in training boxes or under the two-photon microscopes which were equipped with the same training apparatus63. A 2.5 cm × 2.5 cm piece of sandpaper (DOM’s DIY direct, Amazon) was attached to four of the six arms of a custom-built plastic hexagon array with protruding arms. Sandpapers used for training and imaging were S = P1200 or P3000, R = P60 or P100; S2 = 400 or 600; R2 = 180. To adjust the ratio of correct and Incorrect trials, sandpapers used in targeted photostimulation experiments varied with S = P180 / 320 / 600 / 1500 or 3000 and R = 60 or 120. To rotate the selected sandpaper into position the hexagon was mounted onto a rotating stepper motor (X-NMS17C-PTB2, Zaber Technologies Inc.). The steps of the rotating stepper motor to rotate the selected sandpaper into position was matched, such that every transition featured the same number of movements. Once it reached its final position the sandpaper was moved towards the mouse by mounting the stepper motor onto a linear stage (X-LSM050B-KX12AG or LSM100B-T4-MC04 with X-MCB1-KX12BG Controller, Zaber Technologies Inc.). Both motors were controlled using a microcontroller and Arduino software (Arduino IDE). The mouse was allowed to lick one of the two lickports in front of it with the sound of go cue (100-200 ms, 6 kHz). Licks were detected by closing an electrical circuit. All signals were controlled and displayed using the custom-written software PyBehavior (Lloyd Russell, https://github.com/llerussell/PyBehavior). Licking the correct lickport triggered a solenoid valve (225PNC1-11, NResearch) to release water rewards consisting of 2-4 μl drops of sugar water (10% sucrose in drinking water). Licking in the withhold window 1 s before the go cue triggered 1 s of white noise as well as a 3-5 s timeout. Mice were in the dark and freely running on a circular Styrofoam treadmill during training and imaging sessions. The behavior and imaging data were synchronized using PackIO64. In targeted photostimulation experiments, the motor carrying the sandpaper was moved in at a slightly slower speed and the go cue was triggered at 4 s into the trial instead of 3 s.
Training was performed in stages. After habituation to the trainer and the head fixation, water drops were delivered until mice readily licked both lickports. In the next training stage, the sandpapers were presented to the whiskers followed by an auto-reward 200 ms after the go cue to passively pair the texture with the lickport. Textures were presented in blocks with decreasing repeats. Once a mouse respected the withhold period and started to lick the lickports after the go cue the auto-reward was removed. Mice that were licking the lickports after the go cue and showed signs of correctly predicting the lickport that is associated with the presented texture were moved on to the final training stage. Here, the textures were presented randomly with equal probability. Trials lasted for 7 s with a variable delay of 0-1 s in between trials. Mice were trained or imaged no more than once a day until a majority of miss trials indicated satiety.
Two-photon calcium imaging
Two-photon calcium imaging was performed on a custom-build microscope equipped with a resonant scanning module (LSK-GR08, Thorlabs), GaAsP photomultiplier tube (Hamamatsu), and a 16 × 0.8 numerical aperture microscope objective (Nikon) using ThorImage 3.1 (Thorlabs). We used a Ti-Sapphire laser (Mai Tai HP, Spectra Physics) to excite GCaMP6 at 920 nm. The FOV was 798 μm × 798 μm (512 × 512 pixels) and images were acquired at 30 Hz for single-plane recordings and at 5 Hz for multi-plane recordings. For multi-plane recordings the objective was moved between frames using a piezo objective scanner (PFM450E, Thorlabs). The piezo was allowed to settle for 35 ms in the new z position before the next frame was recorded.
Targeted photostimulation and simultaneous two-photon calcium imaging
Simultaneous calcium imaging and photostimulation was performed using an ‘all-optical’ microscope65. Two-photon imaging (512 × 512 pixels per frame, 30 Hz) of L2/3 barrel cortex (~100 to 300 μm deep) was performed by resonant-galvanometer raster scanning a femtosecond-pulsed laser beam (wavelength 920 nm or 765 nm, Chameleon Ultra II, Coherent, output power 2-4 W) across FOVs of 416 × 416 μm. A 16x/0.8-NA objective (Nikon) was used for all experiments. GCaMP7f was imaged with an excitation wavelength of 920 nm and mRuby (fluorophore coupled with opsin) with 765 nm (power on sample, 40-50 mW). The excitation source for the photostimulation path was a femtosecond-pulsed laser fixed at 1030 nm (Satsuma HP2, Amplitude Systems; average output, 20 W; pulse width, 280 fs; repetition rate, 2 MHz). A reflective multilevel phase spatial light modulator was used to display holograms (OverDrive Plus SLM, Meadowlark Optics/Boulder Nonlinear Systems; 7.68 × 7.68 mm active area, 512 × 512 pixels, optimized for 1064 nm). The weighted Gerchberg-Saxton algorithm66 was used to calculate holograms to be displayed on the SLM and the weights were adjusted to compensate for the difference in diffraction efficiency between holographic spots. An acousto-optic modulator (AOM, MCQ80-A2-L1064-Z32) was used for modulating photostimulation power.
A custom Python-based, real-time all-optical interface (pyRTAOI, written in Python 3.6 with PyQt5, developed in Spyder 3.2.4) was used for online image analysis and photostimulation control. Raw data streaming from the microscope system (Prairie View, Bruker Corporation) was first organized into 512 × 512 frames accelerated by a GPU (NVIDIA GeForce GTX 750 Ti), and then passed to the calcium imaging analysis toolbox, CaImAn (2018 version)67, for online motion-correction, neuronal signal extraction and denoising. Photostimulation pattern and power were controlled by a custom SLM control interface (written in C++ with Qt 5.9, developed in Microsoft Visual Studio 2013). The power control is synchronized with spiral scanning by the microscope system by voltage pulse triggers.
Calcium traces extracted online by CaImAn were used for quick analysis on the day of experiments. Quality of each ROI was assessed with a convolutional neural network based method67. Cells were first detected from the live imaging stream while the mouse started performing the task (normally ~150-250 ROIs were detected in 15-25 minutes). Imaging and behavioral recording started after the animal made consecutive correct transitions between the two lickports and the rate of Early lick trials decreased. Before experiments, we trimmed the whiskers, leaving 3-6 principal whiskers corresponding to the barrels in the FOV with co-expression of GCaMP and C1V1 to minimize task-relevant activity outside of the photostimulable area (Fig. 6c). First, a baseline imaging session consisting of 150 trials was used for mapping functional identity of cells in the FOV and for building choice decoders. Next, to test which trial-coding neurons can be activated optogenetically, a short photostimulation pulse (9 ×10 ms spirals, 15-20 μm in diameter, 7-8 mW per cell) was sent onto each texture-selective cell in a random sequence (0.5 second inter-stimulus interval, 10-15 repeats per cell). The stimulation power was chosen such that the two-photon activation efficacy matches that in the calibrated data65 (20-80 mW, pulse repetition rate, 80 MHz, pulse width, 300 fs, Supplementary Fig. 2-3). Trial-coding neurons that show a reliable calcium response to photostimulation (z-scored AUC > 1 and response amplitude > 1) were grouped by trial preference into two functional target ensembles (Extended Data Fig. 8). In a subset of sessions, extra photostimulation conditions were added in the catch trials, where photostimuli were targeted directly at identified stimulus or choice selective neurons in order to increase the range of choice and stimulus selectivity in the target ensemble. In a random set of catch trials (~15-20% of all trials in a session), either of the two target ensembles was selectively stimulated 600 ms before go cue (9 × 10 ms spirals, 7-8 mW per cell, Fig.6).
During texture trials (Fig. 7), calcium activity recorded from trial-coding neurons was projected onto a choice decoder that attempts to predict the upcoming choice that the animal is going to make. Specifically, two choice decoders (for S and R trials, respectively) were built based on logit models fit to the first 4-5 demixed principal components of the calcium activity of trial-coding neuron in the withhold window (dPCA68). In each trial, the decoder prediction will be queried during a short time window in the withhold period (5 imaging frames, 600 ms to 433 ms before go cue, Extended Data Fig. 10g). In half of the trials when the choice was predicted to be incorrect during the query window, a brief photostimulation (9 ×10 ms spirals, 7-8 mW per cell, 567 ± 41 ms before go cue, mean +/- s.d.) was delivered to the target ensemble that prefers the same texture as that being presented to the animal (‘PhotoBoost’). In 1/3 of the trials when the choice was predicted to be correct (i.e. the absence of an incorrect prediction during the query window), photostimulation of the same power and duration will be delivered immediately at the end of the query window to the target ensemble that encodes the other texture which is associated with the incorrect choice (‘PhotoDisrupt’). To increase the chance of a behavioral effect despite limitations in trial numbers, we used a classifier for online prediction of the trial outcome based on trial-coding neuron activity before the photostimulation39,69. Using this classifier, it was slightly more likely for PhotoBoost photostimulation to occur in Incorrect trials and PhotoDisrupt photostimulation to occur in Correct trials. In 5 sessions, the conditions were swapped with respect to the PhotoBoost and PhotoDisrupt stimulation, meaning that the target ensemble preferring the texture associated with the incorrect (or correct) choice was activated when the predicted choice is about to be correct (or incorrect). Overall, the online predictor performance does not correlate with the targets’ choice selectivity (Extended Data Fig. 10h). Again, this was done to extend the sampling range of choice and stimulus selectivity of the target ensemble. The online choice prediction accuracy is slightly better than chance (the fraction of Correct trials in the control trials for PhotoDisrupt is 4% higher than random, p = 0.016; the fraction of Incorrect trials in the control trials for PhotoBoost is 15% higher than random, p = 0.009, Wilcoxon signed rank test). Catch trials and texture trials were randomly interleaved in a session.
To rule out the possibility that the animal might be able to hear the photostimulation laser scanners, spiral scanning started 1 second before the withhold period and continued until the end of the reward period in every trial, such that the only difference between photostimulation and corresponding control trials is the photostimulation laser power controlled by the AOM via an analogue output device (NI-DAQmx. PCI-6713, National Instruments).
Data analysis
Data processing, session selection and trial selection (Fig. 1-5)
Regions of interest corresponding to individual neurons were selected and calcium signals were extracted, neuropil-corrected and deconvolved using Suite2P for MATLAB70. All further measures of neural activity are based on deconvolved calcium traces unless indicated otherwise. Behavioral data was analyzed with custom-written MATLAB scripts. Imaging sessions were selected based on imaging depth, behavioral performance and number of trials. All imaging sessions were recorded at a depth between 100 μm and 200 μm below the surface (Supplementary Figure 4). Sessions were included if mice performed more than 80% discrimination (Correct / (Correct + Incorrect)) in at least one window of 50 trials with at least 12 response trials (Correct and Incorrect) which indicates that they are proficient in the task. Every mouse that reached this criterion at least once is considered an expert mouse. Every imaging session included had at least 20 Correct trials and 5 Incorrect trials for Stim S and Stim R each. The difference in timing of the first lick with respect to the trial start when comparing Stim S and Stim R trials was below 500 ms. Unless otherwise indicated, trials that fall within a period of strong lickport bias were removed from the analysis. This is done to remove variability in the population of Correct trials and reduce the number of false positive Correct trials which are random licks of a certain lickport and not a lick that was triggered as a result of perceptual decision making. Behavioral discrimination (Correct trials / (Correct + Incorrect trials)) is higher in unbiased trials compared to biased trials but the procedure has only a very small effect on the identification of stimulus and decision neurons (Supplementary Figure 4). To identify lickport bias we analyzed periods of 10 trials in a sliding window. Whenever there were more than 5 trials that were either Correct or Incorrect (i.e. with lick responses only in the response window) but more than 90% of all first licks were directed to the same port – this period of 10 trials was labelled as biased. Trials on which a reward was triggered manually for training purposes were removed from the analysis.
Data processing, session selection and neuron selection (Fig. 6-7)
Calcium traces from all imaging sessions recorded on the same day were concatenated, extracted and neuropil-corrected using Suite2P. Calcium traces were z-scored and normalized to the baseline level for each trial (1 s from the beginning of the trial) to get ΔFzscored. Cells with spatial footprints more than 30% overlapping with a 40-pixel (32.5 μm) diameter circular mask centered at the centroids of the photostimulation spirals were taken as light targeted cells (Extended Data Fig. 8b). Sessions with overall texture discrimination (number of Correct trials/ (number of Correct trials + number of Incorrect trials)) below 0.6 were excluded from analysis. All trials in the baseline behavioral session and 1/4 of the control trials randomly selected in the stimulation behavioral session were used for evaluating functional identity (i.e. trial, stimulus and choice selectivity) of each neuron. The rest of trials in the all-optical session were used for assessing photostimulation and behavioral effects. Photostimulation or control conditions with less than 8 trials where the animal made a choice during the reward period were excluded from behavioral analysis. Signal in frames during photostimulation (90 ms) may contain light-stimulation artefacts and thus were removed and linearly interpolated with values pre and post photostimulation. Frames in a 300 ms window immediately before the go cue were used for measuring photostimulation response.
All light targeted cells that showed significantly higher response in the photostimulation trials than the no-photostimulation trials (z-scored AUC > 1.64) were taken as directly activated targets (Extended Data Fig. 9f). Photostimulation conditions where the number of directly activated cells is less than 40% of the number of target spots were excluded from analysis. Background cells (i.e., all cells outside the light-targeted zones) that showed significantly higher or lower response in photostimulation trials compared with no-photostimulation trials (z-scored AUC > 1.64 or < -1.64) were taken as positive or negative followers, respectively (on average 7.6 ± 4.1 positive followers and 13.9 ± 7.7 negative followers per photostimulation condition, mean ± s.d., Extended Data Fig. 10a).
Neuron type identification
Neurons were classified using ROC analysis as well as a gaussian GLM in a subset of sessions with whisking and running information. Classification obtained using ROC analysis was used for all figures unless otherwise indicated. For the ROC analysis we computed an ROC curve by varying the activity (1 s before the lick, Fig. 1-5 or 1 s before go-cue, Fig. 6-7) threshold and sorting responses into S and R trials. We then calculated the absolute difference of the area-under-the-curve (AUC) from 0.5. To evaluate significance, we shuffled the trial labels and calculated 200 AUCs. If the true AUC was more than 1.64 s.d. away from the mean of the shuffled distribution the neuron was considered to discriminate S from R trials. Neurons that can discriminate S from R trials only considering Correct trials were classified as ‘trial-coding neurons’. Neurons that can discriminate S from R trials in Correct and Incorrect trials and prefer the same stimulus type were classified as ‘stimulus neurons’. Preference of the same stimulus is defined as a higher mean firing rate for the same stimulus in Correct and Incorrect trials. Neurons that can discriminate S from R trials in Correct and Incorrect trials and prefer different stimulus types but the same choice were classified as ‘decision neurons’. We computed the false-positive rate for each neuron type by shuffling the trial labels 100 times per neuron. The false-positive rate using this ROC analysis is 0.27% ± 0.004% for stimulus neurons and decision neurons and 4.6% ± 0.06% for trial-coding neurons (n = 77 FOVs, mean ± s.e.m.).
We built a gaussian GLM (with identity link function) with four regressors (‘Stimulus’, ’Choice’, ‘Running’, ’Whisking’) to predict the average trial activity 1 s before the lick. For each neuron, we trained ten models using all four regressors in Correct and Incorrect trials with two-fold cross-validation for an estimate of the mean prediction accuracy of the full model. We used ridge regression with a lambda of 0.1. We quantified the performance of the model by calculating the Pearson correlation between the real trial activity and the predicted trial activity. The mean Pearson correlation coefficient of the full model was then compared to the mean Pearson correlation of four reduced models in which one of the regressor vectors was randomized each. To test the unique contribution of each regressor to the trial activity of the neuron, we shuffled the regressor vector 400 times and trained the model as described before. We considered a neuron to code for stimulus, choice, running or whisking if the mean coefficient of the full model was more than 1.64 s.d. higher than the mean coefficient of the reduced model.
To visualize the distribution of significant correlation coefficients (i.e. unique regressor associations) across all neurons, we reduced dimensionality using t-Distributed Stochastic Neighbor Embedding (t-sne). We used the ‘tsne’ MATLAB function with a Mahalanobis distance metric and otherwise default settings.
In 8 out of 10 sessions we identify more decision neurons using the ROC algorithm compared to the GLM analysis. In these sessions, 65% +/- 3% of neurons identified using GLM analysis were also identified using ROC analysis (mean +/- s.e.m., n = 8 sessions).
Stimulus and choice selectivity
To compute stimulus selectivity we obtained the AUC values (Stim S v Stim R) in Correct and Incorrect trials as described above and calculated the difference from 0.5. Each neuron therefore has a stimulus selectivity in Correct and a stimulus selectivity in Incorrect trials. To compute choice selectivity, we obtained the AUC values (Correct vs Incorrect) in Stim S and Stim R trials and calculated the difference from 0.5. Each neuron has a choice selectivity in Stim S and a choice selectivity in Stim R trials.
Shared trial-by-trial response variability
To compute the trial-by-trial variation71,72 to the same stimulus we subtracted the mean activity in a 1 s window before the lick across all Correct trials with the same stimulus before calculating the pairwise correlation coefficient between all neurons, all stimulus neurons, all decision neurons, or between pairs of stimulus and decision neurons. All sessions with more than five stimulus and decision neurons were included.
Spatial clustering
To quantify spatial clustering, we calculated the pairwise spatial distances between stimulus neurons or decision neurons in each FOV with at least 5 neurons of each type. The mean pairwise spatial distance was compared to the mean pairwise distance of a shuffled distribution (200x) containing an equivalent number of neurons from the entire population that was selected randomly. We then calculated the z-score between the pairwise spatial distance of stimulus or decision neurons and the shuffled distribution. A distribution of z-scores around 0 indicates that pairwise distances are not different from randomly selected neurons in the FOV.
Analysis of the timing of activity (Figure 3)
To analyze the timing of activity in stimulus and decision neurons only single-plane imaging sessions at 30 Hz were used (9 mice, 35 sessions). Mean-event amplitude was averaged across trials for every neuron and then averaged for every session. Statistics were computed across sessions.
Analysis of four-texture learning sessions (Figure 4)
For four mice that were successfully trained on the four-texture discrimination task, we selected the first four-texture training session as well as the session with best task performance for analysis (‘expert’). Neuron identification was conducted as before using only correct S and R trials.
Analysis of miss trials (Figure 5)
To separate miss trials into trials with and without stimulus information in each session, we trained a linear classifier to predict the stimulus presented in Correct trials based on the activity of stimulus neurons. Correct stimulus R and stimulus S trials were balanced before training. Only sessions with at least five stimulus neurons were included. For each miss trial, we compared the classification score achieved by the linear classifier to the distribution of classification scores achieved by a linear classifier trained with shuffled trial labels (500x). If the stimulus prediction was better than chance as represented by the shuffled distribution of classification scores, a miss trial was labeled Miss Stimulus+, i.e. a miss trial with stimulus information in the population of stimulus neurons. Otherwise it was labeled Miss Stimulus-, i.e. a miss trial without stimulus information in the population of stimulus neurons. The number of Miss trials increases towards the end of a session with more Miss Stimulus- trials than Miss Stimulus+ trials later in the session (Fig. 5c, Extended Data Fig. 7a). We used the same classifier to calculate the prediction accuracy in correct, Miss Stimulus- and Miss Stimulus+ trials based on stimulus neuron activity. We then trained a similar linear classifier using decision neuron activity to predict the trial type. Despite the lack of an active choice, we argue that expert mice can discriminate the textures. Therefore, most trials with a conclusive stimulus signal should lead to a correct choice. If decision neuron activity contained choice information, it should yield a prediction accuracy different from chance. To test the performance of the classifiers against chance, we computed shuffled distributions (100x) by shuffling trial labels and compared the accuracy of the classifiers with the shuffled distribution.
Analysis of behavioral performance following targeted photostimulation (Figure 7)
To assess the impact of targeted photostimulation on behavior, we stimulated the target ensembles as described above. ‘PhotoBoost’ trials were compared to the other putatively Incorrect trials where the identical triggering procedure was enabled but the photostimulation power was set to zero (control trials). The ‘PhotoDisrupt’ trials were compared to the other putatively Correct trials as controls (control trials). We used ‘leave-one-out’ cross validation to measure behavioral change and target selectivity with different sets of trials to rule out the possibility that any observed correlation between the change in texture discrimination performance and the functional identity of the activated targets may reflect a natural co-fluctuation between the variables. Specifically, for each pair of photostimulation-control conditions, we take one trial from the photostimulation trial set and one trial from the control trial set, and compare their trial outcome (giving -1, 0 or 1). We then used the rest of the photostimulation and control trials in the two trial sets to find the activated targets and calculated their stimulus or choice selectivity using the trials previously preserved for measuring functional identity (i.e., all trials in the baseline behavioral session and 1/4 of the control trials in the all-optical session, which were not used for measuring photostimulation effects). This procedure was repeated 100 times and the average change in discrimination and the average target selectivity were taken as the final result.
Statistics and reproducibility
No statistical methods were used to pre-determine sample size. Our sample sizes are similar to those reported in previous publications19,29,30. Data analysis was conducted in MATLAB. Statistical tests were done using a Wilcoxon rank sum test (MATLAB ‘ranksum’), Wilcoxon signed-rank test for paired data (MATLAB ‘signrank’) or Kruskal-Wallis one-way ANOVA test for comparison between more than two groups (MATLAB ‘kruskalwallis’). No randomization of experimental subjects was necessary as all mice were trained and recorded under the same conditions. Data collection and analysis were not performed blind to the conditions of the experiment, but analysis relied on code that was standardized for all experimental conditions. Data distributions were not assumed to be normally distributed and all statistical comparisons between groups of continuous variables were performed using non-parametric tests. Adjustments for multiple comparisons were not made unless stated otherwise. No mice were excluded from the analysis unless they did not learn the task, data could not be collected due to poor GCaMP expression or occlusion of the chronic window. All other exclusion of trials or sessions are mentioned in the methods section.
Extended Data
Extended Data Fig. 1.
Extended Data Fig. 2.
Extended Data Fig. 3.
Extended Data Fig. 4.
Extended Data Fig. 5.
Extended Data Fig. 6.
Extended Data Fig. 7.
Extended Data Fig. 8.
Extended Data Fig. 9.
Extended Data Fig. 10.
Supplementary Material
Acknowledgements
We are grateful to Soyon Chun, Matt Hoddinott and Olivia Houghton for help with animal husbandry; Alice O’Leary, Eugenie Ordonneau, Dimitra Vardalakis, Riccardo Ratto and Olivia Houghton for help with training mice; and Arnd Roth, Dimitar Kostadinov, Nick Robinson, Mehmet Fisek, Brendan Bicknell and Mickey London for helpful discussions and comments on the manuscript. We thank Lloyd Russell for providing PyBehavior software. C.B. was supported by an EMBO Long-Term Fellowship and a Marie Curie Fellowship from the EU. M.P. was supported by a LIDO scholarship from the BBSRC. E.B. was supported through the Erasmus+ Traineeship programme by the EU. M.H. was supported by the Wellcome Trust, BBSRC, and ERC. The funders had no role in study design, data collection and analysis, decision to publish or preparation of the manuscript.
Footnotes
Author Contributions
C.B. and M.H. conceived the project. C.B. and Z.Z. designed the experiments. Z.Z. developed software and performed all-optical experiments. C.B., Z.Z, M.P., J.S., E.B., and S.M. performed experiments. C.B, S.M. and Z.Z. analyzed whisker data. C.B. and Z.Z. analyzed the data. C.B., Z.Z. and M.H. wrote the manuscript.
Competing Interests Statement
The authors declare no competing interests.
Data Availability
The data that support the findings of this study are available from the corresponding authors upon reasonable request.
Code availability
The analysis code used in this study are available from the corresponding authors upon reasonable request.
References
- 1.Hubel DH, Wiesel TN. Receptive fields, binocular interaction and functional architecture in the cat’s visual cortex. Journal of Physiology. 1962;160:106–154. doi: 10.1113/jphysiol.1962.sp006837. [DOI] [PMC free article] [PubMed] [Google Scholar]
- 2.Hernandez A, Zainos A, Romo R. Neuronal correlates of sensory discrimination in the somatosensory cortex. PNAS. 2000;97:6191–6196. doi: 10.1073/pnas.120018597. [DOI] [PMC free article] [PubMed] [Google Scholar]
- 3.Arabzadeh E, Zorzin E, Diamond ME. Neuronal encoding of texture in the whisker sensory pathway. PLoS Biol. 2005;3:e17. doi: 10.1371/journal.pbio.0030017. [DOI] [PMC free article] [PubMed] [Google Scholar]
- 4.Romo R, de Lafuente V. Conversion of sensory signals into perceptual decisions. Prog Neurobiol. 2013;103:41–75. doi: 10.1016/j.pneurobio.2012.03.007. [DOI] [PubMed] [Google Scholar]
- 5.Brody CD, Hanks TD. Neural underpinnings of the evidence accumulator. Curr Opin Neurobiol. 2016;37:149–157. doi: 10.1016/j.conb.2016.01.003. [DOI] [PMC free article] [PubMed] [Google Scholar]
- 6.Hanks TD, Ditterich J, Shadlen MN. Microstimulation of macaque area LIP affects decision-making in a motion discrimination task. Nat Neurosci. 2006;9:682–689. doi: 10.1038/nn1683. [DOI] [PMC free article] [PubMed] [Google Scholar]
- 7.Kim J-N, Shadlen MN. Neural correlates of a decision in the dorsolateral prefrontal cortex of the macaque. Nature. 1999;2:176–185. doi: 10.1038/5739. [DOI] [PubMed] [Google Scholar]
- 8.Horwitz GD, Newsome WT. Separate signals for target selection and movement specification in the superior colliculus. Science. 1999;284:1158–1161. doi: 10.1126/science.284.5417.1158. [DOI] [PubMed] [Google Scholar]
- 9.Barlow HB. Possible principles underlying the transformations of sensory messages. MIT Press; 1959. [Google Scholar]
- 10.Rossi-Pool R, et al. Emergence of an abstract categorical code enabling the discrimination of temporally structured tactile stimuli. Proc Natl Acad Sci U S A. 2016;113:E7966–E7975. doi: 10.1073/pnas.1618196113. [DOI] [PMC free article] [PubMed] [Google Scholar]
- 11.de Lafuente V, Romo R. Neural correlate of subjective sensory experience gradually builds up across cortical areas. PNAS. 2006;103:14266–14271. doi: 10.1073/pnas.0605826103. [DOI] [PMC free article] [PubMed] [Google Scholar]
- 12.Romo R, Hernandez A, Zainos A, Lemus L, Brody CD. Neuronal correlates of decision-making in secondary somatosensory cortex. Nat Neurosci. 2002;5:1217–1225. doi: 10.1038/nn950. [DOI] [PubMed] [Google Scholar]
- 13.Fassihi A, Akrami A, Pulecchi F, Schonfelder V, Diamond ME. Transformation of Perception from Sensory to Motor Cortex. Curr Biol. 2017;27:1585–1596.:e1586. doi: 10.1016/j.cub.2017.05.011. [DOI] [PMC free article] [PubMed] [Google Scholar]
- 14.Guo ZV, et al. Flow of cortical activity underlying a tactile decision in mice. Neuron. 2014;81:179–194. doi: 10.1016/j.neuron.2013.10.020. [DOI] [PMC free article] [PubMed] [Google Scholar]
- 15.McGuire LM, et al. Short Time-Scale Sensory Coding in S1 during Discrimination of Whisker Vibrotactile Sequences. PLoS Biol. 2016;14:e1002549. doi: 10.1371/journal.pbio.1002549. [DOI] [PMC free article] [PubMed] [Google Scholar]
- 16.Sachidhanandam S, Sreenivasan V, Kyriakatos A, Kremer Y, Petersen CC. Membrane potential correlates of sensory perception in mouse barrel cortex. Nat Neurosci. 2013;16:1671–1677. doi: 10.1038/nn.3532. [DOI] [PubMed] [Google Scholar]
- 17.Kwon SE, Yang H, Minamisawa G, O’Connor DH. Sensory and decision-related activity propagate in a cortical feedback loop during touch perception. Nat Neurosci. 2016;19:1243–1249. doi: 10.1038/nn.4356. [DOI] [PMC free article] [PubMed] [Google Scholar]
- 18.Yang H, Kwon SE, Severson KS, O’Connor DH. Origins of choice-related activity in mouse somatosensory cortex. Nat Neurosci. 2016;19:127–134. doi: 10.1038/nn.4183. [DOI] [PMC free article] [PubMed] [Google Scholar]
- 19.Chen JL, Carta S, Soldado-Magraner J, Schneider BL, Helmchen F. Behaviour-dependent recruitment of long-range projection neurons in somatosensory cortex. Nature. 2013;499:336–340. doi: 10.1038/nature12236. [DOI] [PubMed] [Google Scholar]
- 20.Musall S, Kaufman MT, Juavinett AL, Gluf S, Churchland AK. Single-trial neural dynamics are dominated by richly varied movements. Nat Neurosci. 2019;22:1677–1686. doi: 10.1038/s41593-019-0502-4. [DOI] [PMC free article] [PubMed] [Google Scholar]
- 21.Stringer C, et al. Spontaneous behaviors drive multidimensional, brainwide activity. Science. 2019;364:255. doi: 10.1126/science.aav7893. [DOI] [PMC free article] [PubMed] [Google Scholar]
- 22.Steinmetz NA, Zatka-Haas P, Carandini M, Harris KD. Distributed coding of choice, action and engagement across the mouse brain. Nature. 2019;576:266–273. doi: 10.1038/s41586-019-1787-x. [DOI] [PMC free article] [PubMed] [Google Scholar]
- 23.Poort J, et al. Learning Enhances Sensory and Multiple Non-sensory Representations in Primary Visual Cortex. Neuron. 2015;86:1478–1490. doi: 10.1016/j.neuron.2015.05.037. [DOI] [PMC free article] [PubMed] [Google Scholar]
- 24.Scott BB, et al. Imaging Cortical Dynamics in GCaMP Transgenic Rats with a Head-Mounted Widefield Macroscope. Neuron. 2018;100:1045–1058.:e1045. doi: 10.1016/j.neuron.2018.09.050. [DOI] [PMC free article] [PubMed] [Google Scholar]
- 25.Brecht M, Roth A, Sakmann B. Dynamic receptive fields of reconstructed pyramidal cells in layers 3 and 2 of rat somatosensory barrel cortex. J Physiol. 2003;553:243–265. doi: 10.1113/jphysiol.2003.044222. [DOI] [PMC free article] [PubMed] [Google Scholar]
- 26.Nienborg H, Cumming B. Correlations between the activity of sensory neurons and behavior: how much do they tell us about a neuron’s causality? Curr Opin Neurobiol. 2010;20:376–381. doi: 10.1016/j.conb.2010.05.002. [DOI] [PMC free article] [PubMed] [Google Scholar]
- 27.Katz LN, Yates JL, Pillow JW, Huk AC. Dissociated functional significance of decision-related activity in the primate dorsal stream. Nature. 2016;535:285–288. doi: 10.1038/nature18617. [DOI] [PMC free article] [PubMed] [Google Scholar]
- 28.Rickgauer JP, Deisseroth K, Tank DW. Simultaneous cellular-resolution optical perturbation and imaging of place cell firing fields. Nat Neurosci. 2014;17:1816–1824. doi: 10.1038/nn.3866. [DOI] [PMC free article] [PubMed] [Google Scholar]
- 29.Carrillo-Reid L, Han S, Yang W, Akrouh A, Yuste R. Controlling Visually Guided Behavior by Holographic Recalling of Cortical Ensembles. Cell. 2019;178:447–457.:e445. doi: 10.1016/j.cell.2019.05.045. [DOI] [PMC free article] [PubMed] [Google Scholar]
- 30.Daie K, Svoboda K, Druckmann S. Targeted photostimulation uncovers circuit motifs supporting short-term memory. Nat Neurosci. 2021;24:259–265. doi: 10.1038/s41593-020-00776-3. [DOI] [PubMed] [Google Scholar]
- 31.Marshel JH, et al. Cortical layer-specific critical dynamics triggering perception. Science. 2019;365 doi: 10.1126/science.aaw5202. [DOI] [PMC free article] [PubMed] [Google Scholar]
- 32.Peron SP, Freeman J, Iyer V, Guo C, Svoboda K. A Cellular Resolution Map of Barrel Cortex Activity during Tactile Behavior. Neuron. 2015;86:783–799. doi: 10.1016/j.neuron.2015.03.027. [DOI] [PubMed] [Google Scholar]
- 33.Britten KH, Newsome WT, Shadlen MN, Celebrini S, Movshon JA. A relationship between behavioral choice and the visual response of neurons in macaque MT. Visual Neuroscience. 1996;13:87–100. doi: 10.1017/s095252380000715x. [DOI] [PubMed] [Google Scholar]
- 34.Okun M, et al. Diverse coupling of neurons to populations in sensory cortex. Nature. 2015;521:511–515. doi: 10.1038/nature14273. [DOI] [PMC free article] [PubMed] [Google Scholar]
- 35.Ko H, et al. Functional specificity of local synaptic connections in neocortical networks. Nature. 2011;473:87–91. doi: 10.1038/nature09880. [DOI] [PMC free article] [PubMed] [Google Scholar]
- 36.Shadlen MN, Newsome WT. The variable discharge of cortical neurons: Implications for connectivity, computation, and information coding. The Journal of Neuroscience. 1998;18:3870–3896. doi: 10.1523/JNEUROSCI.18-10-03870.1998. [DOI] [PMC free article] [PubMed] [Google Scholar]
- 37.Chen JL, et al. Pathway-specific reorganization of projection neurons in somatosensory cortex during learning. Nat Neurosci. 2015;18:1101–1108. doi: 10.1038/nn.4046. [DOI] [PubMed] [Google Scholar]
- 38.Keller GB, Mrsic-Flogel TD. Predictive Processing: A Canonical Cortical Computation. Neuron. 2018;100:424–435. doi: 10.1016/j.neuron.2018.10.003. [DOI] [PMC free article] [PubMed] [Google Scholar]
- 39.Russell LE, et al. The influence of visual cortex on perception is modulated by behavioural state. BioRXiv. 2019 doi: 10.1101/706010. [DOI] [Google Scholar]
- 40.Dalgleish HWP, et al. How many neurons are sufficient for perception of cortical activity? eLife. 2020;9 doi: 10.7554/eLife.58889. [DOI] [PMC free article] [PubMed] [Google Scholar]
- 41.Robinson NTM, et al. Targeted Activation of Hippocampal Place Cells Drives Memory-Guided Spatial Behavior. Cell. 2020;183:1586–1599.:e1510. doi: 10.1016/j.cell.2020.09.061. [DOI] [PMC free article] [PubMed] [Google Scholar]
- 42.Chettih SN, Harvey CD. Single-neuron perturbations reveal feature-specific competition in V1. Nature. 2019;567:334–340. doi: 10.1038/s41586-019-0997-6. [DOI] [PMC free article] [PubMed] [Google Scholar]
- 43.Hong YK, Lacefield CO, Rodgers CC, Bruno RM. Sensation, movement and learning in the absence of barrel cortex. Nature. 2018;561:542–546. doi: 10.1038/s41586-018-0527-y. [DOI] [PMC free article] [PubMed] [Google Scholar]
- 44.Kawai R, et al. Motor cortex is required for learning but not for executing a motor skill. Neuron. 2015;86:800–812. doi: 10.1016/j.neuron.2015.03.024. [DOI] [PMC free article] [PubMed] [Google Scholar]
- 45.Park JM, et al. Deep and superficial layers of the primary somatosensory cortex are critical for whisker-based texture discrimination in mice. BioRXiv. 2022 doi: 10.1101/2020.08.12.245381. [DOI] [Google Scholar]
- 46.Wolfe J, et al. Texture coding in the rat whisker system: slip-stick versus differential resonance. PLoS Biol. 2008;6:e215. doi: 10.1371/journal.pbio.0060215. [DOI] [PMC free article] [PubMed] [Google Scholar]
- 47.Guic-Robles EJ, M W, Bravo H. Vibrissal roughness discrimination is barrelcortexdependent. Behavioural Brain Research. 1992;48:145–152. doi: 10.1016/s0166-4328(05)80150-0. [DOI] [PubMed] [Google Scholar]
- 48.Shadlen MN, Newsome WT. Motion perception: Seeing and deciding. Proc Natl Acad Sci U S A. 1996;93:628–633. doi: 10.1073/pnas.93.2.628. [DOI] [PMC free article] [PubMed] [Google Scholar]
- 49.Britten KH, Newsome WT, Shadlen MN, Celebrini S, Movshon JA. A relationship between behavioral choice and the visual response of neurons in macaque MT. Visual Neuroscience. 1996;13:87–100. doi: 10.1017/s095252380000715x. [DOI] [PubMed] [Google Scholar]
- 50.Nienborg H, Cohen MR, Cumming BG. Decision-related activity in sensory neurons: correlations among neurons and with behavior. Annu Rev Neurosci. 2012;35:463–483. doi: 10.1146/annurev-neuro-062111-150403. [DOI] [PubMed] [Google Scholar]
- 51.Parker AJ, Newsome WT. Sense and the single neuron: Probing the Physiology of Perception. Annual Review of Neuroscience. 1998;21:227–277. doi: 10.1146/annurev.neuro.21.1.227. [DOI] [PubMed] [Google Scholar]
- 52.Shadlen MN, Britten KH, Newsome WT, Movshon JA. A Computational Analysis of the Relationship between Neuronal and Behavioral Responses to Visual Motion. The Journal of Neuroscience. 1996;16:1486–1510. doi: 10.1523/JNEUROSCI.16-04-01486.1996. [DOI] [PMC free article] [PubMed] [Google Scholar]
- 53.Peron S, et al. Recurrent interactions in local cortical circuits. Nature. 2020;579:256–259. doi: 10.1038/s41586-020-2062-x. [DOI] [PMC free article] [PubMed] [Google Scholar]
- 54.Condylis C, et al. Context-Dependent Sensory Processing across Primary and Secondary Somatosensory Cortex. Neuron. 2020;106:515–525.:e515. doi: 10.1016/j.neuron.2020.02.004. [DOI] [PMC free article] [PubMed] [Google Scholar]
- 55.Felleman DJ, Van Essen DC. Distributed Hierarchical Processing in the Primate Cerebral Cortex. Cerebral Cortex. 1991;1:1–47. doi: 10.1093/cercor/1.1.1-a. [DOI] [PubMed] [Google Scholar]
- 56.Freedman DJ, Assad JA. Neuronal Mechanisms of Visual Categorization: An Abstract View on Decision Making. Annu Rev Neurosci. 2016;39:129–147. doi: 10.1146/annurev-neuro-071714-033919. [DOI] [PubMed] [Google Scholar]
- 57.Panzeri S, Harvey CD, Piasini E, Latham PE, Fellin T. Cracking the Neural Code for Sensory Perception by Combining Statistics, Intervention, and Behavior. Neuron. 2017;93:491–507. doi: 10.1016/j.neuron.2016.12.036. [DOI] [PMC free article] [PubMed] [Google Scholar]
- 58.Churchland PS, Ramachandran VS, Sejnowski TJ. In: Large-Scale Neuronal Theories of the Brain. Koch C, Davis JL, editors. The MIT Press; 1994. Ch. 2. [Google Scholar]
- 59.Chen TW, et al. Ultrasensitive fluorescent proteins for imaging neuronal activity. Nature. 2013;499:295–300. doi: 10.1038/nature12354. [DOI] [PMC free article] [PubMed] [Google Scholar]
- 60.Steinmetz NA, et al. Aberrant Cortical Activity in Multiple GCaMP6-Expressing Transgenic Mouse Lines. eNeuro. 2017;4 doi: 10.1523/ENEURO.0207-17.2017. [DOI] [PMC free article] [PubMed] [Google Scholar]
- 61.Dana H, et al. High-performance calcium sensors for imaging activity in neuronal populations and microcompartments. Nat Methods. 2019;16:649–657. doi: 10.1038/s41592-019-0435-6. [DOI] [PubMed] [Google Scholar]
- 62.Mathis A, et al. DeepLabCut: markerless pose estimation of user-defined body parts with deep learning. Nat Neurosci. 2018;21:1281–1289. doi: 10.1038/s41593-018-0209-y. [DOI] [PubMed] [Google Scholar]
- 63.Guo ZV, et al. Procedures for behavioral experiments in head-fixed mice. PLoS One. 2014;9:e88678. doi: 10.1371/journal.pone.0088678. [DOI] [PMC free article] [PubMed] [Google Scholar]
- 64.Watson BO, Yuste R, Packer AM. PackIO and EphysViewer: software tools for acquisition and analysis of neuroscience data. bioRxiv. 2016 doi: 10.1101/054080. [DOI] [Google Scholar]
- 65.Packer AM, Russell LE, Dalgleish HW, Häusser M. Simultaneous all-optical manipulation and recording of neural circuit activity with cellular resolution in vivo. Nat Methods. 2015;12:140–146. doi: 10.1038/nmeth.3217. [DOI] [PMC free article] [PubMed] [Google Scholar]
- 66.Gerchberg RW, Saxton WO. A Practical Algorithm for the Determination of Phase from Image and Diffraction Plane Pictures. Optik. 1972;35:237–246. [Google Scholar]
- 67.Giovannucci A, et al. CaImAn an open source tool for scalable calcium imaging data analysis. Elife. 2019;8 doi: 10.7554/eLife.38173. [DOI] [PMC free article] [PubMed] [Google Scholar]
- 68.Kobak D, et al. Demixed principal component analysis of neural population data. Elife. 2016;5 doi: 10.7554/eLife.10989. [DOI] [PMC free article] [PubMed] [Google Scholar]
- 69.Zhang Z, Russell LE, Packer AM, Gauld OM, Hausser M. Closed-loop all-optical interrogation of neural circuits in vivo. Nat Methods. 2018;15:1037–1040. doi: 10.1038/s41592-018-0183-z. [DOI] [PMC free article] [PubMed] [Google Scholar]
- 70.Pachitariu M, et al. Suite2p: beyond 10,000 neurons with standard two-photon microscopy. bioRXiv. 2016 doi: 10.1101/061507. [DOI] [Google Scholar]
- 71.Cohen MR, Kohn A. Measuring and interpreting neuronal correlations. Nat Neurosci. 2011;14:811–819. doi: 10.1038/nn.2842. [DOI] [PMC free article] [PubMed] [Google Scholar]
- 72.Averbeck BB, Latham PE, Pouget A. Neural correlations, population coding and computation. Nat Rev Neurosci. 2006;7:358–366. doi: 10.1038/nrn1888. [DOI] [PubMed] [Google Scholar]
Associated Data
This section collects any data citations, data availability statements, or supplementary materials included in this article.
Supplementary Materials
Data Availability Statement
The data that support the findings of this study are available from the corresponding authors upon reasonable request.
The analysis code used in this study are available from the corresponding authors upon reasonable request.


