Abstract
DNA interstrand crosslinks are tumor-inducing lesions that block DNA replication and transcription. When crosslinks are detected at stalled replication forks, ATR kinase phosphorylates FANCI, which stimulates monoubiquitination of the FANCD2-FANCI clamp by the Fanconi anemia (FA) core complex. Monoubiquitinated FANCD2-FANCI is locked onto DNA and recruits nucleases that mediate DNA repair. However, it remains unclear how phosphorylation activates this pathway. Here, we report structures of FANCD2-FANCI complexes containing phosphomimetic FANCI. We observe that, unlike wild-type FANCD2-FANCI, the phosphomimetic complex closes around DNA, independent of the FA core complex. Surprisingly, the phosphomimetic mutations do not substantially alter DNA binding but instead destabilize the open state of FANCD2-FANCI and alter its conformational dynamics. Overall, our results reveal that phosphorylation primes the FANCD2-FANCI clamp for ubiquitination, showing how multiple post-translational modifications are coordinated to control DNA-repair.
Introduction
DNA interstrand crosslinks prevent strand separation and block progression of the replication and transcription machineries1–3. These toxic lesions are sensed and repaired by the Fanconi anemia (FA) pathway4,5, which is defective in the genetic disease FA4. The pivotal step in crosslink repair is monoubiquitination of the FANCD2-FANCI (D2-I) heterodimer by the FA core complex, a multisubunit E3 ubiquitin ligase6–10. Monoubiquitination is required for recruitment of downstream nucleases and repair factors that mediate DNA repair1,7,11,12. To complete the pathway, ubiquitin must be removed by the USP1-UAF1 complex13–15.
Recent work has revealed that D2-I is a DNA clamp16–23. Unmodified D2-I adopts an open, trough-like conformation, in which the ubiquitination sites on FANCD2 (Lys561 in human, Lys563 in chicken) and FANCI (Lys523 in human, Lys525 in chicken) are occluded within the heterodimerization interface16,17,19,22. DNA binding and interaction with the FA core complex and the E2 enzyme Ube2T result in a dramatic conformational rearrangement that closes the D2-I clamp around double-stranded (ds)DNA16,19,22,23. This exposes the target lysines, allowing them to be monoubiquitinated, which in turn locks closed D2-I on DNA16,22. In vitro, dsDNA stimulates ubiquitination and a crosslink is not required24–26. Ubiquitination of FANCD2 is necessary and sufficient to trap D2-I on DNA and enable DNA repair7,10,16,22,27, whereas FANCI ubiquitination likely plays a regulatory role to prevent untimely deubiquitination19,21.
The FA pathway is activated by the DNA damage kinase ATR10,27–31. Phosphorylation of three conserved residues in FANCI stimulates D2-I monoubiquitination and increases its chromatin association27,29–31. FANCI phosphorylation also interferes with D2-I deubiquitination to prevent premature shutoff of the pathway19,29,31. Accordingly, inactivation of ATR in cells leads to increased sensitivity to DNA crosslinking agents and defective FA-mediated DNA repair29,30,32. A previous study had suggested that FANCI phosphorylation stimulates monoubiquitination by increasing its DNA retention time31 but the mechanistic basis for stimulation of D2-I monoubiquitination remains unclear.
Here, we used a phosphomimetic chicken FANCI (I3D) to investigate the mechanism of FA pathway activation by ATR. CryoEM structures reveal that the D2-I3D clamp is closed on DNA, even when it is not ubiquitinated. Our data suggest that bulky, negatively-charged residues in the FANCI phospho-loop destabilize the D2-I open state, thereby priming it for ubiquitination by the FA core complex. Overall, this reveals the molecular basis for ATR activation of FA-mediated DNA repair.
Results
Phosphomimetic FANCI stimulates FANCD2 ubiquitination
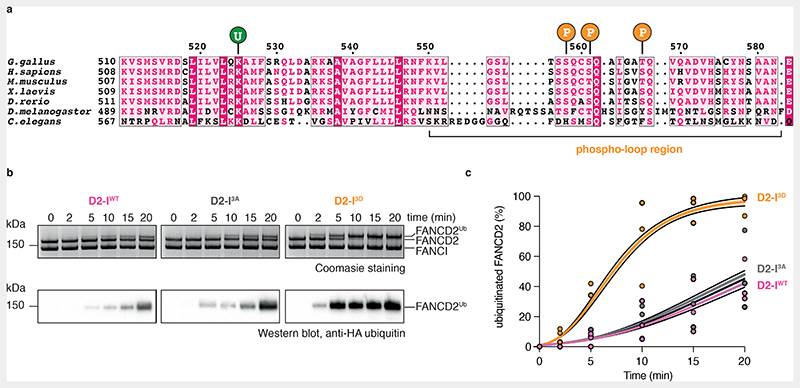
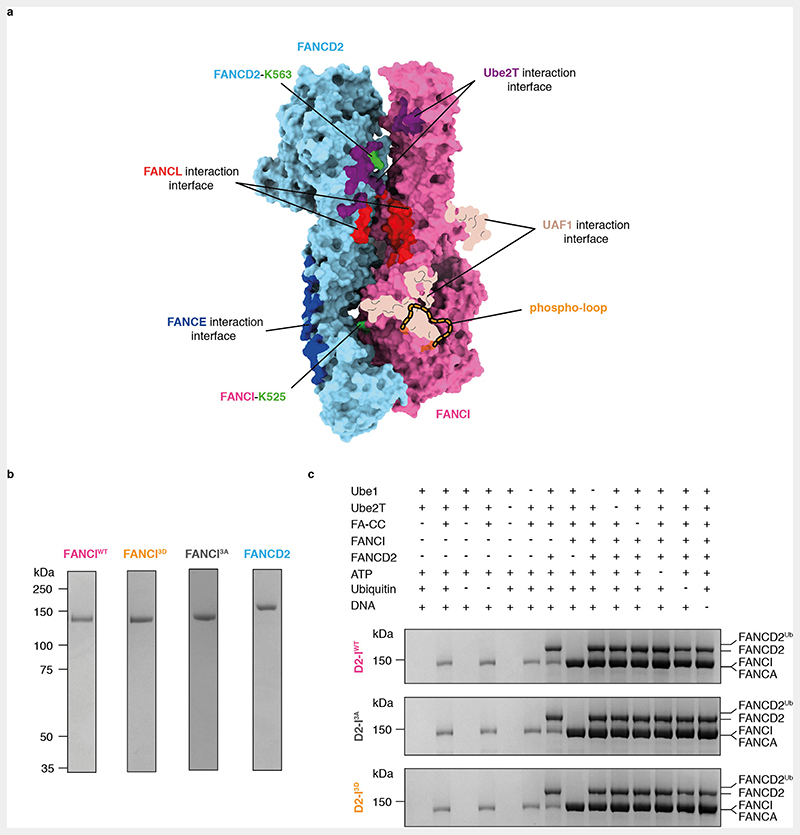
Phosphomimetic mutations recapitulate the consequences of phosphorylation on FA pathway activation in the absence of ATR since they promote FANCD2 monoubiquitination in vitro and in vivo27,29,31,32. Thus, to determine how phosphorylation of FANCI affects in vitro ubiquitination of FANCD2 by the intact FA core complex, we purified phosphomimetic (I3D) chicken FANCI, where the three conserved phosphorylation sites, Ser558, Ser561 and Thr567, were mutated to aspartic acid (Fig. 1a, Extended Data Fig. 1a-b). We also purified wild-type FANCI (IWT) and a phospho-dead version of FANCI (I3A), where the same residues were mutated to alanine (Extended Data Fig. 1b).
Fig. 1. Phosphomimetic mutations of conserved ATR phosphorylation sites in the FANCI phospho-loop stimulate monoubiquitination of FANCD2.
(a) Multiple sequence alignment of residues 510-583 from G. gallus FANCI and the corresponding region in other FANCI orthologues. Highly-conserved residues are shaded in magenta; partially-conserved residues are shaded in light pink. The FANCI-K525 ubiquitination site is marked with a ‘U’ and each of the three phosphorylation sites within the conserved S/TQ motifs are marked with a ‘P’. The phospho-loop is indicated. (b) Monoubiquitination assays of wild-type (WT), phosphodead (3A) and phosphomimetic (3D) D2-I complexes. The level of FANCD2 ubiquitination was analyzed using SDS-PAGE and Coomassie staining (top) and by western blotting with an anti-HA antibody against HA-tagged ubiquitin (bottom). Ubiquitination is visible as an increase in apparent molecular weight of FANCD2. These data are representative of experiments performed independently three times. (c) Quantification of monoubiquitination assays from panel b. Data obtained from three independent assays were quantified as percentage of ubiquitinated FANCD2. Replicate data were fitted using a global non-linear regression function as described in the Methods. Data points of each replicate (symbols), the corresponding mean (central solid line) and the 95% confidence interval (shaded area between dashed lines) are shown.
Next, we carried out in vitro ubiquitination assays of FANCD2 in complex with IWT, I3A or I3D, in the presence of a 44-bp dsDNA and a fully recombinant FA core complex. D2-IWT and D2-I3A were monoubiquitinated at a similar rate, with approximately 40% of FANCD2 modified in 20 minutes (Fig. 1b-c, Extended Data Fig. 1c). In contrast, D2-I3D was monoubiquitinated at a much faster rate: after 10 minutes, approximately 75% of D2-I3D was monoubiquitinated (compared to 15% of D2-IWT) and the D2-I3D complex was fully monoubiquitinated (>95%) after 20 minutes (Fig. 1b-c, Extended Data Fig. 1c). These results show that phosphomimetic mutations in FANCI stimulate FANCD2 monoubiquitination by the FA core complex in vitro.
Phosphomimetic mutations close the D2-I clamp on DNA
The ATR phosphorylation sites are located in a flexible region of FANCI, adjacent to the FANCI ubiquitination site, and the FA core complex, Ube2T and USP1-UAF1 binding sites (Extended Data Fig. 1a), referred to here as the “phospho-loop”17,29,31,32. In a crystal structure of non-ubiquitinated mouse D2-I, the phospho-loop was involved in a hydrogen-bond network at the interface between FANCD2 and FANCI17. However, in all reported cryoEM structures, the phospho-loop was not resolved, suggesting that it is inherently flexible16,18,22,23.
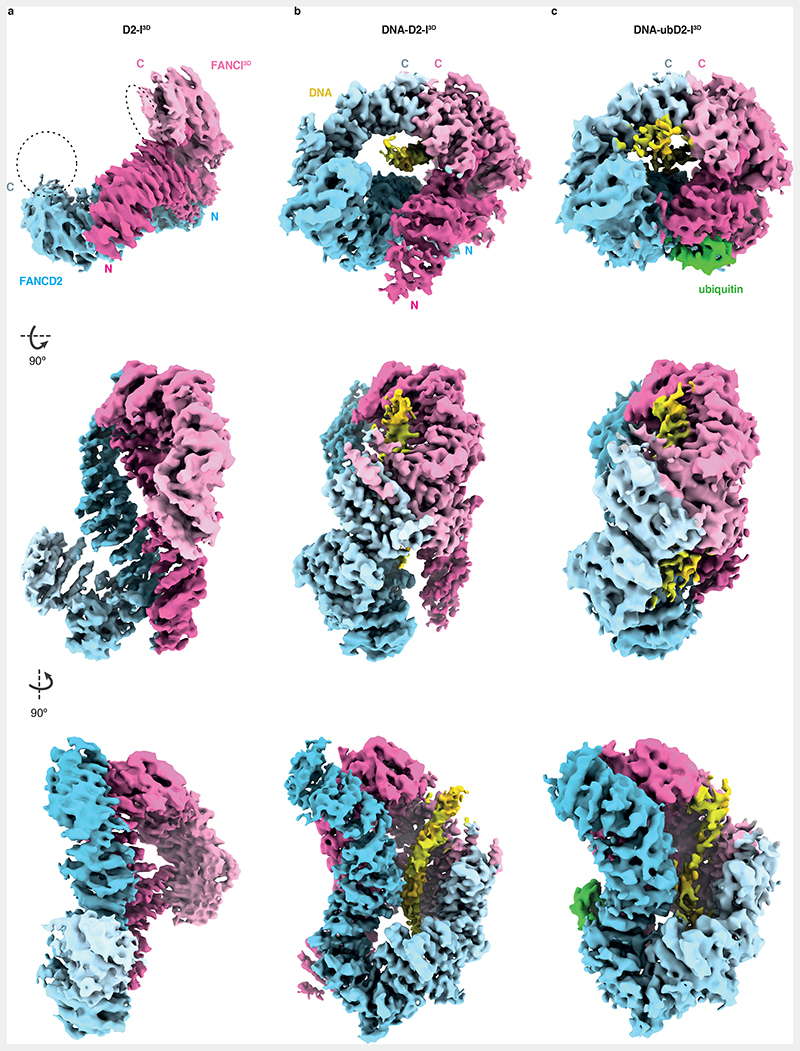
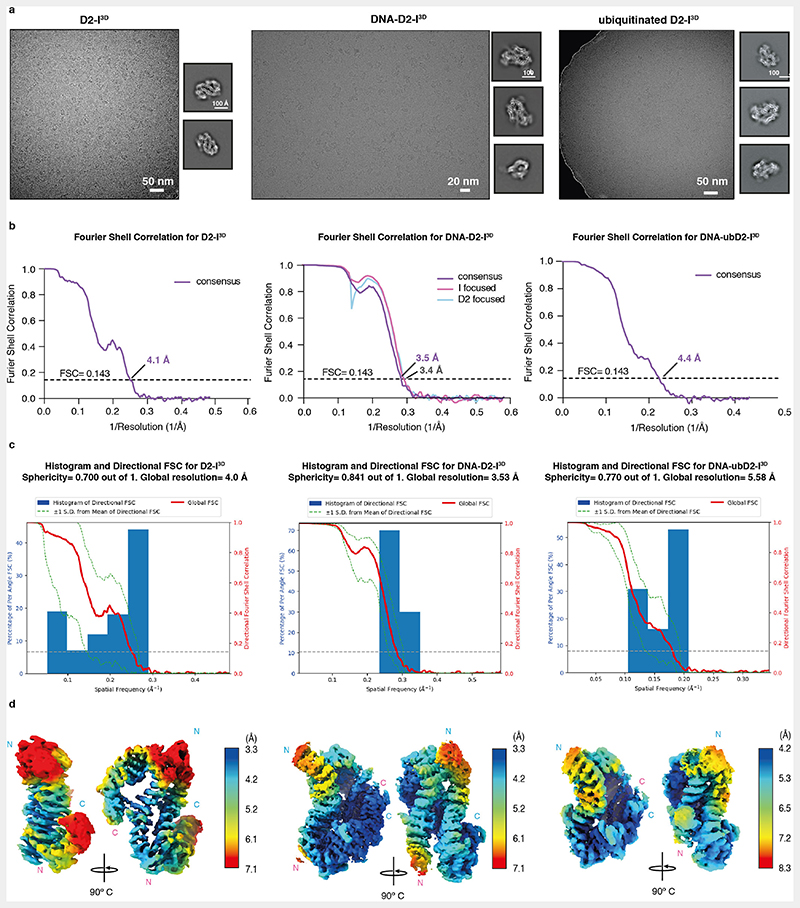
To obtain structural insight into how phosphorylation of FANCI stimulates FANCD2 monoubiquitination, we determined cryoEM structures of D2-I3D alone, D2-I3D with DNA, and monoubiquitinated D2-I3D (ubD2-I3D) with DNA at overall resolutions of 4.1, 3.5 and 4.4 Å, respectively (Fig. 2, Extended Data Fig. 2 and 3a, Table 1). D2-I3D alone had a preferred orientation in cryoEM but it adopted an open, trough-like conformation, whereas ubD2-I3D was in the closed state, locked on DNA (Fig. 2a and c). Both of these structures are similar to their wild-type counterparts16,17,19,22. Strikingly, in the presence of DNA, D2-I3D adopted the closed state, clamped onto DNA (Fig. 2b). This was surprising since all previous structures of the non-ubiquitinated DNA-bound complex are in the open state16,22. Closed D2-I had only been observed in structures where ubiquitin or the FA core complex stabilized this conformation on DNA16,19,22,23.
Fig. 2. Phosphomimetic D2-I3D closes around DNA.
(a) Sharpened cryoEM map (B factor -60) of DNA-free D2-I3D. (b) CryoEM map of DNA-bound D2-I3D subjected to local anisotropic sharpening in Phenix. (c) Sharpened (B factor -86) and low-pass filtered (5 Å) cryoEM map of ubiquitinated, DNA-bound D2-I3D. Each map is shown in three different orientations. Density corresponding to FANCD2 is colored in blue, FANCI in magenta (both with a gradient from darker at the N terminus to lighter at the C terminus), DNA in yellow and ubiquitin in green. D2-I3D is in the open state, whereas DNA-bound D2-I3D closes around the DNA and resembles ubD2-I3D where ubiquitin locks the closed complex on DNA. Dashed lines in panel (a) mark the regions where the disordered C-termini of FANCD2 and FANCI might reside. These become ordered upon closure around DNA to form a new interface (b).
Table 1. Overview of data collection, processing, and modelling.
| Data collection and processing | D2-I3D (EMD-15102) | DNA-D2-I3D (EMD-15101) (PDB 8A2Q) | ubD2-I3D (EMD-15103) |
|---|---|---|---|
| Magnification | 75,000x | 105,000x | 105,000x |
| Voltage (keV) | 300 | 300 | 300 |
| Electron exposure (e-/Å2) | 40 | 41 | 40 |
| Defocus range (μm) | -3.0 to -1.5 | -3.0 to -1.5 | -3.0 to -1.5 |
| Pixel size (Å) | 1.04 | 0.86 | 1.145 |
| Symmetry imposed | C1 | C1 | C1 |
| Initial particle images (no.) | 91,892 | 1,356,378 | 450,882 |
| Final particle images (no.) | 55,990 | 197,436 | 25,609 |
| Map resolution (Å) | 4.1 | 3.5 | 4.4 |
| Focused 1 (FANCD2) | / | 3.4 | / |
| Focused 2 (FANCI) | / | 3.4 | / |
| Focused 3 (FANCI with DNA) | / | 3.5 | / |
| FSC threshold | 0.143 | 0.143 | 0.143 |
| Map resolution range (Å) | 4.1 to >10 | 3.5 to >10 | 4.4 to >10 |
| Map sharpening B factor (Å2) | -60 | -55 | -86 |
| Refinement | DNA-D2-I3D | ||
| Initial model used |
Gallus gallus ubD2-I (6tnf, ubiquitin and DNA were removed), idealized 29-bp long dsDNA |
||
| Model resolution | 3.7 | ||
| FSC threshold | 0.5 | ||
| Model resolution range (Å) | n/a | ||
| Map sharpening B factor (Å2) | -55 | ||
| Model composition | |||
| Non-hydrogen atoms | 12,827 | ||
| Protein residues | 2,203 | ||
| Nucleotides | 59 | ||
| Ligands | 0 | ||
| B factors (Å2) | |||
| Protein | 129.31 | ||
| Nucleotide | 0.00 | ||
| Validation | |||
| MolProbity score | 1.13 | ||
| Clashscore | 1.72 | ||
| Poor rotamers (%) | 0.0 | ||
| Ramachandran plot | |||
| Favored (%) | 96.75 | ||
| Allowed (%) | 3.21 | ||
| Disallowed (%) | 0.05 | ||
| Map-model correlation coefficients | |||
| DNA-D2-I CCMASK/CCBOX | 0.71/ 0.66 | ||
| D2-I only CCMASK/CCBOX | 0.78/0.82 | ||
| EM Ringer score | 1.21 | ||
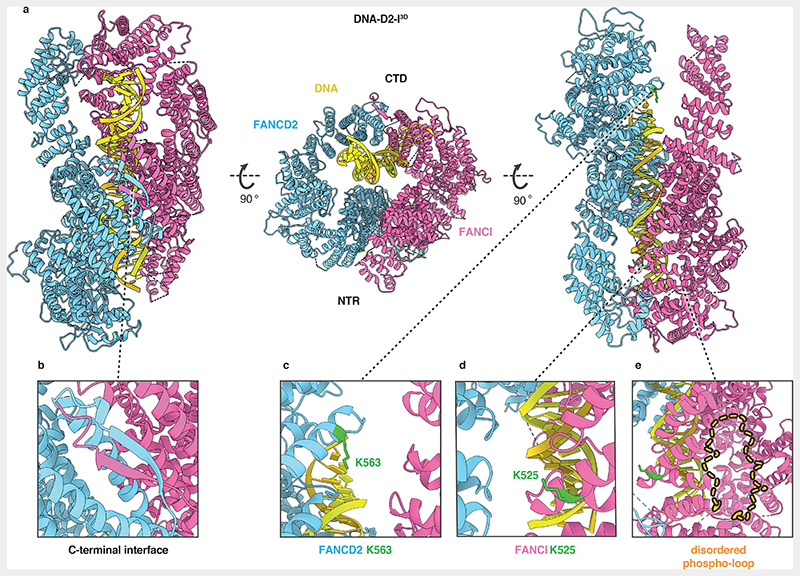
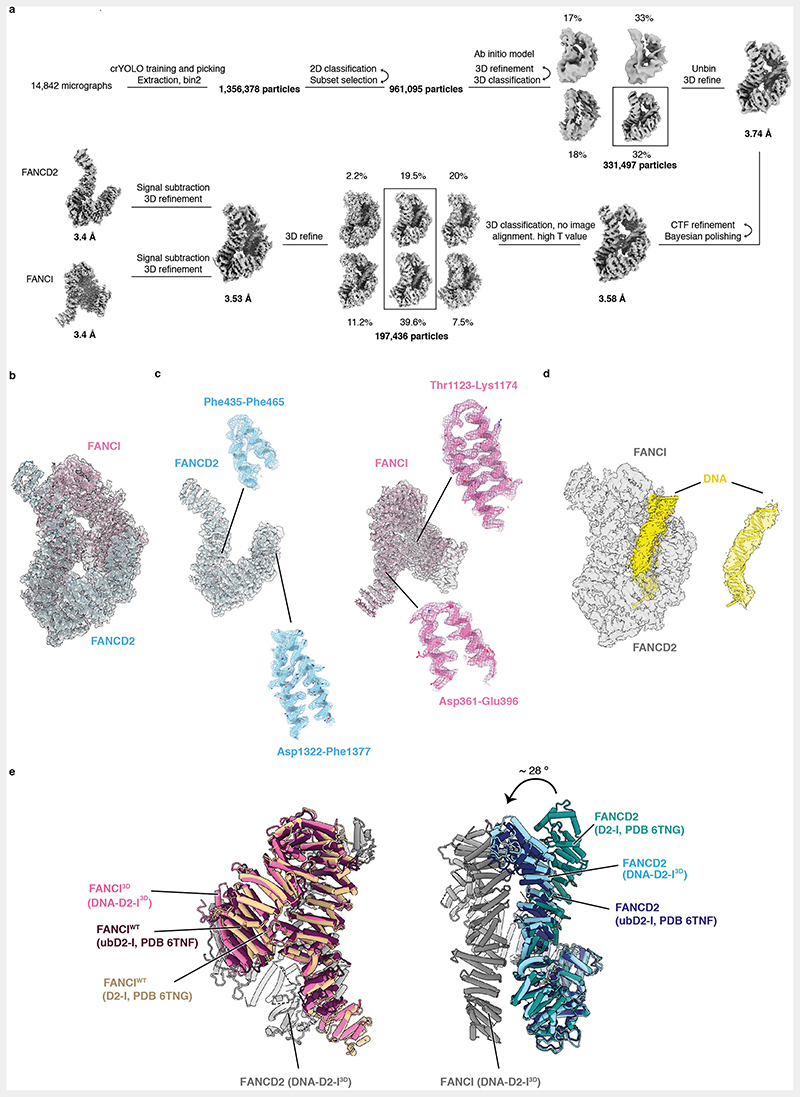
We built an atomic model of the DNA-bound D2-I3D complex and compared it to previously reported structures of D2-I (Fig. 3, Extended Data Fig. 3b-e). D2-I3D closure does not substantially affect the overall structures of the individual subunits, except for the flexible N-terminal region of FANCD2 (residues 1-350), which is rotated by ~28° relative to its position in open D2-I (Extended Data Fig. 3e). To close around DNA, FANCD2 and FANCI3D rotate around a hinge formed by their N-terminal regions so that their C-terminal domains interact with each other, forming a new interface over the DNA (Fig. 2b, 3b, Supplementary Video 1). This C-terminal interaction interface is the best-resolved region of the DNA-bound phosphomimetic complex (Extended Data Fig. 2e), suggesting that the phosphomimetic mutations promote stable closure of D2-I around DNA. The DNA is more poorly resolved than the protein, likely due to heterogeneity of its position, curvature and register within the clamp. This is consistent with D2-I sliding on DNA and binding dsDNA in a sequence-independent manner. In addition, although there is some density extending from the protein to the DNA, this is not well defined. Therefore, we are unable to determine whether this represents protein-DNA contacts, flipped-out bases, or noise.
Fig. 3. Closed, DNA-bound D2-I3D is poised for monoubiquitination.
(a) Cartoon representation of the DNA-bound D2-I3D atomic model showing a front view over the C-terminal interface (left), an end-on view down the DNA channel with the N-terminal region (NTR) and the C-terminal domain (CTD) both visible (middle) and a back view of the N-terminal dimerization interface where the ubiquitination sites are located (right). (b) Close-up view of the C-terminal dimerization interface that forms upon D2-I3D closure around DNA, showing the zipper-like mechanism previously observed in structures of the ubiquitinated or the FA core complex- and DNA-bound wild-type D2-I. (c-d) Close-up of FANCD2-K563 (c) and FANCI-K525 (d) represented as sticks (green) show that these target lysines are solvent-accessible and not occluded in the N-terminal dimerization interface. (e) The phospho-loop is flexible, and could not be modelled. A close-up view of this region with an illustration of a fully extended phospho-loop (dashed orange line) shows its potential position in the context of a closed DNA-bound D2-I3D complex.
As a result of closure, the ubiquitination sites on FANCD2 and FANCI become exposed and accessible (FANCD2-K563 fully and FANCI-K525 partially) to the FA core complex and Ube2T (Fig. 3c-d). The phospho-loop could not be resolved in any of the cryoEM maps, suggesting that it does not form a rigid interaction with FANCD2. The phospho-loop is located close to the D2-I hinge and is likely involved in promoting closure in the presence of DNA (Fig. 3e).
Altogether, these structural data suggest a simple mechanism for how phosphorylation stimulates D2-I monoubiquitination: phosphorylation promotes closure of the D2-I DNA clamp, thereby exposing FANCD2 Lys563, even in the absence of ubiquitination or FA core complex binding. As a result, the phosphorylated complex is closed, but not locked on DNA, and poised for ubiquitination.
DNA binding is not altered by phosphomimetic mutations
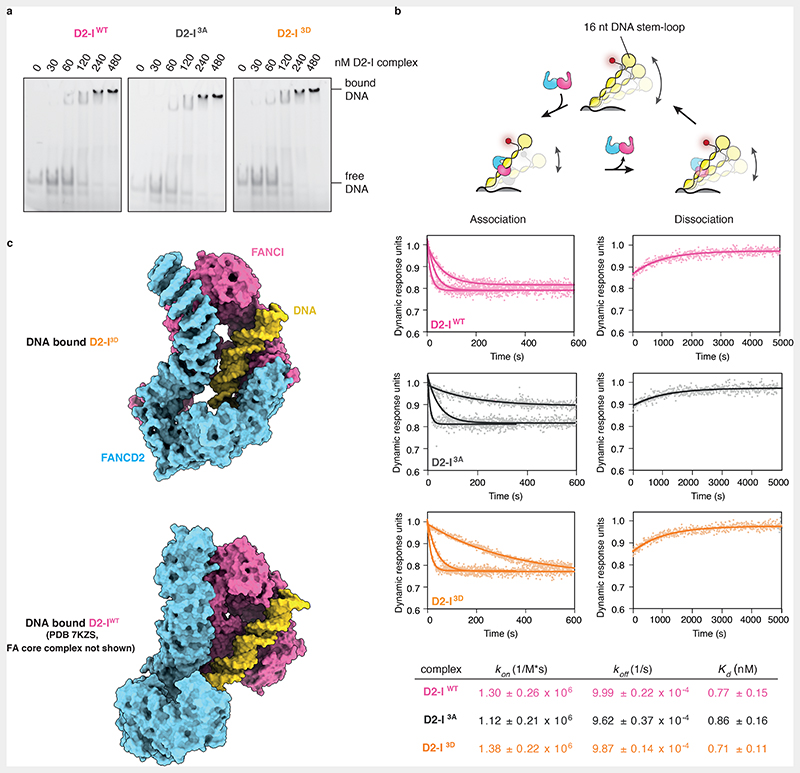
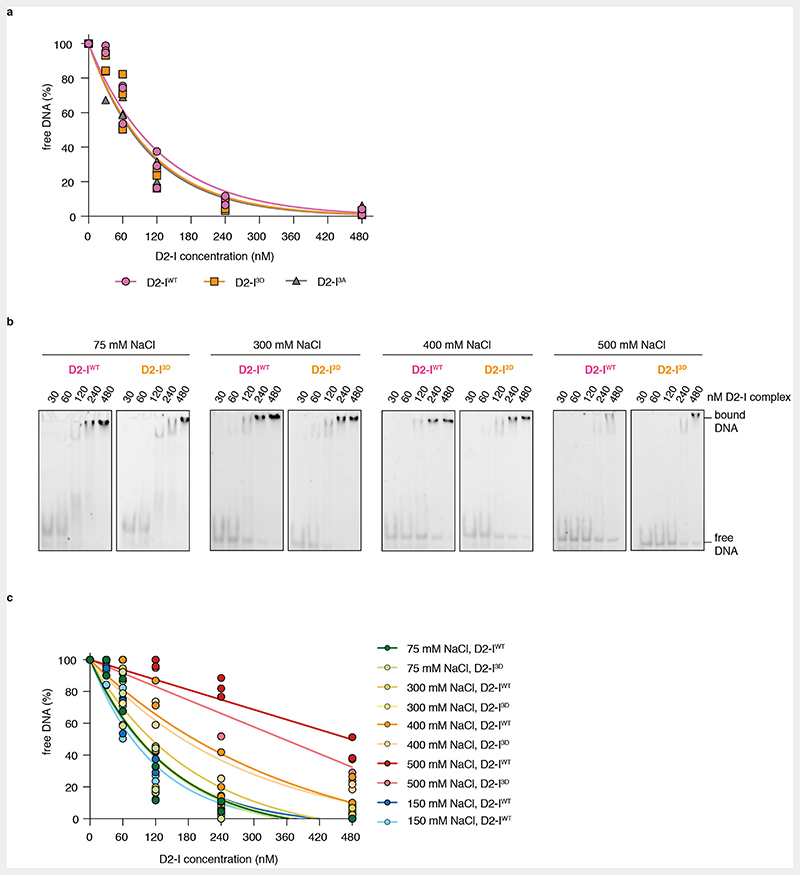
Phosphomimetic mutations in FANCI may stimulate FANCD2 monoubiquitination by increasing the binding affinity for dsDNA, as suggested by a previous study31. To test whether the DNA binding affinity of D2-I3D differs from that of the wild-type complex, we performed electrophoretic mobility shift assays (EMSAs) with D2-IWT, D2-I3A and D2-I3D. However, we did not observe substantial differences in DNA binding by these three complexes in several different salt concentrations (Fig. 4a, Extended Data Fig. 4).
Fig. 4. D2-IWT, D2-I3A and D2-I3D exhibit similar DNA binding kinetics.
(a) Electrophoretic mobility shift assays (EMSAs) using a FAM labelled 44-bp dsDNA. D2-IWT, D2-I3A and D2-I3D (0, 30, 60, 120, 240 and 480 nM) were incubated with 20 nM DNA at 22° C for 30 minutes before loading on a gel. (b) Schematic representation of the SwitchSENSE experiment (top). A 48-bp dsDNA nanolever, containing a 16-nt DNA stem-loop stabilized with four G/C base pairs, was tethered to a chip surface. Switching speed of the chip-tethered DNA was derived from the change in fluorescence brightness (depicted as a red dot on free DNA end in proximity of the 16-nt stem loop), which is maximal when DNA is vertically positioned and decreases as the DNA nanolever is pulled towards the chip surface. Flowing buffer containing D2-I over the chip surface results in D2-I binding to chip-tethered DNA, which decreases its switching speed, and is used to determine the association rate (kon) of D2-I to DNA. D2-I dissociation, achieved by flowing buffer over the chip surface saturated with the D2-I complex, reverts DNA switching to its original speed and is used to determine the dissociation rate (koff) of the D2-I complex from DNA. Data points from association and dissociation experiments were used to fit association and dissociation curves of the D2-IWT, D2-I3A and D2-I3D complexes, which are plotted as dynamic response in dynamics response units versus time in seconds (middle). A table containing calculated kon, koff and Kd values and their corresponding standard deviations for D2-IWT, D2-I3A and D2-I3D is shown at the bottom. (c) Model of chicken DNA-bound D2-I3D (top) and human D2-IWT in an open state bound to DNA and the FA core complex (PDB 7KZS), where the FA core complex is not shown for clarity (bottom). DNA (cartoon representation, yellow) predominantly contacts FANCI (surface representation, magenta) and not FANCD2 (surface representation, blue). The interaction interface between FANCI and DNA is very similar in the structures of the closed, phosphomimetic (top) and the open, wild-type (bottom) complex.
EMSAs may not reveal subtle differences in DNA binding and are not suitable for determining binding kinetics. For example, a complex that takes longer to associate with DNA, but stays stably bound (slow kon and koff), could exhibit a similar Kd towards DNA as a complex that binds more readily, but exhibits faster dissociation rates (fast kon and koff). Therefore, we employed SwitchSENSE to investigate the association and dissociation rates of D2-IWT, D2-I3A, and D2-I3D with DNA. SwitchSENSE uses fluorescently-labelled dsDNA nanolevers that are attached to a gold surface and oscillate under an alternating electric field. When protein is flowed over the chip, the kinetics of DNA-protein interactions can be derived by monitoring changes in the DNA nanolever switching speed (Fig. 4b). To prevent complexities in data acquisition and interpretation due to D2-I sliding off a free DNA end16,22, we used a dsDNA nanolever that was immobilized to the chip on one end and had a stem-loop on the other end (Fig. 4b). The SwitchSENSE-derived DNA binding affinities were similar for all three complexes (Fig. 4b). In addition, all complexes displayed comparable kon and koff rates. The higher affinities measured on SwitchSENSE compared to EMSA could be due to differences in the DNA substrate: the DNA used in EMSA had free DNA ends whereas the ends were blocked in SwitchSENSE to prevent D2-I from sliding off22.
Together, phosphomimetic mutations do not substantially alter DNA binding of the D2-I complex under the in vitro conditions used here, even though they promote D2-I3D closure. In agreement, FANCI contributes the majority of DNA contacts and this DNA-binding surface does not substantially change between the open and closed states (Fig. 4c) or upon phosphorylation. FANCD2 may directly interact with DNA to stabilize closure of the clamp22,23, but this interaction does not seem to substantially alter the overall kinetics of DNA binding.
Phosphomimetic mutations promote closure of the D2-I clamp
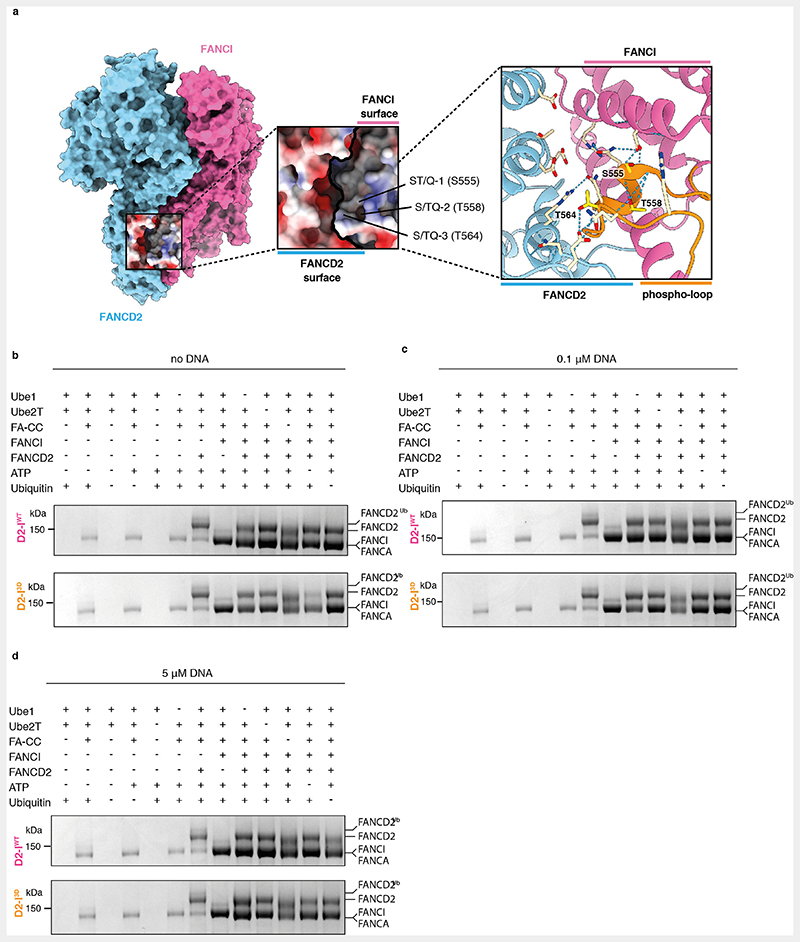
Since phosphomimetic mutations do not substantially affect DNA binding, we hypothesized that they stimulate monoubiquitination by promoting the closed state of the clamp, possibly through steric or charge-based repulsions at the heterodimerization interface (Extended Data Fig. 5a). This may destabilize the open state even in the absence of DNA.
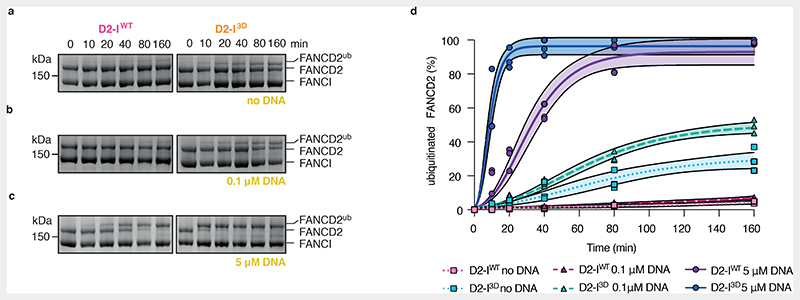
To determine how efficiently the FA core complex can access the target lysines of D2-IWT and D2-I3D (which are only accessible in the closed state), we performed ubiquitination assays in which DNA was either absent from the reaction or present at limiting concentrations (Fig. 5, Extended Data Fig. 5b). First, in the absence of DNA, D2-IWT was not efficiently monoubiquitinated: after >2 hours only ~5% was modified (Fig. 5a and d). This is consistent with D2-I monoubiquitination being largely dependent on the presence of DNA. Surprisingly, D2-I3D was monoubiquitinated in the absence of DNA at an ~10-fold faster rate than D2-IWT. Thus, D2-I3D closes more efficiently in solution than D2-IWT, in the absence of DNA.
Fig. 5. Phosphomimetic mutations result in exposure of target lysines in D2-I.
(a-c) Monoubiquitination assays of 2 μM D2-IWT and D2-I3D complexes performed in the absence of DNA (a), in the presence of 0.1 μM 44-bp dsDNA (b), or in the presence of 5 μM 44-bp dsDNA (c). FANCD2 ubiquitination was analyzed using SDS-PAGE and Coomassie staining. (d) Quantification of FANCD2 monoubiquitination assays shown in panels a-c. Data obtained from three independent assays were quantified as percentage of ubiquitinated FANCD2. Replicate data were fitted using a global non-linear regression function described in the Methods. Data points of each replicate (symbols), the corresponding mean (central solid line) and the 95% confidence interval (shaded area between dashed lines) are shown.
Addition of limiting concentrations of DNA (100 nM DNA, 20-fold less than the concentration of D2-I) increased the rate of D2-I3D, but not D2-IWT, monoubiquitination (Fig. 5b and d, Extended Data Fig. 5c) and D2-IWT was only substantially ubiquitinated when DNA was in excess (5 μM) (Fig. 5c and d, Extended Data Fig. 5d). Together, this suggests that D2-I3D closes more readily than D2-IWT, and DNA accelerates the rate of monoubiquitination by stabilizing the closed state.
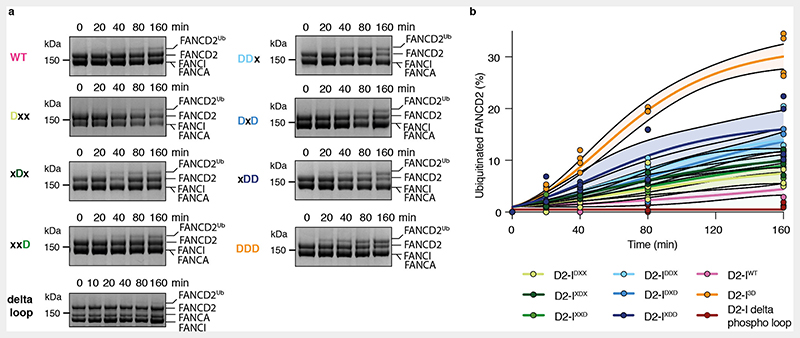
Interestingly, complexes with single or double phosphomimetic mutations are monoubiquitinated more efficiently in the absence of DNA than D2-IWT, but not as efficiently as D2-I3D (Extended Data Fig. 6), suggesting that the three phosphomimetic mutations have additive effects in destabilizing the open conformation of D2-I. Removal of the phospho-loop almost completely eliminates monoubiquitination in the absence of DNA (Extended Data Fig. 6). Together, these assays support a model where the bulky, charged phosphate groups destabilize open D2-I to promote the closed state, which is more efficiently ubiquitinated by the FA core complex.
The conformational equilibrium of D2-I is altered in D2-I3D
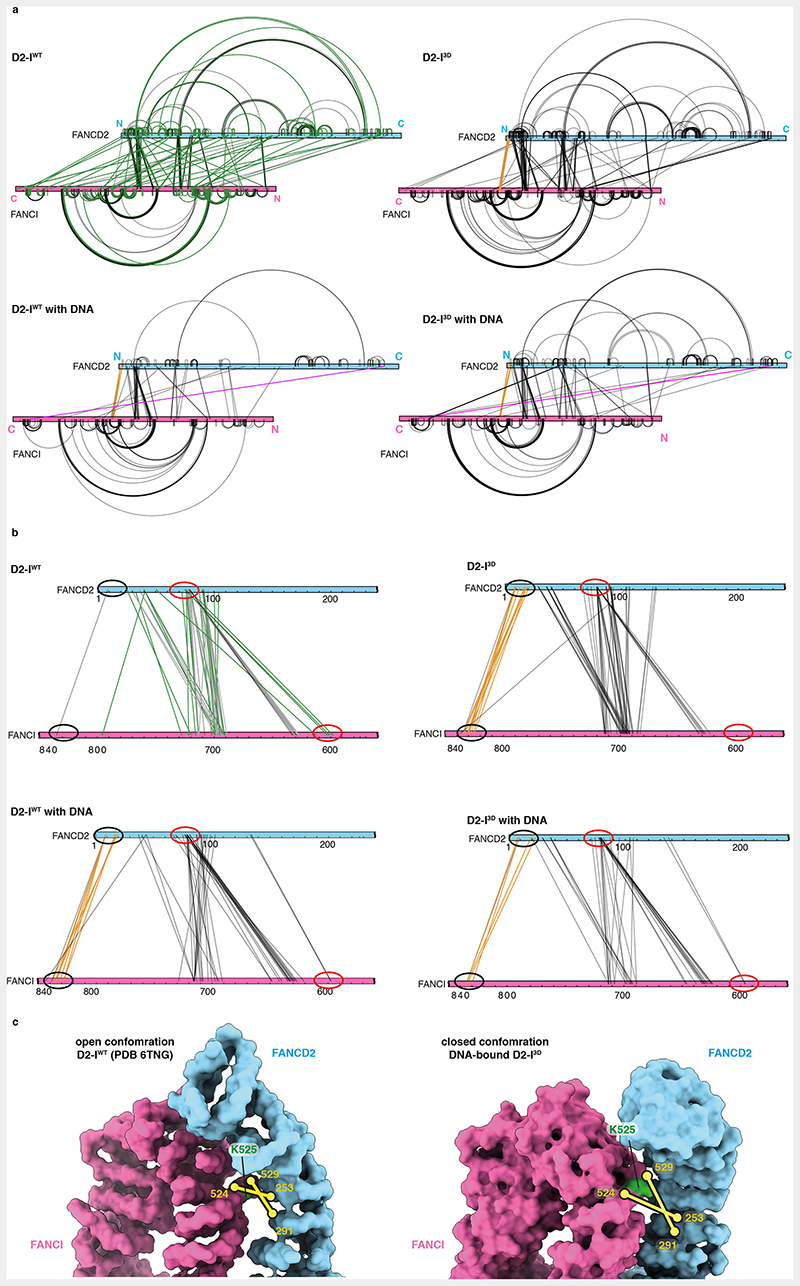
To further investigate the conformations that D2-IWT and D2-I3D adopt in solution, we employed quantitative crosslinking mass spectrometry. We used a short-lived, UV-activated heterobifunctional crosslinker, sulfosuccinimidyl 4,4’-azipentanoate (sulfo-SDA), to cross-link D2-IWT and D2-I3D, with and without DNA. This provided snapshots of the molecular interactions in each complex.
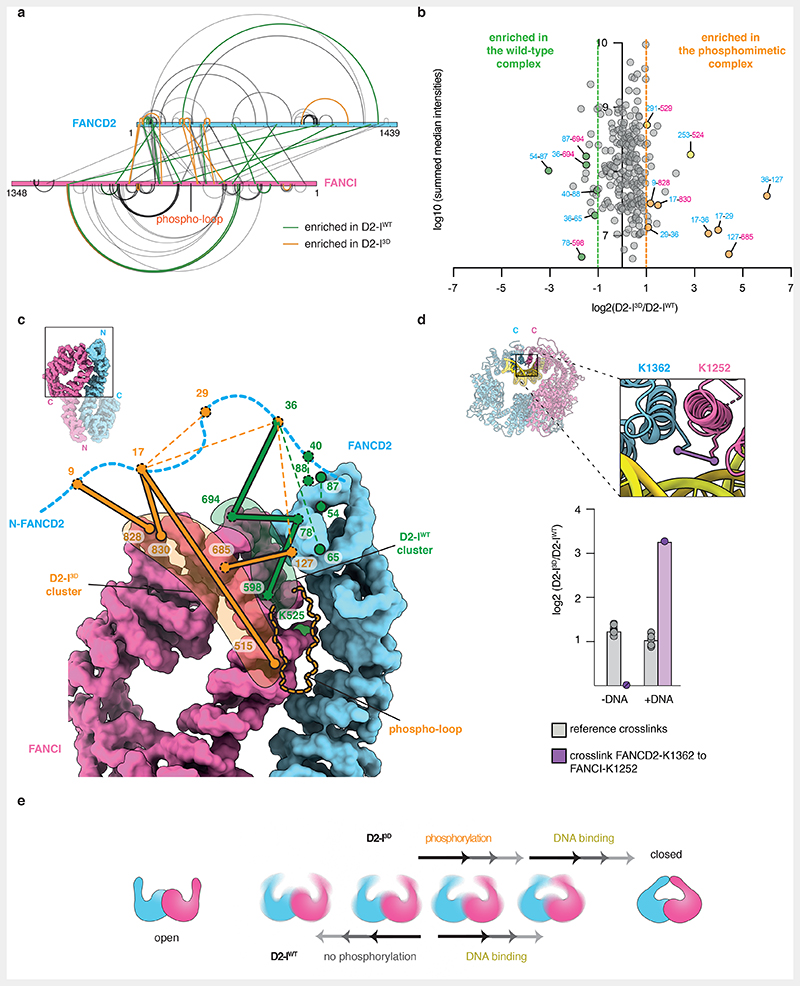
First, we plotted all crosslinks onto the amino acid sequences and compared D2-IWT and D2-I3D, both in the presence and absence of DNA. The crosslinking pattern (and potentially the conformational state) of DNA-free D2-I3D is more similar to both DNA-bound complexes, than to DNA-free D2-IWT (Extended Data Fig. 7a). Next, we quantified the crosslinks to perform a more detailed comparison of D2-IWT and D2-I3D in the absence of DNA (Fig. 6a and b). All quantified crosslinks were present in both samples, suggesting that both D2-I complexes can adopt similar conformations. However, the abundance of some crosslinks differed, suggesting that D2-IWT and D2-I3D preferentially populate different states, with distinct conformational equilibria.
Fig. 6. Local rearrangements at the heterodimerization interface promote closure of D2-I3D.
(a) Map of quantified crosslinks in mass spectrometry analysis of D2-IWT and D2-I3D (FANCD2-blue bar and FANCI-magenta bar). Crosslinks with a similar abundance in D2-IWT and D2-I3D (grey lines), crosslinks enriched by ≥two-fold in D2-IWT (green lines) and crosslinks enriched by ≥two-fold in D2-I3D (orange lines) are shown. (b) Plot of quantified crosslinks, where the log2 D2-I3D/D2-IWT signal ratios are plotted against the log10 summed median crosslink intensities. Vertical dashed lines mark the 2-fold enrichment threshold. Crosslinks that are consistent with different FANCD2 N-terminal region (NTR, residues 1-127) location in D2-IWT (green) and in D2-I3D (orange), as well as crosslinks enriched close to FANCI-K525 in D2-I3D (yellow) are highlighted. (c) Different clusters of crosslinks suggest that the FANCD2 NTR preferentially occupies alternate positions in D2-IWT (green lines) and D2-I3D (orange lines). Crosslinks are displayed on the surface representation of D2-IWT (PDB 6TNG). Intermolecular crosslinks are shown as thick solid lines and intramolecular crosslinks as thin dashed lines. Positions of the crosslinked residues are shown as circles (visible residues are encircled with a full line, residues that are not visible in the shown orientation or could not be modeled are encircled with a dashed line). The unstructured FANCD2 NTR (residues 1-47, blue dashed line) is shown to scale. (d) The crosslink of FANCI-K1251 to FANCD2-K1362 (purple line) is displayed on the cartoon representation of the DNA-bound D2-I3D model (inset). This crosslink was identified in both DNA-bound D2-IWT and DNA-bound D2-I3D samples, and quantified based on MS1 signal intensities (purple), but was not detected (N.D.) in samples in the absence of DNA. Ten other crosslinks that were quantified with similar signal intensities in DNA-free and DNA-bound D2-I complexes were used as a reference (grey). The means (bars) and all data points (circles) are shown. (e) The D2-I complex appears to be dynamic in solution and may adopt a range of conformations between the open and the closed form. Phosphorylation affects D2-I dynamics and shifts its conformational equilibrium from an open towards a closed conformation.
By focusing on crosslinks that showed at least a two-fold difference between D2-IWT and D2-I3D (Fig. 6b), we found that there are two major differences between these complexes. First, distinct clusters of crosslinks indicate that a partially disordered N-terminal region (NTR) of FANCD2 has different preferred locations in D2-IWT and D2-I3D. In D2-IWT, the FANCD2 NTR crosslinks to a patch on FANCI near the D2-I dimerization interface, close to the phospho-loop and FANCI-K525 (Fig. 6c, green, Extended Data Fig. 7b). These crosslinks are less prominent in D2-I3D, and instead, a different region of the FANCD2 NTR engages with a patch on FANCI that is more distal to the dimerization interface (Fig. 6c, orange, Extended Data Fig. 7b). Similar crosslinks to the distal patch were observed in both D2-IWT and D2-I3D samples prepared in the presence of DNA (Extended Data Fig. 7b). This suggests that phosphorylation and DNA binding have similar effects on D2-I, promoting the rearrangement of the NTR and preparing the complex for closure. In agreement, the entire N-terminal region of FANCD2 is in a different position relative to FANCI in open versus closed structures of D2-I (Extended Data Fig. 3e).
Second, specific crosslinks around the ubiquitination site of FANCI (FANCI-Q524 to FANCD2-S253 and FANCI-S529 to FANCD2-N291) are enriched in D2-I3D (Extended Data Fig. 7c). As these residues are occluded at the dimerization interface of D2-I in the open state, enrichment of these crosslinks suggests that this region is more accessible in D2-I3D. Together, these data suggest that there are localized rearrangements at the dimerization interface proximal to the phospho-loop that destabilize the open conformation of D2-I3D.
We also identified a crosslink between the C-terminal domains of FANCD2 and FANCI in both D2-IWT and D2-I3D prepared in the presence of DNA (Fig. 6d, Extended Data Fig. 7a). This crosslink can only be formed in the closed state, when the two C-terminal domains come into contact, suggesting that both D2-IWT and D2-I3D can close around DNA. The C-terminal domain crosslink is enriched by >3-fold in the phosphomimetic sample, suggesting that the closed state has a longer lifetime in D2-I3D than in D2-IWT.
In summary, our data imply that D2-I exists in an equilibrium between open and closed states, even in the absence of DNA. Phosphorylation, similar to DNA binding, changes the conformational equilibrium of the D2-I complex by destabilizing the open state and shifting the equilibrium towards the closed state (Fig. 6e).
Discussion
The activation and regulation of DNA repair pathways by DNA damage kinases ensures genome stability. The mechanistic basis of pathway activation by phosphorylation is largely unknown in many cases. Here we describe the mechanism for how monoubiquitination of D2-I is stimulated by ATR-phosphorylation to activate DNA crosslink repair. Phosphorylation destabilizes open D2-I, and promotes its closure around DNA. This exposes the target ubiquitination sites, thereby priming D2-I for monoubiquitination and consequent locking of the complex on DNA.
DNA binding was previously proposed to be the trigger that closes D2-I16,22,23. However, non-ubiquitinated D2-I was in the open state in all previous structures, even in the presence of DNA16,22. The FA core complex is additionally required to efficiently close unphosphorylated D2-I on DNA, with the FANCL subunit and Ube2T acting as a wedge that pries apart the heterodimerization interface23. Several experiments presented here suggest that the charges introduced by phosphorylation promote stable closure of the D2-I clamp on DNA, prior to FA core complex binding: 1) CryoEM shows that D2-I3D is closed on DNA, even in the absence of ubiquitination. Without DNA, D2-I3D adopts an open conformation in cryoEM. 2) Phosphomimetic mutations substantially increase the rate of D2-I ubiquitination in the absence of DNA. Since ubiquitination presumably only occurs on the closed conformation (which has the target lysine exposed), this implies that D2-I3D can close more efficiently than D2-IWT in solution. Closure in the absence of DNA may be transient (explaining why it was not observed in cryoEM) and/or may be stabilized by the FA core complex23. 3) Quantitative cross-linking mass spectrometry shows that D2-I3D shares distinct conformational features with the samples prepared in the presence of DNA. This suggests that local rearrangements in D2-I3D might destabilize its open conformation. Upon addition of DNA both the wild-type and the phosphomimetic complex can close around the DNA, but the phosphomimetic complex does so more efficiently than the wild-type. Together, our data indicate that D2-I exists in an equilibrium between the open and closed states in solution. We also suggest that phosphorylation destabilizes the open state, shifting the equilibrium towards the closed state, thereby altering the conformational dynamics of D2-I.
Overall, phosphorylation results in more efficient monoubiquitination, presumably because the FA core complex can engage with the already-closed complex in which the target lysine in FANCD2 is fully accessible. Since multiple phosphomimetic mutations have an additive effect on D2-I clamp closure, the number of phosphorylated sites may fine tune pathway activation and the ubiquitination efficiency of D2-I29,32.
The FANCI phospho-loop is located close to the FANCL binding site23. Hence, it is possible that FANCI phosphorylation, in addition to closing the clamp, also stimulates D2-I ubiquitination by affecting how FANCL and FANCI interact. Likewise, phosphorylation may affect how other FA proteins interact with ubiquitinated D2-I. For example, USP1-UAF1 interact less efficiently with phosphorylated D2-I18. Putative interactions with FA-associated nucleases, homologous recombination proteins, and translesion repair factors could similarly be influenced by D2-I phosphorylation status.
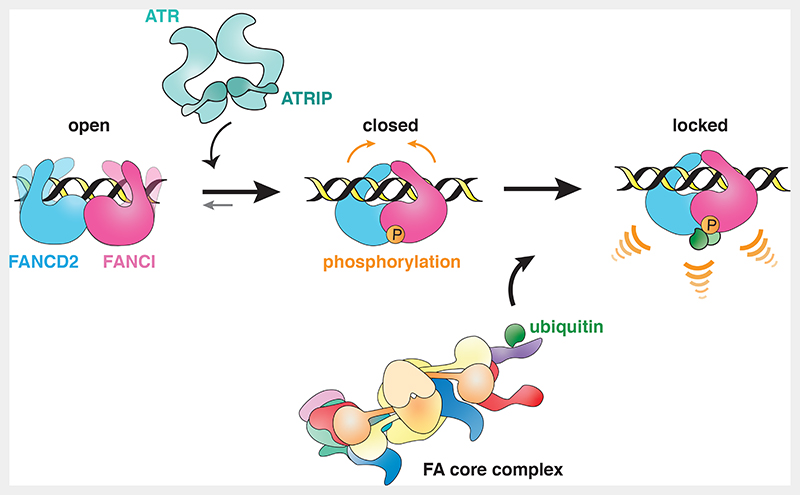
Altogether, we propose a model whereby D2-I can bind dsDNA, but the FA pathway is not efficiently activated unless ATR phosphorylates FANCI to promote D2-I closure (Fig. 7). Specific recruitment and activation of ATR at stalled replications forks could amplify the number of phosphorylated D2-I molecules and could thus be one of the factors that determines controlled activation of the FA-pathway, only in proximity to the DNA crosslink. We hypothesize that in cells, both phosphorylation and DNA binding can shift the equilibrium towards the closed state and both are required for stable closure of the D2-I complex and efficient ubiquitination. This coordination of DNA-binding and multiple post-translational modifications would enforce specificity and fidelity of timely FA pathway activation.
Fig. 7. Model of FA pathway activation through FANCI phosphorylation.
Unmodified D2-I can bind dsDNA, but does not close efficiently, and is thus not substantially ubiquitinated by the FA core complex (left). When an ICL is sensed, D2-I and ATR-ATRIP are recruited to the site of DNA damage. ATR-ATRIP phosphorylates FANCI and this allows the phosphorylated complex to stably close around dsDNA (middle). Target lysines on FANCD2 and FANCI are exposed in the closed state of the D2-I complex and are accessible to the FA core complex and Ube2T. Consequently, phosphorylation activates the pathway, since the closed phosphorylated D2-I complex is ubiquitinated faster and more efficiently. Ubiquitinated D2-I acts as a signal to recruit downstream DNA repair factors (right).
Materials and Methods
Cloning and baculovirus-insect cell expression
To generate FANCI constructs encoding different phospho-loop mutations, full-length, wild-type Gallus gallus FANCI with a C-terminal 6xHis-tag in a pACEBac backbone16 was linearized via PCR, then a 130 bp sequence (gBlocks, IDT) containing the respective phospho-variant sequences was inserted using Gibson assembly. To clone the delta phospho-loop construct, residues 555-582 of FANCI were deleted via PCR. Plasmid sequences were confirmed by Sanger sequencing (Source BioScience). Sequences of all primers and gBlocks are listed in Supplementary Table 1.
Bacmid DNAs of all proteins used in this study were prepared as previously described16,20. Transfections were carried out with 10 μg of freshly prepared bacmid DNA using FuGene (Promega) to transfect 2 ml Sf9 insect cells (Sf9, Oxford Expression Technologies Ltd, Cat No. 600100) at 0.5 million cells/ml. Viruses were propagated twice and used for a large-scale expression to infect Sf9 insect cells (2 million cells/ml) at a 1:100 v/v ratio. Cell growth, viability and fluorescence were monitored, and cells were harvested at 90% viability (typically 3-4 days post-infection).
Protein purification
Protein purification of the FA core complex, FANCD2 and all FANCI constructs was carried out as previously described16,20 with minor modifications.
FA core complex purification
To prepare the FA core complex, cell pellets were resuspended in lysis buffer (100 mM HEPES pH 8.0, 300 mM NaCl, 5% w/v glycerol, 1 mM TCEP, EDTA-free protease inhibitor tablets (cOmplete, Roche), 5 mM benzamidine hydrochloride, 100 μM PMSF and 100 U/ml benzonase), sonicated and the lysate was clarified by ultracentrifugation. Supernatant was incubated for 1h at 4 °C with Strep-Tactin Sepharose High Performance resin (Cytiva), equilibrated in lysis buffer. Beads were transferred into a gravity flow column, washed with lysis buffer (equal volume as supernatant), and eluted with 40 ml of lysis buffer containing 8 mM D-desthiobiotin. The eluate was diluted 1:1 with Heparin buffer A (50 mM HEPES pH 8.0, 1 mM TCEP) and loaded onto a 1 ml HiTrap Heparin HP column (Cytiva). The column was washed with 10 column volumes (CV) 10% Heparin buffer B (50 mM HEPES pH 8.0, 1 M NaCl, 1 mM TCEP), and eluted with a linear gradient from 10-100% of Heparin buffer B over 33 CV. Fractions containing the FA core complex were pooled, concentrated using a 10 kDa MWCO VivaSpin concentrator, flash frozen and stored at -80 °C.
FANCD2 purification
To obtain 2xStrepII-tagged FANCD2, lysis, Strep-Tactin (IBA) and Heparin (HiTrap Heparin HP 5 ml) purification were carried out as described above. FANCD2 containing fractions were pooled, concentrated using a 30 kDa MWCO VivaSpin concentrator and loaded onto a Superdex 200 26/60 column (Cytiva) equilibrated in gel filtration buffer (50 mM HEPES pH 8.0, 150 mM NaCl, 1 mM TCEP). Peak fractions containing StrepII-tagged FANCD2 were pooled, concentrated using a 30 kDa MWCO VivaSpin concentrator, flash frozen and stored at -80 °C.
FANCI purification
Cells were lysed as described above and clarified by centrifugation. The supernatant was loaded onto a 5 ml HisTrap FP column (Cytiva) equilibrated in 5% His buffer B (50 mM HEPES pH 8.0, 150 mM NaCl, 500 mM imidazole, 1 mM TCEP). The column was first washed with 10 CV 5% His Buffer B, followed by a 4 CV linear gradient from 5-23.5% His buffer B. FANCI was eluted with a 16 CV linear gradient from 23.5-60% His buffer B. Eluted protein was diluted 1:1 with Heparin buffer A, loaded onto a 5 ml HiTrap Heparin HP affinity column (Cytiva) equilibrated in 15% Heparin buffer B, washed with 10 CV of 10 % Heparin buffer B and eluted with a 33 CV gradient from 10-100% Heparin buffer B. Fractions containing FANCI were pooled, concentrated using a 30 kDa MWCO VivaSpin concentrator and loaded onto a Superdex S200 26/60 column (Cytiva) equilibrated in gel filtration buffer. Peak fractions were pooled, concentrated using a 30 kDa MWCO VivaSpin concentrator, flash frozen and stored at -80 °C. Subsequent mass spectrometry analysis of purified wild-type FANCI confirmed that residues S558, S561 and T567 in the phospho-loop were not phosphorylated to a level detectable by mass spectrometry. All FANCI variants were purified using the same protocol described above.
Preparation of hsUbe2Tv4, hsFANCL109-375
For cryoEM studies, optimized versions of E2 (hsUbe2Tv4) and E3 (hsFANCL109-375) were used to prepare ubD2-I3D, to allow complete separation of ubD2-I3D from the remaining monoubiquitination reaction components via gel filtration. Genes encoding human (hs) Ube2Tv4 with an N-terminal 6xHis-tag followed by a 3C protease cleavage site and hsFANCL109-375 with an N-terminal 6xHis and SUMO tag followed by a 3C protease cleavage site were synthesized and cloned into a pET24a vector (GeneArt). Expression and purification of hsUbe2Tv4 and hsFANCL109-375 were carried out as previously described33, with the following modification. To elute proteins from Ni-NTA agarose resin (Qiagen), beads were washed with 10 CV and then resuspended in 3 CV of 3C cleavage buffer (100 mM Tris pH 8.0, 300 mM NaCl, 0.4 mM TCEP, 5% v/v glycerol). 3C protease was added (1:100 of protease to protein of interest) and
allowed to cleave the bead-bound protein at 4 °C for 18 h. Pure proteins were concentrated using a 10 kDa MWCO VivaSpin concentrator, flash frozen and stored at -80 °C.
In vitro monoubiquitination assays
For ubiquitination assays, we used a 1x master mix containing 75 nM E1 enzyme (BostonBiochem), 1 μM E2 (ggUbe2T)24, 0.5 μM E3 (FA core complex), 2 μM FANCD2 and either 5 μM, 100 nM or no 44-bp dsDNA. Reactions were set up by mixing the master mix with 2 μM FANCI in ubiquitination buffer (50 mM HEPES pH 7.5, 64 mM NaCl, 4% v/v glycerol, 5 mM MgCl2, 2 mM ATP, 0.5 mM DTT)16,20. All reactions were prepared on ice and started by addition of HA-ubiquitin (BostonBiochem) at a final concentration of 10 μM. Reactions were incubated at 30 °C in a final volume of 10 μl. Ubiquitination was stopped after the indicated times by addition of 3.5 μl of NuPAGE 4x LDS sample buffer and incubation at 70 °C for 5 minutes. Samples (3 μl) were analyzed using 3-8% NuPAGE Tris-acetate gels (Invitrogen) and Coomassie InstantBlue staining (Abcam). To perform western blots, samples (1.5 μl) were resolved as above and transferred onto a Trans-Blot Turbo Mini Nitrocellulose Transfer membrane (BioRad) using a Trans-Blot Turbo Transfer System (BioRad). The membrane was blocked at room temperature for 1 h with 5% milk dissolved in TBS-T buffer then incubated with primary HRP-conjugated anti-HA antibody at 1:4000 dilution (Santa Cruz Biotechnology) in TBS-T containing 2.5% milk overnight at 4° C. The membrane was washed three times with TBS-T, and protein was detected using Pierce™ ECL Western Blotting Substrate (ThermoFisher Scientific). All SDS-PAGE gels and Western blots were imaged using the Gel Doc XR+ system (Bio-Rad).
All assays were performed independently three times. To calculate total FANCD2, densitometry of SDS-PAGE bands of unmodified and ubiquitinated FANCD2 were carried out in ImageJ (version 2.1.0/1.53c). These values were used to determine the % of ubiquitinated FANCD2 at each time point for all replicates. Data were imported into Prism (version 9.1.0, GraphPad Software Inc) and fitted with a global non-linear regression using a modified Gompertz formula:
where Ym (value between 0 and 100) and k (value greater than 0) were restrained. This results in a sigmoidal curve with an assumption that the growth is slowest when the reaction is initiated (i.e. when ubiquitin is added), and at the end, when availability of the non-ubiquitinated substrate is limiting. The sigmoid reaches the end-point asymptote more gradually than the start-point asymptote. This formula is justified, given the need to accumulate ubiquitin-charged E2 before substrate can be modified. Data points of each replicate and the fitted curves were plotted in Prism.
CryoEM sample preparation
To prepare the D2-I3D complex, 1.5 μM FANCD2 and 1.5 μM FANCI3D were mixed in assay buffer (50 mM HEPES pH 8.0, 150 mM NaCl, 1 mM TCEP) and incubated for 1 h at 4 °C. DNA-bound D2-I3D was prepared by incubating 1.5 μM FANCD2, 1.5 μM FANCI3D and 3.75 μM of 44-bp dsDNA in assay buffer on ice for 1 h. To prepare DNA-bound ubD2-I3D, a 1x master mix containing 50 nM E1 enzyme (BostonBiochem), 3 μM E2 (hsUbe2Tv4), 3 μM E3 (hsFANCL109-375), 8 μM 44-bp dsDNA and 10 μM 6xHis-tagged ubiquitin (BostonBiochem) was mixed with 3 μM FANCD2 and 3 μM FANCI3D in ubiquitination buffer (50 mM HEPES pH 7.5, 64 mM NaCl, 4% v/v glycerol, 5 mM MgCl2, 2 mM ATP, 0.5 mM DTT) in a final volume of 150 μl. After incubation at 30 °C for 90 minutes, the monoubiquitination reaction was concentrated using a 30 kDa MWCO VivaSpin concentrator and loaded onto a Superose 6 3.2/300 column (Cytiva) equilibrated in modified gel filtration buffer (50 mM HEPES pH 8.0, 150 mM NaCl, 1 mM TCEP, 100 mM imidazole). Fractions were analyzed using SDS-PAGE and the peak fraction (260/280 ratio = 1.27) containing DNA-bound ubiquitinated D2-I was immediately used for cryoEM grid preparation.
CryoEM grids were prepared by applying 3.5 μl of sample onto a plasma-cleaned R0.6/1 UltrAuFoil grid (Quantifoil)34, blotting the grid at forces of -10 or -15 for either 3 or 4.5 seconds at 4 °C and plunge freezing the grid in liquid ethane using a Vitrobot Mark IV (ThermoFisher) at 4 °C and 100 % humidity.
CryoEM data collection
Grids of the D2-I3D complex were imaged on Titan Krios 1 at MRC-LMB operated at 300 keV using a Falcon3EC detector in electron counting mode. 1,845 movies were collected at a pixel size of 1.04 Å/pixel, with a total dose of 40 e/Å2 and a defocus range spanning -1.5 to -3.0 μm in 0.2 μm steps.
Grids of the DNA-bound D2-I3D complex were imaged on Titan Krios 3 at MRC-LMB operated at 300 keV using a K3 detector in electron counting mode. 14,842 movies were collected at a pixel size of 0.86 Å/pixel, with a total dose of 40.7 e/Å2 and a defocus range spanning -1.5 to -3.0 μm in 0.2 μm steps.
Grids of the ubD2-I3D complex were imaged on Titan Krios 1 at MRC-LMB operated at 300 keV using a K3 detector in electron counting mode. 6,515 movies were collected at a pixel size of 1.145 Å/pixel, with a total dose of 40.1 e/Å2 and a defocus range spanning from -1.5 to - 3.0 μm in 0.2 μm steps.
CryoEM data processing
A general data processing strategy employed for all datasets is described below and additional information regarding each of the three datasets can be found in Table 1 and Extended Data Fig. S2.
Multi-frame movies were imported into Relion3.135, motion correction was performed using 5x5 patches in MotionCorr236, and defocus was estimated using CTFFIND4.137, both implemented in Relion3.1. Particles were manually picked using crYOLO38 from 10 random micrographs and used to train a particle picking model to perform automated particle picking of the full dataset. Particle extraction was performed using a binning factor of 2 in Relion3.1 with crYOLO generated boxes. Extracted particles were subjected to several rounds of 2D classification, to exclude particles which resulted in poor 2D class averages.
An initial model generated in Relion3.1 was used as a reference to generate a soft mask and perform an initial 3D refinement. All subsequent 3D refinement and 3D classification steps were performed using a soft mask. The refined map was used for 3D classification into 4 classes. Selected classes were subjected to another round of 3D refinement followed by 3D classification. Selected particles were re-extracted with their original pixel size, followed by another 3D refinement.
The resulting map was subjected to two rounds of CTF refinement and Bayesian polishing. To further improve the consensus map, 3D classification without image alignment using a high T value was used. The class with best internal features was selected and used for 3D refinement to obtain the final consensus map. For DNA-bound D2-I3D, signal subtraction and 3D refinements were used to generate improved maps of FANCD2, FANCI and FANCI with DNA, to aid with map interpretation and model building. Postprocessing was performed in Relion3.1 to generate the final FSC curves using a cutoff value of 0.143. Directional FSC and sphericity values for the maps were generated using the 3DFSC server (https://3dfsc.salk.edu/)39.
Model building
To analyze the overall conformation of D2-I3D and ubD2-I3D, published models of Gallus gallus D2-I (PDB 6TNG) and ubD2-I (PDB 6TNF)16 were rigid body fitted into the map of D2-I3D and ubD2-I3D, respectively. Since no notable differences were identified and because the maps were not high resolution, these models were not processed further.
To build a model of DNA-bound D2-I3D, ubiquitin and DNA (chains C, D and E) were removed from ubD2-I (PDB 6TNF) and the remaining chains were rigid body fitted into the DNA-bound D2-I3D map using Phenix (PHENIX version 1.19)40. Models were manually inspected, adjusted, and built in COOT41,42 (implemented in CCP4 version 1.5.0). To aid model building of different regions, the following maps were used: refined consensus map, postprocessed consensus map, postprocessed focused map of FANCD2, postprocessed focused map of FANCI, postprocessed focused map of FANCI with DNA, DeepEMhancer43 map (tight model was used) and a map obtained by performing local anisotropic sharpening in Phenix. Human ubD2-I (PDB 6VAE)22 as well models of the chicken FANCD2 and FANCI generated in AlphaFold44 were also used to facilitate later stages of model building.
For the model of DNA, an idealized 29-bp model of B-form dsDNA (http://www.scfbio-iitd.res.in/software/drugdesign/bdna.jsp#) was rigid body fitted into the corresponding density in Chimera45. It was then bent to follow the curvature of the DNA density in ChimeraX46 (version 1.1.1) using ISOLDE47 while applying restrains to preserve the DNA geometry. The model was then subjected to DNA-restrained refinement in Phenix Real Space Refine. A DNA containing base pairs was used for refinement to preserve the DNA geometry by employing stacking and base pair restraints of a B-form dsDNA. Base pairs were removed in the deposited model because the DNA register could not be confidently assigned and the bases could not be accurately positioned. Importantly, there is also likely heterogeneity in the bound DNA due to a mixture of different positions, curvatures and registers that the DNA assumes in the clamp. This is likely a result of D2-I sliding on DNA and binding dsDNA in a sequence-independent manner.
Cryo-EM validation and EMRinger48 score implemented in Phenix were calculated on the final map. Map-model correlation coefficients were derived for: 1) the DNA-D2-I3D model and the composite map, and 2) the D2-I3D complex (from which DNA has been removed) and a composite map in which the signal subtracted and refined FANCD2 and FANCI were combined. Models and maps were visualized in ChimeraX (version 1.1.1) to perform analysis (surface contact analysis and alignments) and structural comparison to D2-I (PDB 6TNG) and ubD2-I (PDB 6TNF). ChimeraX (version 1.1.1) was used to color the surface of the DNA-bound D2-I3D map based on local resolution parameters obtained from Relion3.1.
Electrophoretic mobility shift assays (EMSAs)
EMSAs were carried out as described before16. To prepare the 44-bp dsDNA, oligonucleotides 44-P1/36-FAM/ and 44-P7 (Supplementary Table 1) were purchased from IDT, mixed at an equimolar ratio, incubated at 95 °C for 10 minutes and left to reach room temperature for approximately 3 h. 20 μl reactions were prepared with 20 nM FAM-labeled 44-bp dsDNA and a dilution series of D2-IWT, D2-I3D or D2-I3A (0, 30, 60, 120, 240, or 480 nM) in assay buffer (50 mM HEPES pH 8.0, 1 mM TCEP and either 75, 150, 200, 300, 400 or 500 mM NaCl). Samples were incubated at 22 °C for 30 minutes, and a 5 μl aliquot was loaded on a native 6% DNA retardation gel (Invitrogen). Gels were run in a 0.5X TBE buffer at 4 °C for 60 minutes and were scanned and visualized with a Typhoon Imaging System (GE Healthcare). All assays were performed at least three times. Densitometry was performed in ImageJ (version 2.1.0/1.53c) to calculate quantities of free and D2-I bound DNA. Replicates of each assay were plotted as percentage of free DNA at each protein concentration using Prism (version 9.1.0, GraphPad Software Inc) and fitted with global non-linear regression using a one-phase decay formula:
where Y0 (free DNA when no protein was added) was restricted to 100%.
SwitchSENSE
The interactions of D2-IWT, D2-I3D or D2-I3A with dsDNA were analyzed on a DRX2 instrument (Dynamic Biosensors GmbH) using a MPC2-48-2-G1R1-S chip equilibrated with SwitchSENSE buffer (20 mM HEPES pH 8.0, 75 mM NaCl, 1 mM TCEP) at 20 °C.
100 μM of cNLA-stem16 (Merck) or cNLB-stem16 (Merck) were heated to 95 °C for 5 minutes and cooled at 2°C/min to allow hairpin formation. cNLA-stem16 or cNLB-stem16 were annealed to DNA strands attached on the chip surface (NLA and NLB, respectively) by flowing 500 nM oligonucleotide over the chip for 4 minutes in 20 mM HEPES pH 7.4, 40 mM NaCl and 0.001% w/v Tween-20. As a result, 48-bp dsDNA nanolevers with a 16-bp single-stranded loop stabilized by G/C sequences at the end of the complementary sequence and at the 5’ end were formed. A protein 1:2 dilution series (50 nM protein was the highest used concentration) was injected at 50 μl/min for 10 min. The surface was regenerated after each cycle by dissociation and hybridization to form new dsDNA nanolevers. After the highest protein concentration in the dilution series was injected, we measured dissociation in running buffer for 95 minutes at 50 μl/min. Dynamic switching data were analyzed using the supplied SwitchBUILD software using a 1:1 kinetic model to give values for the association rate constant, kon, dissociation rate constant, koff and to calculate the kinetic dissociation constant Kd = koff /kon. Data and fits were plotted in Prism (version 9.2.0, GraphPad Software Inc).
Crosslinking mass spectrometry sample preparation and analysis
Sulfo-SDA (sulfosuccinimidyl 4,4’-azipentanoate) (Thermo Scientific Pierce) was dissolved freshly in assay buffer (50 mM HEPES pH 8.0, 150 mM NaCl, 1 mM TCEP) to a final concentration of 1 mg/ml. To prepare D2-IWT and D2-I3D, 3.15 μM of FANCD2 was incubated with either 3.15 μM FANCIWT or 3.15 μM FANCI3D in assay buffer at 4 °C for 30 minutes. D2-I complexes with DNA were prepared using the same conditions but in the presence of 7.87 μM 44-bp dsDNA. Crosslinking reactions were performed in triplicate by incubating 0.5 mg/ml D2-IWT or D2-I3D complexes, in the presence or absence of DNA, with 0.5 mg/ml Sulfo-SDA in a final volume of 50 μl at 4 °C for 30 minutes. To activate sulfo-SDA, the samples were irradiated with an UV lamp at 356 nm on ice for 20 minutes. Crosslinked samples were analyzed on a 3-8% NuPAGE Tris-acetate gel (Invitrogen) and gel bands corresponding to the crosslinked D2-I heterodimer were excised and digested as previously described49. Briefly, gel bands were cut into 1 mm cubes, disulfide bonds were reduced with 10 mM DTT at 37 °C for 30 minutes and the free -SH groups were alkylated with 55 mM iodoacetamide at 23 °C for 20 minutes in the dark. Subsequently, proteins were digested with trypsin in 45 mM ammonium bicarbonate, 10% acetonitrile with a protein to trypsin mass ratio of 50:1. The digestion reaction was incubated at 37 °C for 15 hours. The resulting peptides were extracted from the gel pieces and desalted using C18 StageTips50. Peptides were eluted from StageTips using 80% acetonitrile, 0.1% trifluoroacetic acid and solvent was removed by centrifugation in a SpeedVac vacuum concentration (ThermoFisher Scientific). For LC-MS/MS analysis, peptides were resuspended with 1.6% acetonitrile, 0.1% formic acid. 1 μg peptide were injected for each acquisition.
LC-MS/MS analysis was performed using an Orbitrap Fusion Lumos Tribrid mass spectrometer (Thermo Fisher Scientific), connected to an Ultimate 3000 RSLCnano system (Dionex, Thermo Fisher Scientific). Peptides were injected onto a 50-centimetre EASY-Spray C18 LC column (Thermo Scientific) that was operated at 45 °C column temperature. Mobile phase A consisted of water, 0.1% v/v formic acid and mobile phase B of 80% v/v acetonitrile and 0.1% v/v formic acid. Peptides were loaded and separated at a flowrate of 0.3 μl/min. Peptides were separated by a series of linear gradients: first by applying a gradient from 2% to 4% B in 1 minute, then from 4% to 40% B in 134 minutes, and finally from 40% to 95% B in 15 minutes. Eluted peptides were ionized by an EASY-Spray source (Thermo Scientific) and introduced directly into the mass spectrometer.
The MS data was acquired in the data-dependent mode with the top-speed option. For each three-second acquisition cycle, the full scan mass spectrum was recorded in the Orbitrap with a resolution of 120,000. Ions with a charge state from 3+ to 7+ were isolated and fragmented using higher-energy collisional dissociation (HCD) with 30% collision energy. Fragmentation spectra were then recorded in the Orbitrap with a resolution of 50,000. Dynamic exclusion was enabled with single repeat count and 60 seconds exclusion duration.
MS2 peak lists were generated from the raw mass spectrometric data files using the MSConvert module in ProteoWizard (version 3.0.11729). Default parameters were applied. Precursor and fragment m/z values were recalibrated. Identification of crosslinked peptides was carried out using xiSEARCH software (https://www.rappsilberlab.org/software/xisearch) (version 1.7.6)51. Lists of peaks were searched against the cognate protein sequences. Reversed protein sequences were used as decoys during the search for error estimation. Search results were filtered using xiFDR52. A false discovery rate of 3% on residue-pair level was applied with “boost between” option selected.
MS1 extracted chromatogram (XIC) based label free quantitation of crosslinks were carried out using Skyline as previously described53. In short, the sequences of crosslinked peptides were linearized and a Skyline input file (in .ssl format) was generated using an in-house script. MS1 signal intensities of each crosslinked peptide were measured by Skyline and normalized within each replica. Crosslinked residue pairs were calculated as a sum of signal intensity of all supporting crosslinked peptides and were used for sample comparison. Log2 (D2-I3D/ D2-IWT) ratios were calculated using Perseus. A list of identified/quantified crosslinked residue pairs is reported in Supplementary Table 2.
Statistics and Reproducibility
Details on study design, statistical analysis and reproducibility for individual assays are included within the corresponding Methods section as well as in the main and extended data figure legends. No statistical methods were used to predetermine sample size. No data were excluded from analysis. The experiments were not randomized. The Investigators were not blinded to allocation during experiments and outcome assessment. Additional information on sample size, reproducibility, blinding and randomization is provided in the reporting summary.
Extended Data
ED_Fig_1.
ED_Fig_2.
ED_Fig_3.
ED_Fig_4.
ED_Fig_5.
ED_Fig_6.
ED_Fig_7.
Supplementary Material
Acknowledgments
We are grateful to C. Johnson, K. Nguyen, R. Williams, K.J. Patel and members of the Passmore lab for assistance and advice; the MRC Laboratory of Molecular Biology (MRC LMB) Electron Microscopy Facility for access and support of electron microscopy sample preparation and data collection; J. Rodriguez Molina and V. Chandrasekaran (MRC LMB) for assisting with cryoEM data collection; J. Grimmett and T. Darling (MRC LMB scientific computation); and J.G. Shi (MRC LMB baculovirus) for support. We acknowledge Diamond Light Source for access to eBIC (proposal BI23268) funded by the Wellcome Trust, MRC and Biotechnology and Biological Sciences Research Council. This work was supported by the Medical Research Council, as part of United Kingdom Research and Innovation, MRC file reference number MC_U105192715 (L.A.P.); a PhD studentship from the Cambridge Trust (T.S.); an EMBO Long-Term Fellowship, grant ALTF 692-2018 (P.A.); and the Deutsche Forschungsgemeinschaft (DFG, German Research Foundation) grant no. 329673113 (J.R.). The Wellcome Centre for Cell Biology is supported by core funding from the Wellcome Trust grant no. 203149 (J.R.).
Footnotes
Author contributions
T.S., P.A. and S.S. designed protein purification schemes, and expressed and purified proteins. T.S. generated constructs, carried out ubiquitination assays and together with S.H.M. performed DNA binding studies. T.S. prepared samples for cryoEM and collected data with S.S. T.S. and P.A. processed cryoEM data. Z.A.C. and J.R. performed cross linking MS analysis. L.A.P. supervised the research. T.S. and L.A.P. wrote the manuscript, with contributions from all authors.
Competing interests
L.A.P. is an inventor on a patent filed by the Medical Research Council for all-gold EM supports, licensed to Quantifoil under the trademark UltrAuFoil. The remaining authors declare no competing interests.
Data availability
CryoEM maps have been deposited in the Electron Microscopy Data Base (EMDB) with the following accession codes: EMD-15102 (D2-I3D), EMD-15101 (DNA-D2-I3D), EMD-15103 (DNA-ubD2-I3D). Atomic coordinates of DNA-D2-I3D have been deposited in the Protein Data Bank (PDB) with the accession code PDB 8A2Q. MS data have been deposited in jPOST (project ID JPST001474, PRIDE ID: PXD031632)54. All other data are available in the main text, as a part of the Extended Data, supplementary materials or Source data files. Original gel, blot images and numerical data used to generate plots are provided in Source data. Correspondence and requests for materials should be addressed to L.A.P. All unique materials are available upon request with completion of a standard Materials Transfer Agreement.
References
- 1.Knipscheer P, et al. The Fanconi anemia pathway promotes replication-dependent DNA interstrand cross-link repair. Science. 2009;326:1698–701. doi: 10.1126/science.1182372. [DOI] [PMC free article] [PubMed] [Google Scholar]
- 2.Raschle M, et al. Mechanism of replication-coupled DNA interstrand crosslink repair. Cell. 2008;134:969–80. doi: 10.1016/j.cell.2008.08.030. [DOI] [PMC free article] [PubMed] [Google Scholar]
- 3.Semlow DR, Walter JC. Mechanisms of Vertebrate DNA Interstrand Cross-Link Repair. Annu Rev Biochem. 2021;90:107–135. doi: 10.1146/annurev-biochem-080320-112510. [DOI] [PubMed] [Google Scholar]
- 4.Crossan GP, Patel KJ. The Fanconi anaemia pathway orchestrates incisions at sites of crosslinked DNA. J Pathol. 2012;226:326–37. doi: 10.1002/path.3002. [DOI] [PubMed] [Google Scholar]
- 5.Walden H, Deans AJ. The Fanconi anemia DNA repair pathway: structural and functional insights into a complex disorder. Annu Rev Biophys. 2014;43:257–78. doi: 10.1146/annurev-biophys-051013-022737. [DOI] [PubMed] [Google Scholar]
- 6.Alpi A, et al. UBE2T, the Fanconi anemia core complex, and FANCD2 are recruited independently to chromatin: a basis for the regulation of FANCD2 monoubiquitination. Mol Cell Biol. 2007;27:8421–30. doi: 10.1128/MCB.00504-07. [DOI] [PMC free article] [PubMed] [Google Scholar]
- 7.Garcia-Higuera I, et al. Interaction of the Fanconi anemia proteins and BRCA1 in a common pathway. Mol Cell. 2001;7:249–62. doi: 10.1016/s1097-2765(01)00173-3. [DOI] [PubMed] [Google Scholar]
- 8.Machida YJ, et al. UBE2T is the E2 in the Fanconi anemia pathway and undergoes negative autoregulation. Mol Cell. 2006;23:589–96. doi: 10.1016/j.molcel.2006.06.024. [DOI] [PubMed] [Google Scholar]
- 9.Meetei AR, et al. A novel ubiquitin ligase is deficient in Fanconi anemia. Nat Genet. 2003;35:165–70. doi: 10.1038/ng1241. [DOI] [PubMed] [Google Scholar]
- 10.Smogorzewska A, et al. Identification of the FANCI protein, a monoubiquitinated FANCD2 paralog required for DNA repair. Cell. 2007;129:289–301. doi: 10.1016/j.cell.2007.03.009. [DOI] [PMC free article] [PubMed] [Google Scholar]
- 11.Klein Douwel D, et al. XPF-ERCC1 acts in Unhooking DNA interstrand crosslinks in cooperation with FANCD2 and FANCP/SLX4. Mol Cell. 2014;54:460–71. doi: 10.1016/j.molcel.2014.03.015. [DOI] [PMC free article] [PubMed] [Google Scholar]
- 12.Taniguchi T, et al. S-phase-specific interaction of the Fanconi anemia protein, FANCD2, with BRCA1 and RAD51. Blood. 2002;100:2414–20. doi: 10.1182/blood-2002-01-0278. [DOI] [PubMed] [Google Scholar]
- 13.Kim JM, et al. Inactivation of murine Usp1 results in genomic instability and a Fanconi anemia phenotype. Dev Cell. 2009;16:314–20. doi: 10.1016/j.devcel.2009.01.001. [DOI] [PMC free article] [PubMed] [Google Scholar]
- 14.Nijman SM, et al. The deubiquitinating enzyme USP1 regulates the Fanconi anemia pathway. Mol Cell. 2005;17:331–9. doi: 10.1016/j.molcel.2005.01.008. [DOI] [PubMed] [Google Scholar]
- 15.Oestergaard VH, et al. Deubiquitination of FANCD2 is required for DNA crosslink repair. Mol Cell. 2007;28:798–809. doi: 10.1016/j.molcel.2007.09.020. [DOI] [PMC free article] [PubMed] [Google Scholar]
- 16.Alcon P, et al. FANCD2-FANCI is a clamp stabilized on DNA by monoubiquitination of FANCD2 during DNA repair. Nat Struct Mol Biol. 2020;27:240–248. doi: 10.1038/s41594-020-0380-1. [DOI] [PMC free article] [PubMed] [Google Scholar]
- 17.Joo W, et al. Structure of the FANCI-FANCD2 complex: insights into the Fanconi anemia DNA repair pathway. Science. 2011;333:312–6. doi: 10.1126/science.1205805. [DOI] [PMC free article] [PubMed] [Google Scholar]
- 18.Rennie ML, Arkinson C, Chaugule VK, Toth R, Walden H. Structural basis of FANCD2 deubiquitination by USP1-UAF1. Nat Struct Mol Biol. 2021;28:356–364. doi: 10.1038/s41594-021-00576-8. [DOI] [PubMed] [Google Scholar]
- 19.Rennie ML, et al. Differential functions of FANCI and FANCD2 ubiquitination stabilize ID2 complex on DNA. EMBO Rep. 2020;21:e50133. doi: 10.15252/embr.202050133. [DOI] [PMC free article] [PubMed] [Google Scholar]
- 20.Shakeel S, et al. Structure of the Fanconi anaemia monoubiquitin ligase complex. Nature. 2019;575:234–237. doi: 10.1038/s41586-019-1703-4. [DOI] [PMC free article] [PubMed] [Google Scholar]
- 21.Tan W, et al. Monoubiquitination by the human Fanconi anemia core complex clamps FANCI:FANCD2 on DNA in filamentous arrays. Elife. 2020;9 doi: 10.7554/eLife.54128. [DOI] [PMC free article] [PubMed] [Google Scholar]
- 22.Wang R, Wang S, Dhar A, Peralta C, Pavletich NP. DNA clamp function of the monoubiquitinated Fanconi anaemia ID complex. Nature. 2020;580:278–282. doi: 10.1038/s41586-020-2110-6. [DOI] [PMC free article] [PubMed] [Google Scholar]
- 23.Wang S, Wang R, Peralta C, Yaseen A, Pavletich NP. Structure of the FA core ubiquitin ligase closing the ID clamp on DNA. Nat Struct Mol Biol. 2021;28:300–309. doi: 10.1038/s41594-021-00568-8. [DOI] [PMC free article] [PubMed] [Google Scholar]
- 24.Rajendra E, et al. The genetic and biochemical basis of FANCD2 monoubiquitination. Mol Cell. 2014;54:858–69. doi: 10.1016/j.molcel.2014.05.001. [DOI] [PMC free article] [PubMed] [Google Scholar]
- 25.Sato K, Toda K, Ishiai M, Takata M, Kurumizaka H. DNA robustly stimulates FANCD2 monoubiquitylation in the complex with FANCI. Nucleic Acids Res. 2012;40:4553–61. doi: 10.1093/nar/gks053. [DOI] [PMC free article] [PubMed] [Google Scholar]
- 26.van Twest S, et al. Mechanism of Ubiquitination and Deubiquitination in the Fanconi Anemia Pathway. Mol Cell. 2017;65:247–259. doi: 10.1016/j.molcel.2016.11.005. [DOI] [PubMed] [Google Scholar]
- 27.Ishiai M, et al. FANCI phosphorylation functions as a molecular switch to turn on the Fanconi anemia pathway. Nat Struct Mol Biol. 2008;15:1138–46. doi: 10.1038/nsmb.1504. [DOI] [PMC free article] [PubMed] [Google Scholar]
- 28.Andreassen PR, D’Andrea AD, Taniguchi T. ATR couples FANCD2 monoubiquitination to the DNA-damage response. Genes Dev. 2004;18:1958–63. doi: 10.1101/gad.1196104. [DOI] [PMC free article] [PubMed] [Google Scholar]
- 29.Cheung RS, et al. Ubiquitination-Linked Phosphorylation of the FANCI S/TQ Cluster Contributes to Activation of the Fanconi Anemia I/D2 Complex. Cell Rep. 2017;19:2432–2440. doi: 10.1016/j.celrep.2017.05.081. [DOI] [PMC free article] [PubMed] [Google Scholar]
- 30.Shigechi T, et al. ATR-ATRIP kinase complex triggers activation of the Fanconi anemia DNA repair pathway. Cancer Res. 2012;72:1149–56. doi: 10.1158/0008-5472.CAN-11-2904. [DOI] [PubMed] [Google Scholar]
- 31.Tan W, van Twest S, Murphy VJ, Deans AJ. ATR-Mediated FANCI Phosphorylation Regulates Both Ubiquitination and Deubiquitination of FANCD2. Front Cell Dev Biol. 2020;8:2. doi: 10.3389/fcell.2020.00002. [DOI] [PMC free article] [PubMed] [Google Scholar]
- 32.Ishiai M, et al. Activation of the FA pathway mediated by phosphorylation and ubiquitination. Mutat Res. 2017;803-805:89–95. doi: 10.1016/j.mrfmmm.2017.05.003. [DOI] [PubMed] [Google Scholar]
- 33.Chaugule VK, Arkinson C, Toth R, Walden H. Enzymatic preparation of monoubiquitinated FANCD2 and FANCI proteins. Methods Enzymol. 2019;618:73–104. doi: 10.1016/bs.mie.2018.12.021. [DOI] [PubMed] [Google Scholar]
- 34.Russo CJ, Passmore LA. Electron microscopy: Ultrastable gold substrates for electron cryomicroscopy. Science. 2014;346:1377–80. doi: 10.1126/science.1259530. [DOI] [PMC free article] [PubMed] [Google Scholar]
- 35.Zivanov J, et al. New tools for automated high-resolution cryo-EM structure determination in RELION-3. Elife. 2018;7 doi: 10.7554/eLife.42166. [DOI] [PMC free article] [PubMed] [Google Scholar]
- 36.Zheng SQ, et al. MotionCor2: anisotropic correction of beam-induced motion for improved cryo-electron microscopy. Nat Methods. 2017;14:331–332. doi: 10.1038/nmeth.4193. [DOI] [PMC free article] [PubMed] [Google Scholar]
- 37.Rohou A, Grigorieff N. CTFFIND4: Fast and accurate defocus estimation from electron micrographs. J Struct Biol. 2015;192:216–21. doi: 10.1016/j.jsb.2015.08.008. [DOI] [PMC free article] [PubMed] [Google Scholar]
- 38.Wagner T, et al. SPHIRE-crYOLO is a fast and accurate fully automated particle picker for cryo-EM. Commun Biol. 2019;2:218. doi: 10.1038/s42003-019-0437-z. [DOI] [PMC free article] [PubMed] [Google Scholar]
- 39.Tan YZ, et al. Addressing preferred specimen orientation in single-particle cryo-EM through tilting. Nat Methods. 2017;14:793–796. doi: 10.1038/nmeth.4347. [DOI] [PMC free article] [PubMed] [Google Scholar]
- 40.Adams PD, et al. PHENIX: a comprehensive Python-based system for macromolecular structure solution. Acta Crystallogr D Biol Crystallogr. 2010;66:213–21. doi: 10.1107/S0907444909052925. [DOI] [PMC free article] [PubMed] [Google Scholar]
- 41.Emsley P, Cowtan K. Coot: model-building tools for molecular graphics. Acta Crystallogr D Biol Crystallogr. 2004;60:2126–32. doi: 10.1107/S0907444904019158. [DOI] [PubMed] [Google Scholar]
- 42.Emsley P, Lohkamp B, Scott WG, Cowtan K. Features and development of Coot. Acta Crystallogr D Biol Crystallogr. 2010;66:486–501. doi: 10.1107/S0907444910007493. [DOI] [PMC free article] [PubMed] [Google Scholar]
- 43.Sanchez-Garcia R, et al. DeepEMhancer: a deep learning solution for cryo-EM volume post-processing. Commun Biol. 2021;4:874. doi: 10.1038/s42003-021-02399-1. [DOI] [PMC free article] [PubMed] [Google Scholar]
- 44.Jumper J, et al. Highly accurate protein structure prediction with AlphaFold. Nature. 2021;596:583–589. doi: 10.1038/s41586-021-03819-2. [DOI] [PMC free article] [PubMed] [Google Scholar]
- 45.Pettersen EF, et al. UCSF Chimera--a visualization system for exploratory research and analysis. J Comput Chem. 2004;25:1605–12. doi: 10.1002/jcc.20084. [DOI] [PubMed] [Google Scholar]
- 46.Goddard TD, et al. UCSF ChimeraX: Meeting modern challenges in visualization and analysis. Protein Sci. 2018;27:14–25. doi: 10.1002/pro.3235. [DOI] [PMC free article] [PubMed] [Google Scholar]
- 47.Croll TI. ISOLDE: a physically realistic environment for model building into low-resolution electron-density maps. Acta Crystallogr D Struct Biol. 2018;74:519–530. doi: 10.1107/S2059798318002425. [DOI] [PMC free article] [PubMed] [Google Scholar]
- 48.Barad BA, et al. EMRinger: side chain-directed model and map validation for 3D cryoelectron microscopy. Nat Methods. 2015;12:943–6. doi: 10.1038/nmeth.3541. [DOI] [PMC free article] [PubMed] [Google Scholar]
- 49.Chen ZA, et al. Architecture of the RNA polymerase II-TFIIF complex revealed by cross-linking and mass spectrometry. EMBO J. 2010;29:717–26. doi: 10.1038/emboj.2009.401. [DOI] [PMC free article] [PubMed] [Google Scholar]
- 50.Rappsilber J, Mann M, Ishihama Y. Protocol for micro-purification, enrichment, pre-fractionation and storage of peptides for proteomics using StageTips. Nat Protoc. 2007;2:1896–1906. doi: 10.1038/nprot.2007.261. [DOI] [PubMed] [Google Scholar]
- 51.Mendes ML, et al. An integrated workflow for crosslinking mass spectrometry. Mol Syst Biol. 2019;15:e8994. doi: 10.15252/msb.20198994. [DOI] [PMC free article] [PubMed] [Google Scholar]
- 52.Fischer L, Rappsilber J. Quirks of Error Estimation in Cross-Linking/Mass Spectrometry. Anal Chem. 2017;89:3829–3833. doi: 10.1021/acs.analchem.6b03745. [DOI] [PMC free article] [PubMed] [Google Scholar]
- 53.Chen ZA, Rappsilber J. Quantitative cross-linking/mass spectrometry to elucidate structural changes in proteins and their complexes. Nat Protoc. 2019;14:171–201. doi: 10.1038/s41596-018-0089-3. [DOI] [PubMed] [Google Scholar]
- 54.Okuda S, et al. jPOSTrepo: an international standard data repository for proteomes. Nucleic Acids Res. 2017;45:D1107–D1111. doi: 10.1093/nar/gkw1080. [DOI] [PMC free article] [PubMed] [Google Scholar]
Associated Data
This section collects any data citations, data availability statements, or supplementary materials included in this article.
Supplementary Materials
Data Availability Statement
CryoEM maps have been deposited in the Electron Microscopy Data Base (EMDB) with the following accession codes: EMD-15102 (D2-I3D), EMD-15101 (DNA-D2-I3D), EMD-15103 (DNA-ubD2-I3D). Atomic coordinates of DNA-D2-I3D have been deposited in the Protein Data Bank (PDB) with the accession code PDB 8A2Q. MS data have been deposited in jPOST (project ID JPST001474, PRIDE ID: PXD031632)54. All other data are available in the main text, as a part of the Extended Data, supplementary materials or Source data files. Original gel, blot images and numerical data used to generate plots are provided in Source data. Correspondence and requests for materials should be addressed to L.A.P. All unique materials are available upon request with completion of a standard Materials Transfer Agreement.


