Abstract
Co-translational folding is crucial to ensure the production of biologically active proteins. The ribosome can alter the folding pathways of nascent polypeptide chains, yet a structural understanding remains largely inaccessible experimentally. We have developed site-specific labelling of nascent chains to detect and measure, using 19F nuclear magnetic resonance (NMR) spectroscopy, multiple states accessed by an immunoglobulin-like domain within a tandem repeat protein during biosynthesis. By examining ribosomes arrested at different stages during translation of this common structural motif, we observe highly broadened NMR resonances attributable to two previously unidentified intermediates, which are stably populated across a wide folding transition. Using molecular dynamics simulations and corroborated by cryo-electron microscopy, we obtain models of these partially folded states, enabling experimental verification of a ribosome-binding site that contributes to their high stabilities. We thus demonstrate a mechanism by which the ribosome could thermodynamically regulate folding and other co-translational processes.
Subject terms: Protein folding, Solution-state NMR, Molecular modelling, Cryoelectron microscopy
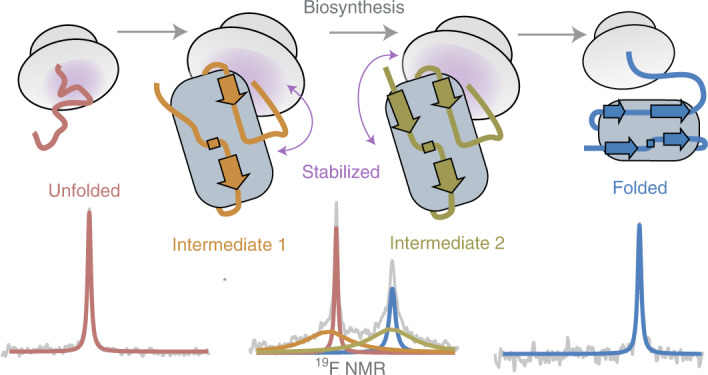
Most proteins must fold co-translationally on the ribosome to adopt biologically active conformations, yet structural, mechanistic descriptions are lacking. Using 19F NMR spectroscopy to study a nascent multi-domain protein has now enabled the identification of two co-translational folding intermediates that are significantly more stable than intermediates formed off the ribosome, suggesting that the ribosome may thermodynamically regulate folding.
Main
For most proteins, folding occurs concurrently with translation on the ribosome1,2, providing an essential means to avoid the accumulation of misfolded and aggregated states implicated in many human diseases3. Analogous to the molecular chaperones that it recruits4,5, the ribosome itself is increasingly thought to directly assist the folding process2. From the peptidyl transferase centre (PTC), the progressively growing nascent chain must traverse the narrow exit tunnel6, which physically limits extensive intramolecular contacts, although helical formation7, overall compaction8–10 and, near the wider vestibule, small tertiary motifs have been observed11,12. Therefore, most proteins acquire their native structures outside the exit tunnel. However, their conformational preferences remain biased by steric occlusion13 and interactions with the highly charged ribosome surface5,14–17, which can influence their folding kinetics18, folding onset13,17, assembly19 and propensity to misfold20. The nascent chain may be further guided towards its native state by the presence of co-translational folding intermediates, as inferred from force-based assays12 and from the detection of generally compacted states by fluorescence-based8,9, optical tweezer18 and cysteine modification experiments20. However, in contrast to highly detailed studies of protein folding off the ribosome21, direct measurements of co-translational folding intermediates are lacking because of the substantial technical challenges associated with the flexible nascent chain tethered to a ~2.3 MDa ribosome.
Solution-state NMR spectroscopy has permitted the high-resolution characterization of ribosome-nascent chain complexes (RNCs)5,14,15,22–26. Here, we expand this approach by developing 19F NMR for co-translational folding studies, exploiting improvements in site-selective in vivo incorporation of non-canonical amino acids27 and the high spectroscopic sensitivity of the 19F nucleus28, which has led to a recent resurgence in its use in complex biological systems29. We find that this strategy permits direct, background-free observation of the co-translational folding transition and the detection of two folding intermediates of the FLN5 immunoglobulin-like domain of the multi-domain filamin FLN15,30. We then use molecular dynamics (MD) simulations to produce potential models of the intermediates, which corroborate previously obtained cryo-electron microscopy (cryo-EM) densities31 and enable rational design of mutant nascent chains to disrupt a ribosome-binding site that stabilizes their formation. These observations reveal how the ribosome can alter the folding pathway by promoting partially folded intermediates during translation.
Results
In vivo production of site-selective 19F-labelled RNCs
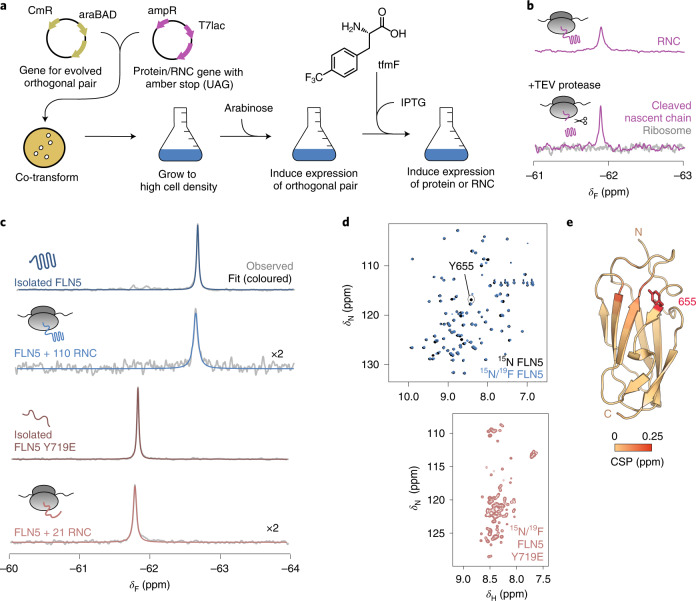
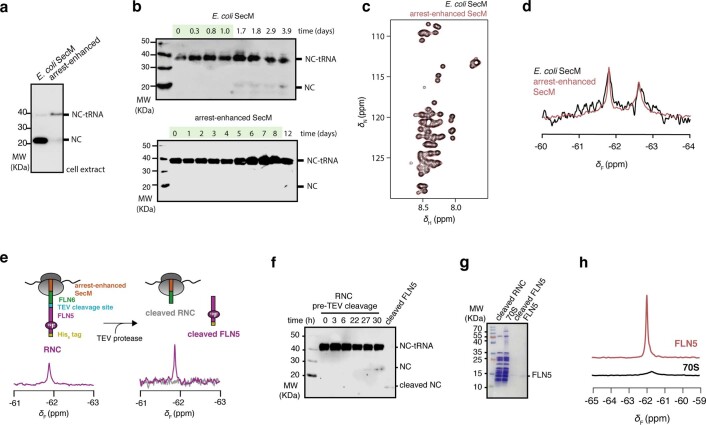
To explore co-translational folding at high sensitivity by 19F NMR spectroscopy, we used the non-canonical amino acid 4-trifluoromethyl-l-phenyl alanine (tfmF), exploiting the three-fold degeneracy of the 19F nucleus within its rotationally mobile CF3 group32. Using an evolved orthogonal amber suppressor transfer RNA (tRNA)/aminoacyl-tRNA synthetase pair33,34, a single tfmF residue was biosynthetically incorporated into the FLN5 sequence by adapting our previously described protocol for in-frame amber suppression (Fig. 1a and Methods)22,23. In addition, an arrest-enhanced variant of the SecM motif was developed (Extended Data Fig. 1) to stall translation at a specified position and thereby produce homogenous samples of 19F-labelled RNCs that remained stable for the duration of NMR data acquisition, as confirmed by western blot analysis and 19F NMR measurements of translational diffusion (Extended Data Fig. 2). The one-dimensional (1D) 19F NMR spectrum of FLN5 RNC showed a single resonance, which, following selective proteolysis to release the FLN5 domain, was retained in the NMR spectrum of the cleaved nascent chain component (Fig. 1b and Extended Data Fig. 1). By contrast, the purified, parent ribosome did not produce a detectable 19F NMR signal (Fig. 1b), confirming the background-free and high selectivity of 19F incorporation by amber suppression.
Fig. 1. Site-specifically 19F-labelled RNCs report on the folding of FLN5 on and off the ribosome.
a, Schematic of production of 19F-labelled RNCs (Methods). CmR, cloramphenicol resistance gene; araBAD, l-arabinose operon; ampR, ampicillin resistance gene; T7lac, T7 promoter inducible by isopropyl ß-d-1-thiogalactopyranoside (IPTG). b, The 19F NMR spectra of a RNC with a cleavable FLN5 domain, before and after addition of tobacco etch virus (TEV) protease and purification of component parts (Extended Data Fig. 1). c, The 19F NMR spectra of isolated FLN5 and FLN5 + 110 RNC, and isolated FLN5 Y719E and FLN5 + 21 RNC. Observed and fitted spectra are shown in grey and red/blue respectively (298 K, 500 MHz). δF, 9F chemical shift. RNC spectra magnified by a factor of ×2. d, The 2D 1H,15N NMR (selective optimized flip angle short transient (SOFAST) heteronuclear multiple quantum coherence (HMQC)) spectra of 15N-labelled and 15N/19F-labelled isolated FLN5 and FLN5 Y719E (298 K and 283 K, respectively; 800 MHz). δN, 15N chemical shift; δH, 1H chemical shift. e, Crystal structure of FLN5 (Protein Data Bank (PDB) no. 1QFH) coloured by residue-specific 1H,15N amide backbone chemical shift perturbations (CSP) observed following 19F incorporation at position 655 (Extended Data Fig. 3). The N and C termini are shown.
Extended Data Fig. 1. Development of in vivo site-selective 19F-labelling of arrest-enhanced RNCs using amber suppression.
a, Anti-histidine western blot of cell extracts following expression without further purification of FLN5 + 31 RNC translationally stalled using SecM deriving from E. coli, and an arrest-enhanced variant of SecM based on the sequence deriving from Mannheimia succiniciproducens66 with the sequence ‘FSTPVWIWWWPRIRGPP’. A higher amount of released nascent chain relative to ribosome-bound (that is tRNA-bound) nascent chain (NC-tRNA) is interpreted as higher ribosome turnover/read-through, and thus weaker translation arrest. b, Anti-histidine western blot of samples of purified FLN5 + 31 A3A3 RNC17 with E. coli SecM (upper) and arrest-enhanced SecM (lower) incubated at 10˚C. Green shading indicates time during which exclusively ribosome-bound (tRNA-bound) nascent chain is detected. c, 2D 1H,15N-SOFAST HMQC spectra of a non-ribosome interacting FLN5 + 31 RNC variant with E. coli SecM (black) and arrest-enhanced SecM (red); no discernible difference was found. d, 1D 19F NMR spectra of FLN5 + 34 RNC with E. coli SecM (black) and arrest-enhanced SecM (red). No discernible difference was found, notwithstanding the significantly higher effective signal-to-noise provided by longer available data acquisition of the arrest-enhanced RNC. e, (left) 1D 19F spectrum of FLN5, 19F-labelled at position 691 and translationally stalled by the arrest-enhanced SecM motif, linked together with a linker comprising FLN6 residues and a TEV protease cleavage site. (right) 1D 19F spectrum following cleavage by TEV protease and purification of the two component parts to produce the cleaved RNC and cleaved FLN5. f, Anti-histidine western blot of RNC sample during NMR data acquisition and following TEV protease cleavage. g, Coomassie-stained SDS-PAGE of purified samples. h, 1D 19F spectra of purified (upper) FLN5, and (lower) 70S ribosomes purified from E. coli transformed with the plasmid encoding the orthogonal pair and exclusively grown in cultures supplemented with tfmF to achieve 100% tfmF labelling. Spectra are normalised to molar concentrations and number of experimental scans. These data demonstrate that even with 100% background labelling of the ribosome, its signal intensity remains substantially lower than that of FLN5. Western blots and gels show representative data from two independent repeats.
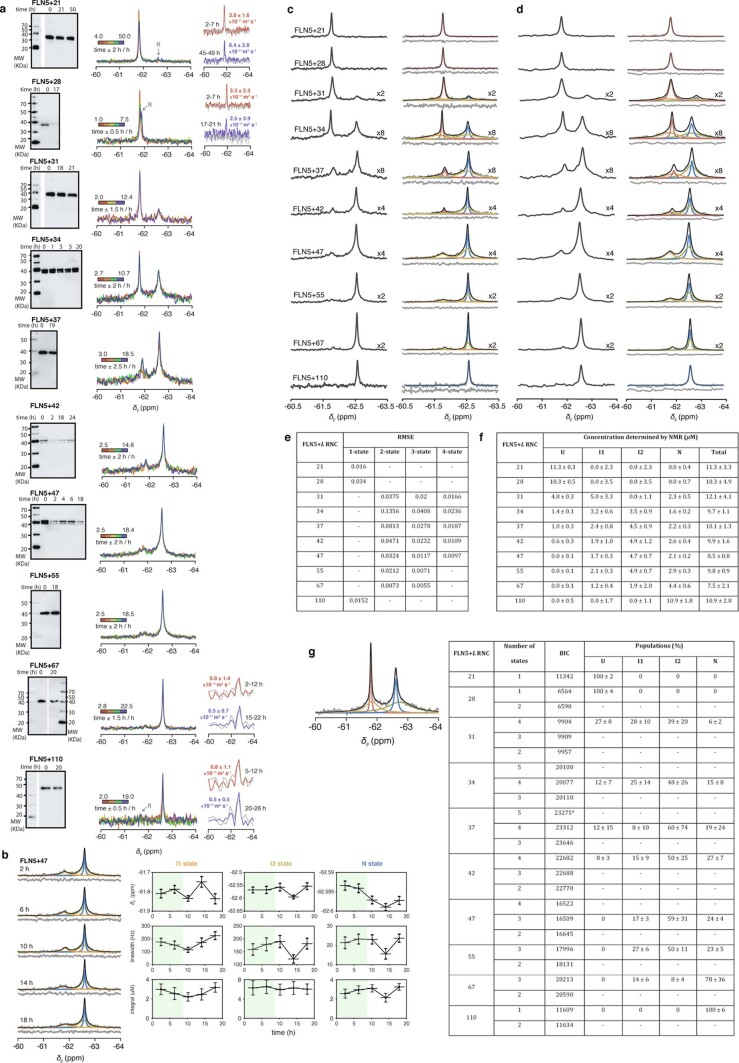
Extended Data Fig. 2. Assessment of sample integrity and lineshape fitting of FLN5 RNCs.
a, For each RNC construct, the sample was subjected to (left) anti-histidine western blot analysis following SDS-PAGE of aliquots of a sample incubated in parallel to NMR experiments, evaluated by the observation of the tRNA-bound (that is ribosome-bound) form of the nascent chain, representative data shown from two independent repeats; (middle) an assessment of its 1D 19F NMR spectra recorded in timed succession; and where sensitivity was permissible, (right) 19F STE experiments were recorded, in an interleaved manner with 1D 19F experiments, with a diffusion delay of 100 ms and at gradient strengths of 5% (coloured) and 95% (grey) of the maximum gradient strength Gmax of 0.54 T m-1, and summed to gain sufficient signal-to-noise to determine its diffusion coefficient. b, As a representative example of the assessment of 1D 19F NMR spectra over time, (left) spectra of FLN5 + 47 are shown (grey), fitted to Lorentzian lineshapes (coloured), with residuals after fitting shown below. (right) Quantitative analysis of the chemical shift, linewidth and integrals for each RNC state, taken from fittings of spectra over time; green shading indicates the time in which the RNC sample was deemed to be stable and intact. Data from these times were summed together and used for the final spectrum. Error bars indicate errors calculated from bootstrapping of residuals from NMR line shape fittings. 1D 19F NMR spectra of the FLN5 RNCs were fitted to line shapes using exponential line broadening functions prior Fourier transformation to compare spectroscopic sensitivity of broad lines (increases with stronger line broadening) and resolution between different peaks (improves with weaker line broadening). Shown in the figure are exponential line broadenings at c 10 Hz, and d 40 Hz. Analysis using either exponential function results in the same quantifications. e, Root-mean-square errors (RMSE) obtained for the fitting of different numbers of lineshapes to 1D 19F NMR spectra of the FLN5 RNCs. f, Concentrations of each state were determined by lineshape fitting of spectra, and normalised to a sample concentration of 10 µM as measured by its absorbance at a wavelength of 280 nm, and to which the total summed NMR integral was compared against. No significant deviation was found between the concentration determined by NMR integration and by absorbance, indicating that the lineshape fits did not significantly over- or underfit the data. g, Time domain analysis of FLN5 RNCs of varying lengths. NMR data, shown in Fig. 2, were fitted in the time domain using exponential functions, combined with fits for zero-order phase and baseline correction in the frequency domain. An example of NMR data fitted using time domain analysis is shown (in the frequency domain, that is following Fourier transformation). The Bayesian information criterion (BIC) value was calculated for each RNC, as an indication of the number of resonances, and thus states, which are most likely to represent the data. The model with the lowest BIC was chosen for analysis in the frequency domain. (*) Fitting with an additional state accounting for <1.5% population. Populations determined for each state by time domain analysis are consistent with those obtained by frequency domain analysis.
Detecting folding on the ribosome using 19F NMR
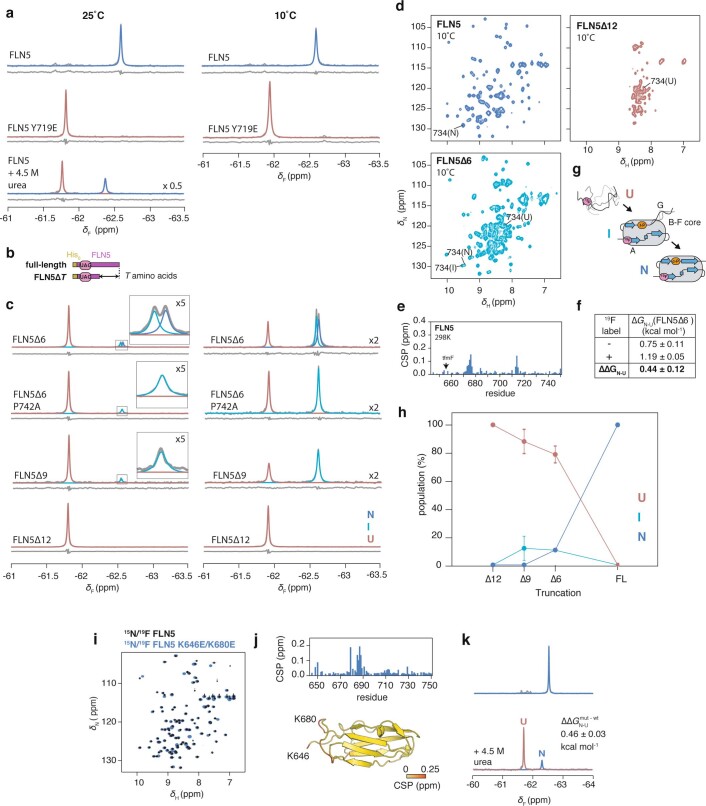
To test the ability of 19F NMR to distinguish different conformations of FLN5, we examined the conservative substitution of a solvent-exposed tyrosine residue to tfmF at position 655 on β-strand A, where the nascent chain in its disordered conformation does not significantly interact with the ribosome and thus remains sufficiently dynamic for NMR observation17. We initially produced isolated FLN5, labelled uniformly with 15N and site-selectively with 19F at position 655, and assessed the impact of fluorination. Minimal changes in thermodynamic stability (difference in Gibb's free energy (∆∆G) ≈ +0.4 kcal mol−1; Extended Data Fig. 3) and 1H,15N-correlated chemical shift perturbations (∆δHN < 0.15 ppm; Fig. 1d,e and Extended Data Fig. 3) were observed. The absence of the Y655 resonance in the fluorinated protein 1H,15N spectrum (Fig. 1d) confirmed the high tfmF incorporation efficiency (>95%).
Extended Data Fig. 3. NMR spectroscopy of isolated variants of 19F-labelled FLN5.
a, 1D 19F NMR spectra of isolated FLN5, FLN5 Y719E and FLN5 in the presence of 4.5 M urea, recorded at 25˚C and 10˚C. No intermediate state population (>5%) was detectable under denaturing conditions. b, Design of C-terminal truncations of FLN5. c, 1D 19F NMR spectra of FLN5∆6, FLN5∆6 P742A, FLN5∆9, and FLN5∆12, recorded at 25˚C and 10˚C. Observed spectra (in grey) were fitted to Lorentzian line shapes and assigned to the various isolated states: natively folded (N, blue), intermediate (I, cyan), and unfolded (U, red). Residuals after fitting are shown below each spectrum. The P742A mutation results in destabilisation of the ∆6 N state, enabling us to attribute the intermediate state as having a cisP742 conformation30. d, 2D 1H,15N-SOFAST HMQC spectra of FLN5, FLN5∆6, and FLN5∆12, recorded at 10˚C. Assignment of residue R734 is shown as an example of resonances in N, I, and U states. e, 1H,15N SOFAST-HMQC chemical shift perturbations of isolated FLN5 following introduction of Y655tfmF, at 298 K. f, Incorporation of tfmF results in a small destabilisation in the natively folded state, as determined by integration of FLN5∆6 peak shown in c, and compared against previous measurements of non-fluorinated protein30. Errors propagated from bootstrapping of residuals from NMR line shape fittings. g, Schematic summarising length-dependent folding pathway of isolated FLN530. h, Length-dependent folding of isolated, 19F-labelled FLN5, determined by integration of spectra shown in a and d. Error bars indicate errors propagated from bootstrapping of residuals from NMR line shape fittings.i, 1H,15N-correlated NMR spectra of isolated 15N/19F-labelled FLN5 and FLN5 K646E/K680E. j, 1H,15N- chemical shift perturbations of FLN5 upon introduction of K646E/K680E mutations from analysis of spectra shown in a shown per residue in the plot, and coloured onto the FLN5 crystal structure below. k, 19F NMR spectra of FLN5 K646E/K680E in 0 and 4.5 M urea. The folded/unfolded populations of the latter were determined by lineshape fitting, and compared against those obtained for wild-type FLN5 (shown in a) to obtain its change in thermodynamic stability.
The 19F NMR spectrum of FLN5 showed a single resonance as expected (Fig. 1c and Extended Data Fig. 3). Similarly, the 19F spectrum of natively folded FLN5 + 110 RNC, in which FLN5 is tethered to the ribosome by 110 linking residues15, contained a single peak with an identical chemical shift (Fig. 1c and Extended Data Fig. 2). A shorter linker of 21 residues (FLN5 + 21 RNC) shifts the 19F NMR peak by +0.8 ppm (Fig. 1c and Extended Data Fig. 2), a similar chemical shift to that of the isolated, unfolded variant of FLN5, having the Y719E point mutation (Fig. 1c,d; ref. 15). The chemical shift of tfmF655 is therefore a simple, direct reporter of the folding of FLN5, both on and off the ribosome.
Identification of co-translational intermediates populated during biosynthesis
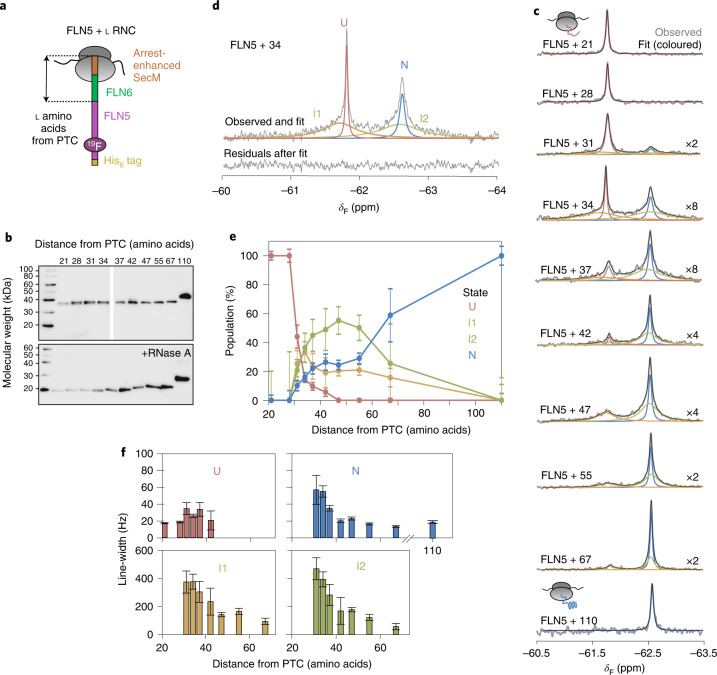
The co-translational folding of FLN5 has previously been examined by specifically measuring its unfolded and folded state NMR resonances using 15N labelling and selective 13C-methyl labelling, respectively15. We explored whether 19F NMR could be used to directly observe the folding transition, and so produced eight additional 19F-labelled FLN5 RNCs, varying the number of linking residues deriving from the subsequent FLN6 domain (Fig. 2a,b and Extended Data Fig. 2; ref. 15), with each reporting as a representative biosynthetic snapshot at equilibrium.
Fig. 2. Co-translational folding of FLN5 monitored by 19F NMR spectroscopy.
a, Design of FLN5 RNCs in which FLN5 is tethered to the PTC via a linker sequence comprising a variable number of FLN6 residues and an arrest-enhanced SecM stalling motif. b, Anti-hexahistidine western blot of purified FLN5 RNCs, with and without ribonuclease A (RNase A) treatment. Representative data shown from two independent repeats. c, The 19F NMR spectra of FLN5 RNCs with increasing distance from the PTC. Observed spectra shown in grey were fitted and peaks assigned to U, I1, I2 or N states (coloured), with the sum of the fits shown in black. NMR data were multiplied with an exponential window function (10 Hz line broadening factor) before Fourier transformation. d, The 19F NMR spectrum of FLN5 + 34 RNC, processed with a line broadening factor of 5 Hz. Residual spectrum after fitting is shown below. e, Folding of FLN5 on the ribosome, measured using 19F NMR line-shape fits. f, Line-widths measured by line-shape fits of spectra as shown in c. All error bars indicate errors calculated by bootstrapping of residuals from NMR line-shape fittings.
The nascent chain remains unfolded with linker lengths of 21 and 28 residues (Fig. 2c). However, within the 19F spectra of longer RNCs (FLN5 + 31 to FLN5 + 67), we observed multiple peaks that altered in their apparent line-widths and signal intensities, indicative of a folding transition (Fig. 2c,d and Extended Data Fig. 2). Analysis of the spectra, in both the frequency and time domains, showed that FLN5 populates four distinct states during co-translational folding (Fig. 2c,d and Extended Data Fig. 2). The peak integrals are directly related to the concentrations of each state (and thus the total integral to the sample concentration; Extended Data Fig. 2) and so were used to quantify their relative populations (Fig. 2e).
The sharpest peak at −61.8 ppm, corresponding to the unfolded state (denoted U), is found in the spectra of RNCs with linker lengths of 21 to 42 residues (Fig. 2c). However, its population begins to significantly reduce beyond 28 linking residues from the PTC (Fig. 2e). Concurrently, a slower progressive increase in natively folded FLN5 (denoted N, at −62.6 ppm) is found from FLN5 + 31 to FLN5 + 110 RNCs (Fig. 2c,e). These data are consistent with previous observations of U and N by two-dimensional (2D) 1H,15N-correlated and 1H,13C-correlated NMR spectroscopy, respectively15.
The 19F NMR observations also reveal large populations of two putative intermediate states that have previously not been observed, to the best of our knowledge15. These states are detected as broad peaks, which persisted for the duration of the NMR experiments (Extended Data Fig. 3). The intermediates have chemical shifts similar to those of U and N, indicating the absence and presence of native-like tertiary contacts local to the 19F labelling site within these states, denoted I1 and I2, respectively (Fig. 2c). They are initially populated at 31 residues from the PTC (Fig. 2c), at which there is complete emergence of FLN5 from the exit tunnel15. I1 is maximally populated with 31–34 linking residues, while I2 is increasingly populated up to ~47 residues from the PTC before progressively reducing with linker length (Fig. 2e).
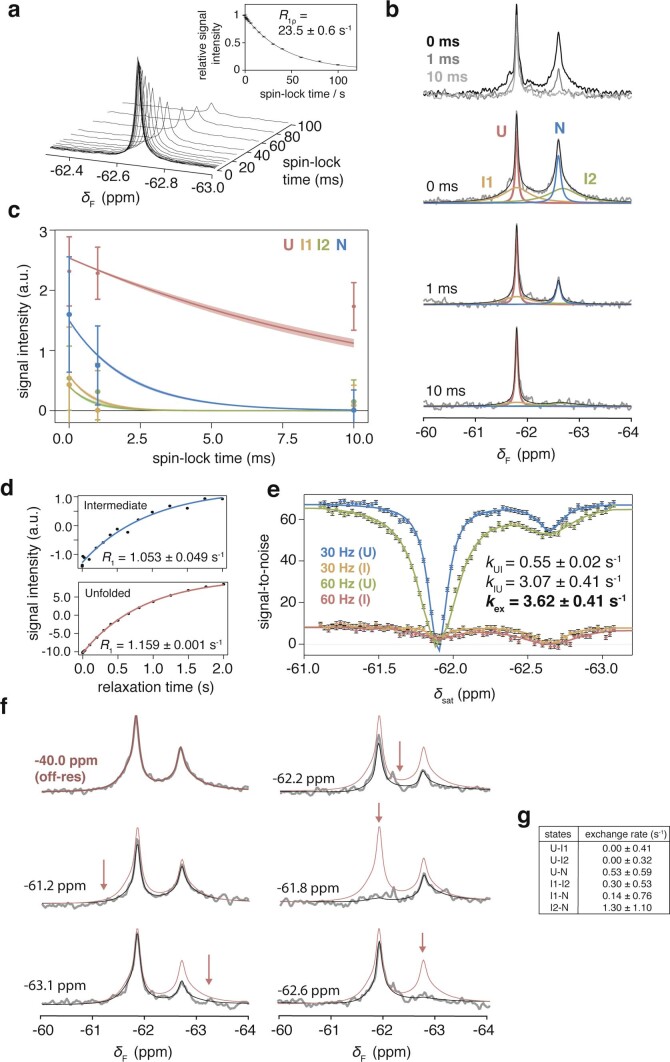
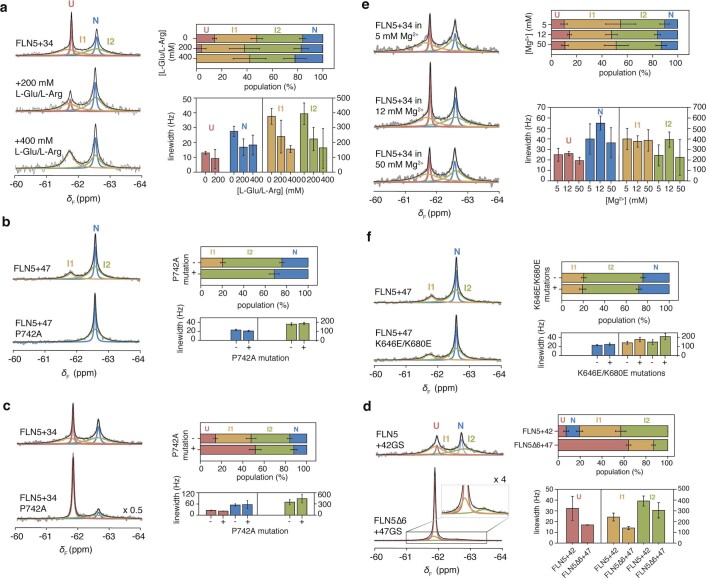
NMR peak line-widths can provide information on dynamic processes, reporting on processes such as chemical exchange and rotational tumbling35. To assess the effect of chemical exchange between the nascent chain states on the observed NMR line-widths, we acquired 19F on-resonance rotating-frame relaxation rate (R1ρ) measurements36 of FLN5 + 34 RNC (Extended Data Fig. 5); these data show that the I1 and I2 resonances are not the result of broadening of the U or N peaks. Line-widths are also affected by tumbling; in addition to structural conformations, line-widths of nascent chain resonances are therefore particularly sensitive to even transient, weak binding to the large ribosomal particle5,17. The line-widths of U remain generally sharp across all RNC lengths, indicating that the nascent chain remains mobile, at least locally to the 19F labelling site (Fig. 2f; ref. 15). By contrast, the N resonances are broad at short RNC lengths but narrow away from the ribosome (Fig. 2f) and can be attributed to faster tumbling of the globular FLN5 domain as it is extruded25. The line-widths of I1 and I2 are significantly broader than those of U and N (Fig. 2f), but progressively narrow with both nascent chain length (Fig. 2f) and with increasing ionic strength (Extended Data Fig. 4), indicating that they bind, partly through electrostatic interactions, to the ribosome surface, resulting in more limited mobility.
Extended Data Fig. 5. Characterisation of dynamic processes on and off the ribosome by 19F NMR spectroscopy.
a, On-resonance 19F R1ρ measurements of isolated FLN5 using a high spin-lock field (7500 Hz). Inset shows plot of relative signal intensities from fitted spectra as a function of spin-lock time. The R1ρ determined is consistent with R2 measured using lineshape analysis of the 1D 19F NMR spectrum (23.3 ± 0.8 s-1, Fig S3), indicating the absence of chemical exchange processes. b, On-resonance 19F R1ρ measurements of FLN5 + 34 RNC. Due to limitations in sensitivity, we selected three spin-lock times. Observed spectra are shown above. Spectra shown below were globally fitted, with shared chemical shifts and linewidths, but independent signal intensities. c, Signal intensities determined from a global fit of spectra shown in b were plotted against spin-lock times, and compared against the expected signal decay from R2 measurements determined by lineshape analysis of the 1D 19F NMR spectrum as shown in the shaded regions. Error bars indicate errors determined by bootstrapping of residuals from NMR line shape fittings. d, 19F longitudinal relaxation rate (R1) measurements for the unfolded and intermediate states in FLN5∆6 P742A, used in the CEST measurement fittings. Error determined from data fits. e, 19F CEST profiles for FLN5∆6 P742A measuring exchange between the unfolded and isolated intermediate states using different B1 field strengths (30, 60 Hz). Error determined from data fits. f, 19F CEST measurements of FLN5 + 34 RNC. Due to limitations in sensitivity, we selected six frequencies at which to irradiate (of which one was off-resonance from all NMR peaks and shown in red, with remaining irradiation frequencies indicate d by arrows) with the 15-Hz B1 field. The frequencies were chosen to either saturate N/U states and intermediates (-62.2, -61.8, and -62.6 ppm), or only one intermediate state (-61.2 and -63.1 ppm). In the case of the latter, saturation of I1 (that is at -61.2 ppm) did not result in significant perturbation of the I2 state, and vice versa; this result indicates that the I1 and I2 resonances are distinct, in slow exchange, and therefore provides further evidence that four states are populated by FLN5 + 34. Observed spectra (grey) were fitted (black) by analysing in the time domain using the Bloch-McConnell equations. g, Exchange rates between FLN5 + 34 nascent chain states determined by CEST measurements, using an estimated R1 of 1.1 s-1 for all RNC states. Error determined from data fits.
Extended Data Fig. 4. Characterisation of co-translational folding intermediates.
a, 1D 19F NMR spectra of FLN5 + 34 in the presence of increasing concentrations of equimolar arginine glutamate. Line shape fittings were used to determine the populations and line widths, as shown by the plots on the right. Reductions in linewidths are indicative of loss of ribosome interactions. Decreased population of U is consistent with destabilisation of its ribosome interactions17. b, 1D 19F NMR spectra of FLN5 + 47 and FLN5 + 47 P742A. Line shape fittings were used to determine the populations and line widths, as shown by the plots on the right. c, As in b but with FLN5 + 34 and FLN5 + 34 P742A. d, As in b but with FLN5 + 42GS and FLN5∆6 + 47GS (283 K, 500 MHz). e, As in b but with FLN5 + 34 in 5, 12, and 50 mM magnesium ion concentration. f, As in b but with FLN5 + 47 and FLN5 + 47 K646E/K680E. Similar populations are obtained for the RNC despite the destabilisation of the native state in isolation, indicating an effective stabilisation of N on the ribosome. All error bars indicate errors (propagated) from bootstrapping of residuals from NMR line shape fittings.
Moreover, the broad line-widths (that is, fast effective transverse relaxation rates R2) account for the absence of intermediate state resonances in previous NMR measurements using alternative labelling schemes; these require 2D experiments, which increases the dead time during which the signal relaxes and decays. Overall, the 19F NMR data identify two stable, structurally distinct intermediate states, which are populated outside the exit tunnel and are closely associated to the ribosome surface.
Slow interconversion between nascent chain conformations
We acquired 19F chemical exchange saturation transfer (CEST) measurements36 to investigate the kinetic interconversion between the four nascent chain states. By irradiating frequencies at particular offsets from an NMR resonance with a weak applied radiofrequency (B1) field, the resulting perturbation (that is, signal reduction) is transferred to the interconverting state via chemical exchange37. CEST measurements of FLN5 + 34 RNC (Extended Data Fig. 5) indicate that chemical exchange between all states occurs slowly (rate constant (kex) < 1.3 s−1, time constant (τex) > 0.8 s). By contrast, an isolated variant of FLN5 exchanges at a faster rate of 3.6 ± 0.4 s−1 between its unfolded and native-like intermediate structure that lacks G-strand contacts but is otherwise folded30 (Extended Data Fig. 5), suggesting that the effective folding rate is reduced on the ribosome and that additional processes may potentially be competing with folding. The observed slow exchange between RNC states, corroborated by the R1ρ measurements discussed above (Extended Data Fig. 5), also verify the presence of two distinct intermediate state peaks (rather than a single, highly broadened peak), since irradiating I1 did not result in a significant perturbation of I2, and vice versa (Extended Data Fig. 5).
Partially structured intermediates on the ribosome
Off the ribosome, truncation of the six carboxy-terminal (C-terminal) residues of isolated FLN5 (FLN5∆6) produces a population of a stable intermediate (Extended Data Fig. 3; ref. 30), previously characterized as having a native-like core with a detached terminal G-strand, and with the conserved cis-proline P742 in a trans conformation (Extended Data Fig. 3; ref. 30). Previous structural modelling has indicated that this conformation is sterically accessible on the ribosome with a linker length of at least 18 amino acids30, and so we sought to examine whether I1 and I2 adopted this structure.
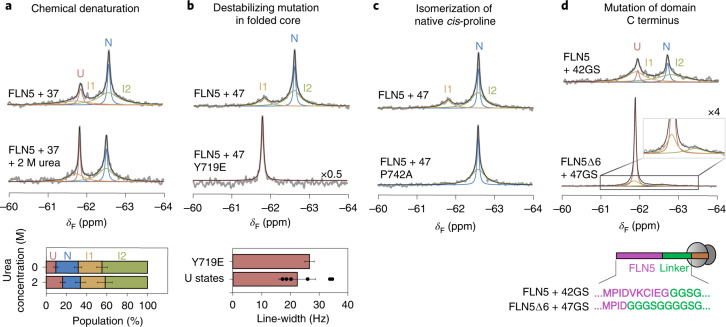
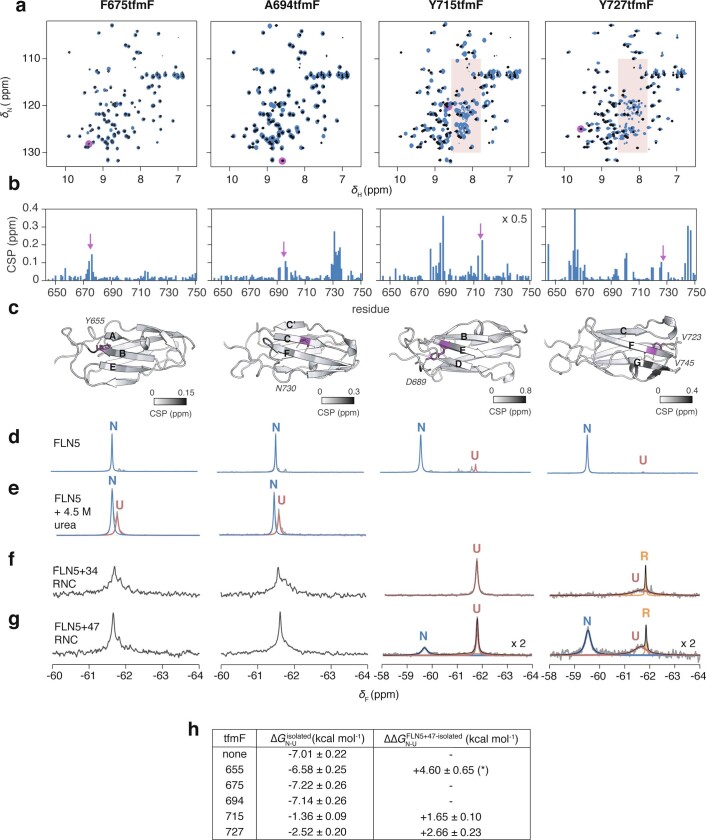
We first tested whether the putative co-translational intermediates possessed a stable structure by incubating 19F-labelled FLN5 + 37 RNC in 2 M urea (Fig. 3a). We observed a shift in the folding equilibrium towards U, while populations of I1 and I2 showed no discernible change. This indicates that the intermediates possess some stable structure that is largely resistant to mildly denaturing conditions. To assess this further, we introduced the destabilizing Y719E point mutation into 19F-labelled FLN5 + 47 RNC (Fig. 3b), which resulted in the collapse of its three 19F resonances into a single sharp peak (Extended Data Fig. 2), and in which its line-width and chemical shift are consistent with an unfolded state. Residue Y719 is natively solvent inaccessible, so the ability of a mutation to completely unfold both I1 and I2 indicates that they adopt partially folded structures. Additionally, we 19F-labelled FLN5 + 47 RNCs at positions natively buried in the hydrophobic core (Y715 and Y727; Extended Data Fig. 6). We found 19F NMR resonances attributable to a native-like structure, whose thermodynamic stabilities are higher than those found in RNCs labelled at position 655 (relative to isolated FLN5; Extended Data Fig. 6), suggesting the core is at least partially formed in the intermediates.
Fig. 3. The ribosome-bound intermediate states are partially folded.
a, The 19F NMR spectra of FLN5 + 37 RNC in the absence and presence of 2 M urea. Fractional populations shown below. b, The 19F NMR spectra of FLN5 + 47 and FLN5 + 47 Y719E RNC. Below, the line-width of FLN5 + 47 Y719E is compared against the line-widths of U determined for other RNCs (mean ± s.d.; Fig. 2f). c, The 19F NMR spectra of FLN5 + 47 and FLN5 + 47 P742A RNC. Analysis shown in Extended Data Fig. 4. d, The 19F NMR spectra of tfmF655-labelled FLN5∆6 + 47GS and FLN5 + 42GS RNCs (283 K, 500 MHz). Schematic depicts RNC construct design. Analysis shown in Extended Data Fig. 4. Unless stated otherwise, error bars indicate errors propagated from bootstrapping of residuals from NMR line-shape fittings.
Extended Data Fig. 6. 19F NMR spectroscopy of FLN5 with tfmF incorporation at positions F675, A694, Y715, and Y727.
a, 2D 1H,15N-SOFAST HMQC spectra of FLN5 without (black) and with tfmF-incorporation (blue). Resonance corresponding to incorporation site is absent in each tfmF-labelled FLN5 construct, as highlighted in magenta. Red shading indicates disordered resonances resulting from destabilisation by tfmF-incorporation in solvent-inaccessible positions (see h). b, 1H,15N-correlated chemical shift perturbations measured from spectra shown in a upon tfmF-incorporation. c, Location of tfmF-incorporation (magenta) on the crystal structure of FLN5 (1qfh), coloured according to chemical shift perturbations. Contacts made by non-fluorinated FLN5 at the label site are shown by dashed lines and the contacted residues labelled. d, 1D 19F NMR spectra of tfmF-incorporated FLN5. Arrows indicate the appearance of a disordered resonance, consistent with 1H,15N-correlated NMR observations. e, 19F NMR spectra of tfmF-incorporated FLN5 incubated in 4.5 M urea, used to determine the ∆∆G of tfmF-incorporation by comparison with 19F NMR spectra of FLN5 labelled at position 655 and incubated in 4.5 M urea, as shown in Extended Data Fig. 5. f, 19F NMR spectra of tfmF-incorporated FLN5 + 34 RNC. g, 19F NMR spectra of tfmF-incorporated FLN5 + 47 RNC. Ribosome-released species are indicated by orange arrows. For spectra with well-resolved resonances, the data were fitted to Lorentzian line shapes. The broad linewidth of the unfolded state for tfmF727 FLN5 + 47 is consistent with its position in the ribosome-interacting segment of the domain17, and is reduced by ~25% relative to its linewidth in FLN5 + 34. The spectra of RNCs tfmF-labelled at positions 675 and 694 show highly overlapped resonances and so we were unable to accurately fit the peaks. h, Gibb’s free energies of tfmF-incorporated isolated FLN5, determined by quantification of native state peak integrals of spectra shown in d and e, and free energy differences (∆∆GN-U) between the ribosome-bound (with 47-residue linker) and isolated native states. The ∆∆GN-U for tfmF655-labelled FLN5 (labelled *) is estimated based on a population of U determined from the spectral noise. 19F-labelling at positions 715 and 727 show reduced destabilisation of N on the ribosome relative to when labelled at position 655 for FLN5 + 47 RNC (similar results are obtained when including I1 and/or I2 states); tfmF side chains in positions 715 and 727 therefore form native-like tertiary contacts before those in 655 are formed in the intermediate states, consistent with a folded core comprising the B-F strands.
Within the isolated FLN5 intermediate, the native-like folded core comprises the A- to F-strands, and accordingly the 19F chemical shift of residue 655 (residing on the A-strand) is native-like (Extended Data Fig. 3). Therefore, based on their chemical shifts (Fig. 2c), it is likely that the A-strand on I2 is also folded onto the hydrophobic core, whereas in the I1 state, native side chain contacts between the A-strand and its neighbouring residues are absent and thus the A-strand is unlikely to be completely associated.
Next, we examined isomerization of the conserved proline within the intermediates. Using populations determined from their 19F NMR integrals, we measured the free energy changes upon mutation of P742 to alanine, which destabilizes the cis conformation (Extended Data Fig. 4; ref. 30). The point mutation completely destabilizes I1 (∆∆GI1-U > 1.7 kcal mol−1), as indicated by the absence of its 19F resonance in the RNC spectra (Fig. 3c and Extended Data Fig. 4), showing that I1 possesses the native cis-P742. However, I2 and N are only mildly, but equally, destabilized (∆∆GI2–U = 0.8 ± 0.2, ∆∆GN–U = 0.9 ± 0.2 kcal mol−1 for FLN5 + 34; Fig. 3c and Extended Data Fig. 4), indicating they likely have the same P742 conformation. Although this destablization is less than that for isolated FLN5 (∆∆GN–U ≈ +4 kcal mol−1 (ref. 30)), previously observed 1H,13C-methyl resonance chemical shifts of RNCs show that N adopts the cis-proline conformation30; thus additional effects on the ribosome likely mitigate the destabilizing mutation within I2 and N. Overall, in contrast to the isolated intermediate (Extended Data Fig. 3; ref. 30), both I1 and I2 likely possess the cis conformer of P742, potentially rationalizing the observed slow exchange (Extended Data Fig. 5) between U and the intermediates to enable proline isomerization to occur.
The terminal G-strand (I743 to I748) directly succeeds P742 and, as described above, is detached (after truncation) from the folded core of the isolated intermediate30. We thus investigated its role in co-translational folding by replacing the six C-terminal FLN5 residues with a stretch of poly(glycine–serine) residues in a RNC. We found that N was completely destabilized by the series of mutations (∆∆GN–U > 2.3 kcal mol−1; Fig. 3d and Extended Data Fig. 4). However, I1 and I2 both persisted, being less destabilized (∆∆GI1–U ≈ +1.5 ± 0.2 kcal mol−1; ∆∆GI2–U ≈ +1.9 ± 0.2 kcal mol−1; Fig. 3d), indicating that the G-strand contributes significantly less to their overall folding stabilities. We also observe narrower I1 and I2 resonances by modifying the FLN5 C terminus, suggesting that interactions between the ribosome and this nascent chain segment are reduced (Extended Data Fig. 4). We note that the G-strand resides within a ribosome-binding segment previously identified in U by 1H,15N-correlated NMR measurements17.
The combined NMR data (Fig. 3) therefore show that I1 and I2 possess a folded core, in which the G-strand is likely to be at least partly detached and interacting with the ribosome, while I1 is further characterized by incomplete association of the A-strand, which has been found to also be labile in folding intermediates off the ribosome30.
Corroborating structural evidence of intermediate states
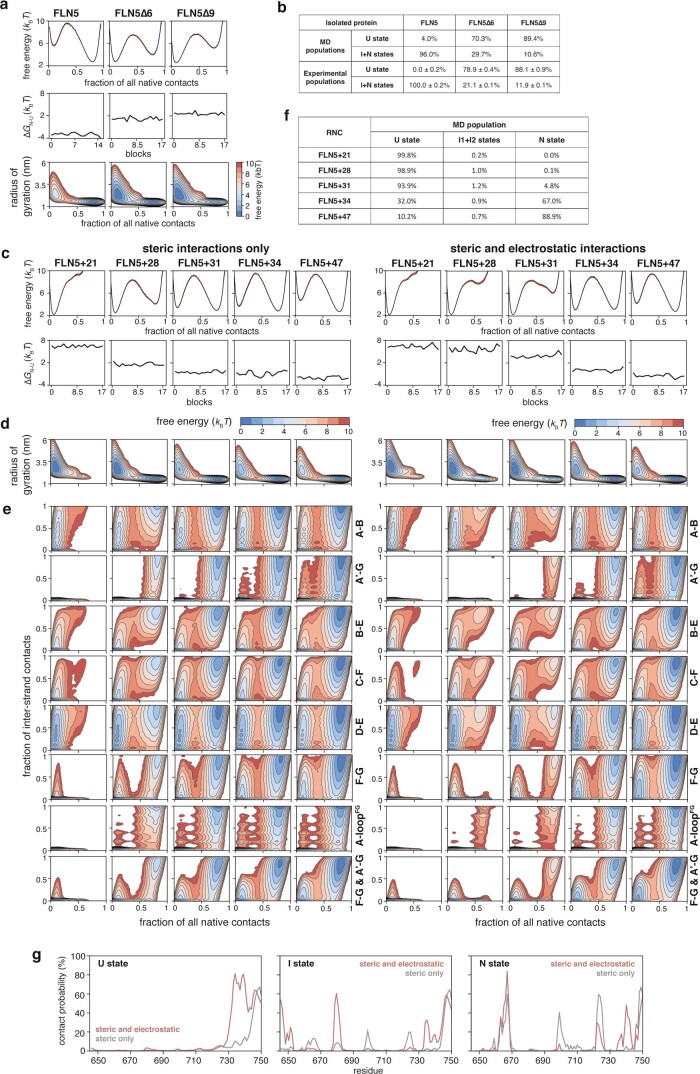
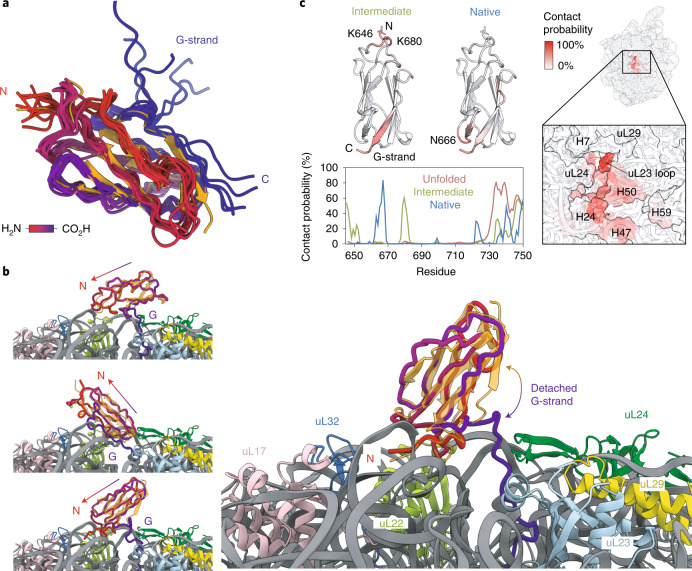
We next performed coarse-grained (CG) MD simulations using structure-based models as an orthogonal means of examining the co-translational folding of FLN5, applying parallel biased metadynamics38 to enhance sampling transitions between nascent chain conformations using ten collective variables (Methods). The MD simulation temperature was calibrated to match populations of isolated FLN5 and its C-terminal truncations with those determined experimentally (Extended Data Fig. 7). The introduction of previously calibrated electrostatic interactions between FLN5 and the ribosome17 enabled us to accurately predict FLN5 + 31, from six RNCs (across FLN5 + 21 to FLN5 + 47), as the length at which folding begins (Extended Data Fig. 7). From the simulations, we generated and analysed the folding free energy landscapes, defined by native contacts between neighbouring β-strands, to determine the folding pathway. Consistent across the RNCs is the initial formation of native contacts within the A- to F-strands (Extended Data Fig. 7), which results in an ensemble of marginally stable intermediates (Fig. 4b), collectively characterized by a native-like core with a detached, transiently associating G-strand (Fig. 4a). Despite capturing only a single, lowly populated intermediate state (Fig. 2e and Extended Data Fig. 7), the simple CG models propose structures (Fig. 4b) that are qualitatively consistent with the 19F NMR data of I2 (Fig. 3). The reduced contacts observed between the A-strand and its neighbouring loop region (between strands F and G) within the same structures (Extended Data Fig. 7) may account for I1 within the structural ensemble.
Extended Data Fig. 7. Coarse-grained molecular dynamics simulations of the co-translational folding of FLN5.
a, CG structure-based model MD simulations of isolated FLN5 and its C-terminal truncations (FLN5∆6 and FLN5∆9) used to calibrate all subsequent MD simulations. We introduced non-bonded interactions in the form of native contacts generated from the FLN5 crystal structure (1qfh) as they dominate the folding landscape based on the principle of minimal frustration57. We used Parallel Biased Metadynamics38 to enhance sample transitions between different states using ten collective variables: fraction of all native contacts, radius of gyration, and the fraction of the native contacts between each pair of strands (A-B, A’-G, B-E, C-F, C-C’, D-E, F-F’, and F-G). Shown in the plots are the free energy landscapes of folding in 1D (top) and 2D (against the radius of gyration); the middle plot shows convergence of the free energy of folding calculated across the whole trajectory based on the block analysis. b, Populations of FLN5 states determined by CG models (by analysis of free energy landscapes shown in a) and by 19F NMR, showing good agreement at the chosen temperature for MD simulations. The CG models do not simulate cis-trans isomerisation (and thus cannot model the transP742 in the intermediates30), and therefore, as an approximation, all folded states were compared against the summed total of native and intermediate state populations from experimental data instead. c, Top plot shows free energy landscapes of folding determined for 6 RNCs by CG models. Bottom plot shows convergence of the free energy of folding calculated across the whole trajectory based on the block analysis. d, Free energy landscapes of folding plotted against radius of gyration for each RNC. e, Free energy landscapes of folding plotted against fraction of contacts between pairs of β-strands or loop regions (as indicated on the right of each plot) for each RNC. f, Populations of unfolded, intermediate and native states obtained for each RNC by the CG models. g, Contact probability between the unfolded, intermediate, and native states of the RNC and the ribosome from CG models with (red) and without electrostatic interactions (grey), plotted per residue.
Fig. 4. Structural ensemble of the FLN5 co-translational intermediate state determined by MD simulations.
a, Structural ensemble of the FLN5 + 34 intermediate from CG models. The 10 most populated intermediate conformations are superimposed with the native FLN5 crystal structure (orange; PDB no. 1QFH) and coloured from N terminus (red) to C terminus (blue). Ribosome and linker are not shown for clarity. b, Examples of the FLN5 + 34 intermediate structures, with the FLN5 crystal structure aligned. Colours as in a. Arrow indicates axis from C to N terminus. c, The bottom left plot shows the contact probability between the FLN5 + 34 in its unfolded, intermediate and native states and the ribosome from CG models. Contact probabilities of the intermediate and native states are coloured on the FLN5 structures (above) with regions of highest probability highlighted. The right depicts the contact probability between the FLN5 + 34 intermediate and the ribosome, mapped onto the ribosome surface.
Contacts made by the nascent chain with the ribosome surface in the MD simulations (Fig. 4c and Extended Data Fig. 7) correlate well with previous NMR measurements: trajectories for U show strong (up to 80% contact probability), predominantly electrostatic interactions at its C-terminal binding site (residues N728–C747) and weak contacts elsewhere17, while contacts between N and the ribosome occur at the domain’s C-terminal hemisphere and are largely steric with only small electrostatic contributions (Fig. 4c and Extended Data Fig. 7; ref. 25). We find that a significant proportion (~50%) of the intermediate ensemble contacts the ribosome through charge interactions (Extended Data Fig. 7). The interactions identified (Fig. 4c) are localized at the C terminus, as observed for U although less strong, and are consistent with experimental data (Fig. 3d and Extended Data Fig. 4). Contacts are also found at the more positively charged, amino-terminal (N-terminal) hemisphere of FLN5, centred at residues K646 and K680, which preferentially orients the partially folded domain towards the RNA-rich side of the ribosome vestibule (Fig. 4b), predominantly contacting rRNA helices H24, H47 and H50 (Fig. 4c).
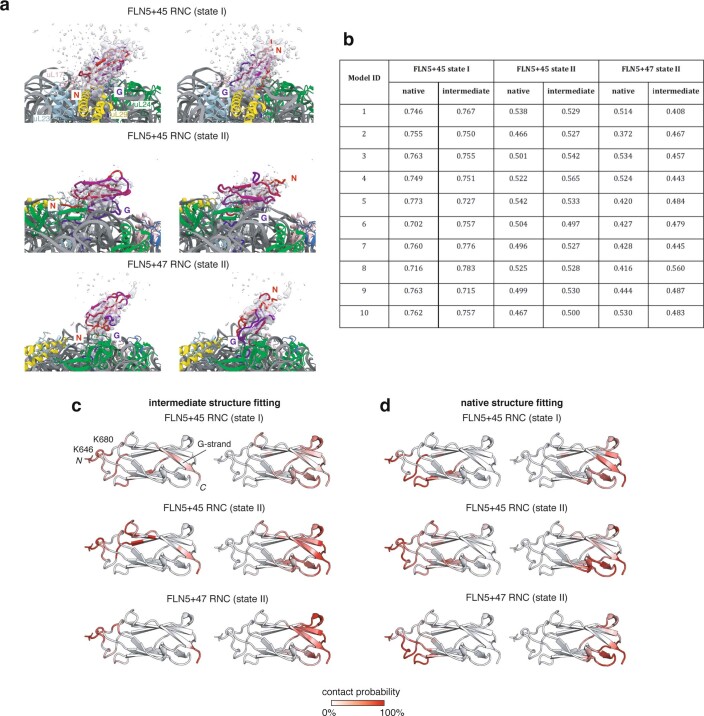
We subsequently re-examined cryo-EM data obtained for FLN5 + 45 and FLN5 + 47 RNCs31, previously fitted with all-atom density-guided MD simulations with exclusively native structures defined within structure-based models. Having discovered that these RNCs predominantly populate partially folded intermediates in this work (Fig. 2), we used the previously obtained electron densities as restraints to fit structures with inter-residue contacts characterizing I2 (Fig. 4a) instead (Extended Data Fig. 8). These new models showed cross-correlations that were quantitatively similar to those obtained for natively folded structures (Extended Data Fig. 8). Additionally, the intermediate conformations also showed binding to the ribosome surface at the N-terminal loop regions and the G-strand of FLN5 (Extended Data Fig. 8), as identified in the CG models (Fig. 4c). We conclude that the cryo-EM data corroborate the proposed intermediate state structures and their interactions with the ribosome.
Extended Data Fig. 8. Models of the co-translational intermediates of FLN5 by all-atom, cryo-EM density-driven MD simulations.
a, Examples of structural models of FLN5 co-translational intermediates fitted to previously obtained cryo-EM densities of FLN5 + 45 and FLN5 + 47 RNCs31. Two major orientations are observed, in which the N-terminus of the FLN5 domain points towards (left) or away (right) from the ribosome. The FLN5 domain is coloured from its N- (red) to C-terminus (blue), with its N-terminus (N) and G-strand labelled (G). Cryo-electron densities are shown in grey, and at a contour level of two sigma. b, Cross-correlation values for cryo-EM density-guided MD simulations of native and intermediate state RNCs. For each of the 10 density-guided simulations obtained using the three electron density maps31, we generated final models for the intermediate state, from which electron density maps were simulated and compared against the nascent chain experimental maps. The resulting cross-correlation values, calculated as in ChimeraX65, for the intermediate state are shown alongside cross-correlations using the same approach as previously for the native state (Javed et al, submitted). c, Contact probabilities of FLN5 residues with the ribosome surface by analysis of models of the intermediate as shown in a for the two main orientations observed (N-terminus of FLN5 towards and away from the ribosome, left and right, respectively). Regions of highest contact probability, residues K646 and K680 and G-strand, labelled. d, As in b, but for models of the native state from previous all-atom cryo-EM density-driven MD simulations using the same cryo-EM map31.
Mechanism of intermediate state stabilization on the ribosome
We next sought to experimentally examine the effect of the identified binding site on co-translational folding. We thus replaced residues that are predicted to strongly bind to the ribosome, K646 and K680 (Fig. 4c), found natively in the loop regions, with glutamic acid residues to reverse their charge. The 19F NMR spectrum of the FLN5 + 34 K646/K680E RNC shows that folding remains four-state (Fig. 5). However, the N is stabilized on the ribosome by 0.6 ± 0.3 kcal mol−1 relative to U, despite the mutations destabilizing the FLN5 domain off the ribosome by ~0.4 kcal mol−1 (Extended Data Fig. 3). Moreover, both I1 and I2 are each destabilized relative to N by 0.2–0.3 kcal mol−1. This shift in co-translational folding, together with a small reduction in the line-widths of I1 and I2 (Fig. 5), is therefore consistent with disruption of ribosome interactions that contribute to the stabilities of the intermediates. The folding equilibrium is also shifted towards N in a longer nascent chain possessing the same mutations (Extended Data Fig. 4), although to a lesser extent, indicating that the interactions mediated by K646 and K680 are strongest closest to the ribosome surface. However, the persistence of broad NMR resonances attributable to the intermediate states suggest that I1 and I2 possess additional stabilizing binding sites or other modes of interactions that were not defined within the CG models.
Fig. 5. Electrostatic interactions with the ribosome surface stabilize partially folded nascent chains.
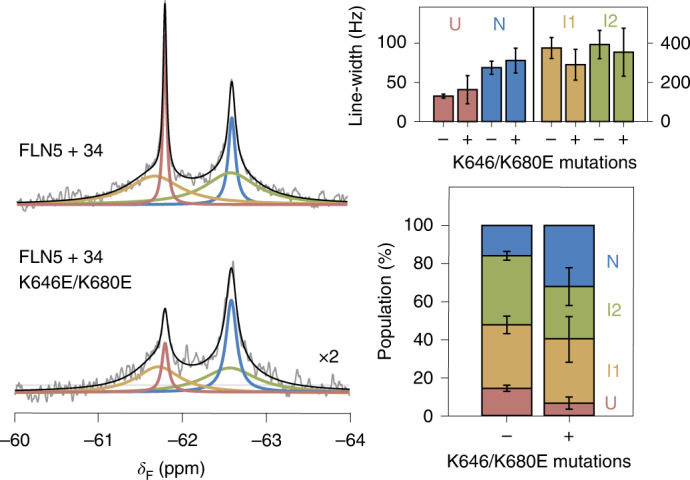
The 19F NMR spectra of FLN5 + 34 and FLN5 + 34 K646E/K680 RNCs. Line-widths and populations of each RNC state determined by analysis of the spectra are shown on the right. Error bars indicate errors (propagated) from bootstrapping of residuals from NMR line-shape fittings.
Electrostatic interactions between the nascent chain and the ribosome can also be mediated via magnesium ions5,39. To examine this, we analysed 19F NMR spectra of FLN5 + 34 RNC recorded at different concentrations of magnesium ions (Extended Data Fig. 4). In contrast to varying the overall ionic strength (Extended Data Fig. 4), we found the effect of magnesium to shift the co-translational folding equilibrium to be only very modest.
Stabilization of partially folded nascent chains during translation
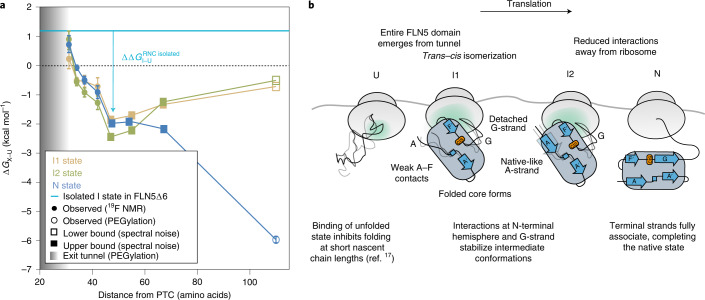
We determined a free energy landscape of the co-translational folding of FLN5 (Fig. 6a) by quantitative analysis of the RNC 19F NMR spectra (Fig. 2c,d). This thermodynamic analysis reveals that N is progressively destabilized close to the ribosome (Fig. 6a). Relative to N (Extended Data Fig. 9), the intermediates are more stable at short linker lengths and become progressively less stable with translation, suggesting that they are stabilized by close proximity to the ribosome. Indeed, the intermediates are substantially more stable (∆GI–U = −2.5 to −0.2 kcal mol−1; Fig. 6a) at all nascent chain lengths than those found off the ribosome (∆GI–U > +1.2 kcal mol−1; Extended Data Fig. 3). Folding intermediates of FLN5 are therefore stabilized on, and particularly close to, the ribosome. These observations can, at least partly, be accounted for by electrostatic ribosome interactions that selectively target and stabilize the intermediate states (Fig. 6b).
Fig. 6. Free energy landscape and proposed model of co-translational folding of FLN5.
a, Free energy landscape of the co-translational folding of FLN5. Fractional populations determined by 19F NMR (Fig. 2e) were used to determine the difference in free energy between X (I1, I2 or N) and U (∆GX–U); in RNCs where U was not populated, an upper or lower bound of ∆GX–U was determined based on the spectral noise. The ∆GN–U of FLN5 + 110, and emergence from the tunnel (by solvent accessibility of the native, C-terminal C747 of FLN5; shaded region) were determined by PEGylation15,17. Error bars indicate errors propagated from bootstrapping of residuals from NMR line-shape fittings. b, Schematic of a proposed model for the co-translational folding mechanism of FLN5.
Extended Data Fig. 9. Stabilisation of co-translational intermediates by the ribosome.
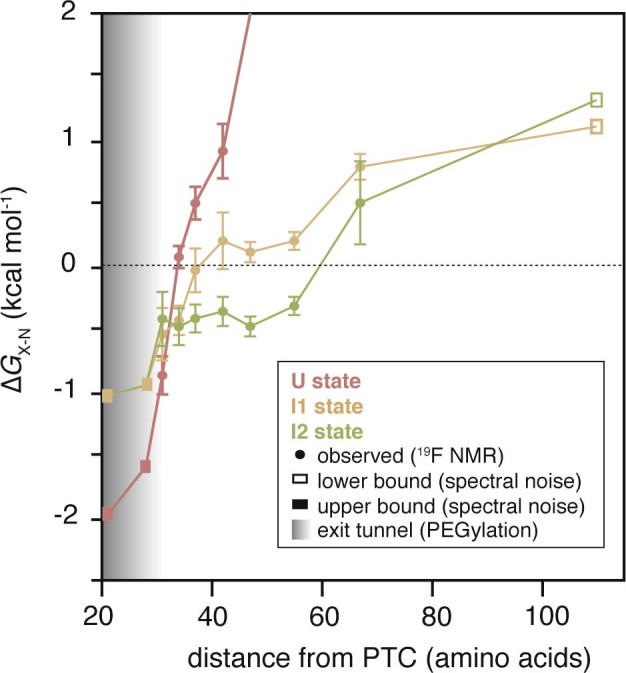
Free energy landscape for the length-dependent co-translational folding of FLN5, plotted relative to N, from analysis of spectra shown in Fig. 2. Error bars indicate errors propagated from bootstrapping of residuals from NMR line shape fittings.
Intermediates in co-translational multi-domain folding
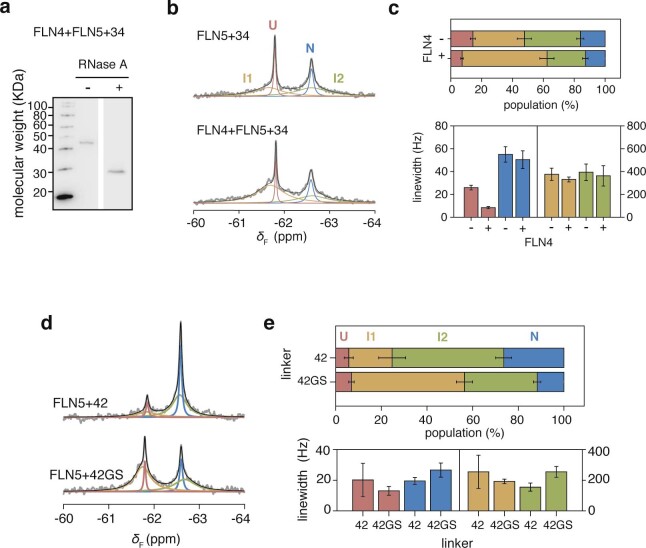
Finally, we considered the co-translational folding of FLN5 within the multi-domain protein. Selective 19F labelling of a tandem FLN4 + FLN5 + 34 RNC at the same position (residue 655) enabled a comparative analysis to assess the impact of the neighbouring FLN4 on the folding of FLN5. We observed four NMR resonances, indicating that folding remained four-state, with no significant changes in the line-width of N (Extended Data Fig. 10), the latter suggesting that the two domains tumble relatively independently from each other. At 34 residues from the PTC, we found that the presence of FLN4 increases the stabilities of I1, I2 and N (∆∆GX–U of −0.7 to −0.2 kcal mol−1, where X = I1, I2 or N). To examine the effect on the folding of FLN5 of its other neighbouring domain, we replaced the FLN6 linking residues with a poly(glycine–serine) sequence in an FLN5 + 42 RNC (Extended Data Fig. 10). This resulted in destablization of both I2 and N (∆∆GX–U of 0.4 to 0.6 kcal mol−1) and a stabilization of I1 (∆∆GI1–U ≈ −0.4 kcal mol−1). Therefore, the data show that the neighbouring domains stabilize N and also appear to modulate the stabilities of the intermediate states of FLN5, which persist within the tandem repeat protein. This complex interplay of inter-domain interactions and ribosome binding (Fig. 5) is likely to be modulated by nascent chain length40, and thus may contribute to regulating multi-domain folding.
Extended Data Fig. 10. Effect of neighbouring domains on the co-translational folding of FLN5.
a, Anti-hexahistidine western blot of the tandem FLN4 + FLN5 + 34 RNC with and without RNase A treatment. Representative data shown from two independent repeats. b, 1D 19F NMR spectra of FLN5 + 34 and FLN4 + FLN5 + 34 RNCs. c, Analysis of linewidths and populations from lineshape fittings of spectra shown in b. d, 1D 19F NMR spectra of FLN5 + 42 RNC with linker residues deriving from FLN6 and with a poly(GS) linker; the line shape fittings were used to determine the populations and line widths as shown in e. All error bars indicate errors (propagated) from bootstrapping of residuals from NMR line shape fittings.
Discussion
In this work, we have developed an experimental strategy to examine the structures, thermodynamics and kinetics of inherently heterogenous populations of nascent chains as they begin to fold outside the ribosome exit tunnel. The near-dead-time-free 1D 19F NMR experiments afford greater spectroscopic sensitivity relative to other isotopic labelling schemes, and thus enable detection of highly broadened resonances within spectra free of background signal. In the case of FLN5, 19F NMR enables direct, quantitative measurements of its co-translational intermediates that are closely associated to the ribosome surface, and their identification can provide a structural basis on which to model specific conformations within innately sparse cryo-EM densities of dynamic nascent chains. The strategy thus enables examination of the possible conformations accessible to the nascent polypeptide chain at equilibrium, and is highly amenable to other nascent chain systems, permitting expansion of RNC studies by NMR to larger, more complex multi-domain proteins.
The formation of co-translational intermediates can be regulated kinetically on the ribosome through variations in translation rate1,41 and stalling induced by the nascent chain20,42. Here, we show that the ribosome exerts a strong thermodynamic effect on the co-translational intermediates of FLN5, resulting in significantly higher stabilities relative to those off the ribosome (∆∆GI–U ≈ +1.4–5.2 kcal mol−1; Fig. 6a). Moreover, a wider folding transition is observed on the ribosome (>36 versus ~12 residues off the ribosome) during which the difference in stabilities between the intermediates and N is only <1 kcal mol−1 (Extended Data Fig. 9). Under the quasi-equilibrium conditions in which co-translational folding occurs9, the wider folding transition likely enables population of the intermediates during the relative slow rate of translation. Moreover, combined with their slow interconversion rates (Extended Data Fig. 5), these observations point towards competing (not necessarily unproductive) processes that increase the energy barriers between the states. This would result in a rugged energy landscape, which could provide some resistance to external perturbations to its folding pathway. Experiments with the rationally designed charge mutants show that electrostatic interactions with the ribosome (Fig. 5) provide one mechanism by which partial folds are selectively stabilized co-translationally, although it is likely that there are other stabilizing effects, such as the presence of neighbouring domains (Extended Data Fig. 10) and hydrophobic interactions43. Such holdase activity has also been observed for molecular chaperones, such as the ribosome-associated trigger factor5,44, which assist in protein folding by promoting partial folds to narrow the nascent chain’s stochastic conformational search for its native state. Our observations therefore corroborate the view of the ribosome as the first molecular chaperone that engages the nascent chain.
In summary, our 19F NMR data describe how the ribosome alters the folding pathway of a nascent multi-domain protein by selectively stabilizing partially folded conformations. This has implications for our understanding of intermediates in other co-translational processes, such as misfolding20 and assembly19, and as potential druggable targets45.
Methods
Sample preparation
Using site-directed mutagenesis, amber mutations were site-specifically introduced into plasmids encoding isolated protein or RNC, the latter comprising an arrest-enhanced variant of SecM with the sequence FSTPVWIWWWPRIRGPP (Extended Data Fig. 1). After co-transformation into BL21(DE3) Escherichia coli with the pEVOL-pCNF-RS suppressor plasmid33,34, cells were grown using a previously described protocol23 with the following modifications to incorporate non-natural amino acids: cultures were supplemented with arabinose (0.2% (w/v)) to induce expression of the orthogonal pair; the EM9 expression media was further supplemented with 4-trifluoromethyl-l-phenyl alanine (1 mM) and the culture incubated for 15 min at 37 °C before addition of IPTG (1 mM) and further incubation of 1 h (RNCs) or 4 h (isolated protein). Isolated protein and RNC constructs were purified and their quality biochemically assessed as previously described23,30.
NMR spectroscopy
NMR data were recorded at 298 K, unless stated otherwise, and acquired using TopSpin 3.5pl2 on a 500 MHz Bruker Avance III spectrometer (19F NMR) and a 800 MHz Bruker Avance III HD spectrometer (1H,15N NMR), both equipped with TCI cryoprobes. All RNC (6.4–15.0 μM) and isolated protein (100 μM) samples were prepared in Tico buffer containing 10 mM HEPES buffer, 30 mM NH4Cl, 12 mM MgCl2 and 2 mM beta-mercaptoethanol, at pH 7.5, containing 10% D2O and 0.001% sodium trimethylsilylpropanesulfonate. Multiple 1D 19F pulse-acquire experiments were recorded in succession with an acquisition time of 350 ms and a recycle delay of 3 s to ensure complete relaxation between each scan and thereby enable quantification of peak integrals. Where sensitivity was permissible, experiments were interleaved with 19F stimulated-echo diffusion measurements, recorded using a diffusion delay of 100 ms and 4 ms trapezoidal gradient pulses with gradient strengths of 0.027 and 0.513 T m−1. The 2D 1H,15N-SOFAST HMQC experiments46 were recorded with acquisition times of 50.4 and 29.5 ms in the direct and indirect dimensions, respectively, and a recycle delay of 100 ms. The 19F CEST measurements36 were recorded with an acquisition time of 200 ms and a recycle delay of 30 ms, with a weak B1 field of 15 Hz applied for a saturation time of 800 ms at saturation frequencies of either −40, −61.2 and −61.3 ppm, or −40, −62.2, −61.8 and −62.6 ppm. The 19F on-resonance R1ρ measurements47 were recorded using different spin-lock times with a spin-lock field of 7,500 Hz and the 19F frequency carrier centred at −62.6 ppm (isolated) or −62.2 ppm (RNC).
Data were processed and analysed with nmrPipe48, CCPN Analysis49, MATLAB (R2014b, The MathWorks Inc.) and Julia 1.5 (ref. 50). The time-domain 19F NMR spectra were multiplied with an exponential window function with a line broadening factor of 10 Hz, unless stated otherwise, prior to Fourier transformation. The 1D spectra were imported into MATLAB for baseline correction to eliminate background signal deriving from Teflon within the spectrometer probe, and subsequent analysis using Lorentzian functions. Reliable, quantitative measurements from line-shape fitting can be impacted by factors such as low signal-to-noise and spectral overlap; errors were therefore calculated by bootstrapping of residuals using multiple fittings51, and the residuals after fits were quantified. Where no resonance was observed for a state (detection level of ~5%), the error for population of the absent state was estimated from the spectral noise. The spectra were initially analysed individually (or summed with additional spectra until sufficient signal-to-noise was achieved) to assess sample integrity. Data indicating nascent chain release or sample degradation (Extended Data Fig. 2), through changes in line-widths, signal intensity or chemical shifts, were not used in the summation of spectra to produce the final spectrum, which was subjected to a final round of fitting and analysis. The number of peaks fitted to each spectrum was confirmed by a Bayesian analysis of fits performed on the NMR data in the time domain52. Similar populations of each state were obtained by analysis of NMR data in both the time and frequency domains.
CG MD simulations
We used MD simulations with the Cα structure-based potential generated by SMOG 2.3 (refs. 53,54) to simulate the isolated FLN5 and its length variants as well as RNCs. The original CG potential is defined only for proteins, and we extended it to RNCs by describing rRNA with three beads per nucleotide and placing them at the P, C4′ and N3 atom positions17. Additionally, the electrostatic interactions between the ribosome and the nascent chain were introduced using Debye–Hückel theory55, with parameters chosen to reproduce the experimentally observed bound populations of unfolded RNCs17. The model of ribosome used in RNC simulations was derived from the high-resolution E. coli structure (PDB no. 4YBB; ref. 56) and consisted of the exit tunnel and ribosome surface surrounding it, which we defined based on the contact analysis from our previous simulations17. Atoms of the ribosome model were kept fixed during MD simulations. Each nascent chain starting structure, combining His-tag, FLN5 domain, FLN6 linker and arrest-enhanced SecM, was manually modelled inside the exit tunnel as an unfolded polypeptide chain and attached to the P-site tRNA via the SecM C-terminal proline residue, which was fixed during the simulations. Starting structures for the MD simulations of isolated full-length FLN5, as well as two truncations (FLN5∆6 and FLN5∆9), were generated from the FLN5 crystal structure (PDB no. 1QFH). The nascent chain native contacts were used in the structure-based potential as the only attractive non-bonded interactions that drive protein folding based on the principle of minimal frustration57, and were defined based on the FLN5 crystal structure using the OV + rCSU method58 and modelled with the Lennard-Jones potential. In the structure-based MD simulations (as they are set up in SMOG), we use reduced units (so the length scale, time scale, mass scale and energy scale are all equal to 1 with the only exception that the Boltzmann constant is kB = 0.00831451, as it is hardwired in GROMACS); hence, we do not have a direct correspondence between experimental temperature and the one used to set up simulations. To mimic the experimental conditions in the MD simulations with a structure-based potential, we chose the temperature (120 K) of the simulations so that for the isolated FLN5 and both truncations (FLN5∆6 and FLN5∆9), the obtained populations are consistent with NMR observations. We used the same temperature for the RNC MD simulations.
We used an enhanced sampling method to sample the whole free energy landscape more efficiently on the ribosome. We applied Parallel Biased Metadynamics (PBMetaD38) with 12 walkers and with ten collective variables capturing the folding process: the ratio of the native contacts (Q), the radius of gyration and eight collective variables describing the ratio of the native contacts between each pair of strands: A–B, A′–G, B–E, C–F, C–C′, D–E, F–F′ and F–G. Gaussians corresponding to the bias potential were added every 2,000 steps with the height of 0.5, and the bias factor was set to 10. Simulations were run using Langevin dynamics for 3 × 10⁸ time steps in GROMACS 4.5.7 (ref. 59) using PLUMED 2.6 (ref. 60) for introducing PBMetaD. Convergence was assessed using block analysis (Extended Data Fig. 7) and trajectories analysed using PLUMED, MDAnalysis61 and VMD62.
All-atom electron-density-guided MD
For density-guided MD simulations, we used all-atom structure-based models generated with SMOG53,54 and native contacts described based on the FLN5 crystal structure; however, to fit the intermediate state, we removed contacts involving the G-strand. These MD simulations, recently introduced to GROMACS63,64, employ the gradient of similarity, defined using cross-correlation between a simulated density and an experimental cryo-EM density, as an additional force that is applied to atoms of the system. We used three previously published cryo-EM maps31 describing two states of FLN5 + 45 and one state of FLN5 + 47 RNCs. We set up ten simulations for each map, starting from different initial nascent chain positions. We used an adaptive force scaling protocol, during which the simulation slowly increases the force constant that is scaling the similarity measure (cross-correlation) in the effective potential, and thus increasing the force that drives the structure into the EM density. Finally, we stopped the simulations and selected the final structures using criteria previously described. Based on each model, we simulated its density at 10 Å resolution and compared it to the experimental cryo-EM density of the RNC using cross-correlation as defined in ChimeraX 1.4 (Extended Data Fig. 8; ref. 65). The cross-correlations obtained were compared against those from initial simulations with all native FLN5 contacts.
Reporting summary
Further information on research design is available in the Nature Research Reporting Summary linked to this article.
Online content
Any methods, additional references, Nature Research reporting summaries, source data, extended data, supplementary information, acknowledgements, peer review information; details of author contributions and competing interests; and statements of data and code availability are available at 10.1038/s41557-022-01004-0.
Supplementary information
Acknowledgements
We acknowledge use of the UCL Biomolecular NMR Centre and thank A. Figueiredo for his technical support. This work was supported by a Wellcome Trust Investigator Award (to J.C., 206409/Z/17/Z). Computational resources were funded by the Interdisciplinary Centre for Mathematical and Computational Modelling, University of Warsaw (to T.W. and J.C., GB77-14 and G85-977, respectively).
Extended data
Source data
Source data.
Source data.
Unprocessed western blots.
Source data.
Source data.
Source data.
Source data.
Source data.
Source data.
Unprocessed gels and western blots.
Source data.
Source data.
Source data.
Source data.
Source data.
Source data.
Source data.
Source data.
Unprocessed western blots.
Author contributions
Conceptualization: S.H.S.C., T.W. and J.C. Methodology: S.H.S.C., T.W., G.J.F.v.S., C.A.W., N.B., L.D.C. and J.C. Investigation: S.H.S.C., T.W., J.O.S., A.M.E.C., L.F.W., M.A. and C.A.W. Visualization: S.H.S.C., T.W. and C.A.W. Funding acquisition: T.W., L.D.C. and J.C. Project administration: S.H.S.C. and J.C. Supervision: S.H.S.C., L.D.C. and J.C. Writing the original draft: S.H.S.C. and J.C. Reviewing the paper and editing: S.H.S.C., T.W., C.A.W., L.D.C. and J.C.
Peer review
Peer review information
Nature Chemistry thanks Dominique Frueh, Robert Prosser and the other, anonymous, reviewer(s) for their contribution to the peer review of this work.
Data availability
Data supporting the findings of this study are included in the article, source data and extended data. The PDB structure 1QFH was used in this study. Source data are provided with this paper.
Code availability
NMR pulse sequences are available on Github (https://github.com/chriswaudby/pp). Codes used to fit the NMR spectra are available on Guthub (https://github.com/shschan/NMR-fit).
Competing interests
The authors declare no competing interests.
Footnotes
Publisher’s note Springer Nature remains neutral with regard to jurisdictional claims in published maps and institutional affiliations.
Extended data
is available for this paper at 10.1038/s41557-022-01004-0.
Supplementary information
The online version contains supplementary material available at 10.1038/s41557-022-01004-0.
References
- 1.Waudby CA, Dobson CM, Christodoulou J. Nature and regulation of protein folding on the ribosome. Trends Biochem. Sci. 2019;44:914–926. doi: 10.1016/j.tibs.2019.06.008. [DOI] [PMC free article] [PubMed] [Google Scholar]
- 2.Cassaignau AME, Cabrita LD, Christodoulou J. How does the ribosome fold the proteome? Annu. Rev. Biochem. 2020;89:389–415. doi: 10.1146/annurev-biochem-062917-012226. [DOI] [PubMed] [Google Scholar]
- 3.Chiti F, Dobson CM. Protein misfolding, functional amyloid, and human disease. Annu. Rev. Biochem. 2006;75:333–366. doi: 10.1146/annurev.biochem.75.101304.123901. [DOI] [PubMed] [Google Scholar]
- 4.Hartl FU, Bracher A, Hayer-Hartl M. Molecular chaperones in protein folding and proteostasis. Nature. 2011;475:324–332. doi: 10.1038/nature10317. [DOI] [PubMed] [Google Scholar]
- 5.Deckert, A. et al. Common sequence motifs of nascent chains engage the ribosome surface and trigger factor. Proc. Natl Acad. Sci. USA118, e2103015118. [DOI] [PMC free article] [PubMed]
- 6.Voss NR, Gerstein M, Steitz TA, Moore PB. The geometry of the ribosomal polypeptide exit tunnel. J. Mol. Biol. 2006;360:893–906. doi: 10.1016/j.jmb.2006.05.023. [DOI] [PubMed] [Google Scholar]
- 7.Lu J, Deutsch C. Folding zones inside the ribosomal exit tunnel. Nat. Struct. Mol. Biol. 2005;12:1123–1129. doi: 10.1038/nsmb1021. [DOI] [PubMed] [Google Scholar]
- 8.Liutkute, M., Maiti, M., Samatova, E., Enderlein, J. & Rodnina, M. V. Gradual compaction of the nascent peptide during cotranslational folding on the ribosome. Elife10.7554/eLife.60895 (2020). [DOI] [PMC free article] [PubMed]
- 9.Holtkamp W, et al. Cotranslational protein folding on the ribosome monitored in real time. Science. 2015;350:1104–1107. doi: 10.1126/science.aad0344. [DOI] [PubMed] [Google Scholar]
- 10.Su, T. et al. The force-sensing peptide VemP employs extreme compaction and secondary structure formation to induce ribosomal stalling. Elife10.7554/eLife.25642 (2017). [DOI] [PMC free article] [PubMed]
- 11.Tu L, Khanna P, Deutsch C. Transmembrane segments form tertiary hairpins in the folding vestibule of the ribosome. J. Mol. Biol. 2014;426:185–198. doi: 10.1016/j.jmb.2013.09.013. [DOI] [PMC free article] [PubMed] [Google Scholar]
- 12.Nilsson OB, et al. Cotranslational protein folding inside the ribosome exit tunnel. Cell Rep. 2015;12:1533–1540. doi: 10.1016/j.celrep.2015.07.065. [DOI] [PMC free article] [PubMed] [Google Scholar]
- 13.Kudva, R. et al. The shape of the bacterial ribosome exit tunnel affects cotranslational protein folding. Elife10.7554/eLife.36326 (2018). [DOI] [PMC free article] [PubMed]
- 14.Deckert A, et al. Structural characterization of the interaction of α-synuclein nascent chains with the ribosomal surface and trigger factor. Proc. Natl Acad. Sci. USA. 2016;113:5012–5017. doi: 10.1073/pnas.1519124113. [DOI] [PMC free article] [PubMed] [Google Scholar]
- 15.Cabrita LD, et al. A structural ensemble of a ribosome-nascent chain complex during cotranslational protein folding. Nat. Struct. Mol. Biol. 2016;23:278–285. doi: 10.1038/nsmb.3182. [DOI] [PMC free article] [PubMed] [Google Scholar]
- 16.Knight AM, et al. Electrostatic effect of the ribosomal surface on nascent polypeptide dynamics. ACS Chem. Biol. 2013;8:1195–1204. doi: 10.1021/cb400030n. [DOI] [PubMed] [Google Scholar]
- 17.Cassaignau AME, et al. Interactions between nascent proteins and the ribosome surface inhibit co-translational folding. Nat. Chem. 2021;13:1214–1220. doi: 10.1038/s41557-021-00796-x. [DOI] [PMC free article] [PubMed] [Google Scholar]
- 18.Kaiser CM, Goldman DH, Chodera JD, Tinoco I, Jr., Bustamante C. The ribosome modulates nascent protein folding. Science. 2011;334:1723–1727. doi: 10.1126/science.1209740. [DOI] [PMC free article] [PubMed] [Google Scholar]
- 19.Bertolini M, et al. Interactions between nascent proteins translated by adjacent ribosomes drive homomer assembly. Science. 2021;371:57–64. doi: 10.1126/science.abc7151. [DOI] [PMC free article] [PubMed] [Google Scholar]
- 20.Plessa E, et al. Nascent chains can form co-translational folding intermediates that promote post-translational folding outcomes in a disease-causing protein. Nat. Commun. 2021;12:6447. doi: 10.1038/s41467-021-26531-1. [DOI] [PMC free article] [PubMed] [Google Scholar]
- 21.Brockwell DJ, Smith DA, Radford SE. Protein folding mechanisms: new methods and emerging ideas. Curr. Opin. Struct. Biol. 2000;10:16–25. doi: 10.1016/S0959-440X(99)00043-3. [DOI] [PubMed] [Google Scholar]
- 22.Cabrita LD, Hsu ST, Launay H, Dobson CM, Christodoulou J. Probing ribosome-nascent chain complexes produced in vivo by NMR spectroscopy. Proc. Natl Acad. Sci. USA. 2009;106:22239–22244. doi: 10.1073/pnas.0903750106. [DOI] [PMC free article] [PubMed] [Google Scholar]
- 23.Cassaignau AM, et al. A strategy for co-translational folding studies of ribosome-bound nascent chain complexes using NMR spectroscopy. Nat. Protoc. 2016;11:1492–1507. doi: 10.1038/nprot.2016.101. [DOI] [PubMed] [Google Scholar]
- 24.Waudby CA, Launay H, Cabrita LD, Christodoulou J. Protein folding on the ribosome studied using NMR spectroscopy. Prog. Nucl. Magn. Reson. Spectrosc. 2013;74:57–75. doi: 10.1016/j.pnmrs.2013.07.003. [DOI] [PMC free article] [PubMed] [Google Scholar]
- 25.Burridge C, et al. Nascent chain dynamics and ribosome interactions within folded ribosome–nascent chain complexes observed by NMR spectroscopy. Chem. Sci. 2021;12:13120–13126. doi: 10.1039/D1SC04313G. [DOI] [PMC free article] [PubMed] [Google Scholar]
- 26.Chan, S. H. S., Waudby, C. A. & Christodoulou, J. NMR snapshots of nascent chains emerging from the ribosome during biosynthesis. Preprint at ChemRxiv10.26434/chemrxiv-2022-0lmsp (2022).
- 27.Budisa N. Expanded genetic code for the engineering of ribosomally synthetized and post-translationally modified peptide natural products (RiPPs) Curr. Opin. Biotechnol. 2013;24:591–598. doi: 10.1016/j.copbio.2013.02.026. [DOI] [PubMed] [Google Scholar]
- 28.Kitevski-LeBlanc JL, Prosser RS. Current applications of 19F NMR to studies of protein structure and dynamics. Prog. Nucl. Magn. Reson. Spectrosc. 2012;62:1–33. doi: 10.1016/j.pnmrs.2011.06.003. [DOI] [PubMed] [Google Scholar]
- 29.Boeszoermenyi A, et al. Aromatic 19F-13C TROSY: a background-free approach to probe biomolecular structure, function, and dynamics. Nat. Methods. 2019;16:333–340. doi: 10.1038/s41592-019-0334-x. [DOI] [PMC free article] [PubMed] [Google Scholar]
- 30.Waudby CA, et al. Systematic mapping of free energy landscapes of a growing filamin domain during biosynthesis. Proc. Natl Acad. Sci. USA. 2018;115:9744–9749. doi: 10.1073/pnas.1716252115. [DOI] [PMC free article] [PubMed] [Google Scholar]
- 31.Javed, A. et al. Visualising nascent chain dynamics at the ribosome exit tunnel by cryo-electron microscopy. Preprint at bioRxiv10.1101/722611 (2019).
- 32.Hammill JT, Miyake-Stoner S, Hazen JL, Jackson JC, Mehl RA. Preparation of site-specifically labeled fluorinated proteins for 19F-NMR structural characterization. Nat. Protoc. 2007;2:2601–2607. doi: 10.1038/nprot.2007.379. [DOI] [PubMed] [Google Scholar]
- 33.Young DD, et al. An evolved aminoacyl-tRNA synthetase with atypical polysubstrate specificity. Biochemistry. 2011;50:1894–1900. doi: 10.1021/bi101929e. [DOI] [PMC free article] [PubMed] [Google Scholar]
- 34.Agostini F, et al. Biocatalysis with unnatural amino acids: enzymology meets xenobiology. Angew. Chem. Int. Ed. 2017;56:9680–9703. doi: 10.1002/anie.201610129. [DOI] [PubMed] [Google Scholar]
- 35.Seifert MH, et al. Slow exchange in the chromophore of a green fluorescent protein variant. J. Am. Chem. Soc. 2002;124:7932–7942. doi: 10.1021/ja0257725. [DOI] [PubMed] [Google Scholar]
- 36.Kim TH, et al. The role of dimer asymmetry and protomer dynamics in enzyme catalysis. Science. 2017;355:eaag2355. doi: 10.1126/science.aag2355. [DOI] [PubMed] [Google Scholar]
- 37.Vallurupalli P, Bouvignies G, Kay LE. Studying “invisible” excited protein states in slow exchange with a major state conformation. J. Am. Chem. Soc. 2012;134:8148–8161. doi: 10.1021/ja3001419. [DOI] [PubMed] [Google Scholar]
- 38.Pfaendtner J, Bonomi M. Efficient sampling of high-dimensional free-energy landscapes with parallel bias metadynamics. J. Chem. Theory Comput. 2015;11:5062–5067. doi: 10.1021/acs.jctc.5b00846. [DOI] [PubMed] [Google Scholar]
- 39.Guzman-Luna V, Fuchs AM, Allen AJ, Staikos A, Cavagnero S. An intrinsically disordered nascent protein interacts with specific regions of the ribosomal surface near the exit tunnel. Commun. Biol. 2021;4:1236. doi: 10.1038/s42003-021-02752-4. [DOI] [PMC free article] [PubMed] [Google Scholar]
- 40.Liu K, Maciuba K, Kaiser CM. The ribosome cooperates with a chaperone to guide multi-domain protein folding. Mol. Cell. 2019;74:310–319 e317. doi: 10.1016/j.molcel.2019.01.043. [DOI] [PMC free article] [PubMed] [Google Scholar]
- 41.Zhang G, Hubalewska M, Ignatova Z. Transient ribosomal attenuation coordinates protein synthesis and co-translational folding. Nat. Struct. Mol. Biol. 2009;16:274–280. doi: 10.1038/nsmb.1554. [DOI] [PubMed] [Google Scholar]
- 42.Murakami A, Nakatogawa H, Ito K. Translation arrest of SecM is essential for the basal and regulated expression of SecA. Proc. Natl Acad. Sci. USA. 2004;101:12330–12335. doi: 10.1073/pnas.0404907101. [DOI] [PMC free article] [PubMed] [Google Scholar]
- 43.Tian P, et al. Folding pathway of an Ig domain is conserved on and off the ribosome. Proc. Natl Acad. Sci. USA. 2018;115:E11284–E11293. doi: 10.1073/pnas.1810523115. [DOI] [PMC free article] [PubMed] [Google Scholar]
- 44.Mashaghi A, et al. Reshaping of the conformational search of a protein by the chaperone trigger factor. Nature. 2013;500:98–101. doi: 10.1038/nature12293. [DOI] [PubMed] [Google Scholar]
- 45.Spagnolli G, et al. Pharmacological inactivation of the prion protein by targeting a folding intermediate. Commun. Biol. 2021;4:62. doi: 10.1038/s42003-020-01585-x. [DOI] [PMC free article] [PubMed] [Google Scholar]
- 46.Schanda P, Kupce E, Brutscher B. SOFAST-HMQC experiments for recording two-dimensional heteronuclear correlation spectra of proteins within a few seconds. J. Biomol. NMR. 2005;33:199–211. doi: 10.1007/s10858-005-4425-x. [DOI] [PubMed] [Google Scholar]
- 47.Overbeck JH, Kremer W, Sprangers R. A suite of 19F based relaxation dispersion experiments to assess biomolecular motions. J. Biomol. NMR. 2020;74:753–766. doi: 10.1007/s10858-020-00348-4. [DOI] [PMC free article] [PubMed] [Google Scholar]
- 48.Delaglio F, et al. NMRPipe: a multidimensional spectral processing system based on UNIX pipes. J. Biomol. NMR. 1995;6:277–293. doi: 10.1007/BF00197809. [DOI] [PubMed] [Google Scholar]
- 49.Skinner SP, et al. CcpNmr AnalysisAssign: a flexible platform for integrated NMR analysis. J. Biomol. NMR. 2016;66:111–124. doi: 10.1007/s10858-016-0060-y. [DOI] [PMC free article] [PubMed] [Google Scholar]
- 50.Bezanson J, Edelman A, Karpinski S, Shah VB. Julia: a fresh approach to numerical computing. SIAM Rev. 2017;59:65–98. doi: 10.1137/141000671. [DOI] [Google Scholar]
- 51.Efron, B. & Tibshirani, R. An Introduction to the Bootstrap (Chapman & Hall, 1993).
- 52.Matviychuk Y, von Harbou E, Holland DJ. An experimental validation of a Bayesian model for quantification in NMR spectroscopy. J. Magn. Reson. 2017;285:86–100. doi: 10.1016/j.jmr.2017.10.009. [DOI] [PubMed] [Google Scholar]
- 53.Noel JK, et al. SMOG 2: a versatile software package for generating structure-based models. PLoS Comput. Biol. 2016;12:e1004794. doi: 10.1371/journal.pcbi.1004794. [DOI] [PMC free article] [PubMed] [Google Scholar]
- 54.Clementi C, Nymeyer H, Onuchic JN. Topological and energetic factors: what determines the structural details of the transition state ensemble and “en-route” intermediates for protein folding? An investigation for small globular proteins. J. Mol. Biol. 2000;298:937–953. doi: 10.1006/jmbi.2000.3693. [DOI] [PubMed] [Google Scholar]
- 55.Levi M, et al. Using SMOG 2 to simulate complex biomolecular assemblies. Methods Mol. Biol. 2019;2022:129–151. doi: 10.1007/978-1-4939-9608-7_6. [DOI] [PubMed] [Google Scholar]
- 56.Noeske J, et al. High-resolution structure of the Escherichia coli ribosome. Nat. Struct. Mol. Biol. 2015;22:336–341. doi: 10.1038/nsmb.2994. [DOI] [PMC free article] [PubMed] [Google Scholar]
- 57.Bryngelson JD, Onuchic JN, Socci ND, Wolynes PG. Funnels, pathways, and the energy landscape of protein folding: a synthesis. Proteins. 1995;21:167–195. doi: 10.1002/prot.340210302. [DOI] [PubMed] [Google Scholar]
- 58.Wolek K, Gomez-Sicilia A, Cieplak M. Determination of contact maps in proteins: a combination of structural and chemical approaches. J. Chem. Phys. 2015;143:243105. doi: 10.1063/1.4929599. [DOI] [PubMed] [Google Scholar]
- 59.Pronk S, et al. GROMACS 4.5: a high-throughput and highly parallel open source molecular simulation toolkit. Bioinformatics. 2013;29:845–854. doi: 10.1093/bioinformatics/btt055. [DOI] [PMC free article] [PubMed] [Google Scholar]
- 60.Tribello GA, Bonomi M, Branduardi D, Camilloni C, Bussi G. PLUMED 2: new feathers for an old bird. Comput. Phys. Commun. 2014;185:604–613. doi: 10.1016/j.cpc.2013.09.018. [DOI] [Google Scholar]
- 61.Michaud-Agrawal N, Denning EJ, Woolf TB, Beckstein O. MDAnalysis: a toolkit for the analysis of molecular dynamics simulations. J. Comput. Chem. 2011;32:2319–2327. doi: 10.1002/jcc.21787. [DOI] [PMC free article] [PubMed] [Google Scholar]
- 62.Humphrey W, Dalke A, Schulten K. VMD: visual molecular dynamics. J. Mol. Graph. 1996;14:27–38. doi: 10.1016/0263-7855(96)00018-5. [DOI] [PubMed] [Google Scholar]
- 63.Igaev, M., Kutzner, C., Bock, L. V., Vaiana, A. C. & Grubmuller, H. Automated cryo-EM structure refinement using correlation-driven molecular dynamics. Elife10.7554/eLife.43542 (2019). [DOI] [PMC free article] [PubMed]
- 64.Orzechowski M, Tama F. Flexible fitting of high-resolution X-ray structures into cryoelectron microscopy maps using biased molecular dynamics simulations. Biophys. J. 2008;95:5692–5705. doi: 10.1529/biophysj.108.139451. [DOI] [PMC free article] [PubMed] [Google Scholar]
- 65.Pettersen EF, et al. UCSF ChimeraX: structure visualization for researchers, educators, and developers. Protein Sci. 2021;30:70–82. doi: 10.1002/pro.3943. [DOI] [PMC free article] [PubMed] [Google Scholar]
- 66.Cymer F, Hedman R, Ismail N, von Heijne G. Exploration of the arrest peptide sequence space reveals arrest-enhanced variants. J. Biol. Chem. 2015;290:10208–10215. doi: 10.1074/jbc.M115.641555. [DOI] [PMC free article] [PubMed] [Google Scholar]
Associated Data
This section collects any data citations, data availability statements, or supplementary materials included in this article.
Supplementary Materials
Data Availability Statement
Data supporting the findings of this study are included in the article, source data and extended data. The PDB structure 1QFH was used in this study. Source data are provided with this paper.
NMR pulse sequences are available on Github (https://github.com/chriswaudby/pp). Codes used to fit the NMR spectra are available on Guthub (https://github.com/shschan/NMR-fit).


