Abstract
The gut microbiota influences animal neurodevelopment and behavior but has not previously been documented to affect group-level properties of social organisms. Here we use honeybees to probe the effect of the gut microbiota on host social behavior. We found that the microbiota increased the rate and specialization of head-to-head interactions between bees. Microbiota colonization was associated with higher abundances of one third of the metabolites detected in the brain, including amino acids with roles in synaptic transmission and brain energetic function. Some of these metabolites were significant predictors of the number of social interactions of bees. Microbiota colonization also affected brain transcriptional processes related to amino acid metabolism and epigenetic modifications in a brain region involved in sensory perception. These results demonstrate that the gut microbiota modulates the emergent colony social network of honeybees, and suggest changes in chromatin accessibility and amino acid biosynthesis as underlying processes.
Understanding which factors regulate the organization of animal societies is a long-standing goal of biological research 1. While various genetic and ecological factors have been associated with the diversity of social organization across the animal kingdom 2–5, much less is known about the role of symbiotic interactions between animal hosts and their gut microbiota, which is increasingly recognized as an important modulator of neurophysiology. Bacterial metabolites and signals produced in the gut can reach the brain and elicit local host responses that affect the host nervous system via endocrine (e.g., cortisol), immune (e.g., cytokines) and neural (vagus and enteric nervous system) pathways 6–8. There is also accumulating evidence linking the gut microbiome to social behavior and its dysfunctions (e.g., autism-spectrum disorders) 9–12. However, effects on social behavior have typically been investigated during one-to-one encounters between gnotobiotic animals, and in model organisms that do not naturally express complex social structure 7,8,13–17. Whether and how the diversity of gut microbes hosted by individual animals influences the emergent properties of group living remains unknown.
Eusocial insects (ants, some bees, some wasps, and termites) represent useful models to address this question, as they live in complex societies and exhibit division of labor among colony members 18,19. In these societies, individuals follow simple decision-making strategies to produce elaborate social phenotypes at the group-level. Recent studies have suggested that the gut microbiota can modulate cuticular odor and the level of aggressivity in ants and honeybees 20,21, and can improve the individual learning performance of bumblebees 22, effects which may alter group-level social organization. Honeybees provide a particularly powerful model to explore how the gut microbiota affects group-level social phenotypes for several reasons. First, they exhibit complex but experimentally tractable social behaviors 23,24. Second, they have a well-characterized and evolutionarily stable gut microbiota comprising relatively few species 25–27. Third, the composition of this community can be manipulated and the resulting gnotobiotic bees (i.e., those with defined microbiota) studied under controlled laboratory conditions 16,26,27. Finally, the honeybee gut microbiota has been shown to affect hormonal signaling, sugar intake and the expression of insulin-like peptide encoding genes in the head 28, indicating substantial crosstalk between the gut and the brain along what is referred to as the gut-brain axis.
Results and discussion
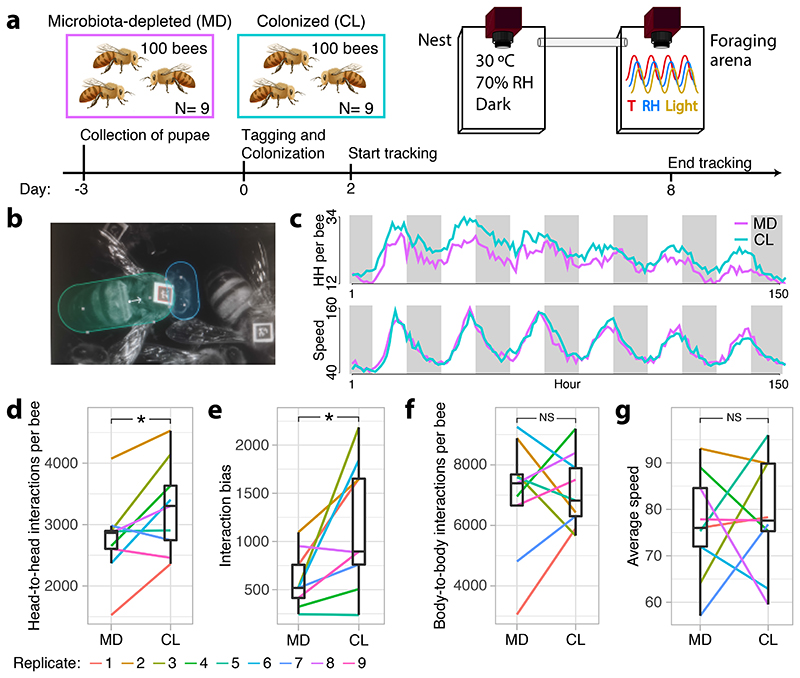
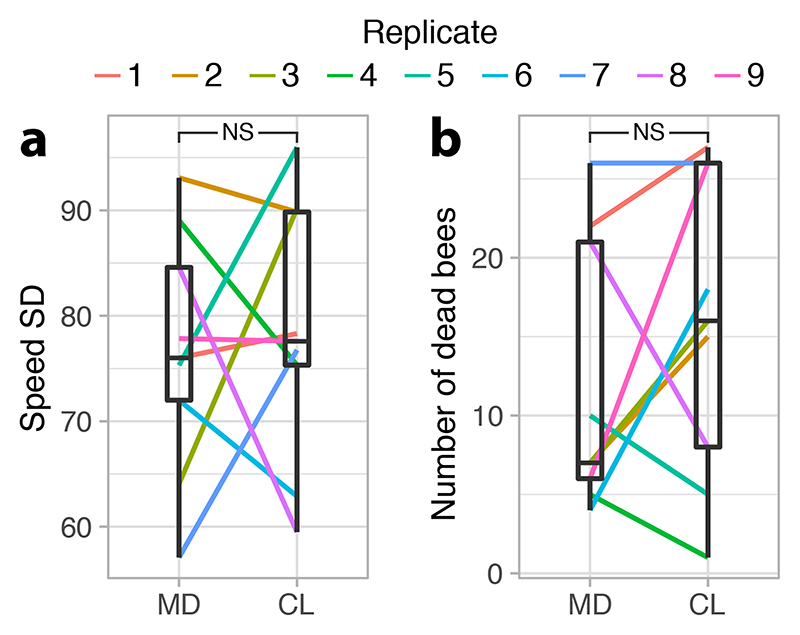
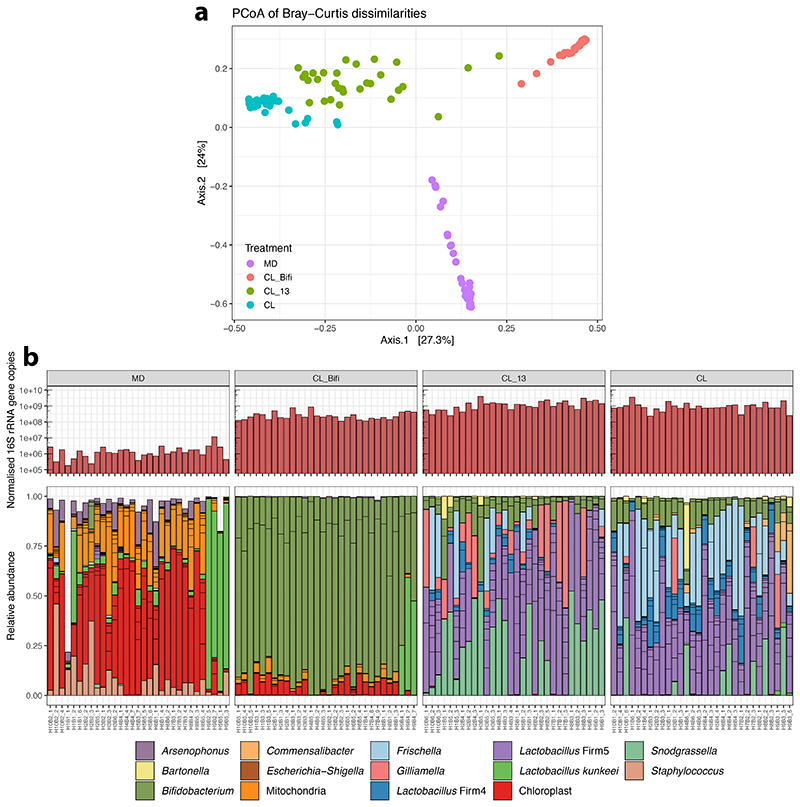
To investigate the influence of the gut microbiota on bee behavior and colony social organization, we produced gnotobiotic honeybees that were either microbiota-depleted (MD) or colonized with a homogenate of five nurse bee guts (CL) reconstituting the natural gut microbiota 28–30. We used an automated behavioral tracking system 31,32 to monitor social interactions for a week in nine pairs of sub-colonies of ~100 worker bees, starting three days after adult emergence and treatment inoculation, so that the gut microbiota would have fully established 26,27 (Fig. 1A and B and Supplementary Movie 1). The microbiota treatment led to clear differences in the abundance and taxonomic composition of the gut bacterial communities (Extended Data Fig. 1A and B; Permutational multivariate analysis of variance (PERMANOVA) using Bray-Curtis dissimilarities calculated from a matrix of absolute abundances of amplicon-sequence variants (ASVs): F1,179=78.23, R2=0.30, P<0.001). Bees in both treatments had a circadian rhythm and a pattern of interactions reflecting natural behavior (Fig. 1C and Extended Data Fig. 2). The microbiota treatment had a significant effect on behavior, with CL bees having a higher rate of head-to-head interactions than MD bees (Fig. 1C and D; paired t-test: t=2.82, df=8, P=0.02). CL bees also exhibited a much higher degree of specialization (measured by the standard deviation in edge-weight per node in the social network) than MD bees (Fig. 1E; paired t-test: t=2.93, df=8, P=0.02) suggesting that CL bees formed stronger social ties with specific subsets of nestmates, while MD bees interacted more randomly within the colony. Importantly, these differences did not simply reflect a treatment effect on overall activity level. First, there was no significant difference between CL and MD bees in the rate of contacts (interactions not involving the head of bees) (Fig. 1F; paired t-test: t=0.32, df=8, P=0.76). Second, CL and MD bees exhibited similar movement patterns (average speed and within-individual variation in speed; Fig. 1G and Extended Data Fig. 3A). And third, the gut microbiota had no significant effect on survival (Extended Data Fig. 3B; paired t-test: t=1.10, df = 8, P=0.30). Hence, these results suggest that the gut microbiota specifically promotes and structures social interactions. Simulations have shown that modularity in information spread can maximize the collective accuracy of large animal groups 33. The reduction of structure in the social networks of microbiota-depleted bees may therefore be detrimental to the overall performance of the colony.
Figure 1. The gut microbiota affects honeybee social behavior.
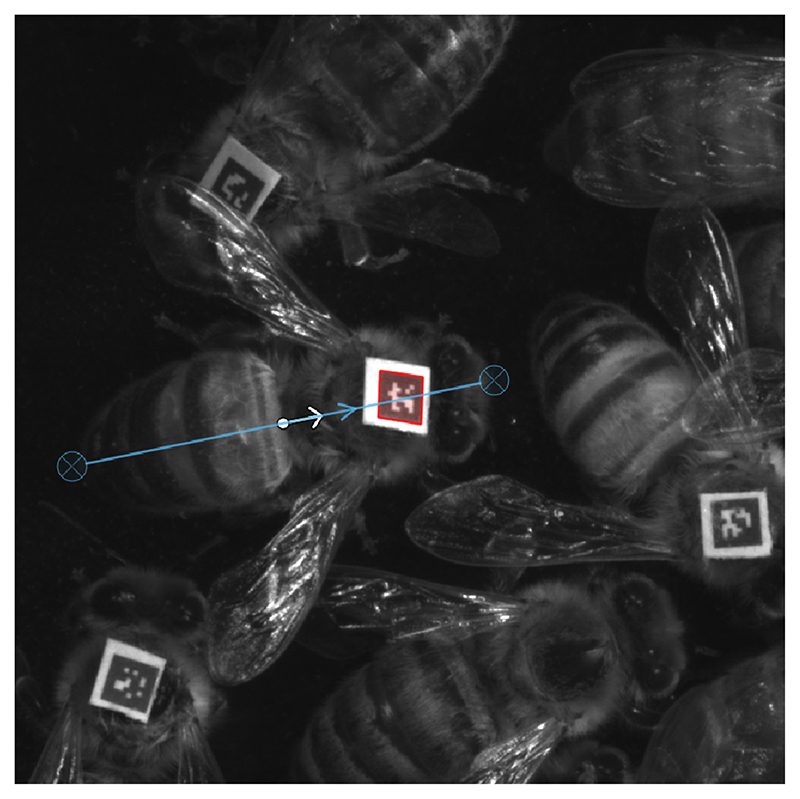
(A) Experimental design and timeline for a single experimental replicate. Gnotobiotic bees were produced from a distinct hive in each replicate by rearing pupae in an incubator and colonizing them with their treatment solution as newly emerged adults. Each sub-colony of ~100 bees could move freely between two plexiglass boxes hosted within separate climate-controlled chambers. Social interactions were quantified by monitoring the orientation and position of individual tags glued onto the thorax of each bee and (B) counting overlaps between ellipses drawn over the bees’ heads and bodies. (C) Line plots showing the number of head-to-head interactions (HH per bee) and average speed (pixels/s) per hour during 152 h of tracking averaged across all experimental replicates, and colored by gut microbiota treatment. White and grey shading represent day and night respectively. The reduction in interaction rate and speed as a function of time may reflect age-associated behavioral change, or adjustment to a novel environment (D) Average number of head-to-head interactions per bee for each sub-colony during the week of tracking. (E) Interaction bias, representing average variance in head-to-head interactions per bee per sub-colony. (F) Average number of body-to-body contacts per bee per sub-colony. (G) Average speed (pixels/s) per bee per sub-colony. Lines connect paired colonies in each experimental replicate. Box plots show the median and first and third quartiles. Whiskers show the extremal values within 1.5 times the interquartile ranges above the 75th and below the 25th percentile. * P<0.05, NS = not significant, as calculated by paired t-tests (two-sided). Head-to-head interactions per bee (D): t=2.824, df=8, P=0.022, mean of the differences=513.645, 95% confidence interval: 94.147, 933.144; Interaction bias (E): t=2.928, df=8, P=0.019, mean of the differences=584.765, 95% confidence interval: 124.215, 1045.316; Body-to-body interactions (F): t=0.317, df=8, P=0.760, mean of the differences=202.142, 95% confidence interval: -1269.376, 1673.659; Average speed (G): t=0.353, df=8, P=0.733, mean of the differences=2.716, 95% confidence interval: -15.026, 20.459.
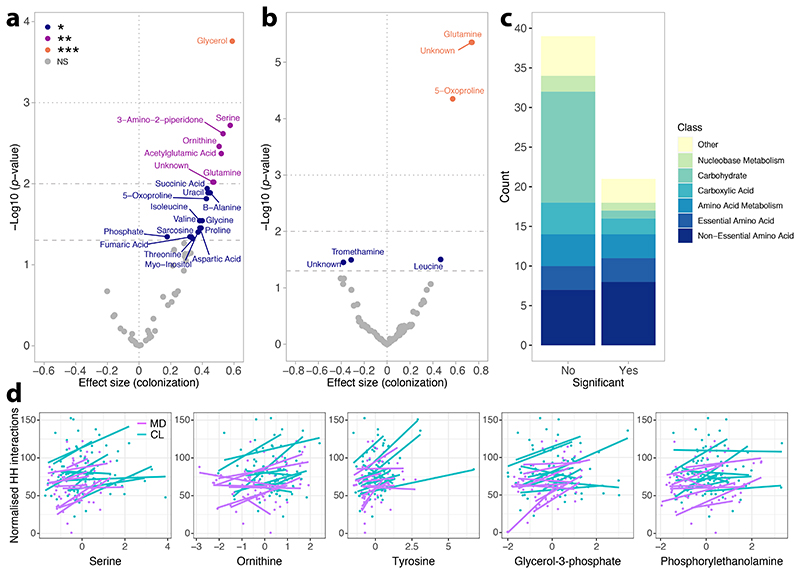
To probe how the microbiome may affect social behavior, we analyzed soluble metabolites in the brain and hemolymph of a random subset of bees across the experimental replicates (brain: CL, n=88, MD, n=79; hemolymph: CL, n=84, MD, n=80). More than a third (21/60) of the metabolites detected in the brain differed significantly in abundance between MD and CL bees (BH-adjusted P<0.05) (Fig. 2A and Supplementary Table 1). Strikingly, all of the differently abundant metabolites were more abundant in CL than in MD bee brains, and there was an over-representation of amino acids and intermediates of amino acid metabolism (Fig. 2C and Supplementary Table 2; Fisher exact test, P=0.031). CL bees had a higher abundance of three out of the six essential and eight out of the 15 non-essential amino acids 34, as well as three out of the seven metabolites linked to amino acid metabolism (Fig. 2C and Supplementary Table 2). Several of the differently abundant amino acids (e.g. serine, glutamine, aspartate, glycine) have known roles in synaptic transmission and brain energetic function 35,36. This pattern in the brain contrasted with that of the hemolymph, where less than 8% (6/76) of the metabolites were significantly differently abundant between MD and CL bees, including three that were also differently abundant in the brain (glutamine, 5-oxoproline, and an unidentified metabolite; Fig. 2B).
Figure 2. The gut microbiota increases the abundance of brain metabolites.
Volcano plots present significance (- log10 (P value)) versus effect size of linear mixed effects models for all soluble metabolites identified in the brain (A) and hemolymph (B) of tracked bees. Positive effect sizes indicate metabolites that were more abundant in the brains of CL bees than in those of MD bees. P values were corrected for multiple testing with the BH method. *** P<0.001, ** P<0.01, * P<0.05, NS = not significant. n=167 brains (A) and n=164 hemolymph (B) samples examined over nine independent experiments. (C) Stacked bars show the relative proportion of metabolites based on functional classification and plotted separately based on significance in differential abundance tests. (D) Regressions between metabolite abundance (z-score) and the number of head-to-head interactions of each bee (normalised by final group size) for the five metabolites that were significant predictors (BH-adjusted P<0.05) in linear mixed-effects models. Each regression line represents a different sub-colony and is colored by gut microbiota treatment. n=161 bees examined over nine independent experiments.
Two of the 21 metabolites that were more abundant in brains of CL bees were significant predictors of the number of head-to-head interactions (Fig. 2D and Supplementary Table 3; serine and ornithine; n=161, linear mixed-effects models fitted by REML with sub-colony as random effect, BH-adjusted P<0.05). Three other metabolites (tyrosine, glycerol-3-phosphate and phosphorylethanolamine) were also predictors of the rate of head-to-head interactions although their concentrations were not significantly different between CL and MD bees (Fig. 2D and Supplementary Table 3). By contrast, none of the 76 hemolymph metabolites were significant predictors of the number of head-to-head interactions (Supplementary Table 3; n=158, linear mixed-effects models fitted by REML with sub-colony as random effect, all BH-adjusted P>0.05). These findings suggest that the gut microbiota specifically increases the abundance of brain metabolites, which could be due to bacterial signals received from the gut or the direct transfer of microbial or dietary-derived metabolites from the gut to the brain. The latter seems likely for the three metabolites found to be more abundant in both the brain and the hemolymph of CL bees (a pattern consistent with transfer from the gut to the brain), and for essential amino acids, which the honeybee lacks the ability to produce 37.
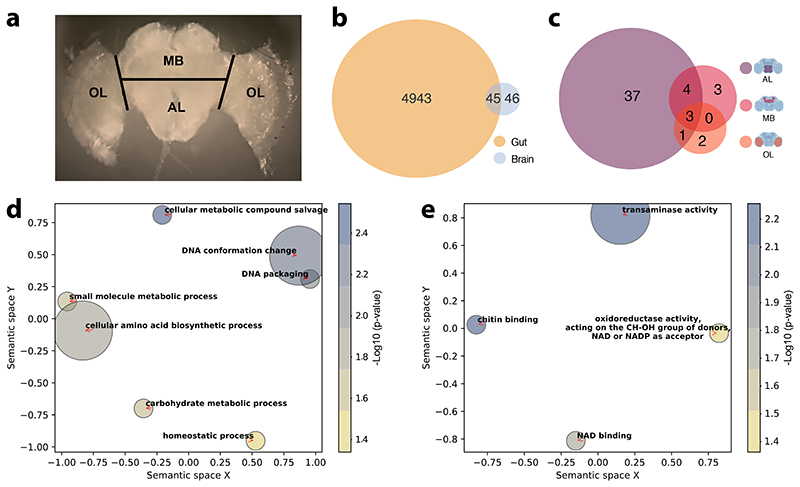
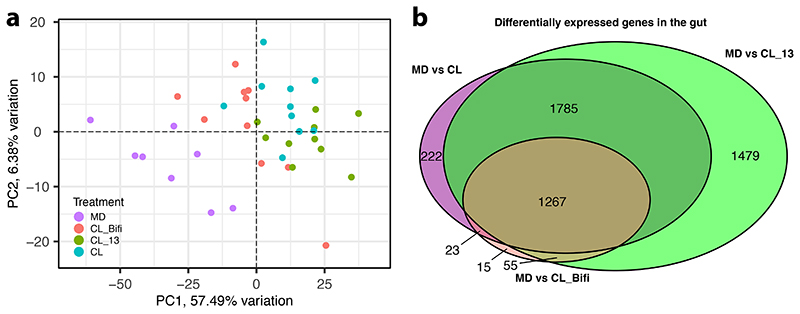
We next investigated the effect of the microbiota on gene expression in the gut and three macro-regions of the brain that are broadly responsible for learning and memory (mushroom bodies and central complex, MB), perception of olfactory and gustatory stimuli (antennal lobe and subaesophageal ganglion, AL), and visual processing (optic lobes, OL) (Fig. 3A). To do this, we reared groups of ~20 CL or MD bees in cages (n=10 for each treatment). From each cage we randomly sampled a single bee for gene expression (to avoid cage effects, see Methods) and two-three additional bees for gut microbiota analyses. We included two additional treatments (also n=10) where bees were colonized with a community of 13 strains covering most phylotypes of the honeybee gut microbiota (CL_13; Supplementary Table 4) to assess if a synthetic community could reproduce the effects of an undefined community contained in the gut homogenate, or with only Bifidobacterium asteroides, which is thought to have neuromodulating potential (CL_Bifi; 29). 16S rRNA gene analysis confirmed that the gut microbiota clearly differed in composition between the four treatments seven days after inoculation (Extended Data Fig. 4A and B; PERMANOVA using Bray-Curtis dissimilarities calculated from a matrix of absolute ASV abundances: F3,120=48.19, R2=0.55, P<0.001). In the gut, a total of 4,988 bee genes (40% of the transcriptome) were differently expressed (FDR-corrected P<0.05) between MD and the three types of CL bees (see Methods; Fig. 3B, Extended Data Fig. 5A and B, and Supplementary Table 5). Despite the higher bacterial diversity inoculated in the CL group, there were more DEGs in the comparison between MD and CL_13 than MD and CL bees. This may be due to higher loads of specific symbionts in the CL_13 group (e.g. Snodgrassella and Gilliamella; Extended Data Fig. 4B). Colonization with only B. asteroides recapitulated a considerable subset of the changes associated with full colonization: more than a quarter (1267/4753) of the genes differentially expressed between MD and one or both of CL and CL_13 were also differently expressed between MD and CL_Bifi (Extended Data Fig. 5B). Moreover, only 15 genes were differentially expressed exclusively between MD and CL_Bifi bees (Extended Data Fig. 5B).
Figure 3. The gut microbiota alters gene expression in the gut and in the AL brain region.
(A) Brain regions dissected for RNA sequencing. Black lines indicate the performed incisions. (B) Venn diagram reporting overlap in differentially expressed genes in the gut and brain across all contrasts of gut microbiota colonization treatments (CL, CL_13, and CL_Bifi) versus microbiota-depleted (MD) controls (for the brain, the reported number of DEGs includes both whole-brain and brain-region-specific comparisons, see Supplementary Table 6 and Methods). (C) Venn diagram reporting overlap in brain-region-specific contrasts of all gut microbiota colonization treatments (CL, CL_13, and CL_Bifi) versus microbiota- depleted (MD) controls. The brain icons were created with BioRender.com. Semantic similarity scatterplots summarize the list of enriched (D) Biological process and (E) Molecular function GO terms of all the 91 DEGs identified in the brain. The scatterplots show GO terms as circles arranged such that those that are most similar in two-dimensional semantic space are placed nearest to each other. Circle color represents –log10 of enrichment P value, as calculated by hypergeometric tests for over-representation: (D) cellular metabolic compound salvage (GO:0043094), P=0.003, DNA conformation change (GO:0071103), P=0.007, DNA packaging (GO:0006323), P=0.008, cellular amino acid biosynthetic process (GO:0008652), P=0.015, small molecule metabolic process (GO:0044281), P=0.024, carbohydrate metabolic process (GO:0005975), P=0.029, homeostatic process (GO:0042592), P=0.046; (E) transaminase activity (GO:0008483), P=0.006, chitin binding (GO:0008061), P=0.007, NAD binding (GO:0051287), P=0.019, oxidoreductase activity, acting on the CH-OH group of donors, NAD or NADP as acceptor (GO:0016616), P=0.044.
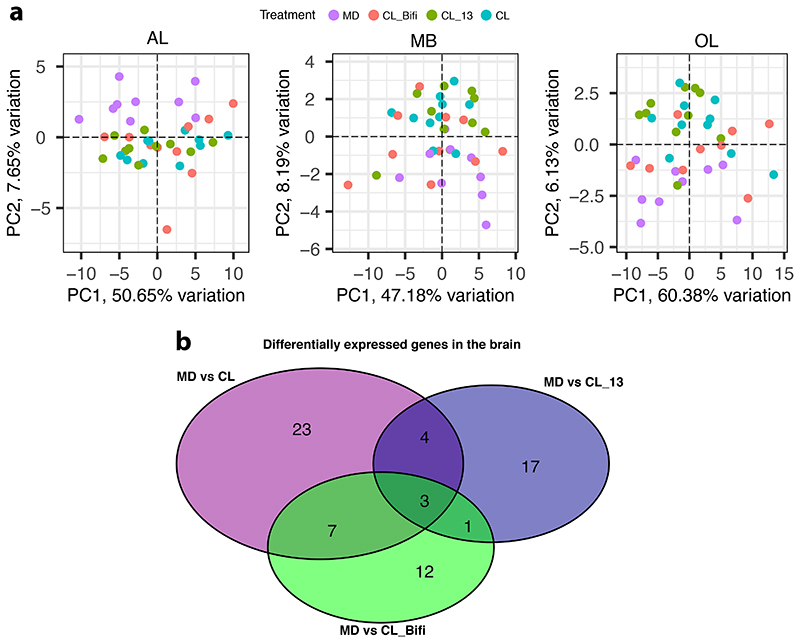
In contrast to the widespread changes in the gut, the microbiota affected the expression of relatively few genes in the brain. Only 91 genes were differentially expressed between MD bees and bees of any of the three colonization treatments (Fig. 3B and Supplementary Table 6). The proportion of these genes (45/91) that were also differentially expressed in the gut was greater than expected by chance (Fig. 3B; Hypergeometric test: representation factor = 1.23, P=0.047). The AL was the brain region with the greatest number of genes affected by the gut microbiota (Fig. 3C, Extended Data Fig. 6A and Supplementary Table 6). Inoculation with the 13-strain community (CL_13) and inoculation with B. asteroides only (CL_Bifi) had similar effects as inoculation with the homogenate of bee guts (CL) in terms of the number of differently expressed genes with respect to MD bees (25, 23 and 37, respectively; Extended Data Fig. 6B). Moreover, the overlap in the genes differently expressed between treatments was greater than expected by chance (Hypergeometric test: overlap between MD vs. CL and MD vs. CL_13, representation factor = 79.4, P<0.0001; MD vs. CL and MD vs. CL_Bifi, representation factor = 123.3, P<0.0001). Thus, colonizations with CL_13 or only B. asteroides appear to induce at least part of the effects induced by colonization with the gut homogenate. This also suggests that B. asteroides represents an important neuromodulating bacterium or that the relevant metabolites inducing these effects may be redundant between different members of the gut microbiota. Consistent with our metabolomic analyses, the differentially expressed genes were mainly enriched for Gene Ontology terms related to amino acids and their metabolism (Fig. 3D and E and Supplementary Table 7). Other enriched terms were related to the epigenetic regulation of chromosome packaging and conformation (Fig. 3D and E and Supplementary Table 7). The antennal lobes process information from the antennae, while the subaesophageal ganglion processes gustatory stimuli. While further experimentation would be required to assess causality, our gene expression and metabolomics results suggest that the gut microbiota may increase social tendency by modulating chromatin accessibility and amino acid biosynthesis and metabolism, and that these effects may be strongest in areas of the brain implicated in the perception of sensory stimuli. Previous work in mice also found that the gut microbiota affects amino acid metabolism in the host brain 38, suggesting that the mediation of the gut-brain axis via amino acid metabolism may be deeply conserved. In the brain, amino acids act as neurotransmitters, regulators of energy metabolism and neuromodulators. Imbalances in amino acids are increasingly associated with brain disease in vertebrates including humans, where they represent hallmarks of neurodegeneration and behavioural dysfunctions such as autism-spectrum disorders (ASD) 39–44.
In conclusion, our study shows that the gut microbiota affects the rate of social interactions and the social network structure of honeybees. These behavioral differences are associated with important changes in gene expression and metabolite abundance in the brain. Our results demonstrate crosstalk between the gut microbiota and amino acid metabolism, which seems more pronounced across the antennal lobes and the subaesophageal ganglion, brain regions associated with perception of olfactory and gustatory stimuli 45,46. Because changes in the rate and patterning of social interaction probably impact information and nutrient flow within colonies, our study highlights the importance of the gut microbiome for the complex social lives of honeybees.
Methods
Preparation of bacterial inocula
We produced three kinds of inocula: (i) a homogenate of five pooled guts of nurse bees collected from a single hive (CL treatment), (ii) an artificial community reconstituted from 13 cultured strains spanning the major phylotypes and SDPs 29,47 of the honeybee gut microbiota (CL_13 treatment; Supplementary Table 4), and (iii) an inoculum containing two cultured strains of Bifidobacterium asteroides (CL_Bifi treatment; Supplementary Table 4).
To prepare the inoculum for the CL treatment, we randomly collected five nurse bees from each of three hives and bead-beat their guts in 1 ml 1x PBS with 0.75 - 1 mm sterile glass beads using a FastPrep-24 5G homogenizer (MP Biomedicals) at 6 m/s for 45 s. We pooled the five gut homogenates by hive of origin, and plated a serial dilution of these pools from 10−3 – 10−12 onto BHIA, CBA + blood and MRSA + 0.1% L-cys + 2% fructose using the drop method (10 μl droplets). These plates were then incubated in both anaerobic and microaerophilic conditions to confirm bacterial growth prior to inoculations. To select the most pathogen-depleted of these three homogenates for subsequent colonizations, we performed diagnostic PCRs on lysates, using specific primers targeting known bee pathogens (Nosema apis, Nosema ceranae, trypanosomatids, Serratia marcescens, fungi, as well as Bifidobacterium as initial validation that homogenates contained live members of the core gut microbiota). Lysates were produced by mixing 50 μl of the homogenate with 50 μl lysis buffer, five μl proteinase K (20 mg/ml) and five μl lysozyme (20 mg/ml) and incubating these mixes for 10 min at 37 °C, 20 min at 55 °C and 10 min at 95 °C in a PCR machine. We then centrifuged these lysates for 5 min at 2000 g and used the supernatants as templates for PCR. We selected the homogenate that showed the least amplification of pathogen DNA, added glycerol to a final concentration of 20%, and stored it at -80 °C. We then thawed and plated an aliquot of the homogenate on different media as described above, to verify that the homogenate was still viable after storage at -80 °C. All these procedures were performed for the automated behavioral tracking experiment and the RNA-sequencing experiment.
For the CL_13 and CL_Bifi treatments, bacterial strains were inoculated from glycerol stocks and restreaked twice. Details on bacterial strains and culture conditions are reported in Supplementary Table 4. We harvested bacterial cells and resuspended them in 1x PBS at an OD600 of 1. These suspensions were pooled in equal volumes in a falcon tube and pelleted by centrifugation at 4000 g for 5 min, after which we resuspended the pooled pellet in 1.5 ml PBS, added glycerol to the final concentration of 20% and stored the final CL_13 and CL_Bifi inocula at -80 °C.
Automated behavioral tracking
Colonies of Apis mellifera carnica were reared at the University of Lausanne. Microbiota- depleted bees were produced as previously described 29,30. Briefly, melanized dark-eyed pupae were individually extracted from capped brood cells with sterile forceps and placed in sterilized plastic containers lined with moist cotton. We performed nine experimental replicates of the automated behavioral tracking experiment. For each experimental replicate, we extracted four hundred pupae from one of nine different hives and placed them in 16 sterile plastic boxes in groups of 25. We then kept these pupae in an incubator at 70% RH and 34.5 °C in the dark. Three days later, we used superglue to affix 1.6 mm2 fiducial markers from the ARTag library 48 onto the thorax of all newly emerged workers that showed no sign of developmental defects. On the same day, we transferred these bees to each of 16 new cup-cages built with a sterile plastic cup placed on top of a 100 mm petri dish, and provided them with their treatment solutions. To do this, we thawed the gut homogenate and diluted it ten times in 1X PBS and again 1:1 in sugar water (SW). We then added 100 μl droplets of either the gut homogenate (CL) or a 1:1 PBS:SW solution as control (MD) to the petri dish. Pollen and sugar water were provided ad libitum. Two days later we pooled these bees according to their treatment group and transferred ca. 100 bees per treatment into two pairs of plexiglas boxes (22.5 cm length x 13.5 cm width) closed by transparent covers 1.5 cm above the floor and connected by a (50 cm length x 1.9 cm diameter) plastic tube (Fig. 1A and Supplementary Movie 1). These pairs of plexiglas boxes were hosted within separate climate-controlled chambers and monitored by a pair of tracking devices (all technical specifications and code available at: https://github.com/formicidae-tracker/). We defined a nest chamber by keeping one box under a constant 70% RH and 30 °C regime in the dark. In the foraging arena, climatic conditions cycled from 25°C and light during the day to 18°C and dark during the night (Fig. 1A). Transitions were initiated at 04:00 and 16:00, and programmed to last for four hours, during which the climate system performed a linear interpolation between the two states. Each box contained a trough filled with 1 g of pollen and three 2 ml vials filled with SW. These SW feeders were continuously replaced during the experiment. Bees were left to acclimatize in their boxes for a few hours, after which we conducted behavioral tracking from 00:00 to 08:00 on the same day of the subsequent week (a total of 152 hours). During this time, the x,y coordinates and orientation of each tag was recorded six times per second. At the end of each experiment, we counted and removed dead bees. We then scanned the tags to retrieve the identity of each bee, flash froze the bees in liquid nitrogen and stored them at -80 °C until further processing.
The tracking data were processed in FortStudio (https://github.com/formicidae-tracker/), where the body-length of each bee (front edge of clypeus – tip of abdomen; Extended Data Fig. 7) was measured and polygons were drawn to define individual head and body regions (Fig. 1B). Data were subsequently processed using the R package FortMyrmidon (https://github.com/formicidae-tracker/). Contact events (i.e., the overlap of the body polygons) were saved along with the contact type (i.e., head-to-head, head-to-body, etc) and duration. Bees that interacted less than 2*SD below the mean interaction count of the sub-colony were presumed to be ill or to have died prior to the end of the experiment, and were excluded from all behavioral analyses (there was an average of four such bees for both CL and MD sub-colonies). Average speed and standard deviation in speed were calculated from individual trajectories (time-calibrated x,y coordinates). An individual-level social specialization metric (referred to as “interaction bias” in Fig. 1E) was obtained from the social interaction data by calculating the standard deviation in interaction counts with all other individuals within the sub-colony (including 0 values). We then averaged these scores across all sub-colony members to obtain a measure of specialization within the social network of the sub-colony.
Statistical analyses were performed in R v4.1.0 49. To assess the effect of the gut microbiota on behavioral variables (average values for each sub-colony) we ran paired t-tests after checking that the differences between paired values were normally distributed using the Shapiro-Wilk normality test.
Production of gnotobiotic bees for RNA-sequencing
We collected six boxes of 25 pupae from each of 10 hives and kept them in an incubator at 70% RH and 34.5 °C in the dark for two days. On the afternoon of the second day, we dissected one newly-emerged bee per box, homogenized their hindguts in 1 ml 1x PBS with 0.75 - 1 mm sterile glass beads using a Fast-Prep24 5G homogenizer (MP Biomedicals) at 6 m/s for 45 s. We then plated these homogenates on BHIA, CBA + blood and MRSA + 0.1% L-cys + 2% fructose growth media with the drop method and cultured them overnight in anaerobic and microaerophilic conditions. To minimize the risk of including contaminated bees in colonization experiments, the next day we excluded rearing boxes in which bacterial growth was observed for the tested bee, which led to the exclusion of two out of 60 boxes. Next, we transferred bees from each of the 58 remaining boxes into a corresponding sterile cage built with a 100 mm petri dish and an inverted sterile plastic cup of 3 dl.
Four cages belonging to each of the ten hives were randomly assigned to one of four treatments. Bees were either (i) kept microbiota-depleted (MD) or colonized with (ii) the gut homogenate (CL) inoculum (iii) the community of 13 strains (CL_13) inoculum, or (iv) the two strains of Bifidobacterium asteroides (CL_Bifi) inoculum. Colonizations were performed three days after pupae extraction. After thawing the inocula on ice, we diluted them ten times in 1X PBS and again 1:1 in SW. We placed three droplets of 100 μl colonization suspensions at the bottom of the cages so that bees would be inoculated by physical contact with the suspension and trophallaxis with other bees. MD bees were given only a 1:1 PBS:SW solution (the extra cages that we produced for each hive were left MD to produce a surplus of these bees as a backup in case of contamination). Bees were provided with 1 g of sterile pollen and SW ad libitum and reared in an incubator at 70% RH and 30 °C in the dark.
One week post-treatment, we anesthetized bees on ice and dissected their guts excluding the honey stomach, which is generally colonized by environmental microbes that do not represent the core gut microbiota 27,50. We then flash-froze the heads and guts and stored them in liquid nitrogen.
Nucleic acid extraction from gut tissue
After having conducted the behavioral tracking experiment, we extracted DNA from the guts of 180 randomly selected bees (ten per replicate per treatment), for which we also performed metabolomics analyses of brain and hemolymph samples. We also performed one blank extraction (with no experimental tissue) per replicate (n=9) to identify and exclude laboratory reagent contaminants from 16S rRNA gene amplicon-sequencing data (see below). The bees’ abdomens were thawed on ice, and guts were dissected and homogenized in a FastPrep-24 5G homogenizer (MP Biomedicals) at 6 m/s for 45 s in 360 μl ATL buffer and 40 μl proteinase K (20 mg/ml) containing ca. 100 μl of 0.1 mm Zirconia/Silica beads (Carl Roth). These homogenates were digested at 56 °C overnight, after which DNA was extracted from half of each homogenate using a Qiagen BioSprint 96 robot with the BioSprint DNA Blood Kit following the manufacturer’s instructions, including an RNase treatment step.
For the RNA-seq experiment, we randomly selected three-four bees per treatment per hive (n=121) for DNA extraction of gut samples. Guts were thawed on ice and homogenized in a FastPrep-24 5G homogenizer (MP Biomedicals) at 6 m/s for 45 s in 1 ml 1X PBS containing ca. 100 μl of 0.1 mm Zirconia/Silica beads (Carl Roth). Half of the volume of these homogenates was used for DNA extraction while the remaining homogenate from 40 of these bees (one randomly selected bee per treatment per hive from 40 independent cages, from which we also obtained brain RNA-seq data; see below) was used for RNA extraction. Nucleic acids were extracted with hot phenol protocols as previously described 29. We once more performed blank DNA extractions (with no experimental tissue) in parallel to control for laboratory reagent contaminations.
Quantification of bacterial loads in gnotobiotic bee guts
We determined bacterial loads by qPCR using universal primers targeting the 16S rRNA gene (F: AGGATTAGATACCCTGGTAGTCC; R: YCGTACTCCCCAGGCGG) as per Kešnerová et al. 30. qPCRs targeting the A. mellifera Actin gene (primers F: TGCCAACACTGTCCTTTCTG and R: AGAATTGACCCACCAATCCA) were used as controls of DNA quality and to normalise the bacterial 16S rRNA gene copies to account for differences in DNA extraction efficiency. To do this, for each sample we divided the number of 16S rRNA gene copies by the copy number of actin and multiplied by the median copy number of actin across all samples as done in previous studies 30,51. We also screened cDNA reverse-transcribed from gut RNA of the 40 bees that we selected for RNA-sequencing for the presence of Varroa destructor virus 1 (VDV-1) and deformed wing virus (DWV) using primers targeting both viruses (F: GTATATATGGCTAATCGACGTAAAG and R: AGTACTAATCTCTGAGCCAACAC) 29. There was no amplification of viral RNA from any of these samples.
To determine the absolute quantity of each target in the samples, we performed standard curves on serial dilutions of plasmids (pGEM®-T Easy vector; Promega) containing the target sequences (from 107 to 101 copies per μl). The plasmid copy number was calculated from the molecular weight of the plasmid and the DNA concentration of the purified plasmid measured with Qubit™ (Thermo Fisher). The slope and intercept of standard curves were calculated based on the Cq values obtained from the dilution series. The primer efficiencies (E) were estimated from the slopes according to the equation: E = 10(-1/slope) 52. We then calculated the copy number of each target in 1 μl of DNA from the Cq value and the standard curve using the formula n = E(intercept - Cq) 53 and multiplied these values by the elution volume of the DNA extraction to obtain total copy numbers per gut.
All qPCR reactions were carried out in 96-well plates on a StepOnePlus instrument (Applied Biosystems) following the protocols and primers reported in Kešnerová et al. 29,30. The thermal cycling conditions were a denaturation step at 50 °C for 2 min followed by 95 °C for 2 min, and 40 cycles of 95 °C for 15 s and 60 °C for 1 min. Melting curves were generated after each run (95 °C for 15 s, 60 °C for 20 s and increments of 0.3 °C until reaching 95 °C for 15 s) and controlled to confirm the presence of only one PCR product (one peak). Each reaction was performed in triplicates in a total volume of 10 μl (0.2 μM of each forward and reverse primer, and 1x SYBR® Select Master Mix, Applied Biosystems) with 1 μl of DNA or cDNA. Each plate contained a positive control and a water control.
16S rRNA gene amplicon-sequencing
The V4 region of the 16S rRNA gene was amplified following the Illumina 16S metagenomic sequencing preparation guide (https://support.illumina.com/documents/documentation/chemistry_documentation/16s/16s-metagenomic-library-prep-guide-15044223-b.pdf) and the protocols reported in Kešnerová et al. 30. We used primers 515F-Nex (TCGTCGGCAGCGTCAGATGTGTATAAGAGACAGGTGCCAGCMGCCGCGGTAA) and 806R-Nex (GTCTCGTGGGCTCGGAGATGTGTATAAGAGACAGGGACTACHVGGGTWTCTAA T), to amplify the V4 region of the 16S rRNA gene. The PCR cocktail consisted of 12.5 μl of Invitrogen Platinum SuperFi DNA Polymerase Master Mix, 5 μl of MilliQ water, 2.5 μl of each primer (5 μM), and 2.5 μl of template DNA. PCR conditions were: 98 °C for 30 s followed by 25 cycles of 98 °C for 10 s, 55 °C for 20 s, and 72 °C for 20 s, and by a final extension step at 72 °C for 5 min. We verified that amplifications were successful by 2% agarose gel electrophoresis. We next purified the PCR products using Clean NGS purification beads (CleanNA) in a 1:0.8 ratio of PCR product to beads, and eluted the purified PCR products in 27.5 μl of 10 mM Tris, pH 8.5. A second PCR step was next performed to add a unique dual-index combination to each sample using the Nextera XT index kit (Illumina). We performed second-step PCR amplifications in a total volume of 25 μl, using 2.5 μl of the PCR products, 12.5 μl of Invitrogen Platinum SuperFi DNA Polymerase Master Mix, 5 μl of MilliQ water, and 2.5 μl each of Nextera XT index primers 1 and 2. PCR conditions consisted of an initial denaturation step at 95 °C for 3 min followed by eight cycles of 30 s at 95 °C, 30 s at 55 °C, and 30 s at 72 °C, and a final extension step at 72 °C for 5 min. PCR products were purified using Clean NGS purification beads in a 1:1.12 ratio of PCR product to beads, and eluted in 27.5 μl of 10 mM Tris, pH 8.5. We quantified amplicon concentrations by PicoGreen and pooled the libraries in equimolar concentrations (with the exception of negative PCR controls and blank DNA extractions, which we pooled in equal volumes instead). We then verified that the final pool was of the right size using a Fragment Analyzer (Advanced Analytical). Sequencing was performed at the Genomic Technology Facility of the University of Lausanne on an Illumina MiSeq sequencer for 500 cycles, producing 2 × 250-bp reads.
Analyses of 16 rRNA gene amplicon-sequencing data
We sequenced 16S rRNA gene amplicons from gut samples, bacterial inocula, negative PCR controls, and blank DNA extractions. We also included a mock community sample consisting of equal numbers of nine plasmids (pGEM®-T Easy vector; Promega) containing eight 16S rRNA gene sequences from honeybee gut symbionts and one from E. coli, which we used as internal standard to verify consistency between MiSeq runs. Raw sequencing data (deposited at the SRA Database under Accession no. PRJNA792398) were quality-controlled with FastQC (http://www.bioinformatics.babraham.ac.uk/projects/fastqc/) and primer sequences were removed with Cutadapt 54. We then continued the analysis using the Divisive Amplicon Denoising Algorithm 2 (DADA2) package v.1.20.0 55 in R. All functions were run using the recommended parameters (https://benjjneb.github.io/dada2/tutorial.html) except that at the filtering step we truncated the F and R reads after 232 and 231 bp, respectively. We then set randomize=TRUE and nbases=3e8 at the learnErrors step. We_used the SILVA database (version 138) to classify the identified amplicon-sequence variants (ASVs). To complement the taxonomic classification based on the SILVA database, sequence variants were further assigned to major phylotypes of the bee gut microbiota as previously defined 30. Any unclassified ASV was removed with the “phyloseq” package version 1.36.0 56, using the “subset taxa” function. We then used both the “prevalence” and “frequency” methods (method = “either”) in the R package “decontam” v.1.12.0 57 to identify and remove contaminants introduced during laboratory procedures, using the negative PCR controls and the blank samples as reference.
Analyses of combined amplicon-sequencing and qPCR data
To calculate absolute bacterial abundances of each ASV, the proportion of each ASV in each sample was multiplied by the normalised 16S rRNA gene copy number of each sample as measured by qPCR 30. To assess differences in community structure between treatments we ran ADONIS tests after calculating Bray-Curtis dissimilarities with the absolute ASV abundance matrix.
Extraction of metabolites from tracked bees
We analyzed soluble metabolites in the brain and hemolymph from the random subset of 180 tracked bees for which we also analyzed the gut microbiota. CL bees in this subset engaged in a greater number of head-to-head interactions than MD bees, consistent with our global analysis (Extended Data Fig. 8; linear mixed-effects model fitted by REML with experimental replicate and sub-colony as random effects: n=174, F1,8=6.30, P=0.036). Brains were dissected from frozen bees, weighed on a microbalance, and refrozen at -80 °C until extraction. Hemolymph (1 μl) was taken from the thorax of thawed bees and refrozen at -80 °C until extraction. Individual brain and hemolymph samples were extracted following a modified Bligh and Dyer protocol 58–60. Frozen brain tissue was ground with a motorized pestle for 30 s in 100 μl of chilled (4:1) analytical grade methanol:ddH2O with 1 mM norluecine (Sigma Aldrich) standard. Hemolymph was extracted in the same mixture, omitting the tissue-grinding step. Samples were then extracted in a thermomixer (10 min, 2000 rpm, 4 °C) and centrifuged (5 min, 15000 g, 4 °C). Supernatant was transferred to a new tube and kept chilled at -20 °C, while 250 μl of cold (1:1) chloroform:methanol (Sigma Aldrich) was added to the sample. Samples were again extracted in the same manner, and the supernatants combined. Phase separation was achieved with 200 μl ddH2O, followed by a fast vortex and centrifuge step. The top aqueous layer was removed and dried in a speedvac concentrator overnight at ambient temperature. The sample was derivatized with 50 μl of 20 mg/ml methoxyamine hydrochloride in pyridine (Sigma Aldrich), for 90 min at 33 °C followed by silylation with 50 μl of MSTFA (Sigma Aldrich) for 120 min at 45 °C.
GC-MS analysis of metabolites
Samples were analyzed on an Agilent 8890-5977B GC-MSD equipped with a Pal3 autosampler that injected 1 μl of sample onto a VF-5MS (30 m x 0.25 mm x 0.25 mm) column. The samples were injected with a split ratio of 15:1, helium flow rate of 1 ml/min and inlet temperature of 280 °C. The temperature was held for 2 min at 125 °C, raised at 3 °C/min to 150 °C, 5 °C/min to 225 °C, and 15 °C/min to 300 °C and held for 1.3 min. The MSD was run in scan mode from 50-500 Da at a frequency of 3.2 scan/s. Spectral deconvolution and compound identification was performed with Masshunter Workstation Unknown Analysis software (Agilent) and the NIST 2017 MS library. Best hits of compound identity are reported for spectra with a match factor greater than 85%. Identified metabolites were then manually mapped to metabolic pathways in the KEGG PATHWAY Database. Analyte abundances were calculated using the MassHunter Workstation Quantitative Analysis software (Agilent).
Metabolomics data analyses
Raw metabolite abundances were normalised to the internal standard and then to the sample mass (brains only). Low-quality samples and samples with an ISTD response < or > two SD from the batch mean were removed from the datasets. The normalised abundances were then transformed to z-scores. The impact of colonization on metabolite abundance was then calculated using a mixed integer linear model using the lmm2met package in R 61. Colonization was treated as a fixed effect, while the nine different experimental batches were treated as a random effect. One global batch term was used, as each step in the extraction and analysis pipeline was performed in the same paired batch fashion as in the automated behavioral tracking experiment. The significances of the effect sizes were calculated using a likelihood-ratio test and adjusted using the Benjamini–Hochberg (BH) procedure. We next performed separate linear mixed-effects models between the abundance (z-score) of each metabolite (independent variable) and the number of head-to-head interactions of each bee (dependent variable). To assess the relationship between metabolite abundance and the number of head-to-head interactions of each bee independently of treatment, we considered the different sub-colonies as a random effect and adjusted for multiple testing with the BH method. To account for differences in group size, we divided the number of head-to-head interactions by the final number of bees in each sub-colony.
RNA-sequencing of gut and brain tissues
For RNA-sequencing, we randomly selected one bee per treatment per hive (40 total bees), so that all samples were independently reared in separate cages (no cage or hive effect). We sequenced RNA from the gut and brain of each individual. The heads were moved from liquid nitrogen into RNAlaterICE (Life Technologies) in a petri dish placed onto a metal plate chilled on ice. We immediately dissected the brain with sterile forceps, after carefully removing the hypopharyngeal glands, compound eyes and ocelli, and further dissected the brain into three macro-regions by performing a horizontal incision across the midbrain through the posterior protocerebral lobe and two oblique incisions to separate the optic lobes from the rest of the brain (Fig. 3A), using needles. The resulting regions were: the optic lobes (OL), the mushroom body and central complex region (MB), and the lower part of the midbrain, containing the antennal lobes and the subesophageal ganglion (AL). RNA extractions of brain regions were performed with the Arcturus PicoPure RNA Isolation Kit (Applied Biosystems) according to the manufacturer’s specifications, including a DNase treatment (Qiagen) to remove genomic DNA. Brain-region samples were transferred to the kit’s incubation buffer and homogenized for 30 s with a motorized pestle.
The quality of both brain and gut RNA extractions was verified using a Fragment Analyzer (Advanced Analytical). RNA-sequencing libraries were prepared with the KAPA stranded mRNA kit (Roche) following the manufacturer’s protocol, except that we appended TruSeq unique dual indexes (UDIs, Illumina) instead of the adapters provided by the kit to better control for index hopping during sequencing. We always performed RNA extractions and library preparations for all bees from each hive/experimental replicate at the same time so as to only have one combined batch factor to control for. However, four bees had to be re-processed as one of the tissues failed at library preparation. Hence, we accounted for an 11th RNA extraction / library preparation batch during analysis. Each sample was sequenced twice in separate sequencing lanes on a HiSeq 4000 sequencer (Illumina) at the Genomic Technology Facility of the University of Lausanne, producing single-end 150 bp reads.
RNA-sequencing data analyses
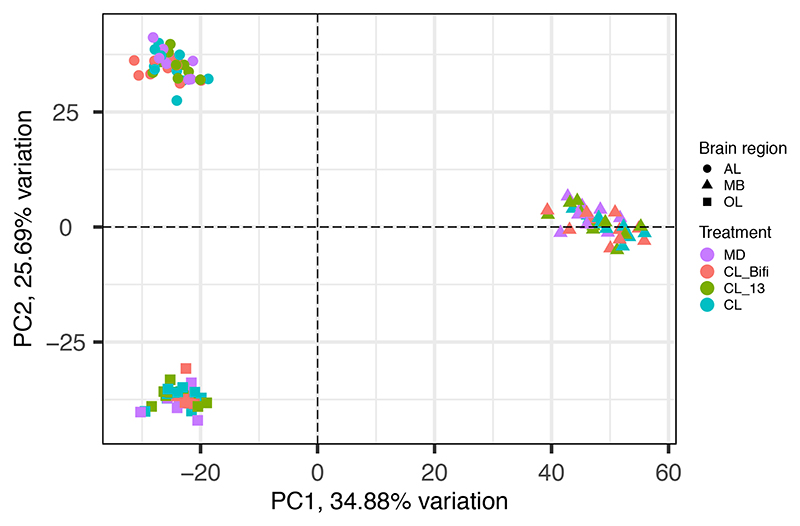
Read quality was assessed with FastQC (http://www.bioinformatics.babraham.ac.uk/projects/fastqc/). We used Trimmomatic 62 to remove adapters and low-quality bases with the following parameters: LEADING: 10 (trim the leading nucleotides until quality > 10), TRAILING: 10 (trim the trailing nucleotides until quality > 10), SLIDINGWINDOW: 4:20 (trim the window of size four for reads with local quality below a score of 20), and MINLEN: 80 (discard reads shorter than 80 bases). Reads were then aligned with STAR v.2.5.4b 63 to the honeybee genome (Apis mellifera assembly HAv3.1 64). The two bam files belonging to each sample were merged with Samtools merge 65. Mapped reads were then converted into raw read counts with the htseq-count script (http://www.huber.embl.de/users/anders/HTSeq/doc/count.html). Two gut samples and four brain region samples (two OL, one AL, one MB) were not included in down-stream analyses because they either failed during library preparation or represented clear outliers, with less than 10% of reads mapping to the honeybee genome. We used the filterByExpr function in edgeR 66 to filter out genes that were not represented by at least 20 reads in a single sample. We then used the Limma Bioconductor package 67 for analyses of differential expression. For the gut we used the formula 0 + Treatment + Batch, whereas for the brain we used the formula 0 + group + Batch, where “group” represented every possible combination of brain region and treatment group and “Batch” represented the different experimental and RNA-seq library preparation batches. We accounted for the random effect of sampling multiple brain regions from the same individuals using the duplicateCorrelation function. The three different brain regions showed very distinct patterns of gene expression, indicating the precise dissection of the brain and quantification of region-specific gene expression (Extended Data Fig. 9). We therefore performed the desired contrasts between treatments, overall and within each brain region independently. P values of differential expression analyses were corrected for multiple testing with a false discovery rate (FDR) of 5%.
To perform Gene Ontology (GO) enrichment analyses we retrieved GO terms using biomaRt (amellifera_eg_gene dataset; 68). We used a hypergeometric test implemented in the R Bioconductor package GOstats v.2.58.0 69 to evaluate the differentially expressed gene lists for GO term associations, using the full genome as background and retaining GO terms with P<0.05. GOFigure! 70 was subsequently used to reduce redundancy in significant GO terms and summarize results by semantic similarity, using a similarity threshold of 0.8.
Extended Data
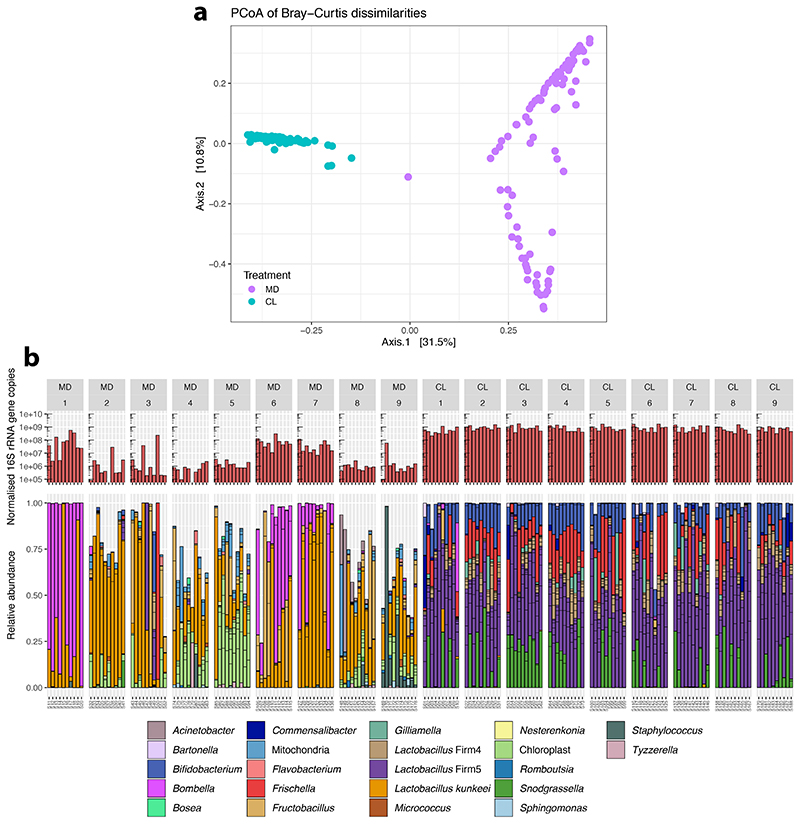
Extended Data Fig. 1. Bacterial loads and microbiota composition in the guts of bees of the automated behavioral tracking experiment.
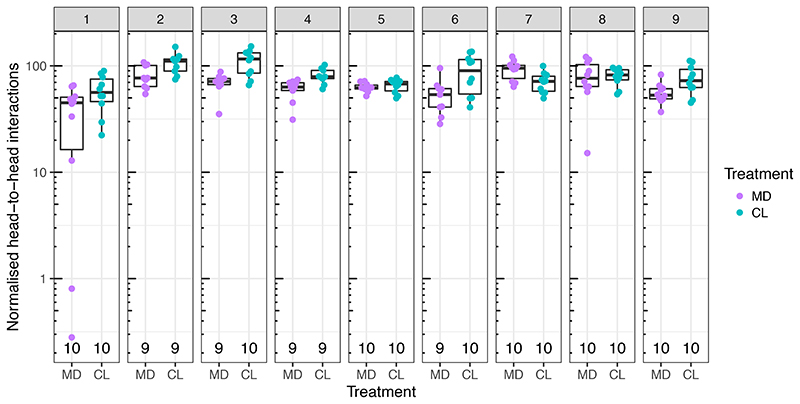
(A) Principal Coordinate Analysis of Bray-Curtis dissimilarities between gut microbiota profiles. The ordination was performed on Bray-Curtis dissimilarities calculated from a matrix of absolute bacterial abundances of each amplicon-sequence variant (ASV) in each sample. This was obtained by multiplying the relative proportion of each ASV in each sample by the total number of 16S rRNA gene copies in the sample (normalised by Actin copy numbers). (B) The upper barplots depict the number of 16S rRNA gene copies measured by qPCR with universal bacterial primers and normalized by Actin copy numbers. Lower stacked bars indicate the relative abundance of community members. Multiple ASVs can have the same classification (color) and are separated by horizontal ticks. For ease of visualization, the stacked bars show only ASVs that had a minimum of 1% relative abundance in five samples.
Extended Data Fig. 2. Social interactions per bee in each of the experimental replicates of the automated behavioral tracking experiment.
Line plots show the number of head-to-head interactions per bee (HH per bee) per hour. Columns correspond to experimental replicates. Top row = nest arena; bottom row = foraging arena. Cyan lines = CL sub-colonies; purple lines = MD sub-colonies. Background bars show night (gray) and day (white). The expected circadian pattern of interaction frequency is apparent.
Extended Data Fig. 3. Average standard deviation of speed (pixels/s) (A) and mortality of tracked bees (B) per sub-colony during the 152 h of automated behavioral tracking.
Lines connect paired colonies in each experimental replicate. Boxplots show the median and first and third quartiles, while upper and lower whiskers report largest and lowest values within 1.5 times the interquartile ranges above and below the 75th and 25th percentiles, respectively. NS=not significant. n=18 sub-colonies examined over nine independent experiments.
Extended Data Fig. 4. Bacterial loads and microbiota composition in the guts of bees of the RNA-sequencing experiment.
(A) Principal Coordinate Analysis of Bray-Curtis dissimilarities between gut microbiota profiles. Bray-Curtis dissimilarities were calculated from a matrix of absolute bacterial abundances of each amplicon-sequence variant (ASV) in each sample. Absolute abundances were obtained by multiplying the relative proportion of each ASV in each sample by the total number of 16S rRNA gene copies in the sample (normalised by Actin copy numbers). (B) The upper barplots depict the number of 16S rRNA gene copies measured by qPCR with universal bacterial primers and normalised by Actin copy numbers. Lower stacked bars indicate the relative abundance of community members. Sub-bars of the same color show distinct amplicon-sequence variants (ASVs) with the same classification. For ease of visualization, the stacked bars show only ASVs that had a minimum of 1% relative abundance in two samples.
Extended Data Fig. 5. Differential gene expression in the gut of gnotobiotic honeybees.
(A) Principal Component Analysis of differentially expressed genes in honeybee gut samples. The ordination clusters the samples based on the expression (trimmed mean of M values (TMM) normalised counts) of 4,988 DEGs identified in contrasts of colonized treatments and microbiota-depleted controls. Samples are color-coded by gut microbiota treatment group. (B) Venn diagram reporting overlap in differentially expressed genes between contrasts of colonized treatments and microbiota-depleted controls in the gut. Note that additional comparisons between MD vs. both CL_13 and CL and between MD vs. all colonization treatments combined (CL, CL_13, and CL_Bifi) have been omitted here for ease of visualization. See Table S5 for complete DEG lists.
Extended Data Fig. 6. Differential gene expression in the brain of gnotobiotic honeybees.
(A) Principal Component Analyses of brain-region-specific expression of genes altered by the honeybee gut microbiota. The ordinations cluster samples based on the expression (TMM-normalized counts) of the 91 differentially expressed genes identified across whole-brain and region-specific contrasts of all colonized treatments against microbiota-depleted controls. Samples are color-coded by gut microbiota treatment group. AL = antennal lobes and subaesophageal ganglion, MB = mushroom bodies and central complex, OL = optic lobes. (B) Venn diagram reporting overlap in differentially expressed genes between contrasts of colonized treatments and microbiota-depleted controls in the brain, combining results of whole-brain and region-specific analyses. Note that additional comparisons between MD vs. both CL_13 and CL and between MD vs. all colonization treatments combined (CL, CL_13 and CL_Bifi) have been omitted here for ease of visualization. The three DEGs shared between the three pair-wise comparisons are: “uncharacterized LOC102654070”, “DNA helicase MCM8” (LOC412034), and “glutamyl aminopeptidase” (LOC551518). See Table S6 for complete DEG lists.
Extended Data Fig. 7. Example of the post-processing procedure to determine the orientation of a tracked bee.
In FortStudio, a line was drawn from the tip of the abdomen to the front edge of the clypeus to derive the orientation of the tag relative to the body of the bee.
Extended Data Fig. 8. Social interactions in a subset of tracked bees by gut microbiota treatment group and experimental replicate.
The plot shows the number of head-to-head interactions of the tracked bees for which we also obtained gut microbiota and metabolome data, normalised by group size. For six of these 180 bees the number of head-to-head interactions could not be retrieved due to deterioration of the tags at the end of the week of tracking. Boxplots show the median and first and third quartiles, while upper and lower whiskers report largest and lowest values within 1.5 times the interquartile ranges above and below the 75th and 25th percentiles, respectively.
Extended Data Fig. 9. Principal Component Analysis of overall gene expression in brain samples.
The ordination clusters samples based on the expression (TMM-normalized counts) of 10,493 genes retained after filtering out those with low expression and removing the experimental batch effect. Color indicates gut microbiota treatment group and shape indicates the different brain regions. AL = antennal lobes and subaesophageal ganglion, MB = mushroom bodies and central complex, OL = optic lobes.
Supplementary Material
Acknowledgements
We would like to thank Christine La Mendola and Catherine Berney for their technical support with RNA extraction and library preparation of honeybee brain samples, Théodora Steiner for continuous support in the laboratory, Matthias Rüegg and Alexandre Tuleu for technical assistance with the automated tracking system and Jule Wermerssen for the bee drawing in Fig. 1A. The two equally contributing senior authors flipped a coin to determine last authorship. This work was funded by the University of Lausanne, the European Union’s Horizon 2020 research and innovation programme under the Marie Skłodowska-Curie grant agreement BRAIN (no. 797113) to Joanito Liberti, by an ERC Starting Grant (MicroBeeOme, no. 714804), the NCCR microbiomes, a National Centre of Competence in Research, funded by the Swiss National Science Foundation (grant number 180575), and a Swiss National Science Foundation project grant (31003A 160345) to Philipp Engel, and by an ERC Advanced Grant (resiliANT, no. 741491) to Laurent Keller.
Footnotes
Author contributions: JL, PE and LKel conceived and designed the study. JL, PE and LKel acquired fundings. PE and LKel supervised the research. JL and TK performed the automated behavioral tracking experiment. TK performed automated behavioral tracking data analyses with assistance from JL and TOR. JL performed statistical analyses. JL performed microbiological preparations and gnotobiotic manipulations with assistance from LuK, TK, AC and ETF. JL extracted DNA and JL and LuK performed qPCR analyses. JL performed amplicon-sequencing and data analyses. JL performed gut and brain dissections and hemolymph collection. AQ performed metabolite extractions, GC-MS runs and metabolomics data analyses with assistance from JL. JL extracted RNA and analyzed RNA-sequencing data. LuK performed RNA-sequencing library preparations. JL, TK and AQ plotted the graphs. JL, TK, PE and LKel drafted the manuscript. All authors contributed to interpreting the data and editing subsequent drafts of the manuscript.
Competing interests: Authors declare no competing interests.
Data Availability
Raw RNA-sequencing data have been deposited in NCBI's Gene Expression Omnibus and are accessible through GEO Series accession number GSE192784 (https://www.ncbi.nlm.nih.gov/geo/query/acc.cgi?acc=GSE192784), while raw amplicon-sequence data are available on Sequence Read Archive (SRA) under accession PRJNA792398.
Code Availability
Raw data tables, metadata and codes are available on GitHub at https://github.com/JoanitoLiberti/The-gut-microbiota-affects-the-social-network-of-honeybees. Additional input files required to reproduce the automated behavioral tracking analyses are available on Zenodo at: https://doi.org/10.5281/zenodo.5797980.
References
- 1.Wilson EO. Sociobiology: The new synthesis. Harvard University Press; 1975. [Google Scholar]
- 2.Diamond JM, Ordunio D. Guns, germs, and steel. Books on Tape; 1999. [Google Scholar]
- 3.Couzin ID, Krause J, et al. Self-organization and collective behavior in vertebrates. Adv Study Behav. 2003;32:10–1016. [Google Scholar]
- 4.Keller L. Adaptation and the genetics of social behaviour. Philos Trans R Soc Lond, Ser B: Biol Sci. 2009;364:3209–3216. doi: 10.1098/rstb.2009.0108. [DOI] [PMC free article] [PubMed] [Google Scholar]
- 5.Kay T, Keller L, Lehmann L. The evolution of altruism and the serial rediscovery of the role of relatedness. Proc Natl Acad Sci USA. 2020;117:28894–28898. doi: 10.1073/pnas.2013596117. [DOI] [PMC free article] [PubMed] [Google Scholar]
- 6.Cryan JF, Dinan TG. Mind-altering microorganisms: the impact of the gut microbiota on brain and behaviour. Nat Rev Neurosci. 2012;13:701–712. doi: 10.1038/nrn3346. [DOI] [PubMed] [Google Scholar]
- 7.Johnson KVA, Foster KR. Why does the microbiome affect behaviour? Nat Rev Microbiol. 2018;16:647–655. doi: 10.1038/s41579-018-0014-3. [DOI] [PubMed] [Google Scholar]
- 8.Sherwin E, Bordenstein SR, Quinn JL, Dinan TG, Cryan JF. Microbiota and the social brain. Science. 2019;366:eaar2016. doi: 10.1126/science.aar2016. [DOI] [PubMed] [Google Scholar]
- 9.Desbonnet L, Clarke G, Shanahan F, Dinan TG, Cryan JF. Microbiota is essential for social development in the mouse. Mol Psychiatry. 2014;19:146–148. doi: 10.1038/mp.2013.65. [DOI] [PMC free article] [PubMed] [Google Scholar]
- 10.Sharon G, et al. Human gut microbiota from autism spectrum disorder promote behavioral symptoms in mice. Cell. 2019;177:1600–1618. doi: 10.1016/j.cell.2019.05.004. [DOI] [PMC free article] [PubMed] [Google Scholar]
- 11.Zhang M, et al. A quasi-paired cohort strategy reveals the impaired detoxifying function of microbes in the gut of autistic children. Sci Adv. 2020;6:eaba3760. doi: 10.1126/sciadv.aba3760. [DOI] [PMC free article] [PubMed] [Google Scholar]
- 12.Wu W-L, et al. Microbiota regulate social behaviour via stress response neurons in the brain. Nature. 2021:1–6. doi: 10.1038/s41586-021-03669-y. [DOI] [PMC free article] [PubMed] [Google Scholar]
- 13.Vuong HE, Yano JM, Fung TC, Hsiao EY. The microbiome and host behavior. Annu Rev Neurosci. 2017;40:21–49. doi: 10.1146/annurev-neuro-072116-031347. [DOI] [PMC free article] [PubMed] [Google Scholar]
- 14.Douglas AE. Simple animal models for microbiome research. Nat Rev Microbiol. 2019;17:764–775. doi: 10.1038/s41579-019-0242-1. [DOI] [PubMed] [Google Scholar]
- 15.Schretter CE. Links between the gut microbiota, metabolism, and host behavior. Gut microbes. 2019:1–4. doi: 10.1080/19490976.2019.1643674. [DOI] [PMC free article] [PubMed] [Google Scholar]
- 16.Liberti J, Engel P. The gut microbiota — brain axis of insects. Curr Opin Insect Sci. 2020;39:6–13. doi: 10.1016/j.cois.2020.01.004. [DOI] [PubMed] [Google Scholar]
- 17.O’Donnell MP, Fox BW, Chao P-H, Schroeder FC, Sengupta P. A neurotransmitter produced by gut bacteria modulates host sensory behaviour. Nature. 2020;583:415–420. doi: 10.1038/s41586-020-2395-5. [DOI] [PMC free article] [PubMed] [Google Scholar]
- 18.Wilson EO. The insect societies. Harvard University Press; 1971. [Google Scholar]
- 19.Hölldobler B, Wilson EO. The ants. Harvard University Press; 1990. [Google Scholar]
- 20.Teseo S, et al. The scent of symbiosis: gut bacteria may affect social interactions in leaf-cutting ants. Anim Behav. 2019;150:239–254. [Google Scholar]
- 21.Vernier CL, et al. The gut microbiome defines social group membership in honey bee colonies. Sci Adv. 2020;6:eabd3431. doi: 10.1126/sciadv.abd3431. [DOI] [PMC free article] [PubMed] [Google Scholar]
- 22.Li L, et al. Gut microbiome drives individual memory variation in bumblebees. Nat Commun. 2021;12:6588. doi: 10.1038/s41467-021-26833-4. [DOI] [PMC free article] [PubMed] [Google Scholar]
- 23.Choi SH, et al. Individual variations lead to universal and cross-species patterns of social behavior. Proc Natl Acad Sci USA. 2020;117:31754–31759. doi: 10.1073/pnas.2002013117. [DOI] [PMC free article] [PubMed] [Google Scholar]
- 24.Geffre AC, et al. Honey bee virus causes context-dependent changes in host social behavior. Proc Natl Acad Sci USA. 2020;117:10406–10413. doi: 10.1073/pnas.2002268117. [DOI] [PMC free article] [PubMed] [Google Scholar]
- 25.Kwong WK, Moran NA. Gut microbial communities of social bees. Nat Rev Microbiol. 2016;14:374–384. doi: 10.1038/nrmicro.2016.43. [DOI] [PMC free article] [PubMed] [Google Scholar]
- 26.Bonilla-Rosso G, Engel P. Functional roles and metabolic niches in the honey bee gut microbiota. Curr Opin Microbiol. 2018;43:69–76. doi: 10.1016/j.mib.2017.12.009. [DOI] [PubMed] [Google Scholar]
- 27.Raymann K, Moran NA. The role of the gut microbiome in health and disease of adult honey bee workers. Curr Opin Insect Sci. 2018;26:97–104. doi: 10.1016/j.cois.2018.02.012. [DOI] [PMC free article] [PubMed] [Google Scholar]
- 28.Zheng H, Powell JE, Steele MI, Dietrich C, Moran NA. Honeybee gut microbiota promotes host weight gain via bacterial metabolism and hormonal signaling. Proc Natl Acad Sci USA. 2017;114:4775–4780. doi: 10.1073/pnas.1701819114. [DOI] [PMC free article] [PubMed] [Google Scholar]
- 29.Kešnerová L, et al. Disentangling metabolic functions of bacteria in the honey bee gut. PLoS Biol. 2017;15:e2003467. doi: 10.1371/journal.pbio.2003467. [DOI] [PMC free article] [PubMed] [Google Scholar]
- 30.Kešnerová L, et al. Gut microbiota structure differs between honeybees in winter and summer. The ISME journal. 2020;14:801–814. doi: 10.1038/s41396-019-0568-8. [DOI] [PMC free article] [PubMed] [Google Scholar]
- 31.Mersch DP, Crespi A, Keller L. Tracking individuals shows spatial fidelity is a key regulator of ant social organization. Science. 2013;340:1090–1093. doi: 10.1126/science.1234316. [DOI] [PubMed] [Google Scholar]
- 32.Stroeymeyt N, et al. Social network plasticity decreases disease transmission in a eusocial insect. Science. 2018;362:941–945. doi: 10.1126/science.aat4793. [DOI] [PubMed] [Google Scholar]
- 33.Kao AB, Couzin ID. Modular structure within groups causes information loss but can improve decision accuracy. Philos Trans R Soc Lond, Ser B: Biol Sci. 2019;374:20180378. doi: 10.1098/rstb.2018.0378. [DOI] [PMC free article] [PubMed] [Google Scholar]
- 34.de Groot AP. Protein and amino acid requirements of the honeybee (Apis mellifica L.) Physiol Comp Oecol. 1953;3:197–285. [Google Scholar]
- 35.Billard J-M. D-Amino acids in brain neurotransmission and synaptic plasticity. Amino Acids. 2012;43:1851–1860. doi: 10.1007/s00726-012-1346-3. [DOI] [PubMed] [Google Scholar]
- 36.Marcaggi P, Attwell D. Role of glial amino acid transporters in synaptic transmission and brain energetics. Glia. 2004;47:217–225. doi: 10.1002/glia.20027. [DOI] [PubMed] [Google Scholar]
- 37.Gage SL, Calle S, Jacobson N, Carroll M, DeGrandi-Hoffman G. Pollen alters amino acid levels in the honey bee brain and this relationship changes with age and parasitic stress. Front Neurosci. 2020;14:231. doi: 10.3389/fnins.2020.00231. [DOI] [PMC free article] [PubMed] [Google Scholar]
- 38.Kawase T, et al. Gut microbiota of mice putatively modifies amino acid metabolism in the host brain. Br J Nutr. 2017;117:775–783. doi: 10.1017/S0007114517000678. [DOI] [PubMed] [Google Scholar]
- 39.Socha E, Koba M, Koslinski P. Amino acid profiling as a method of discovering biomarkers for diagnosis of neurodegenerative diseases. Amino Acids. 2019;51:367–371. doi: 10.1007/s00726-019-02705-6. [DOI] [PubMed] [Google Scholar]
- 40.Tarlungeanu DC, et al. Impaired amino acid transport at the blood brain barrier is a cause of autism spectrum disorder. Cell. 2016;167:1481–1494. doi: 10.1016/j.cell.2016.11.013. [DOI] [PMC free article] [PubMed] [Google Scholar]
- 41.Maynard TM, Manzini MC. Balancing act: maintaining amino acid levels in the autistic brain. Neuron. 2017;93:476–479. doi: 10.1016/j.neuron.2017.01.015. [DOI] [PubMed] [Google Scholar]
- 42.Kurochkin I, et al. Metabolome signature of autism in the human prefrontal cortex. Communications Biology. 2019;2:234. doi: 10.1038/s42003-019-0485-4. [DOI] [PMC free article] [PubMed] [Google Scholar]
- 43.van der Velpen V, et al. Systemic and central nervous system metabolic alterations in Alzheimer’s disease. Alzheimer’s Res Ther. 2019;11:93. doi: 10.1186/s13195-019-0551-7. [DOI] [PMC free article] [PubMed] [Google Scholar]
- 44.Aldana BI, et al. Glutamate-glutamine homeostasis is perturbed in neurons and astrocytes derived from patient iPSC models of frontotemporal dementia. Molecular Brain. 2020;13:125. doi: 10.1186/s13041-020-00658-6. [DOI] [PMC free article] [PubMed] [Google Scholar]
- 45.Galizia CG, Eisenhardt D, Giurfa M, editors. Honeybee neurobiology and behavior: a tribute to Randolf Menzel. Springer Science & Business Media; 2011. [Google Scholar]
- 46.Menzel R. The honeybee as a model for understanding the basis of cognition. Nat Rev Neurosci. 2012;13:758–768. doi: 10.1038/nrn3357. [DOI] [PubMed] [Google Scholar]
- 47.Ellegaard KM, Engel P. Genomic diversity landscape of the honey bee gut microbiota. Nat Commun. 2019;10:446. doi: 10.1038/s41467-019-08303-0. [DOI] [PMC free article] [PubMed] [Google Scholar]
- 48.Bruno F, Angilica A, Cosco F, Luchi ML, Muzzupappa M. Mixed prototyping environment with different video tracking techniques; IMProVe 2011 International Conference on Innovative Methods in Product Design; 2011. pp. 105–113. [Google Scholar]
- 49.R Core Team. R: A language and environment for statistical computing. R Foundation for Statistical Computing; Vienna, Austria: 2020. URL http://www.R-project.org/ [Google Scholar]
- 50.Anderson KE, Rodrigues PAP, Mott BM, Maes P, Corby-Harris V. Ecological succession in the honey bee gut: shift in Lactobacillus strain dominance during early adult development. Microb Ecol. 2016;71:1008–1019. doi: 10.1007/s00248-015-0716-2. [DOI] [PubMed] [Google Scholar]
- 51.Almasri H, Liberti J, Brunet JL, Engel P, Belzunces LP. Mild chronic exposure to pesticides alters physiological markers of honey bee health without perturbing the core gut microbiota. Sci Rep. 2022;12:4281. doi: 10.1038/s41598-022-08009-2. [DOI] [PMC free article] [PubMed] [Google Scholar]
- 52.Pfaffl MW. A new mathematical model for relative quantification in real-time RT-PCR. Nucleic Acids Res. 2001;29 doi: 10.1093/nar/29.9.e45. [DOI] [PMC free article] [PubMed] [Google Scholar]
- 53.Gallup JM. PCR Troubleshooting and Optimization: The Essential Guide Ch qPCR inhibition and amplification of difficult templates. Horizon Scientific Press; 2011. pp. 23–65. [Google Scholar]
- 54.Martin M. Cutadapt removes adapter sequences from high-throughput sequencing reads. EMBnet J. 2011;17:10–12. [Google Scholar]
- 55.Callahan BJ, et al. DADA2: high-resolution sample inference from Illumina amplicon data. Nat Methods. 2016;13:581–583. doi: 10.1038/nmeth.3869. [DOI] [PMC free article] [PubMed] [Google Scholar]
- 56.McMurdie PJ, Holmes S. phyloseq: an R package for reproducible interactive analysis and graphics of microbiome census data. Plos One. 2013;8:e61217. doi: 10.1371/journal.pone.0061217. [DOI] [PMC free article] [PubMed] [Google Scholar]
- 57.Davis NM, Proctor DM, Holmes SP, Relman DA, Callahan BJ. Simple statistical identification and removal of contaminant sequences in marker-gene and metagenomics data. Microbiome. 2018;6:1–14. doi: 10.1186/s40168-018-0605-2. [DOI] [PMC free article] [PubMed] [Google Scholar]
- 58.Patassini S, et al. Identification of elevated urea as a severe, ubiquitous metabolic defect in the brain of patients with Huntington’s disease. Biochem Biophys Res Commun. 2015;468:161–166. doi: 10.1016/j.bbrc.2015.10.140. [DOI] [PubMed] [Google Scholar]
- 59.Gonzalez-Riano C, Garcia A, Barbas C. Metabolomics studies in brain tissue: A review. J Pharm Biomed Anal. 2016;130:141–168. doi: 10.1016/j.jpba.2016.07.008. [DOI] [PubMed] [Google Scholar]
- 60.Belle JEL, Harris NG, Williams SR, Bhakoo KK. A comparison of cell and tissue extraction techniques using high-resolution 1H-NMR spectroscopy. NMR Biomed. 2002;15:37–44. doi: 10.1002/nbm.740. [DOI] [PubMed] [Google Scholar]
- 61.Wanichthanarak K, Jeamsripong S, Pornputtapong N, Khoomrung S. Accounting for biological variation with linear mixed-effects modelling improves the quality of clinical metabolomics data. Comput Struct Biotechnol J. 2019;17:611–618. doi: 10.1016/j.csbj.2019.04.009. [DOI] [PMC free article] [PubMed] [Google Scholar]
- 62.Bolger AM, Lohse M, Usadel B. Trimmomatic: a flexible trimmer for Illumina sequence data. Bioinformatics. 2014;30:2114–2120. doi: 10.1093/bioinformatics/btu170. [DOI] [PMC free article] [PubMed] [Google Scholar]
- 63.Dobin A, et al. STAR: ultrafast universal RNA-seq aligner. Bioinformatics. 2013;29:15–21. doi: 10.1093/bioinformatics/bts635. [DOI] [PMC free article] [PubMed] [Google Scholar]
- 64.Wallberg A, et al. A hybrid de novo genome assembly of the honeybee, Apis mellifera, with chromosome-length scaffolds. BMC Genomics. 2019;20:1–19. doi: 10.1186/s12864-019-5642-0. [DOI] [PMC free article] [PubMed] [Google Scholar]
- 65.Li H, et al. The Sequence Alignment/Map format and SAMtools. Bioinformatics. 2009;25:2078–2079. doi: 10.1093/bioinformatics/btp352. [DOI] [PMC free article] [PubMed] [Google Scholar]
- 66.Robinson MD, McCarthy DJ, Smyth GK. edgeR: a Bioconductor package for differential expression analysis of digital gene expression data. Bioinformatics. 2010;26:139–140. doi: 10.1093/bioinformatics/btp616. [DOI] [PMC free article] [PubMed] [Google Scholar]
- 67.Ritchie ME, et al. limma powers differential expression analyses for RNA-sequencing and microarray studies. Nucleic Acids Res. 2015;43:e47. doi: 10.1093/nar/gkv007. [DOI] [PMC free article] [PubMed] [Google Scholar]
- 68.Durinck S, Spellman PT, Birney E, Huber W. Mapping identifiers for the integration of genomic datasets with the R/Bioconductor package biomaRt. Nat Protoc. 2009;4:1184–1191. doi: 10.1038/nprot.2009.97. [DOI] [PMC free article] [PubMed] [Google Scholar]
- 69.Falcon S, Gentleman R. Using GOstats to test gene lists for GO term association. Bioinformatics. 2007;23:257–258. doi: 10.1093/bioinformatics/btl567. [DOI] [PubMed] [Google Scholar]
- 70.Reijnders MJ, Waterhouse RM. Summary visualisations of Gene Ontology terms with GO-Figure! Front in Bioinform. 2021;1:638255. doi: 10.3389/fbinf.2021.638255. [DOI] [PMC free article] [PubMed] [Google Scholar]
Associated Data
This section collects any data citations, data availability statements, or supplementary materials included in this article.
Supplementary Materials
Data Availability Statement
Raw RNA-sequencing data have been deposited in NCBI's Gene Expression Omnibus and are accessible through GEO Series accession number GSE192784 (https://www.ncbi.nlm.nih.gov/geo/query/acc.cgi?acc=GSE192784), while raw amplicon-sequence data are available on Sequence Read Archive (SRA) under accession PRJNA792398.
Raw data tables, metadata and codes are available on GitHub at https://github.com/JoanitoLiberti/The-gut-microbiota-affects-the-social-network-of-honeybees. Additional input files required to reproduce the automated behavioral tracking analyses are available on Zenodo at: https://doi.org/10.5281/zenodo.5797980.


