Abstract
The solvation of the zinc finger protein with the PDB-ID “5ZNF” in hydrated ionic liquids was studied at varying water content. 1-Ethyl-3-methylimidazolium and trifluoromethanesulfonate were the cation and anion, respectively. The protein stability as well as the solvation structure, the shell dynamics and the shell resolved dielectric properties were investigated by means of molecular dynamics simulations. The lengths of the respective trajectories extended up to 200 nanoseconds in order to cover the complete solvent dynamics.
Considering the above mentioned properties as a function of the water content they all exhibit a maximum or minimum at the very same mole fraction xH2O = 0.927. This behaviour may be traced back to the competition between the van der Waals and the electrostatic energy of the protein as well as to the transition from aqueous dielectric screening to ionic charge screening with decreasing water content.
The parameter-free Voronoi decomposition of space served as a basis for the analysis of most results. In particular, solvation shells were naturally inferred from this concept.
Keywords: molecular dynamics, hydrated ionic liquids, protein, solvation, shell, Voronoi, dielectric
1. Introduction
Molecular ionic liquids (MIL) are an environmentally friendly alternative to traditionally used volatile organic compounds. This role as green chemistry solvents becomes most obvious in biomolecular solvation. In fact, MILs may enhance the stability and/or the catalytic activity of certain enzymes [23, 21]. Furthermore, the range of enzymes can be extended using mixtures of water and MILs, so-called hydrated ionic liquids. Thereby, water as well as MILs may act as a co-solvent [16, 25, 41, 5, 38, 8, 26, 39, 9, 17, 10].
While macroscopic, thermodynamic or kinetic data are available for many enzyme- or protein-MIL (-water) solutions e.g. Ref. [4] and citations therein, their explanation at the molecular level lags behind. In other words, experimentally and computationally, molecular solvation studies so far focus on small molecules like, CO2, benzene, chromophores, etc. Experimentally, a summary of structural data from neutron diffraction may be found in [40, 11]. Corresponding dynamic results obtained by fluorescence spectroscopy and similar techniques are reported in Ref. [15, 1, 29]. A comprehensive summary of simulation studies is given in Ref. [19].
Solvation studies of proteins at molecular resolution focus mainly on the aqueous environment [33, 27, 6]. Rare examples where ionic liquids act as a solvent or co-solvent are Ref. [20] and Ref. [24].
This study presents extensive simulations and detailed analyses of a zinc finger protein in hydrated ILs. We have chosen this model protein for several methodological reasons: First, the solute should exhibit characteristic secondary structure elements of a protein, α-helix and β-sheet. Second, it should be small enough to permit the inclusion of a sufficient number of solvent shells. This is important for several reasons: (a) The molecular volume of the cations and anions of MILs exceeds that of water by a factor of three to seven. Therefore, even a single solvation shell needs considerable space. (b) Due to the strong electrostatic coupling of charged species one needs several solvation shells in order to achieve the undisturbed formation of the first and second solvation layer. If the number of shells would be restricted to these first layers boundary artifacts would emerge. (c) In order to avoid surface artifacts computer simulation of solutions are performed under periodic boundary conditions. In an aqueous environment the high dielectric constant of water perfectly screens the protein solute and thus suppresses spurious self-interactions between solute replica. As the dielectric constant of MILs is 10 to 15 [34, 37, 31] the screening effect is modest and has to be compensated by the inclusion of more solvation shells. Third, the complete system, protein plus solvent, must be simulated for a time period of 100 nanoseconds and more in order to permit appropriate sampling that covers slow relaxation processes. We think that the zinc finger protein with the Protein Data Bank (PDB) ID “5ZNF” fulfils all these requirements to a high extent. As compared to the standard zinc finger motif PDB-ID “1ZNF” the number of charged amino acids is enhanced thus offering additional target sites for strong electrostatic interaction with solvent ions.
As a solvent we use the hydrated ionic liquid with 1-ethyl-3-methylimidazolium (EMIM+) as the cation and trifluoromethanesulfonate as the anion. EMIM+ was chosen because – together with its butyl-analogue – it is the most frequently used cation in experimental studies. was used because of its resemblance to the frequently used bis(trifluoromethane)sulfonimide [26] and the absence of conformational flexibility which would complicate interpretation. Furthermore, its high polarity enables the necessary dielectric screening. In order to elucidate the mutual interplay of the three solvent species, EMIM+, and water, both in the solvent layers of the protein and in the bulk, we have studied five systems of varying molar water fractions 1, three of which cover 200 nanoseconds.
Solvation studies are intrinsically connected with the concept of solvation shells. Traditionally, distance-based methods are used to define these shells. However, this involves a plethora of parameters which must predefined. As a major methodological innovation our analysis of solvation shells is exclusively based on the Voronoi method which is a parameter-free technique to decompose space. Although computationally very expensive Voronoi decomposition of space is prerequisite for most results presented in this study which comprise: protein stability in terms of volume, surface and contact matrices, solvation structure in terms of coordination numbers, solvent contacts and distribution as well as shell dynamics characterised by mean residence times. Finally, the dielectric behaviour of the whole solution is decomposed into contributions from the protein, the first and second solvation shell and bulk.
2. Theory
2.1. Dielectric Permittivity and Mesoscopic Electrostatic Interaction Energy
If a sample containing a set of charges {qi} located at positions is exposed to a spatially homogeneous external electric field each charge experiences a potential Therefore, the interaction energy of the charge set with the external field is given by
| (1) |
Here, is the total dipole moment and is a measure of the electric anisotropy of the sample. It should be noticed that is uniquely defined for a neutral charge set only (∑i qi = 0). Otherwise a point of reference has to be specified
| (2) |
In equilibrium, i.e. in the absence of an external field, the average value of is zero. In the presence of an external field a residual value remains. It can be shown that for not to strong external fields this residual value is given by
| (3) |
Therefore, the average interaction energy of the charge set with external field is proportional to the mean square equilibrium dipole moment [27]
| (4) |
This theoretical relations are linked to experiment by the so-called constitutive relation
| (5) |
involving the Maxwell field and the susceptibility χ. The Maxwell field is the sum of the external field and the average net field exerted by the molecules of the sample. The difference between both fields, external and Maxwell field, may be quite important. Only in case of so-called conducting boundary conditions [18, 2] they are equal. For this special case the combination of equations 3 and 5 leads to
| (6) |
Here, we have expressed the susceptibility in terms of the experimentally accessible dielectric permittivity ε. Furthermore, T and V are the temperature and volume of the sample.
Strictly speaking, this relation is restricted to samples composed of neutral molecules. In case of molecular ions, one has to add the so-called dielectric conductivity [30, 35] which can be shown to be of little influence in the present case (data not shown).
2.2. Dipolar Decomposition
While dielectric experiments measure the total mean square dipole moment the detailed information provided by computer simulations offers a decomposition of the total dipole moment As both, the dielectric permittivity as well as the mesoscopic interaction energy involve the square of the dipole moment , a linear decomposition automatically creates self terms, and cross terms
| (7) |
In the result section we will use three different types of decomposition: 1. species-specific ( for the protein 5ZNF, for H2O, for EMIM+, for ), 2. shell-specific ( for the first shell, for the second, and for the bulk), and 3. per residue ( for amino acid k).
| (8) |
| (9) |
| (10) |
2.3. The Poisson-Boltzmann Equation
When we presented the relations for the dielectric properties of a solution we started from the electrostatic potential This quantity is also important for ionic solutions, i.e. systems where cation and anions are dissolved in a solvent, usually water. Under the assumption that the solvent can be simplified to a dielectric continuum the electrostatic potential acting in such solutions can be computed from the Poisson-Boltzmann equation:
| (11) |
Here, ε and κ are material constants. ε is the dielectric constant of the solvent, for pure water ε = 78. The inverse of κ is called Debye screening length and measures the thickness of the solvent layer around the ions. It is related to the ionic strength I
| (12) |
by the relation
| (13) |
with e being the electronic charge and T the temperature. Since in our systems the concentrations, c, of cations and anions are almost equal and the charge number zi = ±1, the ionic strength I is identical to the concentration cIL. Equation 11 may be generalised to heterogeneous systems by introducing spatially varying material constants and
| (14) |
In this form it is frequently used for the qualitative description of biomolecular solvation. Practically, the biomolecule is represented by a cavity of ε = 1 and κ = 0, while the ionic solution outside is represented by its material constants. Since the ion distribution is implicitly included via κ in the Poisson-Boltzmann equation, one only has to add the explicit charge distribution of the biomolecule. While the simple Poisson-Boltzmann equation (Equation 11) can be solved analytically its extended version (Equation 14) must be solved numerically using techniques from finite element methods [14].
2.4. Residence Times
As solvation shells are not static but evolve in time we have introduced a binary residence function for a single solvent particle i
| (15) |
depending on whether particle i is a member of a solvation shell or not at time t. We emphasise that the molecular identity is conserved, i.e. recurrence of a particle is not recognised as the entrance of a new particle into the solvation shell. {ni(t)} is a time series, simply a sequence of 1s or 0s. In order to get a concise measure of such a time series one traditionally uses time correlation functions
| (16) |
One term in the above sum represents the memory of a specific solvent particle to be still a member of the solvent shell after some time interval t. The initial value 〈ni(0)ni(0)〉 represents the probability of a particle i to be a member of the first shell. The sum over all particles N gives the coordination number Cn(t = 0) =CN. Particles which are not members of the first shell are automatically ruled out by a zero residence function ni(t) = 0. In other words, Cn(t) describes the memory of the average particle.
As opposed to many correlation functions which decay to zero in the longtime limit Cn(t) approaches a steady state
| (17) |
The characteristic time to reach this steady state may be interpreted as a mean residence time (MRT). The easiest way to get the MRT is to fit Cn(t) to the analytical expression [22]
| (18) |
Here, N denotes the number of solvent molecules. Those molecules with a long residence time, i.e. “bound” molecules, have to be subtracted from N. This type of Kohlrausch-William-Watts functions (KWW) is an extension of a monoexponential relaxation to a more complex shell dynamics. This transition is modelled by a single parameter β. The smaller β the larger the deviation from monoexponential behaviour, or equivalently, the larger the spread of relaxation times. The average over this distribution of these relaxation times is given by the analytic expression
| (19) |
where Γ denotes the Gamma function representing the generalisation of the factorial to real numbers.
3. Methods
3.1. System Setup Procedures
Five molecular dynamics simulations of 5ZNF in hydrated MIL, with varying water mole fraction xH2O between 1.0 and 0.675 were performed with the software package charmm (Ref. [3]). To set up the simulation system the coordinates from the 5ZNF PDB-entry were used for the protein. For the solvent, first, EMIM+ and molecules were placed randomly around the protein like in a Monte-Carlo simulation where each addition of a molecule is a move which, depending on the energy, can be accepted or not. Then equilibrated water boxes with TIP3P [12] as the water model were overlaid and overlapping water molecules removed. Finally, a box with the geometry of a truncated cubooctahedron was cut out which is more spherical than a cube and has exactly one half of the volume of a circumscribed cube. Subsequently, the energy of this MD-system was minimised and an equilibration run in the constant pressure, constant temperature (T = 300K) (CPT) ensemble was started with a time step of Δt = 2fs. This value of the time step was used for all further simulations. After one nanosecond the average edge length of the truncated cubooctahedron was fixed (Table 1) and the equilibration was continued in the constant volume, constant temperature (NVT) ensemble for another nanosecond. The simulation was continued in the NVT ensemble for up to 200 nanoseconds for the five systems.
Table 1.
Basic properties of the simulated systems: water mole fraction xH2O, ion concentration cIL, number of molecules #, mass density ρ, edge length of the truncated cubooctahedron d, MD-system volume V. The water mole fraction xH2O and the ionic strength, or equivalently, the ion concentration cIL, are used to label the MD-systems.
| 1.0 | 0 | 4 | 5061 | 0 | 1022.29 | 58.6 | 155035 |
| 0.927 | 2.36 | 200 | 204 | 2557 | 1206.82 | 56.8 | 140873 |
| 0.854 | 3.38 | 300 | 304 | 1766 | 1286.62 | 57.6 | 147330 |
| 0.751 | 4.09 | 312 | 316 | 947 | 1343.99 | 54.8 | 126670 |
| 0.675 | 4.41 | 345 | 349 | 721 | 1369.44 | 55.2 | 129792 |
The forces acting between the components of the system were computed in the following way: The force field parameters of the protein were taken from charmm. For the solvent molecules, the parameters were identical to those already used in Ref. [36]. The mutual interaction between the protein and the solvent was modelled by electrostatic interactions and Lennard-Jones terms. In the latter case mixing rules between the solute and solvent force field were used. The procedure to handle the long range electrostatic forces was along the lines described in the Method section of Ref. [36]. All bond lengths were kept fixed by the SHAKE algorithm [28], whereas bond angles and torsions are left flexible.
3.2. Spatial Decomposition and Definition of Solvation Shells
Once a solute is immersed in a solvent it structures its neighbourhood. This automatically poses the question how to classify the degree of neighbourhood. Intuitively, one thinks of solvation shells. For a small solute composed of a few atoms the concept of concentric spherical shells is appropriate. For a large, anisotropic solute, however, this concept has to be extended. In particular, for a solvent composed of rather different molecular species, a distance based shell concept does not account for this heterogeneity. Therefore, alternative routes to decompose the space around a large solute have to be followed. Thereby the introduction of parameters should be avoided. The method of Voronoi tesselation offers such a parameter free decomposition.
Given a set of points representing atomic coordinates, a Voronoi decomposition creates an ensemble of space-filling disjunct polyhedra, each containing all space closer to its associated point than to any other point of the given set.
The faces of each of these Voronoi polyhedra are constructed by planes perpendicular to the vectors between the associated point and its neighbour points.
As the direct construction of Voronoi polyhedra is computationally demanding one exploits the duality between Voronoi decomposition and Delaunay tesselation. We have implemented a very efficient Delaunay algorithm the details of which are described in Ref. [32].
As a final result there is a one-to-one correspondence between each atom and its Voronoi polyhedron. Of course, the sum of all Voronoi polyhedra gives the volume of the whole sample.
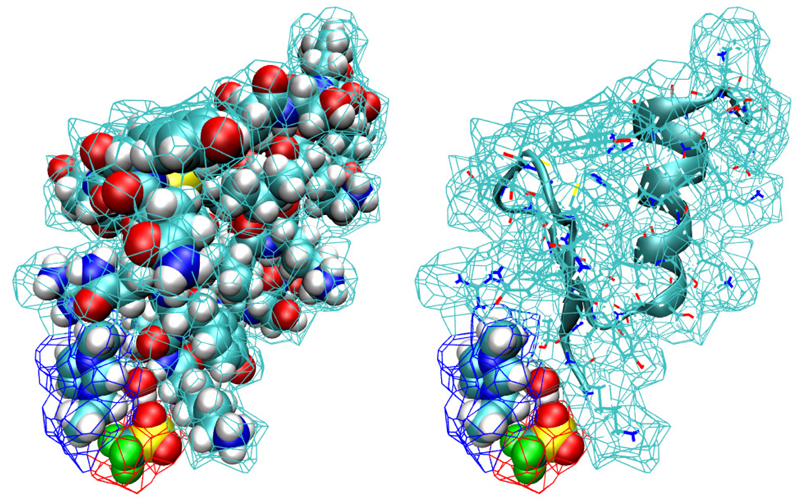
With this result at hand the definition of neighbourhood and solvation shells is straight forward. If the polyhedron of a solute atom shares a common face with the polyhedron of a solvent atom, the respective solvent molecule is called a first neighbour. The set of all these first neighbours constitutes the first solvation shell. Solvent molecules outside the first shell but sharing a polyhedral face with members of the first shell belong to the second shell and so on. In this way the solvent is organised in successive layers. In order to get a visual impression we present figure 1 which shows the union of the atomic Voronoi polyhedra of the solute, the protein 5ZNF. Each face of a Voronoi polyhedron can be classified as an inner or an outer face depending on whether it has already contact to another polyhedron of the same solute or not. The union of all outer faces constitutes the Voronoi surface of the solute which is offered to the polyhedra of the solvent molecules. Those who have contact create the first solvation shell. As a symbolic example we have also given in figure 1 a single water, EMIM+ and molecule with their respective polyhedra as members of the first shell.
Figure 1. Union of the atomic Voronoi polyhedra of 5ZNF and 3 solvent molecules (EMIM+, and H2O) in the first shell.
(a) All atoms displayed by their vdW-spheres. (b) 5ZNF displayed as structure with ribbon diagram.
3.3. Occupancy
Mole fraction, concentration or ionic strength are traditional measures to specify the composition of a solution. However, they tell nothing about the space covered by a species. This occupancy can be easily derived from a Voronoi decomposition. The sum of all polyhedral volumes of all atoms of a species is the space occupied by that species. In figure 2 we depicted the relative occupancy of the four species, protein, water, EMIM+ and for each simulated system.
Figure 2. Piecharts illustrating the volume-volume percentage, the occupancy, of 5ZNF, EMIM+, and H2O for each system.
One can see that at a mole fraction of xH2O = 0.927 water covers slightly more than only one half of the entire volume. Alternatively, at xH2O = 0.675 EMIM+ already covers more than one half of the volume. This behaviour comes from the difference in molecular Voronoi volumes which are – on average – 30Å3 for water, 200Å3 for EMIM+ and 100Å3 for
4. Results & Discussion
Here, we will present and discuss results for the protein itself and its immediate neighbourhood, the so-called first solvation shell. This analysis will be completed by a mesoscopic view based on the whole system’s static dielectric properties. All properties were computed by averaging over the complete length of the trajectories with a graining appropriate to the statistical variation of the respective property.
4.1. The Protein itself
4.1.1. Protein Volume and Surface
As a starting point we have calculated the protein’s Voronoi volume and surface. For each mole fraction of water or equivalently, each ionic strength, we found a Gaussian distribution, slightly skewed to high values. The mean values of these distributions are given in table 2. Only a slight variation of these mean values as a function of ionic strength is observed. Yet there is an indication, that the behaviour at xH2O = 0.927 is somewhat exceptional. In order to clear up this point we have also computed the mean extension of the protein along its three principal axes of inertia. The three average values a =< xmax − xmin >/2,b =< ymax − ymin >/2,c =< zmax − zmin >/2 are given in table 2, too. Considering a, b and c as the axes of a general ellipsoid it is possible to compute alternative values for the volume and surface using the formulas V = 4π/3 · abc and S = ((ab)1.6 + (ac)1.6 + (bc)1.6)1/1.6/3. We have used the formulas for a general ellipsoid, although the close proximity of b and c as compared to a favour the picture of a prolate ellipsoid. Here, the exceptionality at xH2O = 0.927 becomes obvious for the first time as a maximum of these elliptic volumes. (The corresponding surfaces, however, show no clear trend.) Upon closer inspection the maximum of the elliptic volume comes from the increase of b, i.e. the ellipsoid is slightly shifted towards an oblate shape. For higher ionic strengths the protein again seems to relax to a prolate shape. The elliptic volumes almost double the Voronoi volumes. This might be explained by the fact, that the protein is not a strict convex body but is characterised by several concave regions which contribute a lot to the surface area but not to the volume.
Table 2. Volumes and surfaces of the protein in the simulated systems calculated by means of Voronoi decomposition of the system and ellipsoid approximation of the protein.
| 1.0 | 0 | 4574 | 2928 | 18.4 | 11.5 | 9.1 | 8066 | 2071 |
| 0.927 | 2.36 | 4570 | 2942 | 17.5 | 12.35 | 9.0 | 8148 | 2073 |
| 0.854 | 3.38 | 4602 | 2953 | 17.3 | 11.75 | 9.3 | 7919 | 2019 |
| 0.751 | 4.09 | 4609 | 2918 | 18.35 | 11.75 | 9.0 | 8128 | 2085 |
| 0.675 | 4.41 | 4621 | 2934 | 17.35 | 11.3 | 8.9 | 7309 | 1928 |
4.1.2. Structural Behaviour of the Backbone
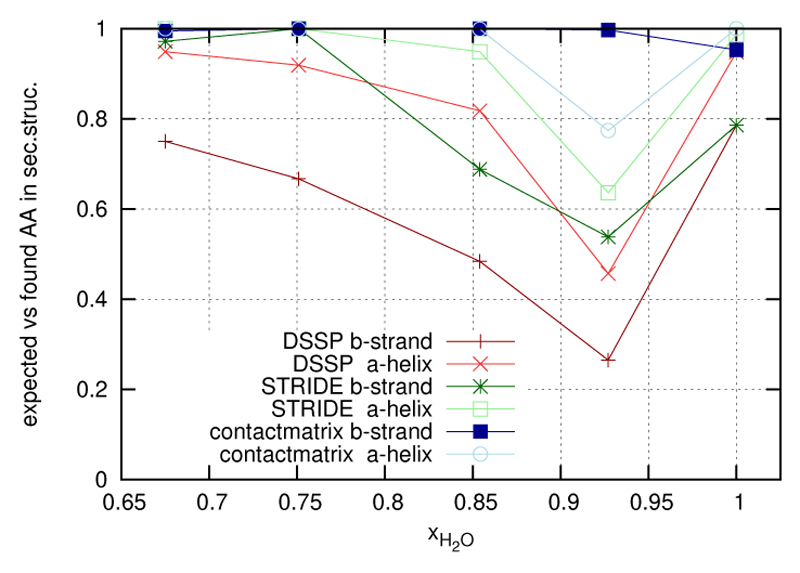
The crystal structure of the protein as given in the Protein Data Bank entry “5ZNF” shows two principal secondary elements, an antiparallel β-sheet around amino acids 3,4,11, and 12 and an α-helix extending from amino acid 15 to 25. We have analysed the behaviour of these structural elements in a three-fold manner: By the DSSP and the STRIDE method [13, 7] as well as by a self designed method based on contact matrices derived from Voronoi tesselation.
DSSP
Discarding the initial 5ns, a timeseries of snapshots taken at every 100ps was analysed with the DSSP program. The resulting evaluation was compared to the standard secondary structure given in the PDB. The respective amino acids 3,4,11 and 12 constituting the β-sheet and residues 15 to 25 building up the α-helix were assigned a value of 1 or 0 depending on whether the DSSP evaluation agrees with the PDB standard or not. This secondary structure indicator was subsequently averaged over all frames considered as well as over all residues within a secondary structure element, β-sheet or α-helix. The dependence of the resulting indicators on the ionic strength is displayed in figure 3. Now the exceptionality at the point xH2O = 0.927 becomes pretty obvious as a minimum of the secondary structure indicator.
Figure 3.
The secondary structure indicators from the results of DSSP, STRIDE and contact matrix are given for the two secondary structures of the protein 5ZNF.
STRIDE
Applying an analogous procedure of secondary structure indicator assignment to the evaluation results of the STRIDE method the respective curves given also in figure 3 were obtained. The pronounced minimum is again visible but the additional criteria and features typical for STRIDE somewhat flatten the curve.
Contact Matrix
Alternatively to the standard methods DSSP and STRIDE we have used a simple criterion to define turns and bridges on the basis of Voronoi tesselation: If two amino acids i and i + 4 have a common Voronoi face they are termed a 1-4-turn. More that two subsequent 1-4-turns define an α-helix. An analogous criterion based on Voronoi contacts is used to define a β-sheet. The resulting curves are shown in figure 3, too. It turns out that this mild criterion produces a minimum for the α-helix. The respective curve for the β -sheet is almost constant with a slight decline at zero ionic strength.
4.1.3. Structural Behaviour of the Side Chains
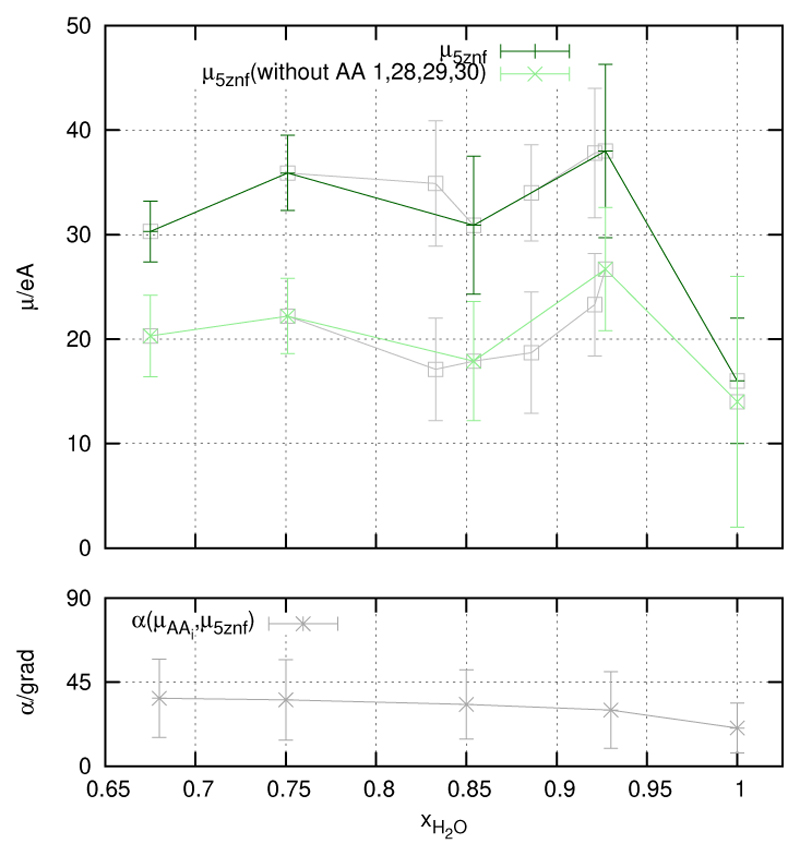
With the secondary structure indicator we have characterised the backbone in a global way. As a global indicator of the side chains we use the protein’s net dipole moment μ5ZNF (Figure 4). One might argue that the α-helical part of the backbone contributes to μ5ZNF as well. This is certainly true but we have found that in our case its contribution is around 20%. In other words, μ5ZNF is essentially determined by the dipole moments of the side chains. In order to ascertain that the “fraying ends” (lys1,lys28,glu29,lys30) do not play a major role we have computed their contribution separately. Of course, they make a contribution at the quantitative level but do not affect the qualitative interpretation.
Figure 4.
Upper part: The dipole moment of the protein is given, from the entire protein (dark-green), and the protein without “fraying ends”–amino acids (lys1, lys28, glu29, lys30) (light-green). The respective values from the additionally simulated systems are given in grey. Lower part: Δα.
Again we find a maximum at xH2O = 0.927 in accordance with the minima of the secondary structure indicator of the backbone. Therefore the whole structure of the protein, backbone and side chains, behave in a synchronous manner. In order to elucidate the maximum we have decomposed μ5ZNF into contributions from the individual amino acids. Thereby, all charge positions were referred to the center of mass of the protein This ensures the additivity of all dipole moments referring to residues or any other arbitrary division into atom groups. It is interesting to analyse length of the residual dipole moments and the angle they make with separately. While the lengths of the residual moments do not vary significantly with ionic strength, the angles are strongly affected. In order to have a globular measure of angular distribution we have computed the average absolute deviation of all angles from 90°, i.e. from random orientation (table 3). As can be seen from the table this value increases monotonically with ionic strength. In other words, residual dipoles orient more and more in the direction of the net dipole moment By the way, approximately coincides with the b-axis of the inertia ellipsoid. Again we have paid attention to the “fraying ends” lys1, lys28, glu29, and lys30 as well as to the zn31 center. They give quantitative contribution but they do not change the qualitative interpretation.
Table 3.
The absolute deviation from 90° of the angle between the dipole vector for an amino acid i, and the dipole vector for the entire protein was averaged over all timesteps and all amino acids (Δα).
| 1 | 20.4 |
| 0.927 | 30.1 |
| 0.854 | 33.1 |
| 0.751 | 35.5 |
| 0.675 | 36.4 |
4.1.4. Energetic Analysis
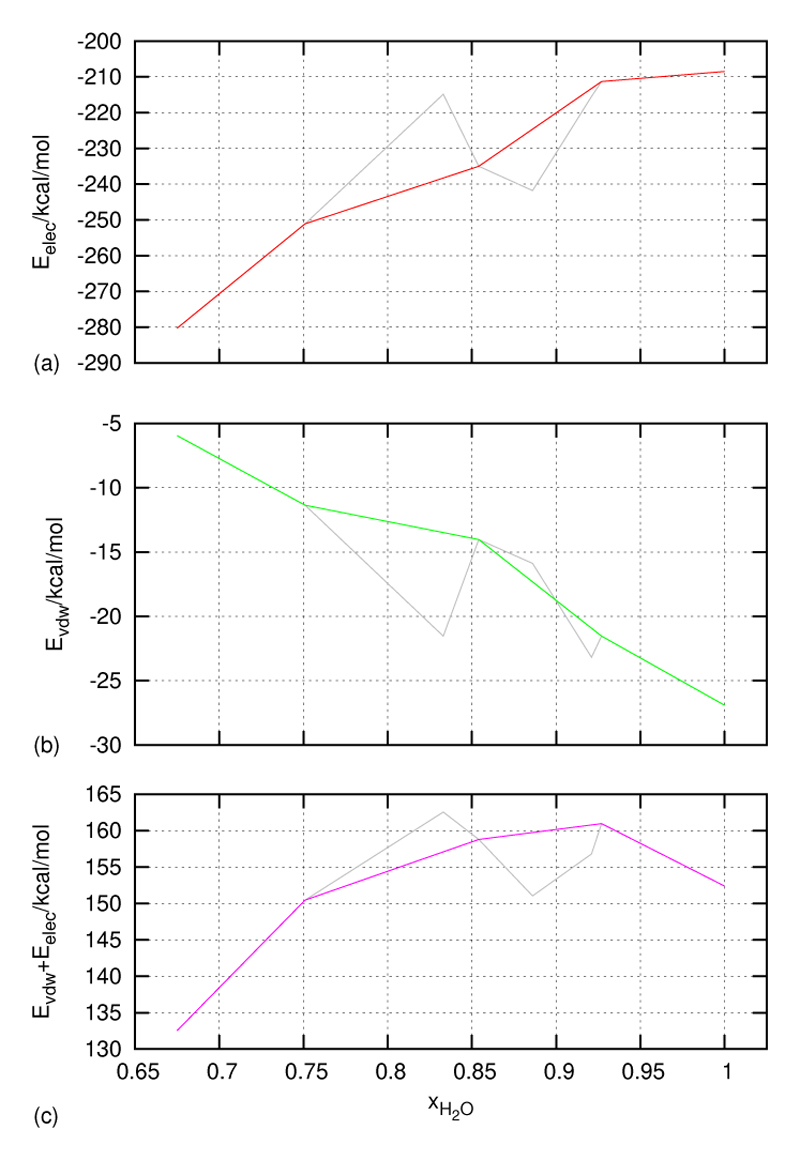
So far we have found that at the mole fraction xH2O = 0.927 the volume of the inertia ellipsoid has a maximum, the secondary structure indicator of the backbone displays a minimum – for all three methods: DSSP, STRIDE and contact matrices – and the net dipole moment of the protein shows a maximum again. In order to search for a common root of this synchronous behaviour of a plethora of properties we have performed an energy analysis. Starting from the total energy of the protein, i.e. neglecting any interaction with the solvent, we first observed that the so-called bonded interactions (bond lengths, bond angles, dihedral angles, etc.) show almost no variation with ionic strength and thus can be ignored for a qualitative interpretation. Thus the energetic analysis reduces to the interplay of van der Waals (EvdW) and electrostatic interactions (Eelec). In fact, both are a monotonic function of ionic strength. The first one rises, whereas the latter decays monotonically. As the slope is different the sum of both exhibits a maximum, right at the point xH2O = 0.927 where we have shown that all properties discussed so far exhibit an exceptional behaviour. In order to secure that this magic point xH2O = 0.927 is not an artifact we have also simulated systems with nearby mole fractions xH2O = 0.921, xH2O = 0.886 and xH2O = 0.833 but of shorter trajectory length. The results are in close correspondance to that of the magic point.
On the level of interpretation the interplay of van der Waals and electrostatic energy maybe viewed from the contributions of the individual amino acids. The change from solvation in pure water to solvation in hydrated ionic liquids corresponds to a transition from dipolar screening to charge screening of electrostatic forces. Dipolar screening means that the small water molecules penetrate the space between amino acids screen the electrostatic interactions and reduce their mutual attraction or repulsion. On the contrary, their size prevents molecular ions from migration between residues. Therefore they propagate or transmit their electrostatic potential in order to screen the solute’s charges. Once this charged screening has established the approaching amino acids are no longer hindered by interstitial water molecules and can attract each other without any steric hindrance by the solvent. However, the enhanced electrostatic attraction of residues is accompanied by an increase of their van der Waals interactions.
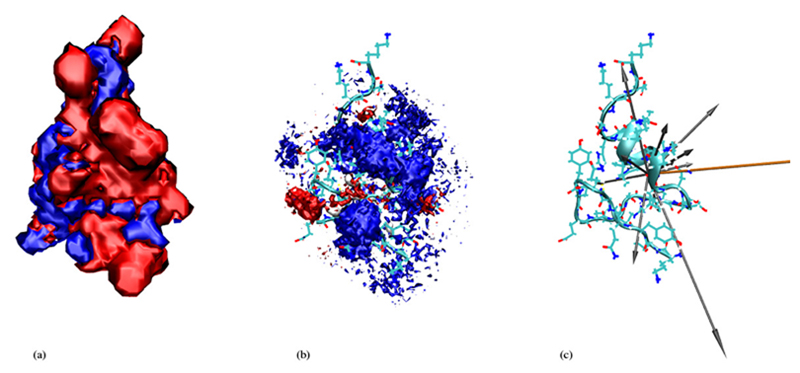
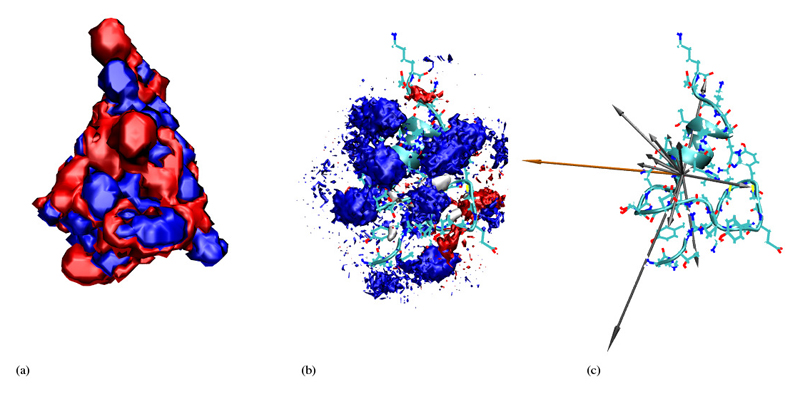
This also explains the enhanced dipolar correlations: As the interaction of a pair of dipoles is proportional to their negative scalar product divided by the cube of the mutual distance, residue dipoles pointing in the same direction as the total dipole moment are energetically favoured. Visualising the residue dipoles as pick-up sticks as done in figure 6 one may speak of a “Mikado”-effect: With increasing water content the intruding water molecules open the cone of pick-up sticks. The mole fraction xH2O = 0.927 seems to be the transition state where dipolar screening changes to charge screening. At this point dipolar screening is considerably weakened but charge screening isn’t fully active already. This generates a non optimal situation for the solvation of the zinc finger protein since regions with dipolar screening are intercalated with regions of charge screening. Beyond the transition point charge screening dominates. This can be also seen from the decreasing influence of the van der Waals energy and the dominance of the electrostatic energy. In this way the transition point corresponds to the highest total energy which explains the lowest level of ordering of the zinc finger protein in terms of secondary structure elements.
Figure 6. Front view for xH2O = 0.927.
(a) The blue isosurface represents -0.5kcal/mole, the red one +0.5kcal/mole. (b) Cations are represented by red, anions by blue and water molecules by gray clouds. (c) Structure of 5ZNF and secondary structure as a ribbon diagram, as well as the dipole vectors for charged amino acids (in grey) and for the total protein 5ZNF (in orange). The 3D density in figure (b) is sampled from the entire trajectory, figures (a) and (c) represent snapshots of the protein.
4.2. The Protein’s Immediate Neighbourhood
4.2.1. 3D Solvent Densities
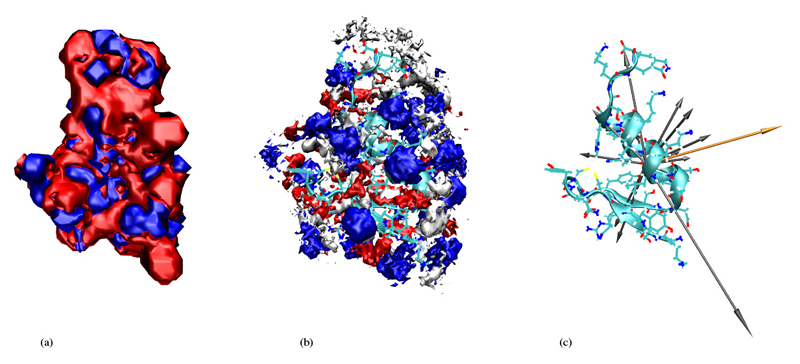
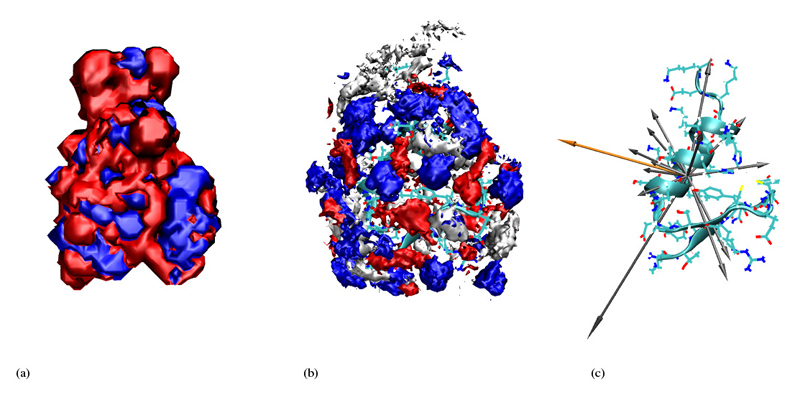
In order to get an intuitive expression of the distribution of cations and anions as well as water molecules around the protein we start with figures 6, 7, 8 and 9 which refer to the highest and lowest non-zero ionic strengths. In the middle of these figures we give the 3-dimensional histogram of the distribution of solvent molecule centers around the protein where we used the center of mass as a point representation. These histograms were constructed by subdividing the whole space into little cubes (bins) of edge length 0.5Å. If the center of a solvent molecule falls within such a cube the bin entry is incremented by one. Having run through all frames the histogram is normalised to the average density. All entries below 2.5 times the average density were subsequently eliminated. The so-obtained importance histogram was displayed as a set of clouds, both as a front and a back view. For a better understanding of these cloud histograms we have also computed the contour isosurfaces of the electrostatic potential as a solution of the Poisson-Boltzmann equation [14]. Thereby, the actual ionic strength as well as the simulated dielectric constant to be discussed in the next section were used as input parameters.
Figure 7.
Back view for xH2O = 0.927. Parameters and keys are the same as in Figure 6.
Figure 8.
Front view for xH2O = 0.675. Parameters and keys are the same as in Figure 6.
Figure 9.
Back view for xH2O = 0.675. Parameters and keys are the same as in Figure 6.
For low ionic strengths the histogram of ion centers follows – at least qualitatively – the solution of the Poisson-Boltzmann equation. In other words, anions cluster preferentially in regions of positive electrostatic potential. The preference of the cations for the negative regions is not so pronounced. As we shall see later in the section discussing mean residence times this has to do with the higher mobility of the cations. The only region with a pronounced density of cations is a part of the protein surface with no preferred sign of the electrostatic potential because of the absence of charged amino acids. This region of polar amino acids is also concave from a steric point of view. So it might be called “fossa neutralis”. The meaning of this special region will become clearer on a more quantitative level when discussing the residue-resolved contact matrices in the next section. For high ionic strenghts the distribution of ions departs from the solution of the Poisson-Boltzmann equation: Anions and cations organize in an alternating patchwork of charge clouds. The regions of ion densities with uniform sign are broken up into islands of alternating sign. This might be explained by the mutual repulsion of like charges which becomes more and more important when the ionic strength and thus the number of charge carriers increases. In addition the increase of ionic strenghts goes along with the reduction of the amount of water and a subsequent loss of dielectric screening. One might get the impression water molecules reside preferentially at the C-terminus. One has to bear in mind, however, that the heavy ions – in contrast to the mobile water molecules – cannot really follow the motions of the highly flexible C-terminal end (“fraying ends”). Therefore, they are ruled out by the density threshold of 2.5. Furthermore, the small water molecules can fill out gaps as already discussed in the energetic analysis above.
4.2.2. Coordination Number of the Protein
Within the Voronoi method coordination numbers can be easily computed: Every solvent molecule which has a common Voronoi face with the protein is a first neighbour or belongs to the first solvation shell. Table 4 collects the coordination numbers for all three solvent species at all ionic strengths studied. What is striking at first sight is the higher coordination number of cations as compared to that of anions despite of the fact that the protein is positively charged (+4e). This excess of cations becomes even clearer when normalising the coordination numbers to the number of solvent molecules of that species. As table 4 shows, this normalised coordination numbers are constant for water and anions, but increase with ionic strength for cations. In some sense one might argue that there is a tendency to exclude cations from the water-anion system thus forcing some cations to approach the protein surface. The alternative view is that the protein extracts the cations from the solvent. However, an intensive search based on atom-atom pair correlation functions favours the former view (results too bulky to be shown).
Table 4. Absolute (CNSpecies) and relative coordination numbers for 5ZNF and the solvent molecules.
| 1 | 0 | 319.6 | 1.41 | 0.06 | 0 | ||
| 0.927 | 2.36 | 196.28 | 25.05 | 23.65 | 0.08 | 0.13 | 0.12 |
| 0.854 | 3.38 | 138.78 | 38.88 | 32.5 | 0.08 | 0.13 | 0.11 |
| 0.751 | 4.09 | 89.69 | 48.59 | 39.58 | 0.09 | 0.16 | 0.13 |
| 0.675 | 4.41 | 64.86 | 51.39 | 40.72 | 0.09 | 0.15 | 0.12 |
In addition we have individually spotted excess cations on the protein surface. We have found hot spots in the negatively charged region of the β-sheet (glu9, cys5 and cys8) as well as in rather apolar regions at amino acids leu18 and ile22. This spotting is in accordance with suggestions from the Poisson-Boltzmann method and will be supported by the residue-resolved contact matrices below.
The 3D density plots also suggest an excess of anions in the first solvation shell which seems to be contrary to the greater coordination number of cations. This can be resolved by the fact that cations form regions of lower but contiguous density and thus quite often fall below the threshold. On the contrary, anions are found preferably at high density but with distinct large gaps between hot spots.
4.2.3. Residue-resolved Contact Matrices
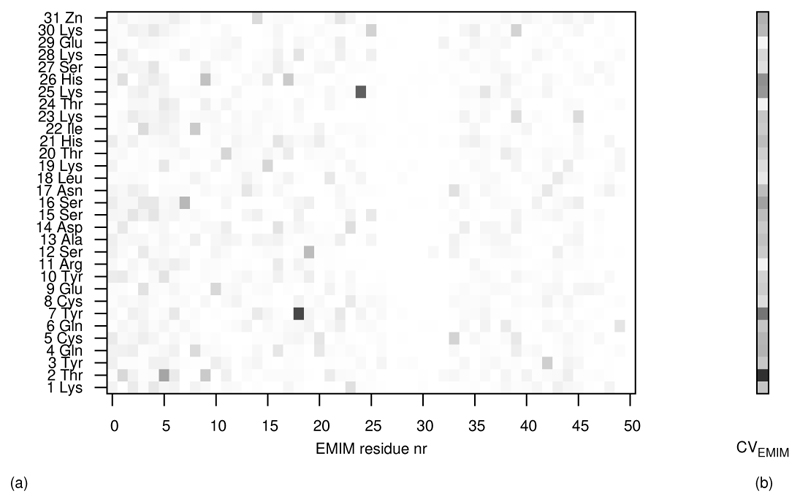
As a quanititative counterpart to the intuitive 3D histograms we have computed residue-resolved contact matrices between the protein and the solvent species cation, anion and water. Each row of a contact matrix corresponds to a specifc amino acid. Each entry in a row stands for the probability that a certain solvent molecule has a Voronoi contact with the protein. A Voronoi contact means that at least one Voronoi polyhedron of a protein atom has a common face with the Voronoi polyhedron of a solvent molecule. As a typical example a contact matrix of the protein with 50 EMIM+ molecules is shown in figure 11. The sum of each row represents the probability that the solvent species as such has contact with the respective amino acid. Such a contact vector is also shown in the figure. If there were no multiple contacts between a solvent molecule and several amino acids the sum over the contact vector would give the coordination number. This additivity could be enforced by introducing a criterion for unique assignment of every protein-solvent contact to a single amino acid. With the concept of a contact vector the inherent 3-dimensionality of neighbourhood may be transformed to a 1-dimensional measure of neighbourhood statistics. Subtracting the mean value from all entries of a contact vector one gets a quantitative function of the enhanced presence or absence of a solvent molecule in contact with an amino acid.
Figure 11.
(a) The entries of the contact matrix lie within the interval [0,1] and are mapped onto a greyscale. They are given for the amino acids of the protein and 50 EMIM+ molecules (residues). (b) The entries of each row of the contact matrix are summed, mapped onto a greyscale and given as a column, a contact vector. The intensity of each component displays the frequency of Voronoi contacts between an amino acid-residue and a solvent-species.
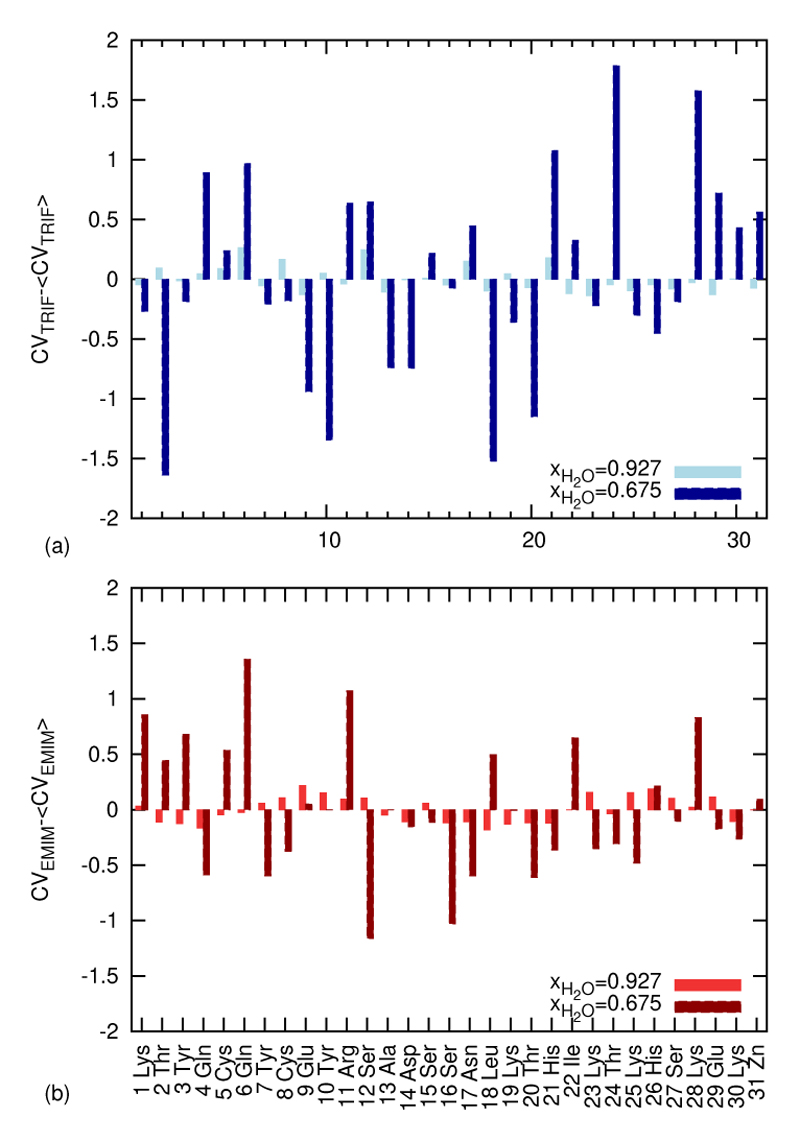
As a first application of the concept of the contact vector figure 12 compares the mean value corrected contact vectors for the highest and lowest nonzero ionic strenghts. Both, cations (figure 12 (a)) and anions (figure 12 (b)) show a quite different variation as a function of the amino acids. While at low ionic strengths the contact vector components change gradually, rather sudden changes are observed at high ionic strenghts. This correlates with the observations found in the 3-dimensional ion densities: Regions preferrably or exclusively occupied by charges of the same sign are shrinking in favour of a patchwork of small charge islands. A striking feature hardly discernible in the 3D density shows up in the contact vector component analysis: At the positively charged or polar residues 17 and 21 as well as 24 and 28 a characteristically enhanced probability of anions is found. The relative distance in sequence of 4 is typical for the amino acid contact pattern in the α-helix. The cations show an analogous pattern at the rather apolar residues 18, 22 and 26. In other words, the anionic and cationic patterns are shifted by one residue. This systematic intercalation of cations and anions maybe induced by the protein but cannot be solely due to the protein. Rather the ionic network at the surface of the protein organises in a specific way in order to optimize the available space. It should be emphasised that all these findings are observed at high ionic strength. For lower ion concentrations the enhanced screening by water molecules blurs the distinct ion pattern.
Figure 12.
The average of all components of the contact vector CVSpecies was subtracted from each component to display above and below average frequencies of Voronoi contacts, (a) for the anion and (b) for the cation EMIM+. The systems with lowest and highest ionic strength are compared. Note the peaks for the anion at residues 17 and 21 as well as 24 and 28, and for the cation at 18, 22 and 26 at high ionic strength.
The concept of contact vectors may also give some hints where the excess cations are located on the protein surface: While the anions prefer special regions as already inferred from the 3D densities and clearly visible in the relative contact vectors given in figure 12, the cations tend to a more ubiquitous distribution despite of some special spots like the amino acid triade 18, 22 and 26. Even in this case the approach of cations towards rather apolar residues is not obvious at first sight. However, space on a protein surface is limited and the high number of cations (as compared to the anions) forces them to occupy unfavourable regions. A further reason might be that the charge density of a cation is rather flat: Indeed, if summing within a cation or anion the absolute charges – neglecting the sign – one gets 2.141 for the cation and 3.74 for the anion. This shows the stronger variation of charge density within the anion and explains its tendency to approach charged and polar residues. Furthermore, the lower sum of absolute charges of the cation goes along with a volume of double size as compared to the anion.
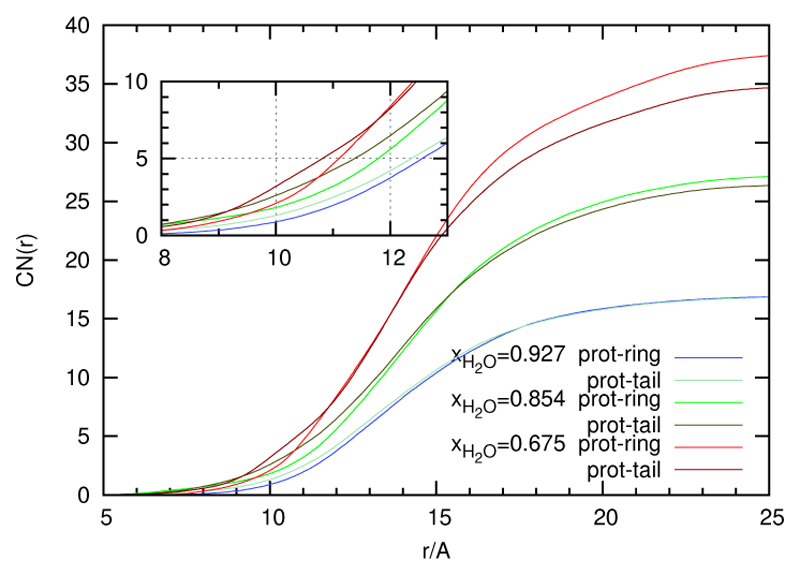
In order to analyse the approach of cations to the protein surface in more detail we have decomposed the cation into three parts: head, ring and tail and subsequently computed the residue-resolved contact vectors for all three parts. Taking the pairwise difference of contact vector components a positive overshoot of ring and tail over head is clearly visible. For the pair ring and tail the situation is not so simple: At low ionic strengths ring and tail contacts are fairly equal. With increasing ionic strength, however, ring contacts become more important. The average value of the difference contact vector starting at almost zero increases with ion concentration. For a final evidence we have computed the running coordination number from the radial distribution functions between the protein and the ring/tail. Strictly speaking, we refer to distance between respective center of mass, may be protein or head/ring. We have only considered the ring/tail centers which make a direct Voronoi contact with the protein. As can be seen from the insert in figure 10, coordination by the tail is slightly dominant at short distances to the center. However, it is finally overruled by ring coordination, as shown in the full figure. A possible explanation for this prevalence of ring coordination at higher ionic strengths and longer distances might be the specific interaction of charged ends of certain amino acids with the ring-charges. In this sense one would speak of a preferred ring-charge group interaction as opposed to the bare steric interaction of the tail.
Figure 10.
The coordination number as a function of distance to the center of mass of the protein (CNSpecies(r)). The ethyl-part and the ring-part of EMIM+ were treated as individual species and are compared here.
4.2.4. Mean Residence Times
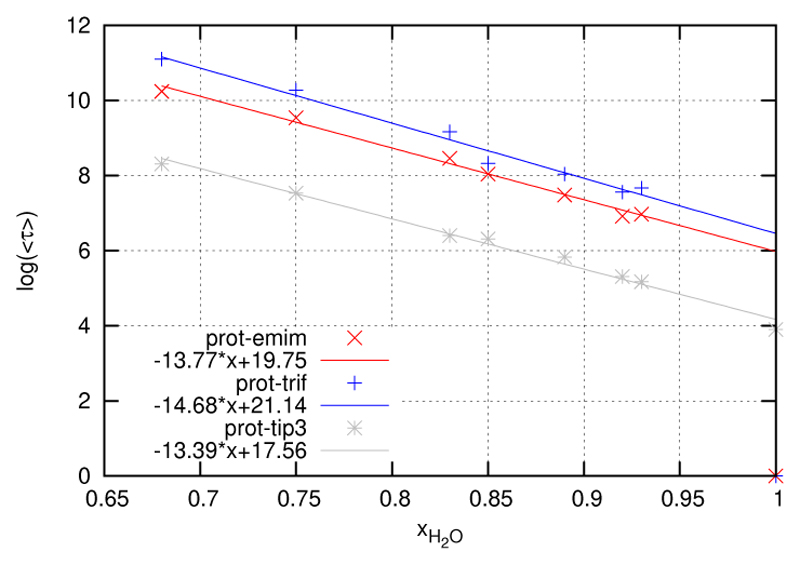
So far we have focused on the static, i.e. time averaged, view of solvation structure. However, solvation shells are dynamic. They are subject to permanent restructuring as its members enter and leave their shell at a certain rate. In order to have a measure of this rate of migration we have computed the residence functions already outlined in the theory section. A systematic discussion is facilitated considerably by fitting these residence functions to analytic expressions like the KWW functions (Equation 18). The so-obtained pair of fit parameters τ and β can be converted to a mean residence time according to relation 19. The mean residence times for the three species, water, EMIM+ and as a function of mole fraction xH2O are shown in Table 5 and Figure 13. One sees immediately that the anion MRTs are about twice as long as for cations. This goes along with the findings from the 3D densities where cations exhibit low but contiguous densities while anions populate selected sites with large gaps in between. In fact, we have plotted the logarithm of 〈τ〉 and obtained almost perfect linear relations. In other words the mean residence times increase exponentially with decreasing mole fraction. As the logarithmic plots for the three species are almost parallel the rate of increase is very similar among the species. If one wants to discuss the slight differences in the slope one finds that the retardation of the mean residence times increases in the order water to EMIM+ to This follows the same order as the absolute values and shows that the larger cation resides for a shorter time than the smaller anion. This is in agreement with the general observation of the higher mobility of the cation as compared to the anion already observed for the pure ionic liquid without any protein [19]. This significant difference in mobility also persists at the surface of the protein.
Table 5. Mean residence times of each of the three solvent-molecule species within the first Voronoi shell of the protein.
| 1.0 | 49.45 | ||
| 0.927 | 176 | 1067 | 2146 |
| 0.854 | 551 | 3090 | 4156 |
| 0.751 | 1872 | 13903 | 28909 |
| 0.675 | 4064 | 28098 | 66422 |
Figure 13. Logarithmic plot of the mean residence times given in table 5.
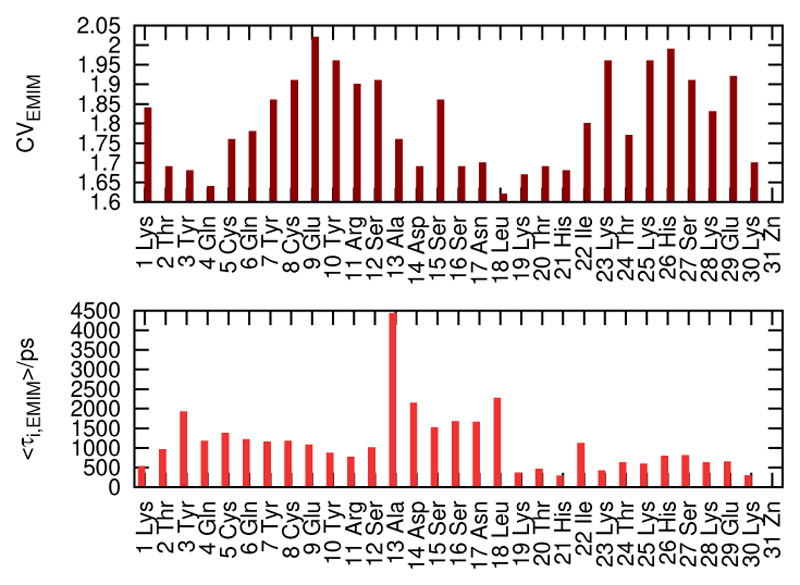
Figure 14, however, gives a more subtle explanation. Therein, the residue-resolved contact vector of the EMIM+ molecules is confronted with the residue-specific mean residence times. One sees a clear anti-correlation. The contact vector measures the average number of solvent molecules which are simultaneous first neighbours of an amino acid. There seem to be two different patterns of residence: An amino acid may bind loosely to a couple of solvent molecules which reside for a short time, or the amino acid fixes a single molecule for a long time. The cation EMIM+ seems to prefer the first pattern while the anion the second one.
Figure 14.
Contact vector (CVEMIM) and mean residence times (〈τEMIM〉) of EMIM+ within the first Voronoi shell of each amino acid for xH2O = 0.927.
In order to get an impression of the actual numbers table 5 lists MRTs in picoseconds for the three species as a function of the mole fraction. The spread is enormous. From the magic point to the highest ionic strength MRTs rise by a factor 25 to 30, i.e. from the picosecond to the nanosecond regime.
4.3. Mesoscopic View
So far we have analysed the systems at the molecular level. The Voronoi method enables a more coarse grained resolution considering a group or set of Voronoi polyhedra as one moiety. A natural choice for such mesoscopic moieties would be the protein, its solvation shells and the remaining bulk. This coarse graining of space goes along with the dipolar decomposition already outlined in the theory section. Therefore, the moieties or regions are characterized by their dipolar self terms and cross terms For xH2O = 1 five complete Voronoi shells may be constructed for the given system size. With increasing ionic strength the thickness of the Voronoi shells increases such that the number of complete shells finally reduces to three. As a common number we therefore choose three solvation shells. A more detailed analysis, however, showed that the third solvation shell already resembles the properties of the bulk for all ionic strengths. Therefore, a four component description with the protein, the first and second solvation shell and the bulk are sufficient.
In the following tables the self and cross terms are given as entries to a 4x4-matrix for each mole fraction (table 6). The prefactor 4π/(3V kBT) is already included. Therefore, one can directly read off their respective contributions to the dielectric permittivity. The behaviour of the dielectric self terms as a function of ionic strength is quite diverse. The self terms of the bulk decreases monotonically. Except for the system xH2O = 0.927 this is also true for the self terms of the first and second shell. The self term of the protein rises from the almost pure water system xH2O = 0.927 but then remains confined to an interval between 15 and 25.
Table 6.
Spatially resolved contributions to the dielectric constant: self and cross terms. Above each table the sum of the self terms εdiag and the dielectric constant ε are given for comparison.
| 5ZNF | 1st shell | 2nd shell | bulk | |
|---|---|---|---|---|
| 5ZNF | 4.4 | 0.4 | 0.2 | 1.6 |
| 1st shell | 0.4 | 2.8 | 1.1 | 1.7 |
| 2nd shell bulk | 0.2 | 1.1 | 4.6 | 4.6 |
| bulk | 1.6 | 1.7 | 4.6 | 76.8 |
| 5ZNF | 1st shell | 2nd shell | bulk | |
|---|---|---|---|---|
| 5ZNF | 25.0 | 1.4 | 0.8 | 0.1 |
| 1st shell | 1.4 | 2.5 | 0.6 | 0.1 |
| 2nd shell | 0.8 | 0.6 | 5.6 | 1.4 |
| bulk | 0.1 | 0.1 | 1.4 | 29.9 |
| 5ZNF | 1st shell | 2nd shell | bulk | |
|---|---|---|---|---|
| 5ZNF | 15.8 | -0.5 | -0.1 | 0.3 |
| 1st shell | -0.5 | 1.7 | 0.2 | -0.1 |
| 2nd shell | -0.1 | 0.2 | 4.5 | 0.5 |
| bulk | 0.3 | -0.1 | 0.5 | 18.1 |
| 5ZNF | 1st shell | 2nd shell | bulk | |
|---|---|---|---|---|
| 5ZNF | 24.0 | -0.4 | 0.2 | -0.4 |
| 1st shell | -0.4 | 1.5 | 0.1 | -0.1 |
| 2nd shell | -0.2 | 0.1 | 4.1 | -0.1 |
| bulk | -0.4 | -0.1 | -0.1 | 9.9 |
| 5ZNF | 1st shell | 2nd shell | bulk | |
|---|---|---|---|---|
| 5ZNF | 16.6 | 0.5 | -0.1 | -0.3 |
| 1st shell | 0.5 | 1.5 | -0.1 | 0.0 |
| 2nd shell | -0.1 | -0.1 | 3.5 | -0.2 |
| bulk | -0.3 | 0.0 | -0.2 | 8.3 |
This set of matrices gives a very clear answer concerning the cross terms. At the lowest ionic strengths, or equivalently, at xH2O = 0.927, even a pattern of chain coupling, i.e. 5ZNF to 1st shell, 1st shell to 2nd shell and 2nd shell to bulk, can be detected. For high ionic strengths this chain is more and more broken. In other words, once the ionic strength has exceeded the magic value xH2O = 0.927 the importance of cross terms is drastically reduced. In fact, the sum of the self terms comes very close to the sum over all terms, i.e. to the total value of the dielectric permittivity.
The case xH2O = 0.927 is once more pronounced: The contribution from the protein is at the maximum and at the same time the coupling to its environment, in particular to the first shell, is maximal, too. A similar but weaker trend is observed for the almost pure water system, in particular the protein seems to have a longer range of influence on the shells and even on the bulk. In fact, two times the cross term protein-bulk rivals already the protein self term.
Besides the marginalisation of the cross terms at higher ionic strengths the dominant contribution of the protein is the most striking feature. As the solvent’s contribution decreases drastically with ionic strength the protein’s contribution becomes more and more important. For the highest ionic strength it already makes up one half of the total dielectric permittivity. Thus, the dipole density in the solvent is reduced more and more and in the end the protein remains the only zone of high dipolar density.
From the combination of equations 4, 6 and 7 one can learn that the off-diagonal elements of the dielectric matrices presented above may be also interpreted as a measure of the dipolar coupling between moieties or regions.
For the almost pure water solvent the mutual coupling is strongest: This concerns not only the coupling among the water moieties, first shell, second shell and bulk, but also the coupling between protein and bulk. The sum of all these coulings makes up 20% of the total dielectric effect.
At the magic point the coupling between the protein and its immediate neighbourhood, i.e. first shell, is most pronounced. All other contributions are slightly reduced by the change from dipolar screening to charge screening. In particular, the protein-bulk interaction becomes very small. Nevertheless all couplings remain positive, i.e. corresponding regional dipoles are aligned parallel on average. This picture changes for higher ionic strengths where antiparallel dipolar alignment dominates.
As a consequence the sum of the diagonal elements seems to completely determine the total dielectric effect. However, this dominance of the diagonal terms comes from the fact that the already small off-diagonal elements cancel each other to a large extent when summed up.
Reduction of the mutual coupling of shell dipole moments indicates that the ordering influence of the protein on the solvent decreases. Usually, such a screening effect goes along with a high dielectric constant. Therefore, this finding seems contradictory at first sight. However, we have already learned from the discussion of the 3-dimensional ion densities and contact vectors that systems at high ionic strengths do not follow a continuum description, because cations and anions establish a highly ordered charge pattern.
In order to elucidate the vanishing dielectric influence of the solvent we have also done a solvent-species specific decomposition of the total dielectric permittivity. The results are given in table 7. Although the contribution of the protein is confined to an interval an overall dielectric decrement is observed. This is so for three reasons: First, the water components shows a decrement as a consequence of a reduced mole fraction xH2O, i.e. it is more and more substituted by cations and anions. Second, a dielectric incremenet is observed for the anion. However, the slope is modest as compared to decrement of water. Third, the contribution of the cations is so marginal that is increment is negligible.
Table 7. Contributions to the dielectric constant, resolved by species: self- and cross-terms.
| 5ZNF | H2O | EMIM+ | ||
|---|---|---|---|---|
| 5ZNF | 4.4 | 2.2 | 0.0 | 0.0 |
| H2O | 2.2 | 98.7 | 0.1 | 0.0 |
| 0.0 | 0.1 | 0.1 | 0.0 | |
| EMIM+ | 0.0 | 0.0 | 0.0 | 0 |
| 5ZNF | H2O | EMIM+ | ||
|---|---|---|---|---|
| 5ZNF | 24.1 | 1.0 | 0.0 | 0.0 |
| H2O | 1.0 | 29.2 | 1.9 | 0.1 |
| 0.0 | 1.9 | 3.8 | 0.1 | |
| EMIM+ | 0.0 | 0.1 | 0.1 | 0.5 |
| 5ZNF | H2O | EMIM+ | ||
|---|---|---|---|---|
| 5ZNF | 19.7 | 0.5 | -0.1 | -0.3 |
| H2O | 0.5 | 12.9 | 1.9 | 0.1 |
| -0.1 | 1.9 | 4.3 | 0.1 | |
| EMIM+ | -0.3 | 0.1 | 0.1 | 0.7 |
| 5ZNF | H2O | EMIM+ | ||
|---|---|---|---|---|
| 5ZNF | 24.0 | 0.2 | -0.5 | -0.3 |
| H2O | 0.2 | 7.2 | 1.0 | -0.1 |
| -0.5 | 1.0 | 4.8 | 0.2 | |
| EMIM+ | -0.3 | -0.1 | 0.2 | 1.0 |
| 5ZNF | H2O | EMIM+ | ||
|---|---|---|---|---|
| 5ZNF | 16.6 | -0.1 | 0.1 | 0.1 |
| H2O | -0.1 | 4.7 | 1.0 | 0.0 |
| 0.1 | 1.0 | 4.9 | 0.2 | |
| EMIM+ | 0.1 | 0.0 | 0.2 | 0.9 |
Quite generally, dielectric contributions are closely related to dipolar densities, i.e. to the square of the dipole moment of a voxel divided by its volume. Identifying the voxel with the Voronoi polyhedron around a single molecule gives its isolated contribution to the dielectric constant. The dipolar densities of water, and EMIM+ follow the ratio 18 : 31 : 1.8. Thereby we have already included the prefactor 4π/(3V kBT) which converts the dipolar density to a dielectric contribution (Equation 6). For the ideal case of non interacting molecules one could calculate the dielectric constant as a linear combination of the three values weighting each with its respective mole fraction. This simplified consideration shows already that the replacement of the water component by EMIM+ has a mere “thinning out”-effect and is the major reason for the strong dielectric decrement. The enrichment of cations in the first coordination shell found already in the discussion of the coordination number above enhances this effect. Replacement by produces an increment and thus counteracts this effect. However, interdipolar coupling neglected so far reduces the contribution of the isolated molecules because of their essentially antiparallel alignment. This was already found in previous studies: Collectivity reduces the contribution of the isolated by a typical factor of one half. This is quite opposite to water where collectivity enhances the single water molecule’s contribution by a factor two to three. Therefore, the cannot really compensate for the reduction of the water component. So it is finally left to the protein to maintain the dielectric constant of the complete solution.
So far we have discussed the species-specific self terms. Table 7 shows an interesting behaviour of the cross terms, too. From the above discussion it is not surprising that the cross terms with EMIM+ are marginal. The only cross terms of importance for all non-zero ionic strengths are those between water and Cross correlations between the protein and water are only observed in the water-rich systems. Therefore, the network already observed at the molecular level in systems without the solute seems to persist at the mesoscopic dielectric level, too.
5. Summary and Conclusion
In this study we have analysed the solvation of a zinc finger protein “5ZNF” in a hydrated ionic liquid composed of EMIM+, and water. The mole fraction of water xH2O, or equivalently the ionic strength I, were varied systematically from pure water to xH2O = 0.68.
This very inhomogeneous system was divided up into three principal regions: The protein itself, its immediate neighbourhood and the remaining bulk. For such intuitive decomposition, however, we need a rational concept. While the protein may be easily defined as the union of amino acids, the characterisation of the immediate neighbourhood is usually done by distance based methods. For a homogeneous solvent this would already require the introduction of parameters like shell thickness, etc. Therefore, the heterogeneous solvent used here would require an extended set of parameters. It is a definite goal of this study to describe solvation shells introducing no parameters at all. Therefore we have used the computationally more demanding Voronoi method in order to spatially decompose the complete system into atomic polyhedra. In this way neighbourhood may be easily defined way common or shared polyhedral faces and the union of atomic polyhedra gives moieties, solvation shells, etc.
Volume and surface were the first simple properties of the protein itself which were investigated. Later on the structural behavior of the backbone was analysed using DSSP, STRIDE, and contact matrices. The behaviour of the side chains was characterised by their dipole moments, i.e. by their contribution to the protein’s net dipole moment. All these properties exhibit a maximum or minimum at the magic point xH2O = 0.927. This corresponds to the transition from a pure dipolar screening by water molecules to a beginning charge screening by ions. The total energy of the protein as the common root for all these structural properties exhibits a maximum at the magic point. This brought about by the monotonic increase of the van der Waals energy and the monotonic decrease of the electrostatic energy as a function of the mole fraction.
The immediate neighbourhood of the protein was first characterised by 3D density plots which were compared to the electrostatic potential computed as a solution of the Poisson-Boltzmann equation. For low ionic strength larger regions of the electrostatic potential of uniform sign are found. The distribution of ions follows this uniform sign of the potential. For higher ionic strengths however, a checkerboard pattern with changing sign of the ions emerges. This cannot be described by the Poisson-Boltzmann equation anymore. Obviously, the higher number of ions has to arrange in such a way to minimize the mutual repulsion of like charges.
This intuitive picture of the first solvation shell can be rationalised by a series of properties: Already the simplest of them, the coordination number, shows that cations are enriched at the protein surface although the protein itself is positively charged. This is an indirect effect of the water-anion network which expells cations. A residue specific resolution of solute-solvent contacts can be achieved by Voronoi based contact matrices which in their turn may be contracted to contatct vectors. In this way, 3D densities can be converted to a quantitative one-dimensional information. Thereby, amino acid residues are only ordered according to the sequence. Specific neighbourhood relations are not considered. Nevertheless, specfic statements can be made. A typical example is the change of the charge pattern as a function of the ionic strength which shows up as slower or faster oscillations in the components of the contact vector.
As a measure for solvent shell dynamics we have computed mean residence times. Defining shell specific mean residence times characteristic for the complete set of molecules of a respective species we find a linear relationship between the logarithm of these mean residence times, or life times, as a function of the mole fraction. In other words, the species-sepcific MRTs are an exponential function of the mole fraction. This exponential rise makes clear why simulations at hight ionic strengths are computationally very demanding. MRTs up 66 nanoseconds were found.
In order to characterise the system as a whole we have also introduced a mesoscopic view. Thereby each region or moiety is characterised by its contribution to the total dielectric constant of the system. Such a decomposition involves both self terms and cross terms. The latter are a measure for the mutual coupling of regions. At the magic point xH2O = 0.927, the self terms are high, but the cross terms are remarkable, too. In particular, the protein is strongly coupled to its environment, especially to the first solvation shell. One might think that cross terms increase together with the ionic strength. Quite the opposite is true, however: With increasing ionic strength the total dielectric constant is more and more determined by the sum of self terms and the cross terms loose their importance. EMIM+ more or less acts as a dilution because of its marginal dipole density. The higher dipole density of – as compared to water – is of modest influence because of the marginal cooperativity between the ions in terms of dipolar coupling. The water component with its pronounced dipolar cooperativity is quenched simply by its decreasing mole fraction.
Figure 5.
The total non-bonded interaction energies (Eelec and EvdW) between the atoms of 5ZNF are given for the simulated systems, (a),(b) separately and (c) as a sum. The respective values for the additionally simulated systems are given in grey.
Acknowledgements
This work was performed on the “Vienna Scientific Cluster” [www.zid.tuwien.ac.at/vsc] of the University of Vienna, the Vienna University of Technology, and the University of Natural Resources and Applied Life Science Vienna. We thank for generous allocation of computer time. This work was supported by Project No. P19807 of the FWF Austrian Science Fund.
References
- [1].Arzhantsev S, Jin H, Baker GA, Maroncelli M. Measurements of the complete solvation response in ionic liquids. J Phys Chem B. 2007 May;111(18):4978–4989. doi: 10.1021/jp067273m. [DOI] [PubMed] [Google Scholar]
- [2].Boresch S, Ringhofer S, Höchtl P, Steinhauser O. Towards a better description and understanding of biomolecular solvation. Biophys Chem. 1999 Apr;78(1–2):43–68. doi: 10.1016/s0301-4622(98)00235-x. [DOI] [PubMed] [Google Scholar]
- [3].Brooks BR, Brooks CL, Mackerell AD, Nilsson L, Petrella RJ, Roux B, Won Y, Archontis G, Bartels C, Boresch S, Caflisch A, et al. Charmm: the biomolecular simulation program. J Comput Chem. 2009 Jul;30(10):1545–1614. doi: 10.1002/jcc.21287. [DOI] [PMC free article] [PubMed] [Google Scholar]
- [4].Constatinescu D, Herrmann C, Weingrtner H. Patterns of protein unfolding and protein aggregation in ionic liquids. Phys Chem Chem Phys. 2010 Feb;12(8):1756–1763. doi: 10.1039/b921037g. [DOI] [PubMed] [Google Scholar]
- [5].Fehér E, Major B, Bélafi-Bakó K, Gubicza L. On the background of enhanced stability and reusability of enzymes in ionic liquids. Biochem Soc Trans. 2007 Dec;35(Pt 6):1624–1627. doi: 10.1042/BST0351624. [DOI] [PubMed] [Google Scholar]
- [6].Feig M. Modeling Solvent Environments: Applications to Simulations of Biomolecules. Wiley-VCH; 2010. [Google Scholar]
- [7].Frishman D, Argos P. Knowledge-based protein secondary structure assignment. Proteins. 1995 Dec;23(4):566–579. doi: 10.1002/prot.340230412. [DOI] [PubMed] [Google Scholar]
- [8].Fujita K, MacFarlane DR, Forsyth M, Yoshizawa-Fujita M, Murata K, Nakamura N, Ohno H. Solubility and stability of cytochrome c in hydrated ionic liquids: effect of oxo acid residues and kosmotropicity. Biomacromolecules. 2007 Jul;8(7):2080–2086. doi: 10.1021/bm070041o. [DOI] [PubMed] [Google Scholar]
- [9].Fujita K, Nakamura N, Igarashi K, Samejima M, Ohno H. Bio-catalytic oxidation of cellobiose in an hydrated ionic liquid. Green Chem. 2009;11(3):351–354. [Google Scholar]
- [10].Gorke J, Srienc F, Kazlauskas R. Toward advanced ionic liquids. polar enzyme-friendly solvents for biocatalysis. Biotechnology and Bioprocess Engineering. 2010;15(1):40–53. doi: 10.1007/s12257-009-3079-z. [DOI] [PMC free article] [PubMed] [Google Scholar]
- [11].Hardacre C, Holbrey JD, Nieuwenhuyzen M, Youngs TGA. Structure and solvation in ionic liquids. Acc Chem Res. 2007 Nov;40(11):1146–1155. doi: 10.1021/ar700068x. [DOI] [PubMed] [Google Scholar]
- [12].Jorgensen WL. J Am Chem Soc. 1981;103:335–340. [Google Scholar]
- [13].Kabsch W, Sander C. Dictionary of protein secondary structure: pattern recognition of hydrogen-bonded and geometrical features. Biopolymers. 1983 Dec;22(12):2577–2637. doi: 10.1002/bip.360221211. [DOI] [PubMed] [Google Scholar]
- [14].Klapper I, Hagstrom R, Fine R, Sharp K, Honig B. Focusing of electric fields in the active site of cu-zn superoxide dismutase: effects of ionic strength and amino-acid modification. Proteins. 1986 Sep;1(1):47–59. doi: 10.1002/prot.340010109. [DOI] [PubMed] [Google Scholar]
- [15].Kobrak MN. A comparative study of solvation dynamics in room-temperature ionic liquids. J Chem Phys. 2007 Nov;127(18):184507. doi: 10.1063/1.2790425. [DOI] [PubMed] [Google Scholar]
- [16].Kragl U, Eckstein M, Kaftzik N. Enzyme catalysis in ionic liquids. Current Opinion in Biotechnology. 2002 December;13(6):565–571. doi: 10.1016/s0958-1669(02)00353-1. [DOI] [PubMed] [Google Scholar]
- [17].Lichtenecker Roman J, Schmid Walther. Application of various ionic liquids as cosolvents for chloroperoxidase-catalysed biotransformations. Monatshefte für Chemie. 2009;(5):509–512. [Google Scholar]
- [18].Löffler G, Schreiber H, Steinhauser O. Calculation of the dielectric properties of a protein and its solvent: theory and a case study. J Mol Biol. 1997 Jul;270(3):520–534. doi: 10.1006/jmbi.1997.1130. [DOI] [PubMed] [Google Scholar]
- [19].Maginn EJ. Molecular simulation of ionic liquids: current status and future opportunities. Journal of Physics: Condensed Matter. 2009;21(37):373101. doi: 10.1088/0953-8984/21/37/373101. [DOI] [PubMed] [Google Scholar]
- [20].Micaêlo NM, Baptista AM, Soares CM. J Phys Chem B. 2006;110:14444–144511. doi: 10.1021/jp061869s. [DOI] [PubMed] [Google Scholar]
- [21].Moniruzzaman M, Nakashima K, Kamiya N, Goto M. Recent advances of enzymatic reactions in ionic liquids. Biochemical Engineering Journal. 2010 February;48(3):295–314. [Google Scholar]
- [22].Neumayr G, Schröder C, Steinhauser O. Relaxation of voronoi shells in hydrated molecular ionic liquids. J Chem Phys. 2009 Nov;131(17):174509. doi: 10.1063/1.3256003. [DOI] [PubMed] [Google Scholar]
- [23].Olivier-Bourbigou H, Magna L, Morvan D. Ionic liquids and catalysis: Recent progress from knowledge to applications. Applied Catalysis A: General. 2010 January;373(1–2):1–56. [Google Scholar]
- [24].Page TA, Kraut ND, Page PM, Baker GA, Bright FV. Dynamics of loop 1 of domain i in human serum albumin when dissolved in ionic liquids. J Phys Chem B. 2009 Sep;113(38):12825–12830. doi: 10.1021/jp904475v. [DOI] [PubMed] [Google Scholar]
- [25].Park S, Kazlauskas RJ. Biocatalysis in ionic liquids - advantages beyond green technology. Curr Opin Biotechnol. 2003 Aug;14(4):432. doi: 10.1016/s0958-1669(03)00100-9. [DOI] [PubMed] [Google Scholar]
- [26].Roosen C, Mller P, Greiner L. Ionic liquids in biotechnology: applications and perspectives for biotransformations. Appl Microbiol Biotechnol. 2008 Dec;81(4):607–614. doi: 10.1007/s00253-008-1730-9. [DOI] [PMC free article] [PubMed] [Google Scholar]
- [27].Rudas T, Schröder C, Boresch S, Steinhauser O. Simulation studies of the protein-water interface. ii. properties at the mesoscopic resolution. J Chem Phys. 2006 Jun;124(23):234908. doi: 10.1063/1.2198804. [DOI] [PubMed] [Google Scholar]
- [28].Ryckaert J-P, Ciccotti G, Berendsen HJC. Numerical integration of the cartesian equations of motion of a system with constraints: molecular dynamics of n-alkanes. J Comput Phys. 1977;23:327–341. [Google Scholar]
- [29].Samanta A. Solvation dynamics in ionic liquids: What we have learned from the dynamic fluorescence stokes shift studies. The Journal of Physical Chemistry Letters. 2010;1(10):1557–1562. [Google Scholar]
- [30].Schröder C, Haberler M, Steinhauser O. On the computation and contribution of conductivity in molecular ionic liquids. J Chem Phys. 2008 Apr;128(13):134501. doi: 10.1063/1.2868752. [DOI] [PubMed] [Google Scholar]
- [31].Schröder C, Hunger J, Stoppa A, Buchner R, Steinhauser O. On the collective network of ionic liquid/water mixtures. ii. decomposition and interpretation of dielectric spectra. J Chem Phys. 2008 Nov;129(18):184501. doi: 10.1063/1.3002563. [DOI] [PMC free article] [PubMed] [Google Scholar]
- [32].Schröder C, Neumayr G, Steinhauser O. On the collective network of ionic liquid/water mixtures. iii. structural analysis of ionic liquids on the basis of voronoi decomposition. J Chem Phys. 2009 May;130(19):194503. doi: 10.1063/1.3127782. [DOI] [PMC free article] [PubMed] [Google Scholar]
- [33].Schröder C, Rudas T, Boresch S, Steinhauser O. Simulation studies of the protein-water interface. i. properties at the molecular resolution. J Chem Phys. 2006 Jun;124(23):234907. doi: 10.1063/1.2198802. [DOI] [PubMed] [Google Scholar]
- [34].Schröder C, Rudas T, Steinhauser O. Simulation studies of ionic liquids: orientational correlations and static dielectric properties. J Chem Phys. 2006 Dec;125(24):244506. doi: 10.1063/1.2404674. [DOI] [PubMed] [Google Scholar]
- [35].Schröder C, Steinhauser O. On the dielectric conductivity of molecular ionic liquids. J Chem Phys. 2009 Sep;131(11):114504. doi: 10.1063/1.3220069. [DOI] [PubMed] [Google Scholar]
- [36].Schröder C, Steinhauser Othmar. Using fit functions in computational dielectric spectroscopy. J Chem Phys. 2010 Jun;132(24):244109. doi: 10.1063/1.3432620. [DOI] [PMC free article] [PubMed] [Google Scholar]
- [37].Schröder C, Wakai C, Weingärtner H, Steinhauser O. Collective rotational dynamics in ionic liquids: a computational and experimental study of 1-butyl-3-methyl-imidazolium tetrafluoroborate. J Chem Phys. 2007 Feb;126(8):084511. doi: 10.1063/1.2464057. [DOI] [PubMed] [Google Scholar]
- [38].van Rantwijk F, Sheldon RA. Biocatalysis in ionic liquids. Chem Rev. 2007 Jun;107(6):2757–2785. doi: 10.1021/cr050946x. [DOI] [PubMed] [Google Scholar]
- [39].Yang Z, Yue Y, Huang W, Zhuang X, Chen Z, Xing M. Importance of the ionic nature of ionic liquids in affecting enzyme performance. J Biochem. 2009 Mar;145(3):355–364. doi: 10.1093/jb/mvn173. [DOI] [PubMed] [Google Scholar]
- [40].Youngs TGA, Holbrey JD, Deetlefs M, Nieuwenhuyzen M, Gomes MFC, Hardacre C. A molecular dynamics study of glucose solvation in the ionic liquid 1,3-dimethylimidazolium chloride. Chemphyschem. 2006 Nov;7(11):2279–2281. doi: 10.1002/cphc.200600569. [DOI] [PubMed] [Google Scholar]
- [41].Zhao H. Effect of ions and other compatible solutes on enzyme activity, and its implication for biocatalysis using ionic liquids. Journal of Molecular Catalysis B: Enzymatic. 2005 December;37(1–6):16–25. [Google Scholar]


