Abstract
In this computational study, the collective translational motions of 1-ethyl-3-methylimidazolium triflate, characterized by its current correlation function and its collective dipolar displacement, are interpreted in terms of an ion cage around a central ion. Thereby, a coincidence of the relevant time constants is observed. Furthermore, the ion cage is long living and its composition is rather heterogeneous. Besides high numbers of counter ions, several ions of like charge populate the first shell around a central ion. In contrast to the strong influence of the local environment on the collective translational motion, rotations are strictly collective. In other words, a local picture falls short of describing the overall antiparallel alignment of ionic dipoles.
A further issue of this work is the interpretation of the initial region of the collective dipolar displacement. It can be related to all collective translational processes showing up in the computational dielectric spectrum. In particular, slow translational processes which are invisible in the current correlation function can be detected. The inclusion of these slow processes allow for an excellent computational reconstruction of the experimental spectrum of the generalized dielectric constant.
I. Introduction
Molecular ionic liquids are a fascinating class of soft matter
These organic salts typically consist of imidazolium based cations with weakly basic anions and combine the characteristics from charged and dipolar species on the very same molecule.1–3 Because of their hybrid nature, a single molecular ion can contribute to the translation of charges as well as to the rotation of dipoles thus combining the properties of ionic melts and neutral molecular liquids. Focusing on their ionic character one would expect a translational ordering resembling that of a crystalline structure. Indeed, one observes a typical charge ordering4–7, i.e. a sequence of charge layers of alternating sign8–12. But ionic liquids are more than a mere liquid salt. Their observed translational and rotational dynamics, however, contrasts with the picture of a quasi-crystalline system since a pronounced molecular mobility is found13,14. Consequently, there must exist forces which counteract these strong electrostatic forces causing charge ordering. Obviously, the steric and electronic anisotropy of cations (and to a minor degree of anions) as well as their difference in size and shape are an important sources of counteraction.15
The hybrid character of the molecular ions can also be visualized on a mesoscopic level in computational dielectric spectroscopy.1 The transport of charges is characterized by the dielectric conductivity ϑ(ω) whereas the rotational and intramolecular motions contributes to the dielectric permittivity ϵ(ω). While experiments can only provide the sum of these two components, the so-called generalized dielectric constant Σ*(ω), computational studies can evaluate ϑ(ω) and ϵ(ω) separately.16–21 The decomposition of the generalized dielectric constant into dielectric conductivity and permittivity corresponds to a split up of the total collective dipole moment into its translational and ro-vibronic collective dipole moments. Although these collective dipole moments are uniquely defined,22 some problems due to periodic boundary conditions occur when computing the collective translational dipole: Molecules which leave the simulation box during the simulation period are reinserted at the opposite side in order to keep the number of molecules in the simulation box constant. This poses no problems for the non-translational collective dipole moment but causes huge jumps in the translational dipole moment. One remedy to cope with this discontinuity is the a posteriori unfolding of the simulation data yielding a so-called “itinerant dipole moment”.23,24 Alternatively, one may derive the dielectric conductivity from the collective current which is continuous because ionic velocities are conserved when crossing the box surface. The benefits or drawbacks of both methods will be a central issue of the present study.
A second issue is the high collectivity of ionic motion, i.e. translational motion of ions in an ionic liquid cannot be understood as the migration of an ensemble of single independent ions. If this would be so, the diffusion coefficients of the larger imidazolium cations should be much lower than those of the smaller anions, e.g. triflate, which is not the case.25–27 Therefore, the translational motion of ions must be coupled in some sense to their environment. Another evidence of this coupling is visible in the Δ-parameter of the Nernst-Einstein equation of the static conductivity:
| (1) |
The coupling parameter Δ does not describe the ratio of ion pairs to single ions, but the reduction of the conductivity due to the collective interactions of all cations and anions with all other cations and anions. Of course, long-lived individual ion pairs — should they be present in the sample – will contribute to Δ. The values of Δ have a large range from roughly 0.1 to 0.9 in molecular ionic liquids.1 This shows on the one hand the uniqueness of each cation-anion combination. On the other hand, the interactions of some compositions of molecular ionic liquids seem to have a very strong collective character.
In diluted ionic solutions the central ion will be surrounded by a “cloud” of ions of the opposite charge. Two effects will reduce the conductivity of the sample: First, the “relaxation effect” or “asymmetry effect” is the rebuilding of the ion clouds when cations and anions are accelerated in opposite directions by the electric field.28 As a result, the center-of-mass of the ion cloud lags behind the center-of-mass of the central ion. Second, the “electrophoretic effect” is caused by the additional friction due to the opposite direction of the velocities of the central ion and its ion cloud. A simple description of this situation is the well-known Debye-Hückel theory with a spherical ion cloud and an uniform dielectric constant.28–30 However, in a pure molecular ionic liquid the situation is more complex. The solution is not dilute. Consequently, the local environment cannot be represented by a continuum with an uniform dielectric constant. 31 Since the cations are anisotropic (thus having a non-spherical first shell) the ion cage must be anisotropic, too. Therefore, traditional shell models with their inherent sphericity based on radial distribution function cannot be applied. Distance based-shells, however, are plagued by the introduction of a large set of parameters which have to be calibrated for the specific situation. Therefore, we will apply a general parameter-free concept of ion cage which is based on the Voronoi tessellation of space.32–35
Of course, the central ion reacts to distortions or relaxations of the cage. In traditional force field models this “reaction” was restricted to translation and ro-vibronic motion. However, the central ion can also respond to the local environment by a reorganization of its charge distribution. At the electronic level this would be a rather complicated procedure36–40 but it can be mimicked by the inclusion of polarization forces.41,42 Furthermore, it turned out that many body polarization forces accelerate the ion dynamics and thus bring computational dynamics closer to the experimental one. 25,26,43–45
II. Methods
A detailed description of the simulation is given in Ref. 26 and 46. Therefore, we give only a brief summary here: We simulated 1000 polarizable 1-ethyl-3-methyl-imidazolium triflate (EMIM+CF3) in a cubic box with a box length of 67.195Å under periodic boundary conditions for a simulation period of 35 ns with a time step of 0.5 fs. The classical force field parameters stemmed from Ref. 47–49. The permanent partial charges qiβ of EMIM+ were changed to the values reported in Ref. 50 in order to better reproduce the experimental viscosity.17,20,21 The polarization of the atoms was modeled by the so-called “Drude oscillators”: Here, mobile Drude particles were bound by a harmonic spring with a force constant to their reference atoms
| (2) |
and carried in our case a charge qδ of -1.0 e. They had an uniform mass of mδ = 0.1 amu which was subtracted of the mass of the corresponding atom.51,52 The atomic polarizabilities αiβ of the non-hydrogen atoms were taken from Ref. 53 and hydrogens were left unpolarizable. It was shown in Ref. 46 that these polarizabilities resulted in a reasonable high frequency limit ϵ∞=1.94 which is in close proximity to the experimental value of 2.3. The induced dipole moment of the atom iβ equals the distance vector diβ between the mobile Drude particle and its reference atom times the Drude charge qδ.
The interactions between permanent charges qiβ and Drude pairs were excluded betweenatoms which shared a bond or an angle.54 The interaction between the corresponding Drude pairs were screened by an exponential Thole function with a radius of 1.3 Å according to Ref. 54. The Drude particles were thermostatted at 1 K with a relaxation time constant of 5 fs.55 All non-Drude particles were thermostatted at 300 K by a Nose-Hoover thermostat with a relaxation time constant of 100 fs. In Ref. 26 we have shown that these Drude parameters ensure the proximity of the Lagrangian method to self-consistency.
Nonbonded and image lists were updated heuristically using a 16 Å neighbour list distance. Lennard-Jones energies and forces were smoothly switched off between 11 and 12 Å. The electrostatic forces of both, Drude particles and the attached atoms, are treated by the PME technique.56,57 The “cutoff” for the real-space part interactions was 12 Å and the damping constant for the reciprocal-space interactions is 0.410 Å–1. The grid spacing equals 1.05 Å and a sixth-order spline interpolation of the charge to the grid was used.
III. Theory
Exposing an overall neutral sample to a spatially homogeneous, external electric field of harmonic frequency ω induces a dielectric polarization P(ω). In case of a small-amplitude electric fields the dielectric polarization P(ω)
| (3) |
scales with the internal Maxwell electric field E(ω) which counteracts the external field. The susceptibility Σ*(ω) is called “generalized dielectric constant” (GDC) and can be computed from equilibrium simulations of polarizable systems by
| (4) |
The macroscopic polarizability tensor represents the electronic degrees of freedom causing a high-frequency limit of .26,58 The frequency-dependent part of the GDC is made up by the Fourier-Laplace transform of the negative time derivative of the auto-correlation function of the total collective dipole moment Mtot(t). It is defined by
| (5) |
| (6) |
The summation runs over all atoms β of all molecules i. The sum of all induced atomic dipoles result in a collective induced dipole moment which shows similar time behavior as the collective ro-vibrational dipole moment .26 The computation of both properties from trajectory data of an molecular dynamics simulation is straight forward. Since their auto-correlation functions behave similar in time, one may unite both collective dipole moments and to the non-translational collective dipole moment MD(t).
A. Collective translation in a toroidal system
Unfortunately, the collective translational dipole moment MJ(t) causes problems and prohibits a direct computation of the total collective dipole moment Mtot(t) and its auto-correlation function. Since molecular dynamics simulations are subject to periodic boundary conditions, MJ(t) suffers from toroidal jumps of charged molecules i from one side of the box to the other. Neutral molecules do not cause problems since they are not contributing to MJ(t). Since we are practically interested in large ensembles of cations and anions, the simulation box size L is very large, so the jump qi. L experienced by MJ(t) due to the toroidal shift is large as well. In principle, there are two possibilities to circumvent this problem:
First, The jump of a charged molecule i changes its coordinates and thus the center-of-mass ri but its center-of-mass velocity vi remains unchanged. Hence, the collective current is not plagued with toroidal jumps. As a result, the Fourier-Laplace transform in Eq. (4) may be reformulated in terms of J(t) and MD(t)
| (7) |
using .1,21 The last equation also elucidates the traditional interpretation of the GDC, i.e. its splitting into a dielectric permittivity
| (8) |
and dielectric conductivity
| (9) |
The cross term contributes marginally and can thus be neglected for practical purposes.16 Therefore, the conductivity σ(ω) is given by
| (10) |
The current correlation function can be represented by a sum of damped oscillator functions
| (11) |
which can be easily Fourier-Laplace transformed.21 However, fJJ(t) may also be used to calculate the static conductivity . The running integral σj(t) is given by
| (12) |
Because of the exponential character of the fit function only the lower limit of this integral contributes to the static conductivity. Furthermore, σj(t) obtained from the numerical integration of can be used to detect translational relaxation processes with time constants Tk of a few picoseconds which are not directly visible in .20 Relaxation processes at longer times cannot be extracted from σj(t) due to its noisy character in these time regimes. Therefore, one has to look for alternative ways to detect these processes.
The second possibility to avoid the jumps affecting MJ(t) is the unfolding of the trajectory post simulation. In other words, during the simulation the molecules which pass a boundary of the simulation box are reinserted at the opposite side of the box due to the periodic boundary condition. For the analysis, however, these reinsertions are undone, i.e. the molecules translate outside the original box. As a result, this unfolded MJ(t) has no jumps and is called “itinerant dipole moment” in literature.23,24 However, it increases with time as the charged molecules depart more and more from the original box. This implies that the auto-correlation function of the unfolded MJ(t) depends on the length of the simulation trajectory. In other words, the complete is shifted upwards with increasing length of the trajectory.1
This drift in absolute values can be removed by considering the relative quantity ΔMJ(t) = MJ(t) –MJ(0). As shown in Ref. 16 its mean-squared displacement is related to the current by
| (13) |
| (14) |
In the asymptotic limit the second term approaches the constant while the first term becomes a linear function
| (15) |
after the correlation length tc is reached. In other words, tc is that time beyond which the integral in Eq. (12) reaches a plateau value, the static conductivity σ(0). On the one hand the last equation is frequently used to compute σ(0).16–18,20,59–61 This “Einstein-Helfand” relation is to be preferred to “Green-Kubo” equation (12).62,63 On the other hand, it demonstrates that the relative ΔMJ(t) leads to a constant, bound value of although it is computed from the unfolded MJ(t) which increases with time.
So far, our focus was on the asymptotic behavior of which is essentially a linear function for t≫tc. For shorter times the behavior is much more complex. One way of characterization is the study of their derivatives: The first derivative of with respect to time is given by
| (16) |
showing the equivalence with the running integral of the conductivity in Eq. (12). Therefore, all translational processes which can be detected by σJ(t) can also be found in . Additional processes in the transition region (t ≃ tc) can be extracted from . In order to convert all these processes to components of a dielectric spectrum the second derivative
| (17) |
serves as a link. The last equation can also be easily deduced from the second derivative of Eq. (13). The fit of can thus be converted to contributions of the currentcorrelation function. From the considerations above an appropriate fit function may look like
| (18) |
The slope of the last term divided by 6VkBT yields the static conductivity and the negative sum of gives . The corresponding amplitudes Ak for are . As a result, slow relaxing, translational processes have very small amplitudes Ak and are consequently invisible in a plot of but not in a plot of . Having collected the complete set of translational parameters (including the slow processes), the ϑ(ω)-spectrum is finally computed by Eq. (9). At zero frequency a static external field induces a current in a sample composed of charged species. In order to eliminate this effect, experimental and computational dielectric spectra are corrected for this conductance.
| (19) |
At the level of our fit function of this corresponds to a neglect of the last term.
B. Cage resolved collective translational motion
Translational motion of ions is strongly coupled to their environment. The strongest coupling of an ion will be to its next neighbors, i.e. its cage. Although the intuitive picture of an ion cage is very attractive for interpretation, cage dynamics is not easy to rationalize. One way is the concept of a residence function of molecules i around a central ion j:
| (20) |
Since re-occurence of molecule i at a later time is not recognized as the entrance of a new particle, the molecular identity i is conserved. The average measure of residence is given by the correlation function . The summation may be restricted to a subset of molecules, e.g. all anions. In order to extract the characteristic residence times from one can use a multi-exponential fit
| (21) |
for its representation. The mean residence times is then given by represents the “steady state” value of and should not be mixed up with the coordination number which is defined by the initial value of the correlation function, :
| (22) |
Here, j and i denote the reference species and species the surrounding molecules, respectively.
The concepts presented so far all depend on the definition of the first shell. Traditionally, shells are constructed as concentric spheres around a reference particle. The coordination number is then computed as the integral over the radial distribution function up to its first minimum. This poses two classical problems: First, the integration limit differs for each ij-combination. Second, and even more critical is the anisotropy of the central molecule. In order to account for this anisotropy one could introduce a shell thickness, i.e. a typical distance of atoms of the counter ions to selected atoms at the surface of the solute. This would introduce a lot of parameters and arbitrary selections. A parameter-free approach to determine direct neighbors is the Voronoi tessellation used in this work.32–35 It creates space-filling disjunct polyhedra, each containing all space closer to its associated atom than to any other atom. For the interpretation, the atomic polyhedra were merged to molecular polyhedra. If two molecular polyhedra share a face, the corresponding molecules are direct neighbors.
IV. Results And Discussion
Collective translational behavior of an ionic liquid is characterized by its current J(t) which is the time derivative of the collective translational dipole moment MJ(t). The current auto-correlation function of an ionic liquid shows a strong oscillatory behavior which seems to be totally damped within the first few picoseconds.5,16,20,63,64
A. Current correlation function
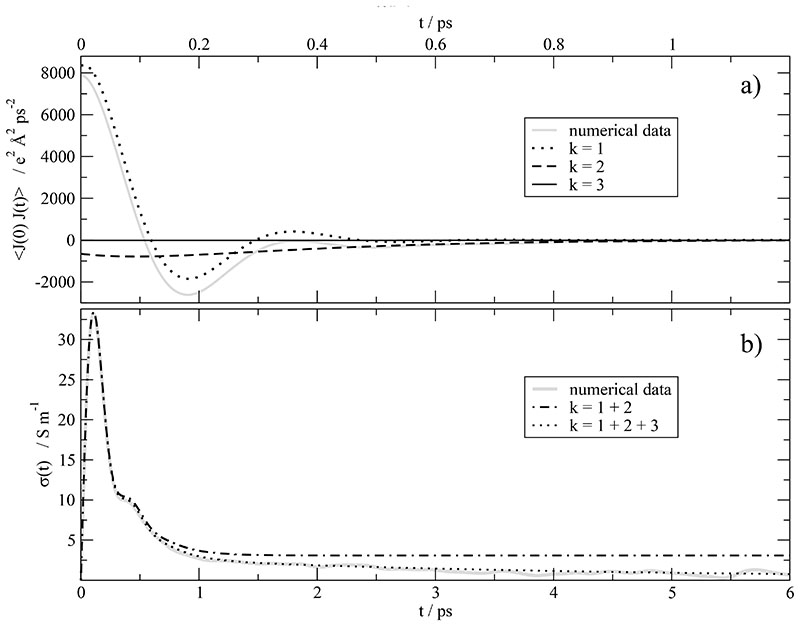
In case of EMIM+CF3 the current correlation function is given in Fig. 1a (gray solid line). It can be represented by fJJ(t) with three components k = 1, 2, 3 and the parameters given in Table I: The first component (k = 1) describes the oscillatory behavior of the current correlation function at very short times which may be associated with the cage vibrations of the molecular ions. The frequency of this vibration ω1 =17.732 ps−1 corresponds to =94 cm−1 which agrees nicely with experimental FIR spectra of imidazolium based ionic liquids showing peaks at frequencies between 62101 cm−1.65,66 This vibration has an oscillations period T1 = 1/ω1 =0.056 ps and reaches its relaxation time τ1 =0.123 ps within two oscillation periods. The high frequency ω1 show the local character of this oscillations, while the strong damping can only be explained as a collective effect, i.e. a strong cage of several neighbors. Anyway, this effect cannot be attributed to an intermolecular vibration with a single counter ion since these kind of vibrations should be much less damped.66 The oscillation period of the second component k = 2 (black dashed line in Fig. 1a) is approximately 20 ps as compared with the relaxation time τ2 of roughly 0.2 ps. This ratio of two orders of magnitude prohibits the formation of a full oscillation. As a result, the second component appears more as a function with a shallow minimum than an oscillatory motion. As we will see later on, this component may be associated with ultra-fast motions of the cage. At first sight, the two components discussed so far seem to reproduce the current correlation function in Fig. 1a. First doubts arise when computing the static conductivity σ(0) on the basis of these two components:20 Fig. 1b compares the running integral of the conductivity σJ(t) derived from the two component fit (black dash-dotted line) and obtained by numerical integration.20,62,67 In fact, the asymptotic value σ(0) = 3.6 S/m of the two fit components is by an order of magnitude larger than the numerical value of 0.75 S/m. The gap between the black dash-dotted line and the numerical gray line can be closed by a third k = 3-component with zero frequency and zero phase shift (c.f. Table I). Taking into account all three k-components one obtains the black dotted line in Fig. 1b. However, the third k-component (black solid line) is almost invisible in the current correlation function in Fig. 1a. This is a first indication of the problems discussed already in the Theory section when working solely with the current correlation function.
Fig. 1.
a) Auto-correlation function of the current J(t) and its decomposition into its components k = 1 … 3. (b) The importance of the k = 3-contribution becomes visible in σJ(t) which is the running integral of .
Table I.
The top table shows fit parameter of according fjj(t). The bottom table shows the corresponding fit values of according to fΔMJ2(t). The values of Ak in brackets in the bottom table are derived via
| k | τk [ps] | ωk [THz] | δk | ϑ0(0) | |
| 1 | 9052 | 0.123 | 17.732 | -0.513 | 0.04 |
| 2 | 254800 | 0.167 | 0.04418 | 1.571 | 0.81 |
| 3 | -11.84 | 3.52 | 0.00000 | 0.000 | 1.13 |
| k | τk [ps] | ϑ0(0) | |||
| 1+2 | (-3306) | -291.589 | 0.210 | 0.16 | 1.12 |
| 3 | (-12.77) | -314.655 | 3.51 | 1.22 | |
| 4 | (-0.141) | -1042.45 | 60.8 | 4.01 | |
It is interesting to compare the contributions of the fit components σk(0) to the static conductivity which are given by
| (23) |
For k = 1, 2, 3 one gets σk(0) = 25.56S/m, -21.97S/mand-2.84 S/m, respectively. The sum of these three contributions yields σ(0) = 0.75 S/m. The very large contribution of the first component is almost completely compensated by the other two components. Unfortunately, the three detected processes may represent σJ(t) in the first six picoseconds as visible in Fig. 1b but fail to reproduce the long-term limit which is approximately 20% of 0.75 S/m. This fact indicates that there are additional processes which cannot be properly determined by or σJ(t). The time constant of this additional process (k = 4) is in the range of 50 to 200 picoseconds. Furthermore, to be honest, σk(0) in Eq. (23) strongly depends on the time constants τk. In particular, in case of δ2 ≃ π/2 and the large amplitude A2 small variations of τ3 significantly changes the value of σ2(0) and consequently σ(0). Altogether, the computation of the static conductivity σ2(0) on the basis of or σJ(t) is an intricate procedure. However, as shown below, more reliable results, especially for the slow modes, can be gained from the collective dipolar displacement.
B. Relaxation of the ionic cage
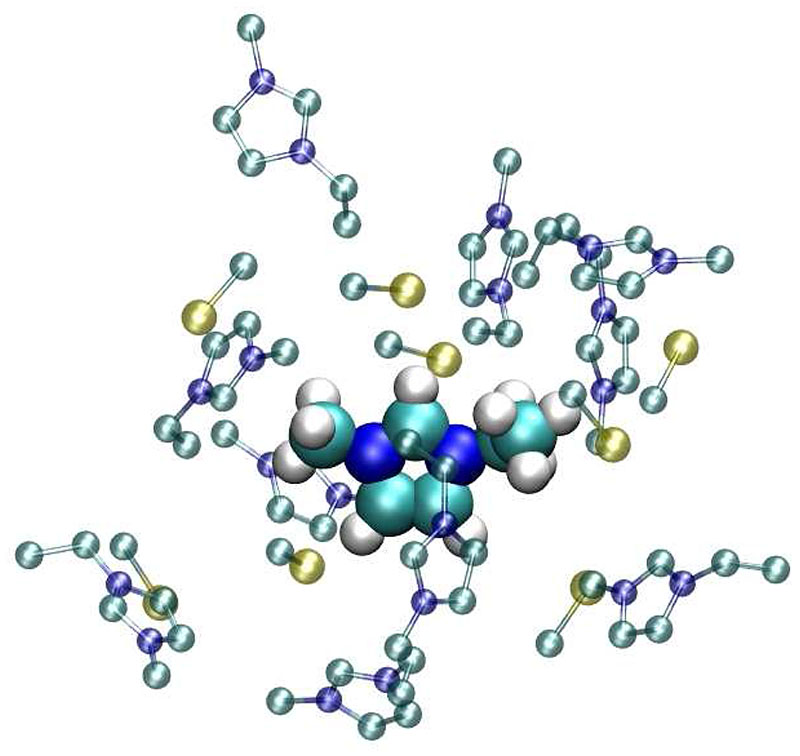
From a chemist point of view, the first k = 1 component may be seen as the conductive motion of the central ions which is hampered by the lag of their surrounding ion cage. Hence, the second and third component should be related to the ion cloud, i.e. the cage. A typical ion cloud around EMIM+ is shown in Fig. 2. For clarity’s sake the hydrogens of the surrounding cations and the oxygens and fluorines of are not displayed. In contrast to the intuitive view that the cation is surrounded by a cage of anions, the higher number of neighboring cations is interesting. The location of the cationic neighbors is not restricted to the side chain of the central cation; they also approach the imidazolium ring. The anions are very often found in close proximity to the three acidic hydrogens of the cationic imidazolium ring. However, the coordination is not strictly monovalent as demonstrated by the two triflates around the H2 of EMIM+ in Fig. 2. A further striking feature of the cage is the alternating sequence of cations and anions. This could be explained by the fact that the repulsion between two like ions is suppressed by an intercalated counter ion.
Fig. 2.
A snapshot of first shell members of 1-ethyl-3-methyl-imidazolium. For the sake of simplicity the hydrogens of the surrounding imidazoliums and the fluorines and oxygens of triflate are not displayed.
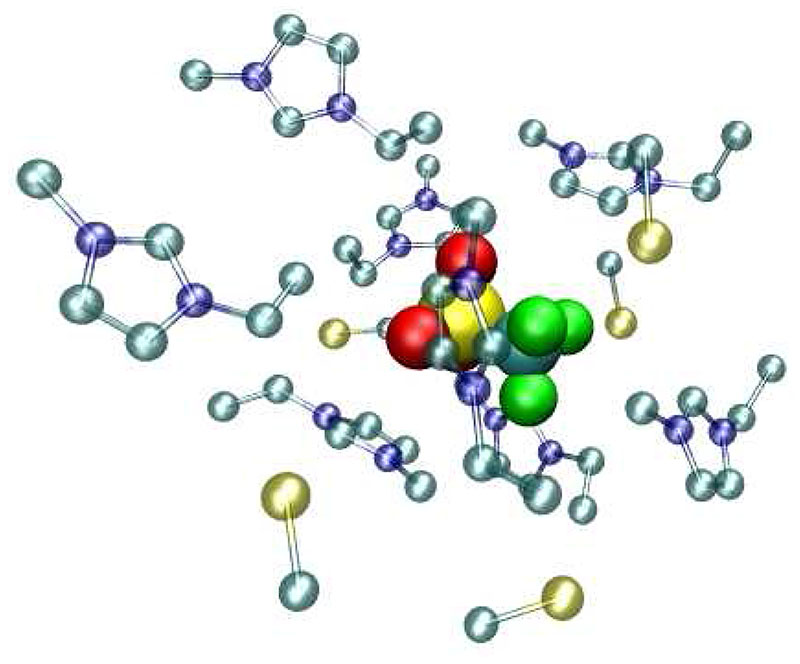
Fig. 3 shows the anionic cage which occupies less space compared to the cationic cage. Furthermore, the number of counter ions is now higher with a typical ratio of approximately 2:1 and probably due to a highly concentrated negative charge as compared to the more diffusive cationic charge distribution. In other words, the anionic cage is essentially determined by electrostatic interactions while in the cationic cage steric effects play a role, too.
Fig. 3.
A snapshot of first shell members of triflate. For the sake of simplicity the hydrogens of the surrounding imidazoliums and the fluorines and oxygens of triflate are not displayed.
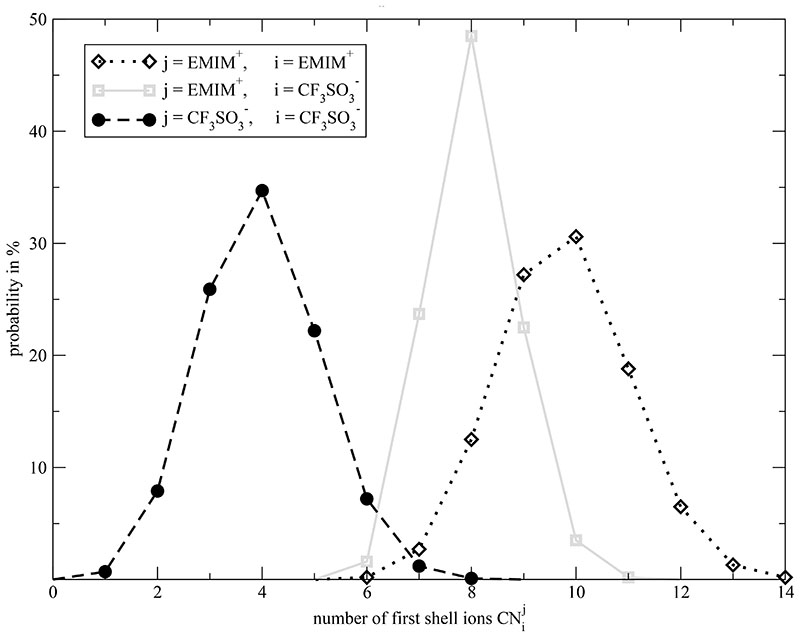
These pictures are significant snapshots of the local environment around a selected cation and anion. In order to draw quantitative conclusions of the cationic and anionic cages from all ions and from the whole trajectory one may apply the parameter-free Voronoi method to detect the cages. As a first result, the distribution of cage members , i.e. the mutual coordination numbers, for different combination of ion types can be obtained and are displayed in Fig. 4. The first remarkable result is that the central ions EMIM+ j have more direct cationic neighbors (black dotted distribution) than triflate (gray solid line). This may be due to the larger surface of EMIM+ compared to which offers more “docking places”. The distribution of coordination numbers between like charges is broadened. Here, the mutual orientation of both ions is of greater concern. The attraction between unlike charges narrows the width of the respective distribution.
Fig. 4.
Distribution of mutual coordination numbers. j denotes the central ion species and i the surrounding species.
The rough balance of cationic and anionic members around a central EMIM+ and the 2:1 ratio of cations and anions around can also be conducted from the average coordination number in Fig. 4. Another fact to mention is that all coordination numbers are very high. For example, each triflate anion has direct contact to eight EMIM+ on average which makes the classification of “ion pairs” a little bit dubious. Even more, each hydrogen of the imidazolium ring have almost always direct contact to at least one triflate during the whole simulation period which was also found by Kohanoff et al.36 Comparable high coordination numbers are found for other ionic liquids as well.9,37 These two references also show the difficulties in determining coordination numbers from radial distribution functions. Ref. 9 stated two different coordination numbers for cation–cation, anion–anion and cation-anion depending on the distance criterion of the shell. Ref. 37 depicted a coordination number as function of the distance to the central ion without specifying the first shell criterion explicitly. The difficulties in determining coordination numbers become even worse when considering anisotropic, non-spherical ions, e.g. imidazoliums with larger side chains. The Voronoi method does not suffer from these problems: The determination of the direct neighbors is done without a “shell parameter” and solely due to contacts of molecules.33 Consequently, the Voronoi shells are not spherical but adapt to the anisotropic shape of the reference molecules.
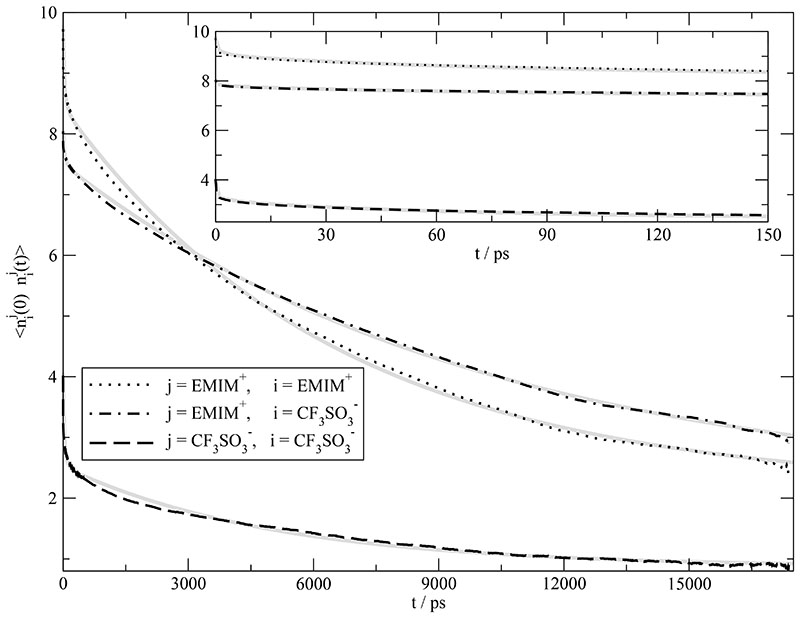
Based on the findings of the cage structure the dynamics of the cage may be characterized by the auto-correlation of the residence function displayed in Fig. 5. Together with the inset which zooms the subpicosecond and picosecond range these correlation functions are found to cover three time regimes: subpicoseconds, a few picoseconds and several nanoseconds. The fit function fnn(t) of Eq. (21) offers the possibility to quantify these time regimes. The resulting parameters are given in Table II and the corresponding fit as gray lines in Fig. 5. Within the time window shown, the asymptotic value, n∞ ≃ 2, shows that two of eight neighbors of the central ion of opposite charge stay during the whole simulation period. The mutual residence time between cations and anions is the longest time constant with a value of 9990 ps. It would be tempting to associate this long time constant or the “steady-state” value n∞ with the existence of ion pairs. The respective amplitudes of 5.41 and 2.05, however, are far beyond a 1:1 ion pair. In other words, we have a long lived ion cage but not an ion pair.
Fig. 5.
Mutual mean residence function . j denotes the central ion species and i the surrounding species (black curves). The inset represents the first 150 picoseconds. All curves can be fitted according to fnn(t) (respective gray curves) with the parameters in Table II.
Table II. Fit parameters of the correlation of the residence function according to
| central ion j | surrounding ion i | k | n ∞ | τk / ps | |
|---|---|---|---|---|---|
| EMIM+ | EMIM+ | 2.15 | |||
| 2 | 0.47 | 0.195 | |||
| 3 | 0.26 | 2.85 | |||
| 4 | 0.62 | 61.3 | |||
| 5 | 6.29 | 6560 | |||
| 〈τ〉 | 5410 | ||||
| EMIM+ | 2.05 | ||||
| 2 | 0.19 | 0.240 | |||
| 3 | 0.072 | 3.58 | |||
| 4 | 0.30 | 61.2 | |||
| 5 | 5.41 | 9990 | |||
| 〈τ〉 | 9050 | ||||
| 0.87 | |||||
| 2 | 0.70 | 0.206 | |||
| 3 | 0.19 | 3.82 | |||
| 4 | 0.66 | 59.0 | |||
| 5 | 1.65 | 5050 | |||
| 〈τ〉 | 2610 |
Remarkably, the time constants of the k = 2 and k = 3-component for cation-cation, cation-anion and anion-anion look very similar to the time constants gained from the fit. This coincidence stresses that the translational processes responsible for the collective current can be retrieved in the cage relaxations which are representative for a local environment. In other words, although being a collective property, the current J(t) and hence the conductivity σ(0) are determined by a local environment. However, this statement makes also clear, that a correct description of the interaction between a molecule and its local environment is crucial to gain reliable results for the conductivity. Therefore, the polarizability which model the reaction of a molecule to its environment should be an intrinsic part of molecular dynamics simulations of ionic liquids.
C. Collective dipolar displacement
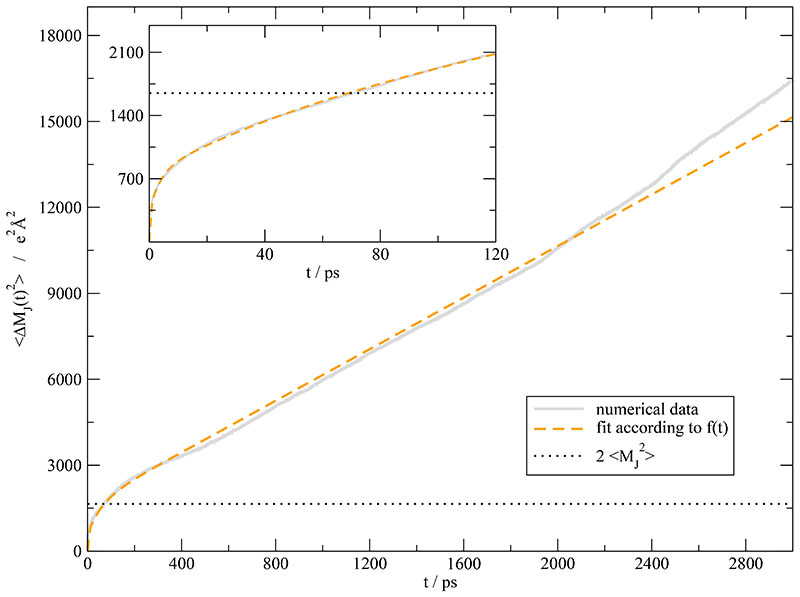
The analysis of the cage dynamics revealed slow processes beyond the scope of the current correlation function . In principle, these slow processes must show up in the collective translational properties. As explained in the Theory section, the collective dipolar displacement is more sensitive to these slow translational processes. Fig. 6 shows both, the numerical data of as well as the corresponding fit. In order to elucidate the short time behavior an inset covering the first 120 picoseconds is given, too. The fit function (orange dashed line) is multi-exponential plus an asymptotic linear part. The corresponding fit parameters are given in Table I. The first two time constants and are similar to 0.24 ps and 2.6 ps found in a dielectric study of Asaki et al.68
Fig. 6.
Mean squared-displacements of the unfolded collective rotational dipole moment MJ(t). The solid gray curve is gained from the whole simulation period. The orange dashed curve represents the fit to with the values given in Table I. The inset displays the first 120 ps. As can be seen from the dotted line of the inset is far away from the linear regime.
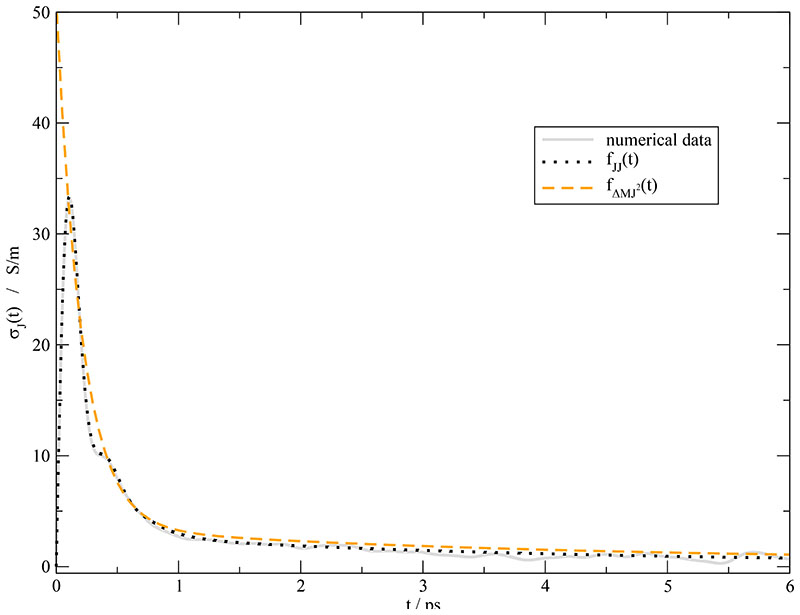
As expected from Eq. (17), the time constants k = 1… 3 of are also found in the collective dipolar displacement . Since oscillations are difficult to detect in a mean-squared displacement, only the superposition of k = 1 and k = 2 is found. Furthermore, a relaxation constant τ4 of 60.8 ps appears which agrees very well with the ~ 60 ps detected in the cage relaxation processes and lies in the range of time constants suspected from the σJ(t) fit. A possible explanation for the invisibility of this process in is the down-scaling of the amplitude Ak = Ãk/2τk. For slow processes, i.e. for high values of τ the amplitude is suppressed and hardly visible in the current correlation function. The “theoretical” values of the amplitude Ak are given in brackets in Table I. The ratio between A1+2 = -3306 e2 A2 ps−2 and A4 = -0.141 e2 A2 ps-2 is so large, that the slow process k = 4 is masked by the statistical noise of . Although playing a different role for slow and fast translational processes the dipolar displacement and the current correlation function must match at an intermediate level. In fact, if one integrates to get σJ(t) (see Eq. (12)) or differentiates (see Eq. (16)) the consistency of the two completely different fits of and can be checked. Fig. 7 presents the result of this consistency check. The numerical integration of is again shown as gray solid line. The fits of according to fJJ(t) and of according to are represented as black dotted and orange dashed line, respectively. Except for very short times below 0.5 ps the agreement is fairly good. The deviation at very short times stems from the oscillatory behavior at short times which cannot be represented by the multi-exponential function . The final value of σJ(τ) are given by Eq. (23) in case of the current correlation function and σ in case of after all exponential processes have decayed. From the slope of the linear region (t > 400 ps) of one may get a static conductivity σ(0) value of 0.16 S/m which is a little bit less than the value of 0.17 S/m gained from the current correlation function if one adds the k = 4-component of . Based on the Nernst-Einstein equation (1) this corresponds to a collectivity factor Δ of 0.17.
Fig. 7.
Running integral σJ(t). The gray line represents the numerical integration of . The black dotted line and the orange dashed line display the fit fJJ(t) and with the values given in Table I.
D. Dielectric spectrum
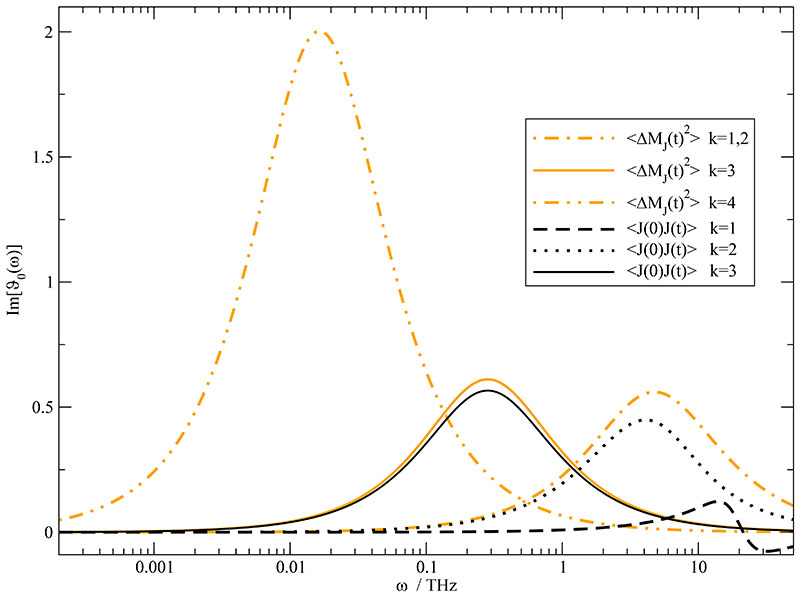
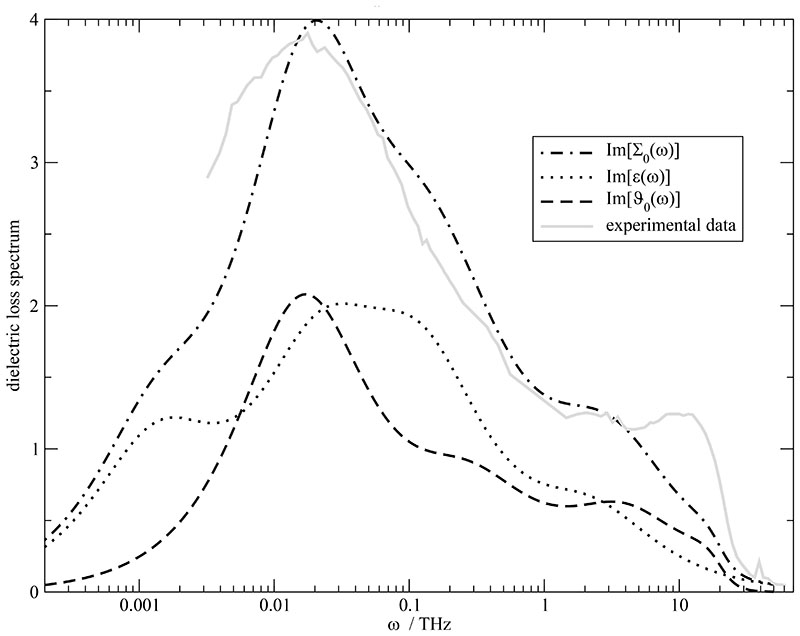
In Fig. 7 we have demonstrated the agreement of the two independent fits of and in the time domain. The close correspondence in frequency space is illustrated in Fig. 8 for the translational part of the dielectric spectrum ϑ0(ω). In the high frequency range between 1 and 50 THz the two oscillatory components of the current (black dashed and dotted line) contribute two distinct peaks while the single exponent of the dipolar displacement appears as a single broad peak (orange dash-dotted line). Nevertheless, this single broad peak approximates sum of the two current peaks quite well. Although being the major player for the shape of , the contribution of the first component k = 1 is quite less important for the spectrum of the dielectric conductivity ϑ0(ω). One way of explanation would be that the k = 1-component mainly characterizes the static conductivity σ(0) which is subtracted from σ(ω) in the computation of ϑ0(ω). Therefore, major parts of the k = 1-component are not part of ϑ0(ω) any more and the contribution to the static value of the dielectric conductivity shrinks to 0.04. Nevertheless, the frequency ω1 is still visible in the spectrum by the crossing of the ω-axis at 17.7 THz. The negative values above 17.7 THz show that the contribution of the k = 1-component counteracts the contribution from k = 2 at these frequencies. The non-oscillatory character of the k = 2-component manifests in a approximately Lorentzian-shaped peak (black dotted line) in the dielectric spectrum and contributes to ϑ0(0) with a value of 0.81 which is 20 times higher than the first component. In the k = 2-component decreased the static conductivity and was attributed to ion cage effects which are still present in the dielectric spectrum after the subtraction of the static conductivity. The third component of 〈J(0)·J(t)〉 -fit (black solid line) with a time constant of τ3 =3.52 ps contributes slightly more to ϑ0(0) with a value of 1.13. As can be already seen in Table I the k = 3-component gained from the collective dipolar displacement is almost identical to that of the -fit. Consequently, the respective peaks at ~ 0.3 THz coincide and their contribution to ϑ0(0) is of equal weight. The major contribution to the dielectric conductivity spectrum ϑ0(ω) stems from the slowest detectable process (k = 4) of the collective dipolar displacement and is located at ~ 0.02 THz. Converting this peak by Kramers-Kronig to a contribution to the static dielectric conductivity yields a value of roughly 4 which is two-thirds of the total ϑ0(0). The sum of all contributions to ϑ0(0) is slightly higher than the value approximated in Ref. 26.
Fig. 8.
Juxtaposition of the individual fit components of (orange) and (black) contributing to the dielectric conductivity ϑ0(ω).
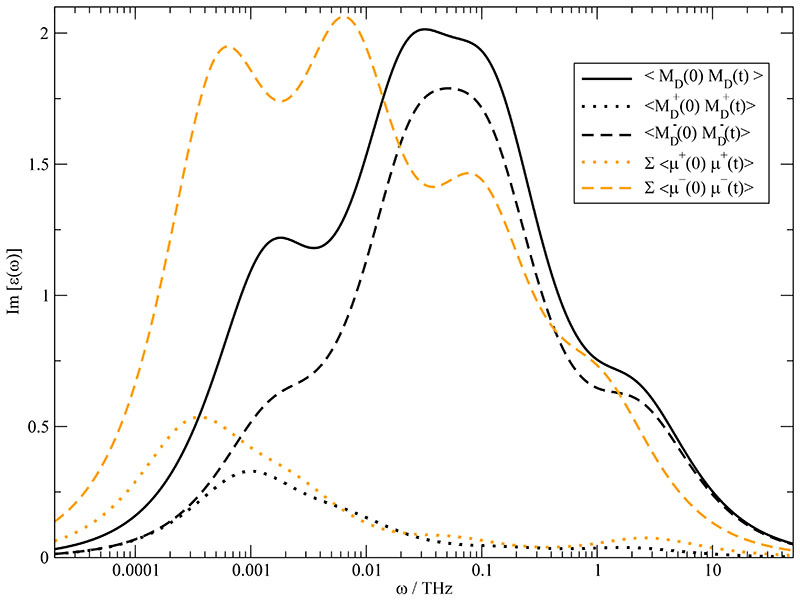
Up to now, we have discussed the translational part of the dielectric spectrum. In order to compute the spectrum of the generalized dielectric constant Σ0(ω) one needs the dielectric permittivity ∈(ω) as well. ∈(ω) may be gained by Fourier-Laplace transform of a fit of 〈MD(0)·MD(t)〉 according to Eq. (8) and is shown in Fig. 9 as solid black line. It may be decomposed into contributions from the cations (dotted black line) and anion (dashed black line) and their cross-term (not shown). Since the translational processes could be explained on a local level of an ion with its cage, one is tempted to apply a similar procedure40,69 for the rotational correlation of the dipole moments. The straightforward way to find out the influence of collectivity would be the approximation of dipolar relaxation by the sum over the individual auto-correlation functions of the molecular dipole moments. For the cations (orange dotted line) and anions (orange dashed line) these single-particle correlation functions are shown in Fig. 9. Their shift to lower frequencies as compared to their collective analogues is striking, particularly for the anions. In other words, the coupling between molecular dipole moments speeds up rotational dipole relaxation. Thereby, the term “rotational” comprises all non-translational contributions. In particular, it contains the contributions from the induced dipoles mimicking the electronic response to the local environment.
Fig. 9.
Imaginary part of the dielectric permittivity ∈(ω) (black solid line). It is built up by the cationic contribution (black dotted line), the anionic contribution (black dashed line) and the cross-term between cations and anions (not shown). If one completely neglects collectivity, the contribution of the cations and anions is given by the orange dotted and orange dashed line respectively.
The discrepancy between the corresponding black and orange curves clearly demonstrates the impact of collectivity. A measure of this collectivity in rotational relaxation is the Kirkwood GK-factor
| (24) |
originally developed for neutral molecular liquids. 70–72 Applying this relation separately to cations and anions we find values of = 0.58 and =0.65. This indicates that the dipoles of like charges seem to prefer an overall anti parallel alignment which quenches the collective dipole moment as compared to the sum of individual dipoles. From the theory of Kivelson and Madden one would expect that collective and single particle rotational relaxation times scale with the corresponding GK-factors.71,72 Values below unity are indicative of a speed up of collective rotation as compared to single particle rotation. For the present case the acceleration is even faster showing the high cooperativeness of the molecular ions.
Altogether, the dielectric permittivity ϵ(ω) (black dotted line) and the dielectric conductivity ϑ0(ω) (black dashed line) sum up to the generalized dielectric constant ∑0 (ω) (black dash-dotted line) shown in Fig. 10. It is important to note that the central peak of ∑0(ω) can be neither attributed solely to ϵ(ω) nor to ϑ0(ω). In fact, it results from the superposition of both part of the spectrum which strongly overlap. The good agreement between the computational and the experimental spectrum (gray line in Fig. 10) of Ref. 46 provides strong evidence that the findings and conclusions made so far are representative of the experimental situation. We state that this consensus between simulation and experiments depends on the inclusion of the slow process detected in the dipolar displacement. This demonstrates once more that the translational part of the dielectric spectrum of molecular ionic liquids cannot be computed solely from the current correlation function. Rather, the combination with the dipolar displacement is essential in order to detect slow processes. Therefore, we have used the motional parameters from the current correlation function augmented by the slow process (k = 4) from .
Fig. 10.
Dielectric loss spectrum of the generalized dielectric constant (dash-dotted line). It can be decomposed into the dielectric permittivity ϵ(ω) (dotted line) and the dielectric conductivity ϑ0(ω) (dashed line). For comparison the experimental spectrum is given by the gray line.46
V. Conclusion
The dielectric behaviour of the molecular ionic liquids EMIM+ can be neither derived from single-particle motion nor from the motional coupling of ion pairs. In fact, it is intrinsically collective. However, there is a difference between translational and rotational (including induced and vibrational) contributions:
In case of translational processes the inclusion of the ion cage accounts already for the translational cooperativeness. Thereby, the ion cage is rather heterogeneous: On average the cage is build up from eight counter ions. But also contains ten EMIM+ or four in case of a central EMIM+ or CF3SO3-, respectively. All time constants found in and are also present in the residence correlation functions around the cations and anions.
However, collective rotation involves the complete set of interacting dipoles. An approximation in single-particle terms would result in a dielectric spectrum differing substantially from experiment. This demonstrates the long-range coupling of dipolar rotation which also manifests in Kirkwood GK-factor below unity for cations and anions.
Traditionally, the collective dipolar displacement is only used to compute the static conductivity σ(0) from the linear region of this function. In this work we showed that the initial nonlinear region is essential for the determination of slow translational processes which contribute significantly to the dielectric spectrum at lower frequency. Furthermore, the agreement between the information gained from the current correlation function and the collective dipolar displacement for the high frequency part of the generalized dielectric constant is demonstrated. The combination of these information brings one into the position to compute a dielectric spectrum which agrees well with the experimental one.
Acknowledgments
The computational work was performed on the “Vienna Scientific Cluster” (www.zid.tuwien.ac.at/vsc) of the University of Vienna, the Vienna University of Technology, and the University of Natural Resources and Applied Life Science Vienna. We thank for generous allocation of computer time. This work was supported by Project No. P23494 of the FWF Austrian Science Fund.
References
- 1.Schröder C, Steinhauser O. In: Computational Spectroscopy:Methods, Experiments and Applications. Grunenberg J, editor. Wiley-VCH; Weinheim: 2010. [Google Scholar]
- 2.Weingärtner H. Angew Chem Int Ed. 2008;47:654. doi: 10.1002/anie.200604951. [DOI] [PubMed] [Google Scholar]
- 3.Forsyth SA, Pringle JM, MacFarlane DR. Aust J Chem. 2004;57:113 [Google Scholar]
- 4.Keblinski P, Eggebrecht J, Wolf D, Phillpot SR. J Chem Phys. 2000;113:282 [Google Scholar]
- 5.Del Pópolo MG, Voth GA. J Phys Chem B. 2004;108:1744 [Google Scholar]
- 6.Bhargava BL, Klein ML, Balasubramanian S. Chem Phys Chem. 2008;9:67 [Google Scholar]
- 7.Xiao D, Hines LG, Jr, Li S, Bartsch RA, Quitevis EL, Russina O, Triolo A. J Phys Chem B. 2009;113:6426. doi: 10.1021/jp8102595. [DOI] [PubMed] [Google Scholar]
- 8.Hardacre C, Holbrey JD, McMath SEJ, Bowron DT, Soper K. J Chem Phys. 2003;118:273 [Google Scholar]
- 9.Morrow TI, Maginn EJ. J Phys Chem B. 2002;106:12807 [Google Scholar]
- 10.Shah JK, Brennecke JF, Maginn EJ. Green Chem. 2002;4:112 [Google Scholar]
- 11.Liu Z, Huang S, Wang W. J Phys Chem B. 2004;108:12978 [Google Scholar]
- 12.Schröder C, Rudas T, Steinhauser O. J Chem Phys. 2006;125:244506. doi: 10.1063/1.2404674. [DOI] [PubMed] [Google Scholar]
- 13.MacFarlane DR, Golding J, Forsyth S, Forsyth M, Deacon GB. Chem Commun. 2001:1430 [Google Scholar]
- 14.Huddleston JG, Visser AE, Reichert WM, Willauer HD, Broker GA, Rogers RD. Green Chem. 2001;3:156 [Google Scholar]
- 15.Malvaldi M, Chiappe C. J Phys Condens Matter. 2008;20:035108 [Google Scholar]
- 16.Schröder C, Haberler M, Steinhauser O. J Chem Phys. 2008;128:134501. doi: 10.1063/1.2868752. [DOI] [PubMed] [Google Scholar]
- 17.Schröder C, Steinhauser O. J Chem Phys. 2008;128:224503. doi: 10.1063/1.2929848. [DOI] [PMC free article] [PubMed] [Google Scholar]
- 18.Schröder C, Hunger J, Stoppa A, Buchner R, Steinhauser O. J Chem Phys. 2008;129:184501. doi: 10.1063/1.3002563. [DOI] [PMC free article] [PubMed] [Google Scholar]
- 19.Shim Y, Kim HJ. J Phys Chem B. 2008;112:11028. doi: 10.1021/jp802595r. [DOI] [PubMed] [Google Scholar]
- 20.Schröder C, Steinhauser O. J. Chem. Phys. 2009;131:114504. doi: 10.1063/1.3220069. [DOI] [PubMed] [Google Scholar]
- 21.Schröder C, Steinhauser O. J Chem Phys. 2010;132:244109. doi: 10.1063/1.3432620. [DOI] [PMC free article] [PubMed] [Google Scholar]
- 22.Schröder C, Wakai C, Weingoartner H, Steinhauser O. J Chem Phys. 2007;126:084511. doi: 10.1063/1.2464057. [DOI] [PubMed] [Google Scholar]
- 23.Caillol JM, Levesque D, Weis JJ. J Chem Phys. 1989;91:5544 [Google Scholar]
- 24.Caillol J-M. J Chem Phys. 1994;101:6080 [Google Scholar]
- 25.Borodin O. J Phys Chem B. 2009;113:11463. doi: 10.1021/jp905220k. [DOI] [PubMed] [Google Scholar]
- 26.Schröder C, Steinhauser O. J Chem Phys. 2010;133:154511. doi: 10.1063/1.3493689. [DOI] [PMC free article] [PubMed] [Google Scholar]
- 27.Yan T, Wang Y, Knox C. J Phys Chem B. 2010;114:6886. doi: 10.1021/jp908914d. [DOI] [PubMed] [Google Scholar]
- 28.Moore WJ, Hummel DO, Trafara G, Holland-Moritz K. Physikalische Chemie. 4th ed Walter de Gruyter; Berlin, New York: 1986. [Google Scholar]
- 29.Debye P, Huckel E. Physik Z. 1923;24:185 [Google Scholar]
- 30.McQuarrie DA. Statistical mechanics. Harper and Row; New York, Evanston, San Fran-scisco, London: 1976. [Google Scholar]
- 31.Song X. J Chem Phys. 2009;131:044503. doi: 10.1063/1.3187147. [DOI] [PubMed] [Google Scholar]
- 32.Aurenhammer F. ACM Computing Surveys. 1991;23:345 [Google Scholar]
- 33.Okabe A. Spatial tesselations: Concepts and applications of Voronoi diagrams. Wiley; New York: 2000. [Google Scholar]
- 34.Schröder C, Neumayr G, Steinhauser O. J Chem Phys. 2009;130:194503. doi: 10.1063/1.3127782. [DOI] [PMC free article] [PubMed] [Google Scholar]
- 35.Neumayr G, Schröder C, Steinhauser O. J Chem Phys. 2009;131:174509. doi: 10.1063/1.3256003. [DOI] [PubMed] [Google Scholar]
- 36.Del Pópolo MG, Lynden-Bell RM, Kohanoff J. J Phys Chem B. 2005;109:5895. doi: 10.1021/jp044414g. [DOI] [PubMed] [Google Scholar]
- 37.Bhargava BL, Balasubramanian S. Chem Phys Lett. 2006;417:486 [Google Scholar]
- 38.Kirchner B, Seitsonen AP. Inorg Chem. 2007;46:2751. doi: 10.1021/ic0624874. [DOI] [PubMed] [Google Scholar]
- 39.Spickermann C, Thar J, Lehmann SBC, Zahn S, Hunger J, Buchner R, Hunt PA, Welton T, Kirchner B. J Chem Phys. 2008;129:104505. doi: 10.1063/1.2974098. [DOI] [PubMed] [Google Scholar]
- 40.Krekeler C, Dommert F, Schmidt J, Zhao YY, Holm C, Berger R, delle Site L. Phys Chem Chem Phys. 2010;12:1817. doi: 10.1039/b917803c. [DOI] [PubMed] [Google Scholar]
- 41.Yu H, van Gunsteren WF. Comput Phys Commun. 2005;172:69 [Google Scholar]
- 42.Lopes PEM, Roux B, MacKerell AD., Jr Theor Chem Acc. 2009;124:11. doi: 10.1007/s00214-009-0617-x. [DOI] [PMC free article] [PubMed] [Google Scholar]
- 43.Yan T, Burnham CJ, Del Pópolo MG, Voth GA. J Phys Chem B. 2004;108:11877 [Google Scholar]
- 44.Smith GD, Borodin O, Li L, Kim H, Liu Q, Bara JE, gin DL, Nobel R. Phys Chem Chem Phys. 2008;10:6301. doi: 10.1039/b808303g. [DOI] [PubMed] [Google Scholar]
- 45.Jiang W, Yan T, Wang Y, Voth GA. J Phys Chem B. 2008;112:3121. doi: 10.1021/jp710653g. [DOI] [PubMed] [Google Scholar]
- 46.Schröder C, Sonnleitner T, Buchner R, Steinhauser O. Phys Chem Chem Phys. 2011 doi: 10.1039/c1cp20559e. submitted March 1st. [DOI] [PubMed] [Google Scholar]
- 47.Canongia Lopes JN, Deschamps J, Padua AAH. J Phys Chem B. 2004;108:2038 [Google Scholar]
- 48.Canongia Lopes JN, Deschamps J, Padua AAH. J Phys Chem B. 2004;108:11250 [Google Scholar]
- 49.Canongia Lopes JN, Padua AAH. J Phys Chem B. 2004;108:16893 [Google Scholar]
- 50.Hanke CG, Price SL, Lynden-Bell RM. Mol Phys. 2001;99:801 [Google Scholar]
- 51.Anisimov VM, Lamoureux G, Vorobyov IV, Huang N, Roux B, MacKerell AD. J Chem Theory Comput. 2005;1:153. doi: 10.1021/ct049930p. [DOI] [PubMed] [Google Scholar]
- 52.Harder E, Anisimov VM, Whitfield T, MacKerell AD, Jr, Roux B. J Phys Chem B. 2008;112:3509. doi: 10.1021/jp709729d. [DOI] [PMC free article] [PubMed] [Google Scholar]
- 53.van Duijnen PT, Swart M. J Phys Chem A. 1998;102:2399 [Google Scholar]
- 54.Harder E, Anisimov VM, Vorobyov IV, Lopes PEM, Noskov SY, MacKerell AD, Jr, Roux B. J Chem Theory and Comp. 2006;2:1587. doi: 10.1021/ct600180x. [DOI] [PubMed] [Google Scholar]
- 55.Lamoureux G, Roux B. J Chem Phys. 2003;119:3025 [Google Scholar]
- 56.Darden T, York D, Pedersen L. J Chem Phys. 1993;98:10089 [Google Scholar]
- 57.Essmann U, Perera L, Berkowitz ML, Darden T, Lee H, Pedersen LG. J Chem Phys. 1995;103:8577 [Google Scholar]
- 58.Neumann M, Steinhauser O. Chem Phys Lett. 1984;106:563 [Google Scholar]
- 59.Salanne M, Simon C, Turq P, Madden PA. J Phys Chem B. 2007;111:4678. doi: 10.1021/jp067073a. [DOI] [PubMed] [Google Scholar]
- 60.Siqueira LJA, Ribeiro MCC. J Phys Chem B. 2007;111:11776. doi: 10.1021/jp074840c. [DOI] [PubMed] [Google Scholar]
- 61.Pićalek J, Kolafa J. J Mol Liquids. 2007;134:29 [Google Scholar]
- 62.Bhargava BL, Balasubramanian S. J Chem Phys. 2005;123:144505. doi: 10.1063/1.2041487. [DOI] [PubMed] [Google Scholar]
- 63.Rey-Castro C, Vega LF. J Phys Chem B. 2006;110:14426. doi: 10.1021/jp062885s. [DOI] [PubMed] [Google Scholar]
- 64.Kowsari MH, Alavi S, Ashrafizaadeh M, Najafi B. J Chem Phys. 2009;130:014703. doi: 10.1063/1.3042279. [DOI] [PubMed] [Google Scholar]
- 65.Wulf A, Fumino K, Ludwig R. Angew Chem Int Ed. 2010;49:449. doi: 10.1002/anie.200905437. [DOI] [PubMed] [Google Scholar]
- 66.Wulf A, Fumino K, Ludwig R, Taday PF. Chem Phys Chem. 2010;11:349. doi: 10.1002/cphc.200900680. [DOI] [PubMed] [Google Scholar]
- 67.English NJ, Mooney DA, O’Brien SW. J Mol Liquids. 2010;157:163 [Google Scholar]
- 68.Asaki MLT, Redondo A, Zawodzinski TA, Taylor AJ. J Chem Phys. 2002;116:10377 [Google Scholar]
- 69.Koßmann S, Thar J, Kirchner B, Hunt PA, Welton T. J Chem Phys. 2006;124:174506. doi: 10.1063/1.2191493. [DOI] [PubMed] [Google Scholar]
- 70.Kirkwöd JG. J Chem Phys. 1939;7:911 [Google Scholar]
- 71.Boottcher CJF, Bordewijk P. Theory of electric polarization. Vol. 1 Elsevier; Amsterdam: 1978. [Google Scholar]
- 72.Madden P, Kivelson D. Adv Chem Phys. 1984;56:467 [Google Scholar]


