Abstract
Molecular ionic liquids are typically characterized by strong electrostatic interactions resulting in a charge ordering and retardation of their translational and rotational behaviour. Unfortunately, this effect is often overestimated in classical molecular dynamics simulations. This can be circumvented in a twofold way:
The easiest way is to reduce the partial charges of the ions to sub-integer values of ± 0.7-0.9 e. The more realistic model is to include polarizable forces, e.g. Drude-oscillators, but it comes along with an increasing computational effort. On the other hand, charge-scaled models are claimed to take an average polarizability into account. But do both models have the same impact on structure and dynamics of molecular ionic liquids? In the present study several molecular dynamics simulations of 1-ethyl-3-methylimidazolium trifluoromethanesulfonate are performed with different levels of polarization as well as with varying charge scaling factors of 0.74 to 0.90. The analysis of the structural and dynamical results are performed in different levels: from the atomic point of view over the molecular level to collective properties determined by the complete sample.
I. Introduction
Focusing on the ionic character of ionic liquids one would anticipate a translational ordering resembling that of a crystalline structure. Indeed, one observes a typical charge ordering,1–4 i.e. a sequence of charge layers of alternating sign.5–9 But ionic liquids are more than a mere liquid salt since their translational and rotational dynamics conflicts with the picture of a crystal-like system.10,11 Hence, there has to exist forces counteracting the strong electrostatic forces responsible for the observed charge ordering. Obviously, the steric anisotropy of both, cations and anions, as well as their difference in size and shape are important sources of counteraction. An atomistic model based on the combined molecular anisotropy of steric and electrostatic forces should give an appropriate picture of the dynamics in molecular ionic liquids. In the past decade non-polarizable simulations,12–17 however, have shown that this picture is still incomplete, because the mobility is still below experimental evidence.
In 2002 Morrow and Maginn noticed that a partial charge assignment by the CHELPG18 method of a 1-butyl-3-methylimidazolium hexafluorophosphate pair in the gas phase resulted in a non-integer molecular charge of ±0.904 e. The reduced electrostatics should increase mobility, but this was not observed in their study. Although they explicitly stated that this molecular charge reduction is possibly due to induced polarization, the idea of a concomitant charge transfer in ionic liquid was born.19 Bühl et al. addressed the problem in determining the appropriate partial charge distribution for the imidazolium cation, but they also stated that the amount of “charge transfer” seem to be invariant independent of the method used. Furthermore, experimental evidence for charge transfer processes in ionic liquids have been published.20,21
In principle, there exists a plethora of methods to derive partial charges from quantum-mechanical calculations, e.g. population analysis of the wavefunctions, partitioning of electron density distributions or the modelling of the electrostatic potential. In simulations involving intermolecular interactions the last method is used most frequently, e.g. CHELPG18. In any case, a continous distribution or function is converted to that created by a set of discrete point charges.18,22,23 This poses several problems: First, the partial charges of interior atoms are not well defined.24 Additionally, if the electrostatic potential is reduced, for example by polarization effects, the resulting charge distribution will consist of lower partial charges. The resulting non-integer charge of cations and anions in this case cannot be addressed to a charge transfer. Finally, the predicted charges are highly conformationally dependent.23 Therefore, the charge assignment procedure is usually repeated for several configurations.19,23,25–27 Afterwards, the partial charges are averaged over the values gained for each configuration and used in classical molecular dynamics simulation. However, there is still an ongoing discussion on the proper parametrization of partial charges in ionic liquids. For example, partial charges of the nitrogens in an imidazolium ring vary from positive6,7,28,29 through quasi-neutral8,30 to negative.31,32 Unfortunately, the electrostatic interactions play a crucial role in the dynamics of ionic liquids. We showed in a former study, that changing the partial charge distributions may result in an acceleration of the dynamics by a factor of two.17 Although we found only minor changes in the structural behaviour in case of 1-ethyl-3-methylimidazolium dicyanoamide, Kirchner et al. observed significantly larger structural discrepancies when changing the partial charge distribution in case of 1-butyl-3-methylimidazolium bromide.33
Fixed partial charges do not allow for a response of the molecules to their local environment. In addition, changes in the molecular dipole moment during the simulation may be limited by the moderate flexibility of the intramolecular potentials. Polarizable models, however, respond to local field gradients from neighboring ions by induced dipoles which may strengthen or weaken the intermolecular interactions. Furthermore, these induced dipoles broadens the distribution of molecular dipoles. As a consequence, polarizability makes the simulation less dependent on given partial charge distribution since induced dipoles may adopt to the current situation, e.g. by smearing out too sharp charge distributions. In molecular dynamics simulations several models exist to account for polarization, e.g. fluctuating charges,34 point-induced dipoles35–40 and Drude oscillators.41–49 A good and brief overview is given in Ref. 50.
Several groups noticed an increased mobility in polarizable ionic liquids.13,37,39,45,51–53 We have already demonstrated that the inclusion of polarizable forces reduced the Coulomb interaction by almost a factor of two.45 This fact seduced us to speak in terms of an “inner solvent” or “lubricant” when considering the electrostatic counteraction by the induced dipoles.49 Although being realistic in describing the properties of ionic liquids, the computational costs of polarizable simulations was increased by a factor of more than three depending on the model and its specifications. Avoiding this effort several groups have performed classical molecular dynamics simulations with reduced (scaled) partial charges.25,26,33,54–57 Besides the congruence with quantum-mechanical charge evaluations the electrostatic scaling factors were seen as additional eligible force field parameter27,56,57 to better fit experimental data or as an effective dielectric constant ∈eff screening the Coulomb potential.50,54 This is in accordance with MDEC (molecular dynamics using electronic continuum) theory which related ∈eff to an electronic continuum.58 In other words, the atomic point charges were immersed in a dielectric continuum with ∈eff = ∈∞, the optical high-frequency limit of the generalized dielectric constant. This immersion reduces the Coulomb interaction as if the original partial charges were reduced by a factor of . On the first sight, this theory seems promising since this reduction factor equals more or less the reduced charges predicted by common quantum-mechanical calculations. However, Marrocchelli et al. reported significant discrepancies for polarizable and charge-scaled GeO2.59 Although the current–current contribution to the infrared spectrum coincided at low frequencies for both models, significant differences occur at more localized vibrations at higher frequencies. Furthermore, the diffusion coefficients of the charge-scaled model was significantly higher compared to the polarizable model.
In the present study we focus on the juxtaposition of charge scaled and polarizable molecular dynamics simulations of 1-ethyl-3-methylimidazolium trifluoromethanesulfonate at various degrees of polarizability to answer whether reduced charges are capable to mimic an averaged effect of polarization or not. Both types of simulation, charge scaled and polarizable, are connected via the effective Coulomb potential which is explained in the first two theory sections in detail. The last theory section deals with the generalized dielectric constant. Its high-frequency limit is the base of the MDEC theory. Furthermore, it is a macroscopic property, accessible by computer simulations and experiment, which describes the solvent properties of a liquid and, even more, depends strongly on rotational and translational motions and induced effects of ionic liquids.
II. Theory
Computational studies are performed at the atomic level. In particular, Coulomb interaction are described by partial charges of atoms β of molecules i. Except for the special model of fluctuating charges34 these permanent charges are kept fixed in non-polarizable and polarizable simulations. In the latter case, the reorganization of the charge distribution in response to the change of the local environment is modelled by additional charges (Drude-oscillators)41–49 or induced dipoles.35–38,40 Apart from the way of its modeling, the reorganization of the charge distribution is of electronic origin with components moving much faster than the atomic nuclei do.
A. Atomic charges and polarizability in the Drude model
In the Drude oscillator model, the partial charge of each atom is augmented by a pair of opposite charges –qδ and qδ. As the negative charge resides at the nuclei it is usually combined with the respective permanent charge qiβ = –qδ. The positive charge qiβ = qδ is located on a small “additional particle”
| (1) |
moving as a satellite around its corresponding central atom tethered by a spring. The Drude pair creates an induced dipole depending on the displacement diβ of the satellite with respect to its central atom. Irrespective of this view as an induced dipole, the total Coulomb energy in the Drude model is computed strictly as an interaction between all (Drude particles and normal atoms) charges.
| (2a) |
| (2b) |
with R = |riβ — rjγ|. Equation (2b) is a reformulation of the original strict charge-charge interaction in terms of permanent charges and induced dipoles. Strictly speaking, this is only an approximation gained by a Taylor series,45 but justified because of the very small displacement of the Drude satellites. As can be seen from the explicit expressions
| (3a) |
| (3b) |
| (3c) |
Uself, Uδδ and Uδq are the self-energy, the dipole-dipole interactions and interaction between induced dipoles and permanent charges. Eiβ is the electric field exerted by the permanent charges on the induced dipoles.
The optimal induced dipoles – for a fixed configuration of nuclei – can be found by minimizing the energy with respect to these dipoles yielding
| (4) |
Inserting this last expression into the Eq. (2b) yields the minimum Coulomb energy
| (5) |
If the interaction between permanent charges and induced dipoles, Uδq, is positive, it will reduce the minimum Coulomb energy in Eq. (5). In a former study45 it was already shown by perturbation theory that the average Coulomb energy is reduced by a factor of (Seff)2:
| (6) |
B. Scaled charges: The poor man’s way to include polarizability
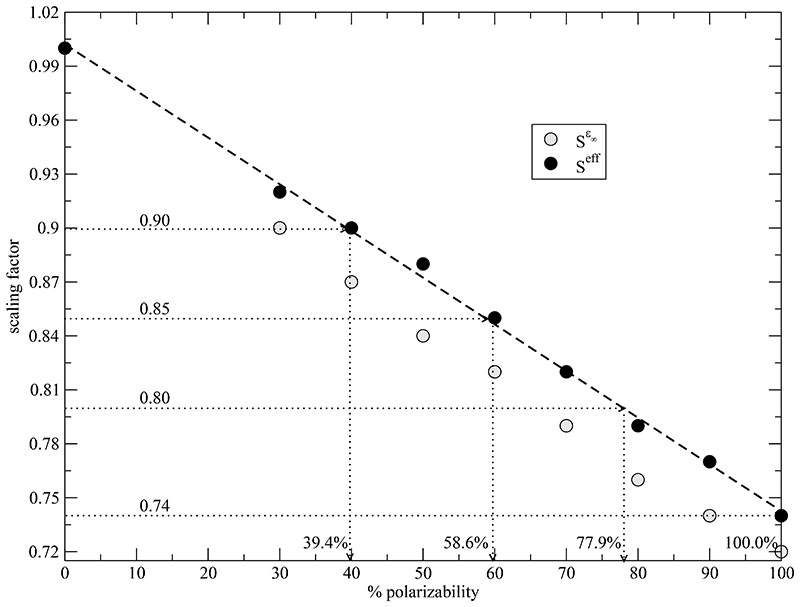
Fig. 1 shows that this reduction factor (black full circles) is a linear function (dashed line) of the degree of polarizability. This simple relationship raises the question whether the average influence of polarizability can be mimicked by scaled electrostatic forces. The easiest way to reduce the electrostatic forces in a non-polarizable molecular dynamics simulations is to scale the partial charges
| (7) |
Fig. 1. Correlation between polarizable simulation and their scale factors.
Seff (black full circle) is based on the reduction of Coulombic interaction between non-polarized (non-scaled) and the polarized system. S∈∞ (gray circles) is computed by . The charge-reduced simulation with a scaling factor of Seff = 0.90, 0.85, 0.80 and 0.74 correspond to a polarizable system with 39.4%, 58.6%, 77.9% and 100% polarizability, respectively.
In more sophisticated models, the screening factor 1/∈eff(R) for the Coulomb interaction varies with the distance R between the two interacting charges. A good review concerning these methods and polarizability is given in Ref. 50.
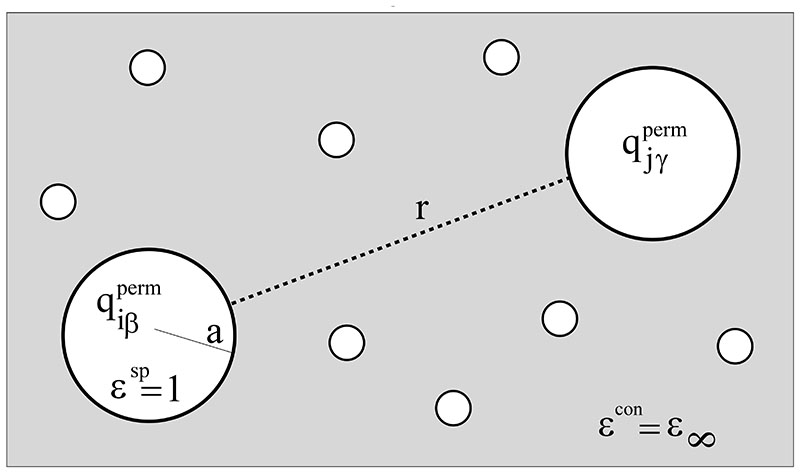
In a recent study,49 we have interpreted the polarizability as “inner solvent” or “lubricant”. This picture can be rationalized by simplifying the set of induced dipoles to a dielectric continuum as schematically displayed in Fig. 2. Here, the atomic charges are enclosed in spherical cavities of radius a in an otherwise homogeneous dielectric continuum of ∈con = ∈∞. This immersion of the permanent charges into a dielectric continuum certainly changes their interaction. As shown in detail in the Appendix the continuum solvent model leads to a modified Coulomb interaction of
| (8) |
Fig. 2.
Schematic view of the interaction between the ions. Each atom iβ is approximated by a sphere with radius a. The dielectric constant inside the sphere ∈sp is one, outside the sphere ∈con equals ∈∞. In other words, the spherical atom with its partial charge is immersed in a dielectric continuum with ∈∞. For further details the reader is referred to the Appendix.
The second term in this equation represents the solvation energy of the permanent charges by the continuum solvent. As it is independent of the atomic coordinates it does not influence the structure and dynamics. The scaling of the permanent charges by the optical dielectric constant ∈∞ was also found by Leontyev et al. in a similar approach using the free energy.58 For practical purposes in the trajectory production, this screened Coulomb potentials may be also represented by a scaling factor
| (9) |
gained from the Clausius-Mosotti type equation (12) prior to simulation. The so-obtained scaling factor are shown as gray circles in Fig. 1. They are slightly lower than the effective scaling factors from perturbation theory confirming the above made considerations of an “inner solvent”.
It is important to note that the down scaling of the charges in the electronic continuum model should only affect the electrostatic interaction (c.f. Eq. (8)) but not the net charges of the cations and anions which should be still ±1 e. Therefore, the scaling down during the production of the trajectory data is undone for the analysis, i.e. dipole moments and current contributions are multiplied by the inverse of the scaling factor. However, the continuum solvent model treated in detail in the Appendix rest upon the assumption that the permanent charges are highly diluted. In other words, the spherical radius a should be much smaller than the distance r between two charges. This was already pointed out by Marcus.60 Therefore, we expect substantial defects of the scaled charge model at short distances and a possible better performance on a global scale. Representative for the short distance interactions, we will analyze local dipole moments of the imidazolium ring C-H groups in the Result section. The discussion will be supported by atom-atom radial distribution functions. On a more coarsed-grained (i.e. molecular) level, the discrepancies between charge-scaling and polarizability will be revealed in terms of the molecular dipole moments characterized by the orientational correlation function g110(r) and the rotational relaxation constant rot.
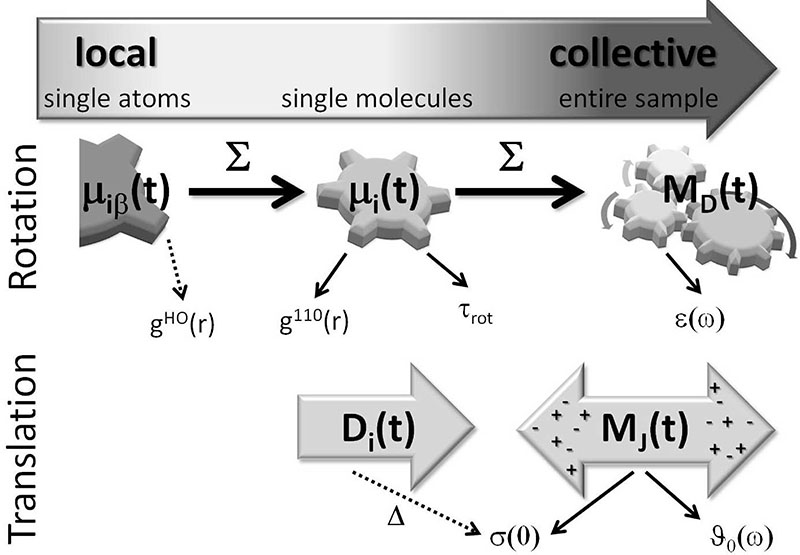
The comparison between charge-scaled and polarizable simulations at the macroscopic level is performed for dielectric properties, e.g. the conductivity σ(0) as well as dielectric permittivity ∈(ω) and dielectric conductivity ϑ0(ω). A sketch of the different levels of resolution of our analysis is given in Fig. 3.
Fig. 3.
The characterization of the force fields can be performed on different levels of resolution, from local interactions of single atoms to collective properties of the entire sample. It is expected that the coincidence between the scaled charge and the polarizable model gets better when moving from local to collective properties.
C. General computational dielectric theory
Experimental studies are performed at the macroscopic, collective level. Therefore, one needs a computer-adapted theory to link both worlds. The macroscopic analogue of Coulomb interactions are dielectric properties.61 In particular, the electrostatic forces Fiβ acting on atom iβ correspond to the macroscopic Maxwell field E, while the atomic dipoles μiβ correspond to the dielectric polarization Ptot. For weak electronic fields the polarization is a linear function of the Maxwell field:
| (10) |
The corresponding susceptibility ∑*(ω) is called generalized dielectric constant (GDC).
While Eq. (10) refers to a situation of an applied field, the GDC may be computed from an equilibrium simulation by means of Linear response theory:62,63
| (11a) |
| (11b) |
Here, the dielectric constant at optical frequencies, ∈∞, represents the very fast electronic contributions. The respective macroscopic polarizability can be approximated quite well by an expression involving the sum of atomic polarizabilities
| (12) |
with .
Dielectric polarization caused by the motion of nuclei or induced dipole moment μiβ is described by the Fourier-Laplace transform of the auto-correlation function of the total collective dipole moment Mtot (t) which is defined by
| (13a) |
| (13b) |
Eq. (13a) decomposes the total collective dipole moment into non-polarizable (depending on the atomic coordinates) and polarizable contributions.45,47,49 Furthermore, the non-polarizable contribution of the atoms can be split up into an ro-vibrational collective dipole moment and collective translational dipole moment MJ(t).64–67 As pointed out in Ref. 49 both, and , decay multi-exponentially. Therefore, these two collective dipole moments may be combined to a non-translational dipole moment which determines the dielectric permittivity ∈(ω)
The remaining collective translational dipole moment MJ(t) depends on the translational motion of the center-of-mass of the charged molecules and is responsible for the dielectric conductivity ϑ(ω) given by ϑ(ω) = 4πiσ(ω)/ω. The common conductivity σ(ω)
| (14) |
is usually expressed in terms of the current which is the time derivative of the collective translational dipole moment. The value of the static conductivity σ(0) can be computed by the integral above at zero frequency or by the collective dipolar displacement
| (15) |
after the initial correlations have levelled off.47,64 Both methods, i.e. Green-Kubo approach in Eq. (14) or Einstein-Helfand method in Eq. (15), should yield the very same σ(0). This value is often compared to the Nernst-Einstein equation
| (16) |
in which the parameter Δ characterizes the discrepancy between unhampered conductive motion of the ions and correlated ion motion, e.g. ion cage effects.47
III. Methods
This work focuses on the comparison of charge-scaled and polarizable simulations of 1-ethyl-3-methylimidazolium trifluoromethanesulfonate (EMIM+OTf–). Therefore, we performed several completely independent molecular dynamics simulations of 1000 ion pairs at 300 K with CHARMM68 in a cubic box with a box length of 67.195Å under periodic boundary conditions for a simulation period of at least 35 ns with a time step of 0.5 fs on the basis of the classical force field of Pádua et al.29,69,70 The partial charges are changed to the values reported by Hanke et al. in Ref. 31 for an improved reproduction of the experimental viscosity.17,66,67
The completely independent non-polarizable simulations were performed with charge-scaling factors Seff of 1.00, 0.90, 0.85, 0.80 and 0.74 applied to all partial charges of the cations and anions. The polarizable simulation used the original partial charges. 31 The induced dipoles were modeled by the so-called “Drude oscillators” with an uniform Drude charge qδ = -1.0 e and a Drude mass of mδ = 0.1 amu which was subtracted from the mass of the corresponding atom.43,48 The atomic polarizabilities αiβ were taken from Ref. 71. Drude particles are thermostated at 1 K to ensure the proximity to self-consistency. A more detailed description of the computational setup was given in Ref. 45 and 49.
Besides the force field all simulations were treated in the same way: Only bonds including a hydrogen were kept fixed by the SHAKE algorithm.72 Non-bonded and image lists were updated heuristically using a 16 Å neighbour list distance. Lennard-Jones energies and forces were smoothly switched off between 11 and 12 Å. The electrostatic forces were computed by the Particle-Mesh-Ewald technique.73,74 The “cutoff” for the real-space part interactions was 12 Å and the damping constant for the reciprocal-space interactions was 0.410 Å–1. The grid spacing equaled 1.05 Å and a sixth-order spline interpolation of the charge to the grid was used.
IV. Results And Discussion
A. From atomic to collective dipole moments
Using the scaled charges of the simulation for the analysis too would pull down all dipole moments and currents. To cope with this problem, one may interpret the screening solvent model as a device to weaken the interaction between permanent charges while at the same time using their full strength for analysis.58 For example, the atomic dipole may be approximated by (Seff)−1. with the dipole computed by scaled charges calculated with respect to the center-of-mass ri of the molecule i.
The ring of the imidazoliums is the most active site in ionic liquids. Therefore, we start here the comparison between the non-polarizable (with the original and scaled partial charges) and the polarizable system. In order to simplify the juxtaposition we merge μiβ of the ring hydrogens with μiβ of their attached carbons to a “united” dipole moment of this reaction site.
| (17) |
Since this dipole moment is evaluated for a charged moiety, we choose the center of mass ri of the respective molecule as reference site. This has the advantage that all atomic dipoles, μiβ, may be summed up to a molecular dipole, μi, or even further to a collective non-translational dipole moment MD.
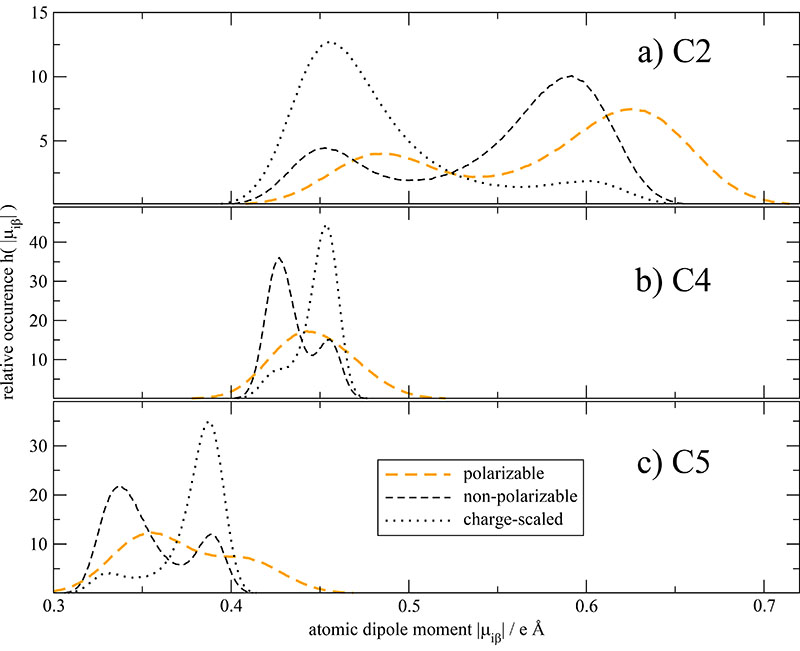
The distribution of the strength of the “united” dipoles of the three imidazolium carbons is given in Fig. 4a-c for the 100%-polarizable (orange curves), the corresponding charge-scaled (black dotted curves) and the non-polarizable, non-scaled system (black dashed lines). The relative occurrence in the histograms is normalized such that ∫ h(|μiβ|)d|μiβ| = 1 in order to facilitate the comparison. In all three sub-figures the dipolar distribution of the polarizable dipoles is much broader and smoother compared to the two non-polarized systems. In case of the non-polarizable systems (black lines), the position of the two distinct maxima for each “united atom” seem to be very similar but the respective amplitudes have reversed their height. A possible explanation of this reversal may be a shift of the center-of-mass which, due to the rigidity of the ring, is caused by a rotation of the side chain. In other words, the different amplitudes may be caused by a different probability of dihedral angles in the side chain. This change in probability may be due to a modified torsional barrier height caused by the reduction of the permanent charges of the terminal atoms in the dihedral angle. The induced dipoles may also alter the torsional barrier height, but the effect of these induced dipoles itself is much more complex. In case of C4 the two maxima merge to a broad single peak but no real shift in Fig. 4b is observed. The united dipole distribution of C5 shows a peak-should structure in Fig. 4c with a slight shift to higher dipole moments. The strongest shift for all atoms in the system is observed for the C2-carbons in Fig. 4a. This should go along with a higher activity of this moiety. As this site is usually claimed to be involved in hydrogen bonding the scaled charge model undermines this possibility by uniformly reducing Coulomb interactions. This was also observed by Hardacre et al.75
Fig. 4. Histogram of united dipole moments of the imidazolium carbons and their respective hydrogens.
Please note, that the charge-scaled dipole moments are multiplied by (Seff)−1 for the analysis with Seff = 0.74.
So far we have resolved the electric anisotropy of the molecular ions at the level of “atomic” dipoles. At lower resolution one might consider the molecular dipole moments comprising the sum of all atomic dipoles of a molecule
| (18) |
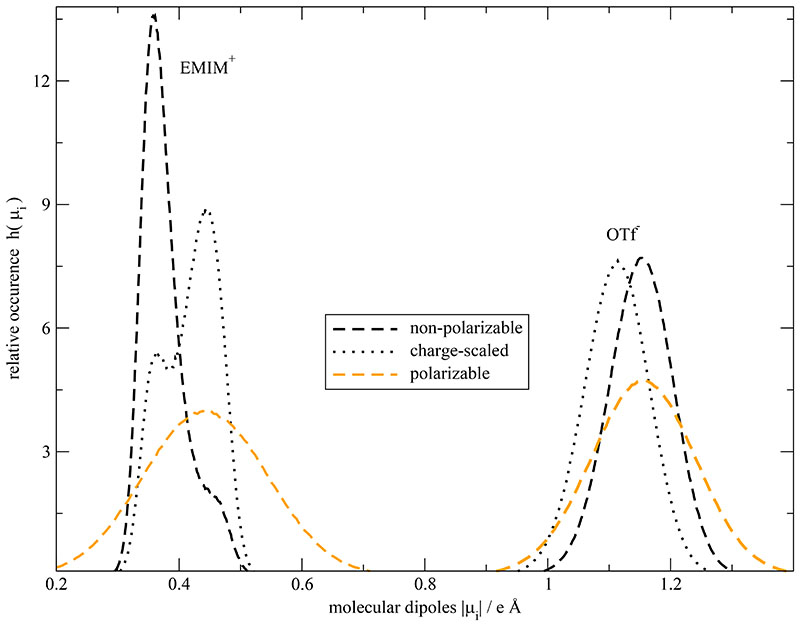
At first sight, atomic and molecular dipoles seem to be of comparable strength in Fig. 5. In order words, there must occur a strong compensation of atomic dipole moments which demonstrates the high electric anisotropy in imidazolium based ionic liquids. Nevertheless, the diversity of molecular dipolar strength is considerably enlarged by the inclusion of polarizability as already found on the atomic level. On the contrary, both non-polarized systems (black lines) show a narrowed distribution with the typical peak reversal. However, we emphasize that the dipole distribution of the scaled systems was obtained by an up-scaling with (Seff)−1. In case of EMIM+ the mean value of the scaled dipole distribution shows an outward shift similar to that of the induced distribution. In case of OTf− a synchronous inward shift is observed. However, the scaled dipoles overestimate this shift.
Fig. 5.
Histogram of molecular dipole moments μi of EMIM+ and OTf− for the 100% polarizable, non-polarizable and charge-scaled (Seff=0.74) simulations. Please note, that the charge-scaled dipole moments are multiplied by (Seff)−1 for the analysis.
B. Molecular packing and orientational order
While the dipolar distribution discussed above describe intramolecular effects, the classical tool to analyze intermolecular structural effects are radial distribution functions g000(r) and their generalizations.76,77 The atom-atom radial distribution function between the H2 imidazolium ring hydrogen and the oxygens of the triflate is depicted in Fig. 6 for the non-polarizable, polarizable and charge-scaled system. With respect to the non-polarizable system, the height of the first maximum at 4.1 Å is increased for the polarizable system and decreased for the charge-scaled system. This leads to a slightly lower number of coordinating triflate oxygens. For example, the difference of the running integral 1 + 4 πρ ∫ gHO (r)r2dr between the polarizable and charge-scaled system at the gHO(r)-intersection at 4.7 Å is 0.45.
Fig. 6.
Atom-atom radial distribution function gHO(r) between the H2 of the imida-zolium ring and the oxygens of the triflate. The inset corresponds to the number of contacts between the hydrogen H2 and oxygens.
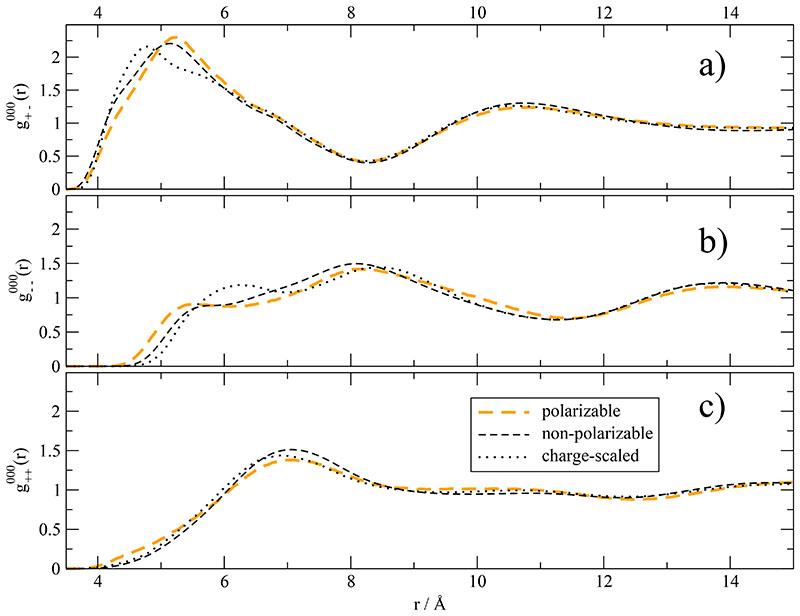
The discrepancies between the charge-scaled and the polarizable cation-anion structure sustain at the molecular level below 6 Å as visible in Fig. 7a. Polarizable and non-polarizable ( r ) have their first maxima at 5.2 Å whereas the maximum of charge-scaled cation-anion radial distribution is shifted inwards by 0.4 Å. Nevertheless, the running integral up to the first minimum at 8.2 Å (which approximates the coordination number in the first shell) yields 8.7 in all three simulations. This is in fair agreement with the coordination number of 8.0 determined by Voronoi tesselation.47
Fig. 7. Mutual radial distribution function g000(r).
Changes in electrostatic forces affect the anion–anion spatial correlations in Fig. 7b below 8 Å. Apart from a hardly discernible elevation in the polarizable system at very short distances, all ( r ) almost coincide in Fig. 7c. It seems that the cation-cation contacts are determined by steric packing, i.e. by Lennard-Jones forces, in particular, by the packing of the side chains.78
Comparing all three g000(r) simultaneously, the inclusion of polarization produces a slight outward shift for unlike charges and a slight inward shift for like charges, in particular for the anion–anion distribution. The scaled charge model goes the opposite direction: Unlike charges get closer at distances below 5 Å while the mutual repulsion of anions is slightly enhanced as visible in the shifted peak at 6 Å in Fig. 7c. This anion-anion repulsion shift to higher distances with decreasing partial charges is also visible for 1,3-dimethylimidazolium chloride.75 This again points to the delocalized nature of Coulomb interaction in ionic liquids. If Coulomb interaction were localized a scaling down of charges would result in a lower attraction of unlike charges and one would expect a favouring of larger distances. Overall, system based on full permanent charges (dashed lines in Fig. 7) stay close together whether polarization effects are included or not. Charge scaling on the other hand results in stronger effects in the wrong direction. These goes along with the theoretical considerations viewing charge scaling as the immersion of the permanent charge distribution in a continuum solvent of optical dielectric constant ∈∞. From this continuum model one expects a break down of charge screening or scaling the shorter the distance. In fact, the curves shown in Fig. 7 confirm this view since the deviations between the different simulations disappear for distances longer than 8 Å. Small deviations below that value were also reported for imidazolium tetrafluoroborates.57 Youngs et al. could show that the charge scaling factor destroys the fine structure of g000(r) of 1,3-dimethylimidazolium chloride below 6 Å.75
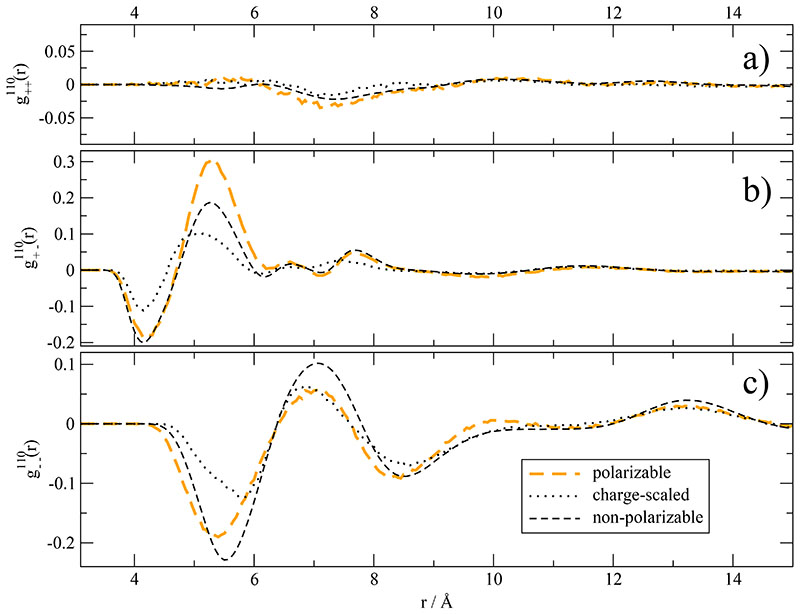
While the translational ordering can be described by g000 (r)-functions, the orientational structure is elucidated by functions like g110(r) describing the mutual orientation of molecular dipoles.9,76,77 The inclusion of polarization sharpens orientational correlations between cation and anion between 5 and 6 Å visible in Fig. 8b. Charge scaling flattens the orientational structure of cation–anion as well as anion-anion. This points to general slacking or relaxation of orientational structure caused by charge scaling and should be also visible in the orientational times discussed below. Again, the situation for the polarizable system is complex. While cation-anion orientation is sharpened, anion–anion is flattened. This might be explained by the strong interaction of the induced dipoles of the imidazoliums with the permanent dipoles of the anions.49 Again, the discrepancies between the different simulation methods can be seen only below distances of 8 Å.
Fig. 8. Mutual orientational correlation function g110(r).
C. Single particle dynamics
Since all orientational correlation functions are flattened in case of the scaled charges, one would expect an enhanced rotational dynamics. In the orientational correlation functions g110(r) the radial distribution function g000(r) was weighted with an averaged cosine between the molecular dipoles:
| (19) |
Now, the rotational dynamics are characterized by an auto-correlation function of the molecular dipole moment . These correlation functions were fitted multi-exponentially. An average relaxation time can be determined by
| (20) |
Fig. 9 compares the average rotational relaxation time of the polarizable and charge-scaled simulations. In both cases, results are given as a function of the degree of polarizability. For the charge-scaled systems the scaling factor was converted to an effective polarizability using the linear relationship given in Fig. 1.
Fig. 9.
Single particle rotation constants for cations (a) and anions (b) in case of the 100% polarizable simulation and scaled charges (Seff = 0.74).
The curves for the cations in Fig. 9a have the striking feature that charge-scaling stronger accelerates the rotation of the imidazoliums compared to the polarizability. The acceleration from 0% to 100% polarizability is 2.3 and 6.4, respectively. In both cases, however, decays monotonically. This changes for the anions. In the polarizable system the decay is again monotonous with an acceleration of 1.8 and, hence, comparable to the acceleration of the cations. For the charge-scaled system, however, a sigmoidal curve is found in Fig. 9b with an overall acceleration of 4.6. To our knowledge, the logistic function is the simplest way to model sigmoidal behaviour. These functions occur in a diversity of fields from chemical kinetics to economic and social sciences. In our case it may be interpreted by the interplay of single particle motion in a cage of neighbours. The coupling between a molecule and its surrounding cage is quite strong in ionic liquids.47,49 This can be compared to an auto-catalytic process: The acceleration of the single particle by changing molecular interactions slackens the cage which, as a feedback, accelerates the single particle. For small interaction changes the feedback is modest and the corresponding response function almost flat. This region is called induction period. Once the feedback has exceeded some threshold, a strong acceleration is observed in the vicinity of the turning point until it finally levels off. In our case, the rotation in the saturation region is dominated by the still active Lennard-Jones forces after the elimination of electrostatic forces by too strong down-scaling.
| (21) |
A simultaneous fit of all in Fig. 9a-b by a logistic function results in the parameters of Table I. Except for the charge-scaled OTf− the very same k and α0 can be used. In our case, the α0’s, which mark the turning point of the logistic function, are zero. The turning point of the charge-scaled OTf− is around 62% polarizability. Since the α0-values are below 100%, is already characterized by saturation. In other words, one would not expect the orientational relaxation times to decrease much lower. For example, the asymptotic value A0 +A for polarizable EMIM+ is 1.75 ns as compared to the 100%-value of 2.0 ns. The stronger acceleration of the charge-scaled EMIM+ compared to the polarizable one is reflected by a higher amplitude A. Apart from the actual values, Fig. 9b gives direct evidence that polarizable and charge-scaled systems differ not only quantitatively, but show a qualitative different behaviour.
Table I.
Fit of the rotational relaxation constants, and diffusion coefficients, D+ and D-, as well as the static conductivity σ(0) with a logistic function in Eq. (21) as a function of degree of polarizability.
| , | A0 [ns] | A [ns] | k | α0 [%] |
| D+,D– | A0 / 10–7 cm2 s | A / 10–7 cm2 s | k | α0 [%] |
| σ(0) | A0 / S m–1 | A / S m–1 | k | α0 [%] |
The collective translational dipole moment MJ(t) was not scaled by (Seff)–1 in the analysis of the dipolar mean-squared displacement corresponding to Eq. (15).
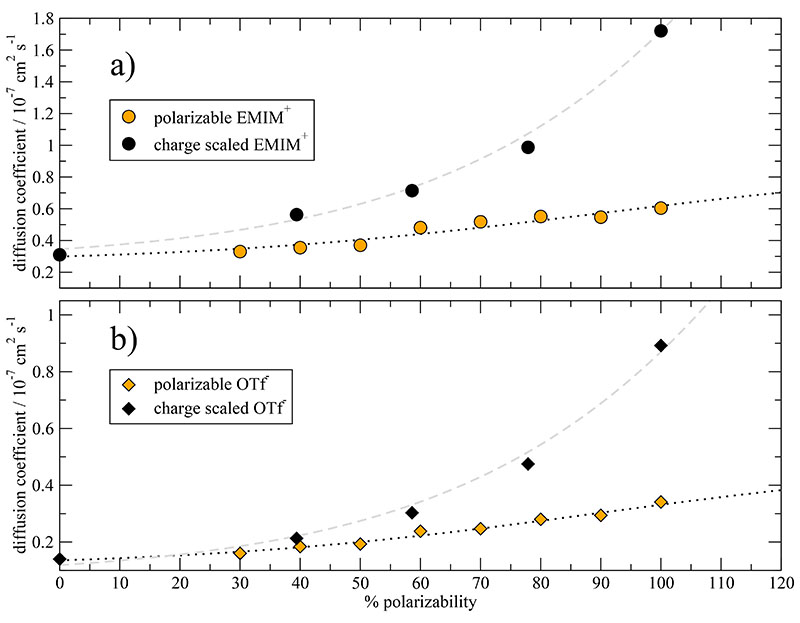
The modeling with logistic functions also works quite well for the translational motion, i.e. for the diffusion coefficients. Thereby, the very same k-value = 0.030, already used for the rotational motion, can be retained. Moreover, cations and anions have the same turning point α0, but they differ between polarizable and charge-scaled systems. This is not specific to the present system, but can be also applied to the data of Ref. 75 and 56. The corresponding fits and fit parameters can be found in the supplementary material. The sigmoidal behaviour is even more pronounced in these cases. The parameters for the diffusion coefficients of polarizable and charge-scaled EMIM+OTf– can be found in Table I. According to the turning points α0=89.3% and 156.3%, the full polarizable system is beyond the turning point and has thus already reached the saturation region. The charge-scaled system (Seff=0.74), however, is still in the acceleration phase. This is different to the behaviour of EMIM+OAc− of Ref. 56. There, the diffusion coefficients have more or less reached the saturation period for charge scaling factors Seff around 0.7.
However, the diffusion coefficients of the anions and cations are overall much larger in case of the charge-scaled simulations. This is also observed for GeO2.59 One reason for this behaviour may be the immoderate softening of the ion cage due to charge reduction. The disintegration of the ion cage is made visible by three-dimensional probability distributions in Ref. 75 and can also be deduced from the radial distribution function gHO (r) in Fig. 6. It seems that in case of the charge-scaled anions this cage disintegration leads to an immoderate increase of the molecular rotation as depicted in Fig. 9b. This effect may be suppressed for the charge-scaled imidazoliums since cationic cages consist of a more or less equal number of cations and anions.47 Here, the reduced attraction of the anionic neighbours with the central imidazolium may be compensated by a reduced repulsion of the cationic neighbours.
D. Collective dynamics
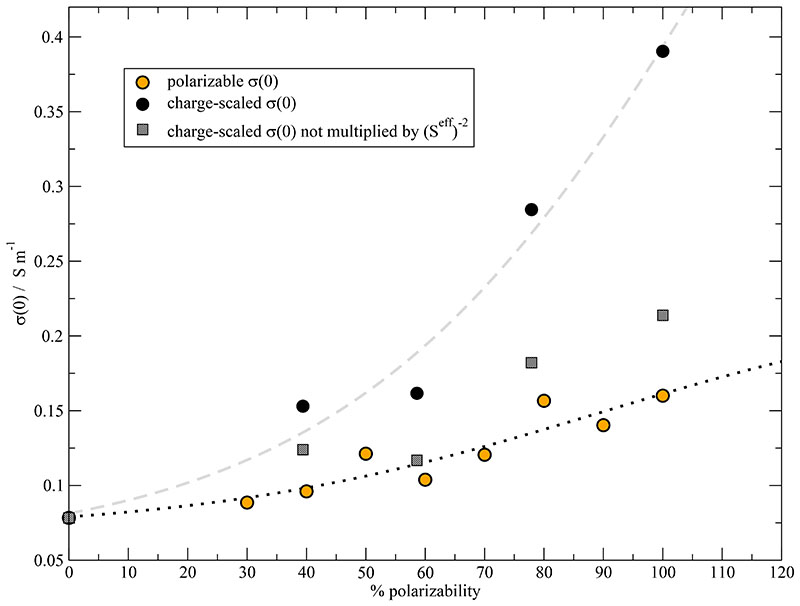
The logistic function in Eq. (21) describes the raise of the static conductivity σ(0) as a function of increasing degree of polarizability with the parameters in Table I. Interestingly, the k-value and the turning point α0 of the fit of the diffusion coefficients can be used again for the static conductivity. If one scales σ(0), as suggested by the electric continuum model, the k-value of 0.030 remains unchanged but the turning point has shifted to lower values. The fits of the polarized system (black dotted line) and the charge-scaled system (gray dashed line) are depicted in Fig. 11.
Fig. 11.
Static conductivity σ(0) as a function of polarizability. The black circles represent the σ(0) values multiplied by (Seff)-2 as suggested by the electric continuum model.
The discrepancy between the static conductivities of the charge-scaled systems and the polarizable system is mainly due to the post-simulational charge-scaling with (Seff)−2. If one computes the static conductivity with the reduced charges unchanged (gray boxes), the charge reduction is more or less compensated by the increased dynamics as visible by the higher diffusion coefficients in Fig. 10. This can be interpreted as a flaw of the electric continuum model: In the Nernst-Einstein equation in Eq. (16), the Δ-parameter describes the amount of cross-correlation between the motions of the ions. However, a decreasing scaling factor Seff leads to larger Δ-values which would indicate stronger interactions between the ions. Thus post-simulational charge-scaling causes an inconsistency because the charge scaling factor Seff should reduce attractive as well as repulsive Coulombic interactions. In case of the polarizable systems, the Nernst-Einstein Δpol ≃ 0.18 is almost constant.
Fig. 10.
Diffusion coefficients for cations (a) and anions (b) in case of the 100% polarizable simulation and scaled charges (Seff = 0.74).
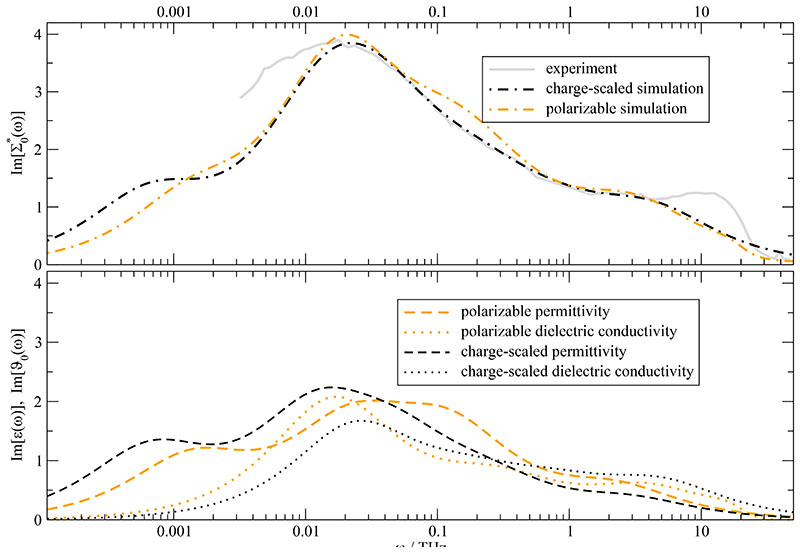
The electronic continuum model should work best on the macroscopic level since most of the distances r are much larger than the ion sphere with the radius a (c.f. Fig. 2). Indeed, the imaginary part of the generalized dielectric constant of the charge-scaled system (Seff=0.74) coincides almost perfectly with the corresponding curve of the 100% polarizable systems. Please note that the charge-scaled dielectric properties have been scaled by (Seff)−2 for the analysis as suggested by the electronic continuum model.
However, this perfect agreement is only true for the generalized dielectric constant. Its components, i.e. the dielectric permittivity ∈(ω) and dielectric conductivity ϑ0(ω), shown at the bottom of Fig. 12 differ to some extent. Nevertheless, the agreement of the polarizable dielectric conductivity and the charge-scaled dielectric conductivity is more than fair, if one takes into account that the respective static conductivities differ by a factor of 2.4. This indicates the different characteristics of the dielectric conductivity on the one side and the electric conductivity on the other side. 67 In principle, the different behaviour of charge-scaling and polarizable effects influences not only the zero-frequency limit of the conductivity σ(0) but the complete conductivity spectrum σ(ω). In practise, however, the subtraction of the static value when calculating the dielectric conductivity in Eq. (22) seems to eliminate most of this influence.
| (22) |
Fig. 12.
Dielectric loss spectrum of EMIM+OTf−. Experimental and simulated spectra agree well. Note that the charge-scaled spectra (Seff=0.74) were multiplied by (Seff)−2 as suggested by the electric continuum model.
The permittivity of the polarizable system is slightly shifted to higher frequencies compared to the charge-scaled system. This corresponds to an overall faster collective rotational relaxation of the polarizable system. Since the respective single particle rotation is slower compared to the charge-scaled system by a factor of 2.7, strong collective effects induced by the polarizabilities have to accelerate the collective rotation. This effect is of indirect nature since the correlation function contributes only to a minor degree to .49 In fact, it is the overall acceleration of dynamics by polarizable forces that speeds up the rotation of the collective, permanent dipoles. In terms of the toothed-wheel and gear mechanism in Fig. 3 the different behaviour of the charge-scaled and the polarizable systems can be easily interpreted: The “charge-scaled” toothed-wheels, i.e. the charge-scaled molecular dipoles μi, are less interconnected and rotate fast in a soft ion cage. Although a single “polarizable” toothed-wheel rotates slower compared to the charge-scaled one, the better interconnection of meshed “polarizable” toothed-wheels in the total system yields an overall slightly faster rotation of the collective rotational dipole moment MD(t).
V. Conclusion
As already expected from theoretical considerations, the performance of the scaled charge model ranges from poor on a very local level to excellent on the collective level. Pure down-scaling of partial charges cannot reproduce broad dipolar distributions gained from the polarizable simulations. In particular, the activity of the C2-H2-group of the imidazolium ring, which is important for strong interaction with the anions, suffers from the reduced charges. The discrepancies between the charge-scaled model and the polarizable system are also present in the radial distribution functions below distances of 8 Å but vanishes for longer distances. When discussing the different behaviour of charge scaling and polarization forces at different length scales one should make clear that induction forces, e.g. charge-dipole and dipole-dipole interactions, lead to an effective r-dependence of r–3 and r–6 while charge scaling changes the strength of the Coulomb forces at all distances but keeps the r−1 dependence. As a consequence, polarization effects have the strongest influence on the immediate neighbourhood of a molecular ion. Since single particle rotation of the cations and anions as well as their diffusion critically depend on the nearest neighborhood, i.e. the ion cage, the different structure leads to large deviations in the mean rotational relaxation time and the diffusion coefficients. However, all these properties can be represented by logistic functions as a function of the degree of polarizability. This can be interpreted in terms of feedback effects. A screened interaction of a central ion with its cage leads to a weakened cage structure which in its turn allows a higher mobility of the central ion and weakens its interaction with the cage. The logistic functions can be extended to the values of the static conductivity.
On the collective level, the charge-scaled model is capable to reproduce the frequency dependent generalized dielectric constant. For this excellent agreement with the result from the polarizable simulation, the dielectric properties have to be scaled by (Seff)−2. This scaling can be justified by a electronic continuum model. The dielectric permittivity from the polarizable simulation is slightly shifted to higher frequencies indicating a faster rotational relaxation on the collective level compared to the charge-scaled simulations. Therefore, induced effects have strong impacts on collective networks.
Altogether, scaled-charge models do not represent an average polarizability, in particular the discrepancies on the local level are very large. Consequently, they have to be seen as an additional force field parameter which is very effective in increasing diffusion coefficients. Since common force fields usually yield too low values for the transport properties, scaling factors may help here. For more sophisticated studies, in particular if local interactions are very important, polarizable simulations might do a better job.
Supplementary Material
Acknowledgments
The author wants to thank Othmar Steinhauser for very fruitful discussions and his continous and committed support. The computational work was performed on the “Vienna Scientific Cluster” of the University of Vienna, the Vienna University of Technology, and the University of Natural Resources and Applied Life Science Vienna. We thank for generous allocation of computer time. This work was supported by Project No. P23494 of the FWF Austrian Science Fund.
References
- 1.Keblinski P, Eggebrecht J, Wolf D, Phillpot SR. J Chem Phys. 2000;113:282. [Google Scholar]
- 2.Del Pópolo MG, Voth GA. J Phys Chem B. 2004;108:1744. [Google Scholar]
- 3.Bhargava BL, Klein ML, Balasubramanian S. Chem Phys Chem. 2008;9:67. [Google Scholar]
- 4.Xiao D, Hines LG, Jr, Li S, Bartsch RA, Quitevis EL, Russina O, Triolo A. J Phys Chem B. 2009;113:6426. doi: 10.1021/jp8102595. [DOI] [PubMed] [Google Scholar]
- 5.Hardacre C, Holbrey JD, McMath SEJ, Bowron DT, Soper K. J Chem Phys. 2003;118:273. [Google Scholar]
- 6.Morrow TI, Maginn EJ. J Phys Chem B. 2002;106:12807 [Google Scholar]
- 7.Shah JK, Brennecke JF, Maginn EJ. Green Chem. 2002;4:112. [Google Scholar]
- 8.Liu Z, Huang S, Wang W. J Phys Chem B. 2004;108:12978 [Google Scholar]
- 9.Schröder C, Rudas T, Steinhauser O. J Chem Phys. 2006;125:244506. doi: 10.1063/1.2404674. [DOI] [PubMed] [Google Scholar]
- 10.MacFarlane DR, Golding J, Forsyth S, Forsyth M, Deacon GB. Chem Commun. 2001:1430. [Google Scholar]
- 11.Huddleston JG, Visser AE, Reichert WM, Willauer HD, Broker GA, Rogers RD. Green Chem. 2001;3:156. [Google Scholar]
- 12.Bagno A, D’Amico F, Saielli G. J Mol Liquids. 2007;17:131–132. [Google Scholar]
- 13.Siqueira LJA, Ribeiro MCC. J Phys Chem. B. 2007;111:11776. doi: 10.1021/jp074840c. [DOI] [PubMed] [Google Scholar]
- 14.Schröder C, Wakai C, Weingärtner H, Steinhauser O. J Chem Phys. 2007;126:084511. doi: 10.1063/1.2464057. [DOI] [PubMed] [Google Scholar]
- 15.Pioćalek J, Kolafa J. J Mol Liquids. 2007;134:29. [Google Scholar]
- 16.Maginn EJ. Acc Chem Res. 2007;40:1200. doi: 10.1021/ar700163c. [DOI] [PubMed] [Google Scholar]
- 17.Schröder C, Steinhauser O. J Chem Phys. 2008;128:224503. doi: 10.1063/1.2929848. [DOI] [PMC free article] [PubMed] [Google Scholar]
- 18.Breneman CM, Wiberg KB. J Comput Chem. 1990;11:361. [Google Scholar]
- 19.Bühl M, Chaumont A, Schurhammer R, Wipff G. J Phys Chem B. 2005;109:18591. doi: 10.1021/jp0518299. [DOI] [PubMed] [Google Scholar]
- 20.Hardacre C, Holbrey JD, Mullan CL, Nieuwenhuyzen M, Youngs TGA, Bowron DT, Teat SJ. Phys Chem Chem Phys. 2010;12:1842. doi: 10.1039/b921160h. [DOI] [PubMed] [Google Scholar]
- 21.Cremer T, Kolbeck C, Lovelock KRJ, Paape N, Wölfel R, Schulz PS, Wasserscheid P, Weber H, Thar J, Kirchner B, et al. Chem Eur J. 2010;16:9018. doi: 10.1002/chem.201001032. [DOI] [PubMed] [Google Scholar]
- 22.Stone AJ, Alderton M. Mol Phys. 1985;56:1047. [Google Scholar]
- 23.Cornell WD, Cieplak P, Bayly CI, Kollman PA. J Am Chem Soc. 1993;115:9620. [Google Scholar]
- 24.Hunt PA, Gould IR, Kirchner B. Aust J Chem. 2007;60:9. [Google Scholar]
- 25.Bhargava BL, Balasubramanian S. J Chem Phys. 2007;127:114510. doi: 10.1063/1.2772268. [DOI] [PubMed] [Google Scholar]
- 26.Schmidt J, Krekeler C, Dommert F, Zhao Y, Berger R, delle Site L, Holm C. J Phys Chem B. 2010;114:6150. doi: 10.1021/jp910771q. [DOI] [PubMed] [Google Scholar]
- 27.Dommert F, Schmidt J, Krekeler C, Zhao YY, Berger R, delle Site L, Holm C. J Mol Liquids. 2010;152:2. doi: 10.1039/b917803c. [DOI] [PubMed] [Google Scholar]
- 28.Margulis CJ, Stern HA, Berne BJ. J Phys Chem B. 2002;106:12017 [Google Scholar]
- 29.Canongia JN, Deschamps Lopes J, Padua AAH. J Phys Chem B. 2004;108:2038. [Google Scholar]
- 30.de Andrade J, Böes ES, Stassen H. J Phys Chem B. 2002;106:13344 [Google Scholar]
- 31.Hanke CG, Price SL, Lynden-Bell RM. Mol Phys. 2001;99:801. [Google Scholar]
- 32.Urahata SM, Ribeiro MCC. J Chem Phys. 2004;120:1855. doi: 10.1063/1.1635356. [DOI] [PubMed] [Google Scholar]
- 33.Kohagen M, Brehm M, Thar J, Zhao W, Muoller-Plathe F, Kirchner B. J Phys Chem B. 2011;115:693. doi: 10.1021/jp109612k. [DOI] [PubMed] [Google Scholar]
- 34.Rick SW, Stuart SJ, Berne BJ. J Chem Phys. 1994;101:6141. [Google Scholar]
- 35.Jiang W, Wang Y, Yan T, Voth GA. J Phys Chem C. 2008;112:1132. doi: 10.1021/jp710653g. [DOI] [PubMed] [Google Scholar]
- 36.Chang T-M, Dang LX. J Phys Chem A. 2009;113:2127. doi: 10.1021/jp809132w. [DOI] [PubMed] [Google Scholar]
- 37.Borodin O. J Phys Chem B. 2009;113:11463. doi: 10.1021/jp905220k. [DOI] [PubMed] [Google Scholar]
- 38.Bedrov D, Borodin O, Li Z, Smith GD. J Phys Chem B. 2010;114:4984. doi: 10.1021/jp911670f. [DOI] [PubMed] [Google Scholar]
- 39.Yan T, Wang Y, Knox C. J Phys Chem B. 2010;114:6886. doi: 10.1021/jp908914d. [DOI] [PubMed] [Google Scholar]
- 40.Yan T, Wang Y, Knox C. J Phys Chem B. 2010;114:6905. doi: 10.1021/jp9089112. [DOI] [PubMed] [Google Scholar]
- 41.Yu H, Hansson T, van Gunsteren WF. J Chem Phys. 2003;118:221. [Google Scholar]
- 42.Lamoureux G, Roux B. J Chem Phys. 2003;119:3025. [Google Scholar]
- 43.Anisimov VM, Lamoureux G, Vorobyov IV, Huang N, Roux B, MacKerell AD. J Chem Theory Comput. 2005;1:153. doi: 10.1021/ct049930p. [DOI] [PubMed] [Google Scholar]
- 44.Harder E, Anisimov VM, Vorobyov IV, Lopes PEM, Noskov SY, MacKerell AD, Jr, Roux B. J Chem Theory Comput. 2006;2:1587. doi: 10.1021/ct600180x. [DOI] [PubMed] [Google Scholar]
- 45.Schröder C, Steinhauser O. J Chem Phys. 2010;133:154511. doi: 10.1063/1.3493689. [DOI] [PMC free article] [PubMed] [Google Scholar]
- 46.Geerke DP, van Gunsteren WF. J Chem Theory Comput. 2007;3:2128. doi: 10.1021/ct700164k. [DOI] [PubMed] [Google Scholar]
- 47.Schröder C. J Chem Phys. 2011;135 doi: 10.1063/1.3601750. [DOI] [PMC free article] [PubMed] [Google Scholar]
- 48.Harder E, Anisimov VM, Whitfield T, MacKerell AD, Jr, Roux B. J Phys Chem B. 2008;112:3509. doi: 10.1021/jp709729d. [DOI] [PMC free article] [PubMed] [Google Scholar]
- 49.Schröder C, Sonnleitner T, Buchner R, Steinhauser O. Phys Chem Chem Phys. 2011;13:12240. doi: 10.1039/c1cp20559e. [DOI] [PubMed] [Google Scholar]
- 50.Yu H, van Gunsteren WF. Comput Phys Commun. 2005;172:69. [Google Scholar]
- 51.Borodin O, Smith GD. J Phys Chem B. 2006;110:11481. doi: 10.1021/jp061593o. [DOI] [PubMed] [Google Scholar]
- 52.Yan T, Burnham CJ, Del Popolo MG, Voth GA. J Phys Chem B. 2004;108:11877 [Google Scholar]
- 53.Jiang W, Yan T, Wang Y, Voth GA. J Phys Chem B. 2008;112:3121. doi: 10.1021/jp710653g. [DOI] [PubMed] [Google Scholar]
- 54.Zhao W, Eslami H, Cavalcanti WL, Müller-Plathe F. Z Phys Chem. 2007;221:1647. [Google Scholar]
- 55.Roy D, Maroncelli M. J Phys Chem B. 2010;114:12629. doi: 10.1021/jp108179n. [DOI] [PubMed] [Google Scholar]
- 56.Bowron DT, D’Agostino C, Gladden LF, Hardacre C, Holbrey JD, Lagunas MC, McGregor J, Mantle MD, Mullan CL, Youngs TGA. J Phys Chem B. 2010;114:7760. doi: 10.1021/jp102180q. [DOI] [PubMed] [Google Scholar]
- 57.Chaban VV, Voroshylova IV, Kalugin ON. Phys Chem Chem Phys. 2011;13:7910. doi: 10.1039/c0cp02778b. [DOI] [PubMed] [Google Scholar]
- 58.Leontyev IV, Stuchebrukhov AA. J Chem Phys. 2009;130:085102. doi: 10.1063/1.3060164. [DOI] [PMC free article] [PubMed] [Google Scholar]
- 59.Marrocchelli D, Salanne M, Madden PA, Simon C, Turq P. Mol Phys. 2009;107:443. [Google Scholar]
- 60.Marcus RA. J Chem Phys. 1956;24:979. [Google Scholar]
- 61.Böttcher CJF, Bordewijk P. Theory of electric polarization. Vol. 1 Elsevier; Amsterdam: 1978. [Google Scholar]
- 62.Neumann M, Steinhauser O. Chem Phys Lett. 1984;106:563. [Google Scholar]
- 63.Schröder C, Steinhauser O. In: Computational Spectroscopy:Methods, Experiments and Applications. Grunenberg J, editor. Wiley-VCH, Weinheim; 2010. [Google Scholar]
- 64.Schrooder C, Haberler M, Steinhauser O. J Chem Phys. 2008;128:134501. doi: 10.1063/1.2868752. [DOI] [PubMed] [Google Scholar]
- 65.Schrooder C, Hunger J, Stoppa A, Buchner R, Steinhauser O. J Chem Phys. 2008;129:184501. doi: 10.1063/1.3002563. [DOI] [PMC free article] [PubMed] [Google Scholar]
- 66.Schröder C, Steinhauser O. J Chem Phys. 2009;131:114504. doi: 10.1063/1.3220069. [DOI] [PubMed] [Google Scholar]
- 67.Schröder C, Steinhauser O. J Chem Phys. 2010;132:244109. doi: 10.1063/1.3432620. [DOI] [PMC free article] [PubMed] [Google Scholar]
- 68.Brooks BR, Brooks CL, III, MacKerell AD, Jr, Nilsson L, Petrella RJ, Roux B, Won Y, Archontis G, Bartels C, Boresch S, et al. J Comput Chem. 2009;30:1545. doi: 10.1002/jcc.21287. [DOI] [PMC free article] [PubMed] [Google Scholar]
- 69.Canongia Lopes JN, Deschamps J, Pádua AAH. J Phys Chem B. 2004;108:11250 [Google Scholar]
- 70.Canongia Lopes JN, Padua AAH. J Phys Chem B. 2004;108:16893 [Google Scholar]
- 71.van Duijnen PT, Swart M. J Phys Chem A. 1998;102:2399. [Google Scholar]
- 72.Ryckaert J-P, Ciccotti G, Berendsen HJC. J Comput Phys. 1977;23:327. [Google Scholar]
- 73.Darden T, York D, Pedersen L. J Chem Phys. 1993;98:10089 [Google Scholar]
- 74.Essmann U, Perera L, Berkowitz ML, Darden T, Lee H, Pedersen LG. J Chem Phys. 1995;103:8577. [Google Scholar]
- 75.Youngs TGA, Hardacre C. Chem Phys Chem. 2008;9:1548. doi: 10.1002/cphc.200800200. [DOI] [PubMed] [Google Scholar]
- 76.Steinhauser O. Ber Bunsenges Phys Chem. 1983;87:128. [Google Scholar]
- 77.Höchtl P, Boresch S, Bitomsky W, Steinhauser O. J Chem Phys. 1998;109:4927. [Google Scholar]
- 78.Canongia Lopes JNA, Pádua AAH. J Phys Chem B. 2006;110:3330. doi: 10.1021/jp056006y. [DOI] [PubMed] [Google Scholar]
- 79.Bell RP. Trans Faraday Soc. 1931;27:797. [Google Scholar]
- 80.Born M. Zeitschrift f Phys. 1920;1:221. [Google Scholar]
- 81.Stratt RM, Maroncelli M. J Phys Chem. 1996;100:12981 [Google Scholar]
Associated Data
This section collects any data citations, data availability statements, or supplementary materials included in this article.


