Abstract
The vast majority of molecular dynamics simulation is based on non-polarizable force fields with fixed partial charges for all atoms. The traditional way to obtain these charges are quantum-mechanical calculations performed prior to simulation. Unfortunately, the set of the partial charges heavily relies on the method and the basis set used. Therefore, investigations of the influence of charge variation on simulation data are necessary in order to validate various charge sets. This paper elucidates the consequences of different charge sets on the structure and dynamics of the ionic liquid: 1-ethyl-3-methyl-imidazolium dicyanoamide. The structural features seem to be more or less independent of the partial charge set pointing to a dominance of shape force as modelled by Lennard-Jones parameters. This can be seen in the radial distribution and orientational correlation functions. The role of electrostatic forces comes in when studying dynamical properties. Here, significant deviations between different charge sets can be observed. Overall, dynamics seems to be governed by viscosity. In fact, all dynamical parameters presented in this work can be converted from one charge set to another by viscosity scaling.
I. Introduction
“Molten salts” is a broadly applied term for ionic compounds in the liquid state. Unfortunately, in the last century the expression “ionic liquid” was used in literature synonymously. The difference between these two expressions is just a matter of temperature. On the one hand, “molten salts” are liquid at high temperature and were studied experimentally and by means of computer simulations.1–6 Since these molten salts consisted more or less of atomic inorganic ions, the investigations had to be performed at high temperature which limits the type and diversity of experimental techniques. Furthermore, it also confines the area of application in chemistry and physics. On the other hand, “ionic liquids” are salts with melting points below 100°C. They commonly consist of a heterocyclic cation, e.g. imidazolium, pyrrolidinium or pyridinium, and an organic or inorganic anion. Substituting the atomic anion by sufficiently anisotropic anions such as Tf− and CF3COO− the melting point can even be shifted below 0°C. The essential feature of these ionic liquids (IL) is the anisotropy of the molecular shape as well as the distribution of molecular charge of both cations and anions.
Computer simulations and in particular molecular dynamics have been used to understand these fundamental characteristics of ILs.7 Classical molecular dynamics simulation uses a empirical force field containing harmonic bond-, angle- and torsional potentials as well as Lennard-Jones and Coulombic interactions. With this classical approach simulation length up to 100 ns for IL systems can be achieved.8–10 An alternative, highly accurate method would be “ab initio molecular dynamics simulations” which uses quantum mechanical forces derived from density functional calculations.11,12 However, since computational effort of this method is rather high the elapsed simulation period is limited to a few picoseconds. Retaining the principal concept of charge density fluctuation but reducing the computational effort polarization models have been introduced. Thereby, the fluctuation of charge density is modelled by a set of induced dipoles being computed in a self-consistent way. Thus, simulation periods of a few nanoseconds have been published.13,14
A further reduction of computational efforts can be realized by fixing bond lengths. This approximation of rigid molecules can be rationalized since simulations have shown that the imidazolium ring is almost rigid.15 Furthermore, these internal degrees of freedom affect macroscopic physical properties only marginally. However, the molecular shape of the ions has a much larger influence on the properties.8,10,16 Fortunately, a standard set of Lennard-Jones parameters model the molecular shape fairly well.17–19 Such a standard does not exists for the electrostatic interaction in ILs, although their influence is expected to be important since there is strong evidence of “charge ordering” in ionic liquids.20–22 Usually, these charges are derived from quantum-mechanical calculations by converting the computed electronic density or electrostatic potential to a set of point charges located at the positions of the atoms. In principle, this procedure can be carried out for isolated ions or an ion pair. In the latter case polarization is included to some degree.12,23 As a consequence the net charge of the IL ions is reduced to values below ±1.0 e thus amplifying the counterions’ cage effect. As a result the mobility of ions is enhanced, i.e. the diffusion coefficients are increased and the viscosity is lowered. But one has to bear in mind that polarization forces are non-pairwise additive many body forces. In other words the cage effect can not be split up into a sum of pairs.
Starting either from isolated ions or an ion pair, a manifold of method has evolved, e.g. Mulliken population analysis, restraint electrostatic potential fit (RESP), CHELPG24 and distributed multipole analysis (DMA),25 which yield comparable values for the dipole and quadrupole moment. Unfortunately, the so obtained charges are highly specific to the implied method and the basis set used. For example, partial charges of the nitrogens in an imidazolium ring vary from positive20,26–28 through quasi-neutral29,30 to negative.31,32 These initial charge sets were subsequently modified by calibration against selected thermodynamic data.
In our opinion, however, direct testing of these charge distributions in actual simulations in unavoidable because the way of distributing the charges over the molecular ions has severe consequences on the physical and chemical properties of the underlying ionic liquid. Therefore, we want to investigate the influence of charge variation on the structure and dynamics of the frequently used ionic liquid 1-ethyl-3-methyl-imidazolium (EMIM+) dicyanoamide . Thereby, the set of Lennard-Jones parameters will be kept fixed in order to conserve molecular shape and to study solely the influence of molecular charge variation. Please note that no ranking or rating of existing force fields is intended.
II. Methods
All trajectories were generated by means of CHARMM18,33 under constant volume and temperature (T = 300 K) with a time step of △t =1 fs and a total simulation period over 20 ns. The length 65.2 Å of the cubic box containing 1000 EMIM+ was obtained during an equilibration period of 2 ns under constant pressure of 1 atm. In all calculations, nonbonded and image lists were updated heuristically using a 12 Å cut-off distance. Lennard-Jones energies and forces were smoothly switched off between 9 and 10 Å. The electrostatic interactions were calculated by the Particle-Mesh Ewald method,34,35 using a 10 A cutoff and a κ of 0.41 Å−1 for the real-space part interactions.
Two force fields were used in this work, shortly denoted as Set A and Set B in the following. Please note that this study does not intend to rate existing force fields used for ILs in literature, but to show the influence of the partial charges of the cation on the structure and dynamics. The anionic force field parameters are kept fixed and are taken from Ref. 36.
The cationic force field parameters called “Set A” are taken from Ref. 28 including the corrections.37 As stated in that work the partial charges were calculated by electrostatic surface potential fits using CHELPG24 to electron densities obtained at the MP2/cc-pVTZ(-f) level. The Lennard-Jones parameter of all atoms (cations and anions) are from the AMBER force field.17 “Set B” uses the same parameters for all internal and external potentials except the partial charges of the cation. Only these partial charges were changed to the values reported in Ref. 31. There, the charges were obtained by a distributed multipole analysis25 at the MP2/6-31G** level. These two set of partial charges were chosen because of their large disagreement as visible in Table I. First, the partial charges of the hydrogens in Set A are almost double the values proposed by Set B. Second, the sign and the absolute value of the partial charges of the carbons and nitrogens in the imidazolium ring differ. Nevertheless, the both partial charges sets result in similar molecular dipole moments of 1.6 D and 1.8 D respectively. Additionally, the quadrupole matrix looks alike, too.
Table I.
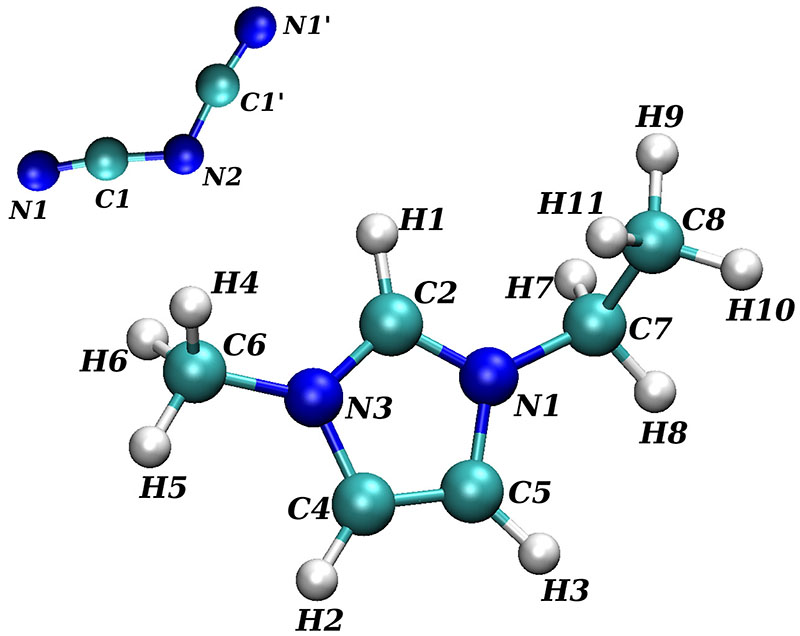
Parametrization of the partial charges of the cation 1-ethyl-3-methyl-imidazolium. Set A and B corresponds to Ref. 28 and Ref. 21 respectively. The partial charges of are taken from Ref. 36. The corresponding atom labels are depicted in Fig. 1.
| atom label | Set A qα | Set B qα | |
|---|---|---|---|
| methyl | C6 | -0.17 | 0.124 |
| H4 | 0.13 | 0.064 | |
| H5 | 0.13 | 0.064 | |
| H6 | 0.13 | 0.064 | |
| midazolium | N1 | 0.15 | -0.267 |
| C2 | -0.11 | 0.407 | |
| N3 | 0.15 | -0.267 | |
| C4 | -0.13 | 0.105 | |
| C5 | -0.13 | 0.105 | |
| H1 | 0.21 | 0.097 | |
| H2 | 0.21 | 0.094 | |
| H3 | 0.21 | 0.094 | |
| ethyl | C7 | -0.17 | 0.13 |
| H7 | 0.13 | 0.055 | |
| H8 | 0.13 | 0.055 | |
| C8 | -0.14 | -0.059 | |
| H9 | 0.09 | 0.045 | |
| H10 | 0.09 | 0.045 | |
| H11 | 0.09 | 0.045 | |
| dicyanoamide | N1 | -0.699 | -0.699 |
| N1’ | -0.699 | -0.699 | |
| C1 | 0.514 | 0.514 | |
| C1’ | 0.514 | 0.514 | |
| N2 | -0.630 | -0.630 |
Since only the partial charges of Ref. 31 are taken but not the Lennard-Jones or intramolecular potential parameters, the force field “Set B” is not the force field proposed by Lynden-Bell et al. However, an additional constant pressure simulation of Set B at 1 atm resulted in the very same average volume as used for the constant volume simulations, i.e. the density does not change when using Set B instead of Set A. Since our main focus in this work lies on the influence of partial charges on the structure and dynamics of ILs, the artificial force field “Set B” is only used for comparison to the different charge Set A. We do not intend to improve or rate existing force fields.
III. Results And Discussion
A. Structural properties
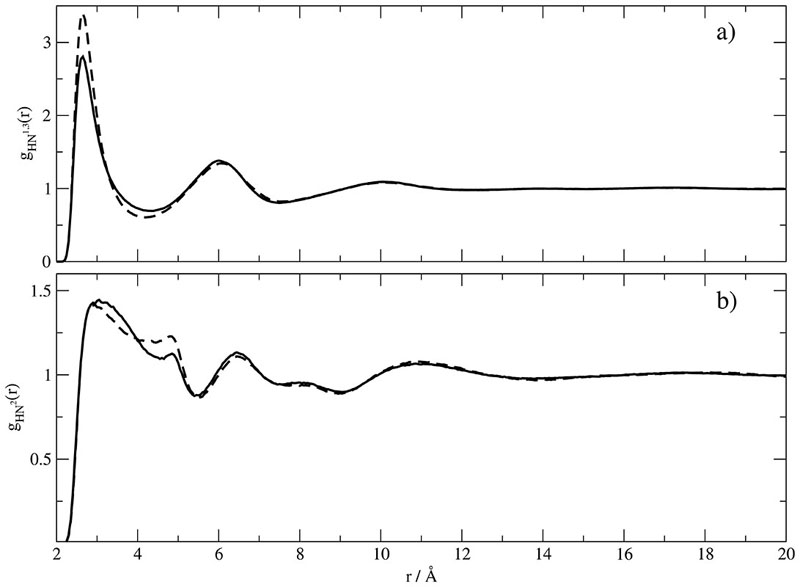
In order to facilitate the subsequent discussion the nomenclature of the atoms is given in Fig. 1 and the set of the corresponding partial charges in Table I. In principle, atom–atom based radial distribution functions are experimentally accessible. In this way hydrogen bonding between imidazolium hydrogens {H1,H2,H3} and corresponding acceptor atoms of the anion, i.e. the nitrogen atoms of dicyanoamide in the present case, can be probed and is usually seen as an important structural feature of ILs.11,38,39 Therefore, we computed the correlation between the imidazolium hydrogens and the two types of nitrogens of dicyanoamide in Fig. 2. The radial distribution functions of the cyanide nitrogens around the imidazolium hydrogen in Fig. 2a differs from Set A to Set B only by the height of the first maximum. Interestingly, the lower partial charge of H1 in Set B [qH1 = 0.097e] results in a higher maximum compared to Set A [qH1 = 0.21e]. However, this cannot be seen as an isolated pair interaction. For example, the carbon atoms attached to H1 are characterized by a reverse of charge strength [Set A: qC2 = −0.11e, Set B: qC2 = 0.407e], thus implicitly compensating the lower hydrogen charge. This demonstrates the high cooperative interaction in ILs, irrespective of the particular numerical values of the partial charges. Rather, it is a general feature independent of the respective force field. The difference in the first peak has its counterpart in the shoulder following the first peak of Fig. 2b. Furthermore, the position of the first peaks in Fig. 2a and b are rather similar. As a result this cannot be a classical hydrogen bond whose linearity would require rather different distances. Of course, a complete set of atom–atom radial distribution functions implicitly reflects orientational structure, but the method of g-coefficients displays the mutual orientation of molecular species explicitly.8,40,41 Moreover, g-coefficients are known to be more sensitive to variations of intermolecular forces.
Fig. 1. Optimized structure of EMIM+ and with atom labels used in Table I.
Fig. 2. Atom−atom radial distribution function around H1 of EMIM+.
a) with respect to the cyanide nitrogens, b) with respect to the central nitrogen of the dicyanoamide. Solid and dashed lines correspond to Set A and B respectively.
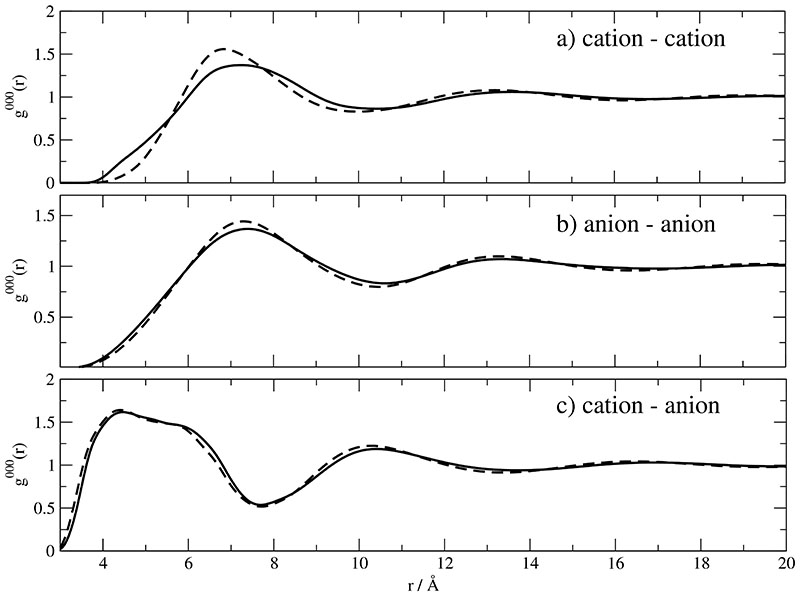
The simplest g-coefficient corresponding to the atom-atom correlations is g000(r) representing the spatial distribution of molecular mass centers. For the two charge sets A and B this distribution is shown for all possible charge pairs in Fig. 3a-c. Discernable deviations between Set A (solid line) and Set B (dashed line) are only observed for cation–cation correlations. In this case the height of the first maximum located around 7Å is slightly enhanced for Set B. As a compensation the initial rise is slightly reduced. Quite generally, the maximum peak heights of 1.5 are rather small even in the case of unlike charge pairs. In other words the charge “screening” must be very strong. Furthermore, the systematic coincidence of maxima and minima in Fig. 3a-c of like and unlike charge pairs, respectively, resembles the classical charge ordering being characterized by subsequent layers of opposite charge.20–22
Fig. 3. Radial distribution functions of : Solid and dashed lines correspond to Set A and B respectively.
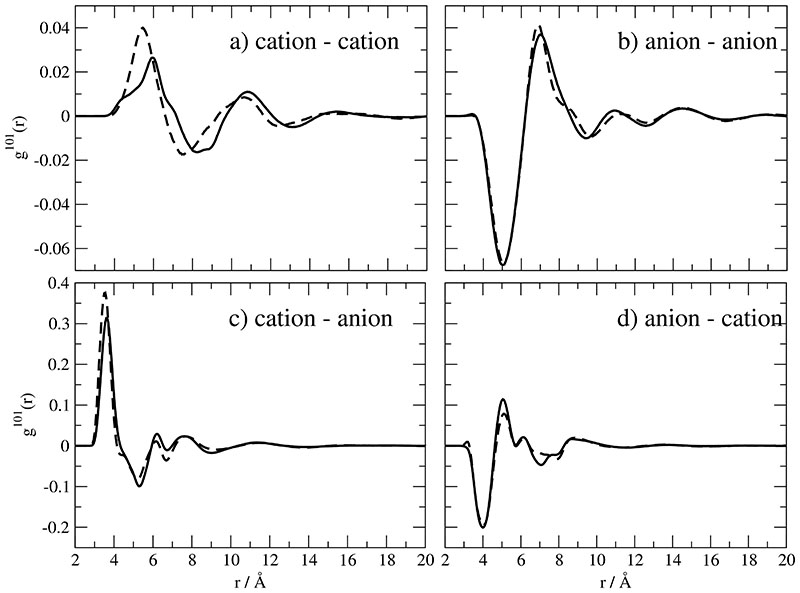
While g000(r) is merely a radially resolved number density, the mutual orientation of molecular species shows up for example in g-coefficients with higher angular momentum, e.g. g101(r) and g110(r). In Fig. 4a and b the angular variation of the distribution of a cation around a cation or of an anion around an anion is illustrated. First, the rather small values of these angular functions point to a almost radially symmetric distribution. This contrasts our previous findings for BMIM+ based ILs: There, a pronounced anisotropy results in a preference of certain angular regions. The anisotropy in shape is accompanied by a larger molecular dipole moment. Therefore, the synergy of both effects yields the anisotropic distribution. Second, the values in Fig. 4c and d are much larger compared to the figures on top. The reason for this are the shorter distances between unlike ions. The first peak in Fig. 4c reflects a preferred population in the proximity of the methyl group. This is in accordance with the first minimum in Fig. 4d which can be interpreted as an enhanced population in the region opposite to the angular cone confined by the two cyano bonds.
Fig. 4.
Orientational correlation functions g101(r) of . Solid and dashed lines correspond to Set A and B respectively.
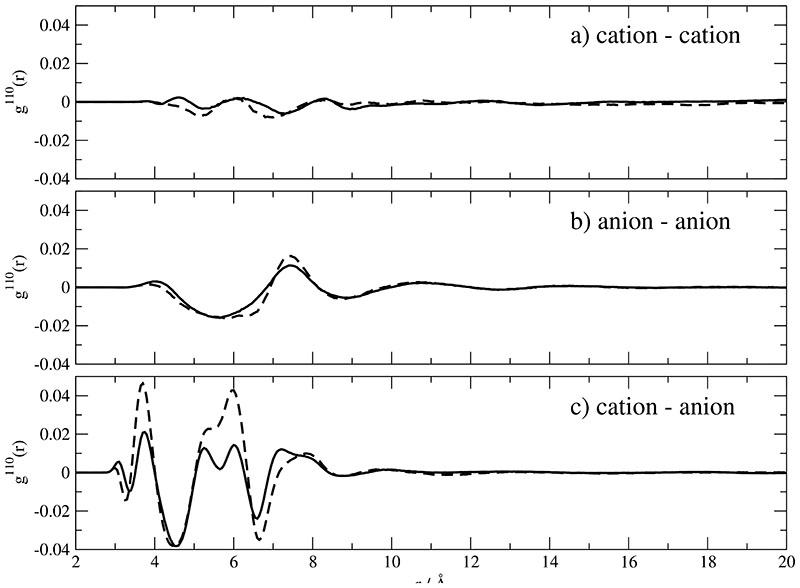
g110(r) describes the average cosine of the angle between two molecular dipole moments μ as a function of the center of mass distance r. For the present case the corresponding functions are displayed in Fig. 5a-c. For like ion pairs the corresponding g110(r) are of the same order of magnitude but less structured as compared to g101(r). Again, the interstitial layer of opposite charges screens the dipole–dipole interaction such that no preferred mutual orientation is established. In previous studies, however, preferred orientations were found for BMIM+. In other words, the prolongation of the ethyl group by two CH2-units already weakens the screening effect and enables a parallel nearest neighbor orientation of the cations. An interesting point is the comparison of the cation−anion g110 (r) and g101(r) function. Although the distribution of unlike ions is preferably anisotropic as shown in Fig. 4c and d, the respective mutual orientation is marginal. This points to the priority of space filling versus electrostatic forces.
Fig. 5.
Orientational correlation functions g110(r) of . Solid and dashed lines correspond to Set A and B respectively.
B. Dynamic properties
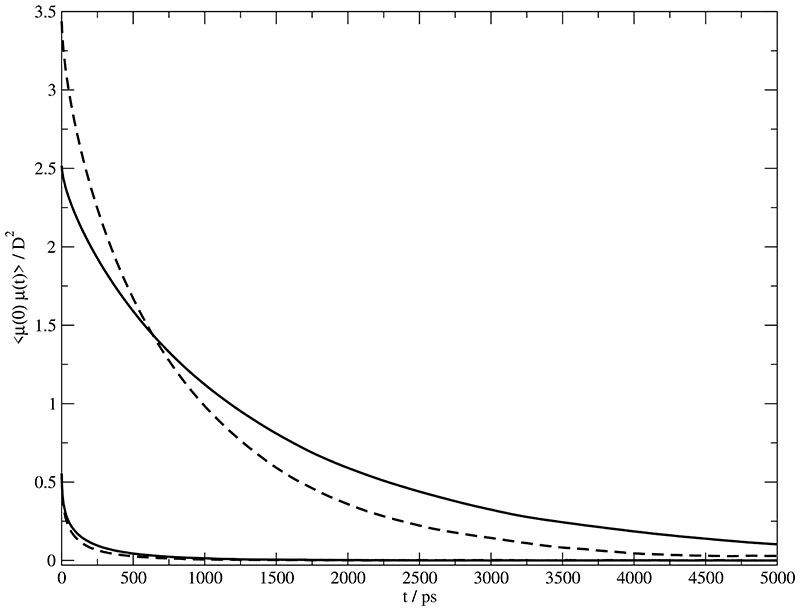
In previous studies we have shown that the molecular dipole moments μ referred to the center of mass enables a simplified, but reasonable interpretation of rotational dynamics.9. The relaxation of these dipole moments is best described in terms of the autocorrelation functions 〈μ+(0) · μ+(t)〉 and 〈μ−(0) · μ−(t)〉 which are shown in Fig. 6. The two upper curves refer to the cations in Set A (solid line) and Set B (dashed line). Lower curves refer to the anion. In order to facilitate interpretation we have fitted all these curves to a Kohlrausch function
| (1) |
Fig. 6.
Autocorrelation of the molecular dipole moment μ(t). The two upper curves belong to the cationic 〈μ+(0) · μ+(t)〉 in Set A (solid line) and Set B (dashed line). The two lower curves represent the anionic 〈μ−(0) · μ−(t)〉.
The corresponding parameter for the cations in Set A and B are { β+ = 0.869} and { β+ = 0.867}, respectively. The analogous values for the anions are { β− = 0.522} and { β− = 0.511}. Remarkably, the stretching factor β is independent of the charge set,i.e. β is essentially determined by the Lennard-Jones shape forces. As expected, the time constants of the anions are much smaller compared to those of the cations.10,22,27 The Kohlrausch function represents a closed expression modelling a distribution of exponential decays.42,43 Correspondingly, the average relaxation time is easily calculated to be
| (2) |
Here, Γ represents the Gamma function.44 The values are summarized in Table II. Irrespective of the fitting function the initial values of the 〈μ+(0) · μ+(t)〉 are 2.5 D2 and 3.5 D2 for Set A and B, respectively. These values represent the averaged squared molecular dipole moment .
Table II.
Summary of dynamical parameters. The ratio is calculated between the physical properties of Set A divided by the corresponding value of Set B.
Collectivity is an essential feature of ILs because of the tight coupling of the constituting molecular species. In analogy to the obvious spatial charge ordering,20–22 electrostatic forces also dominate all other collective properties. The collective counterpart of the above discussed molecular dipole moments μ(t) is
| (3) |
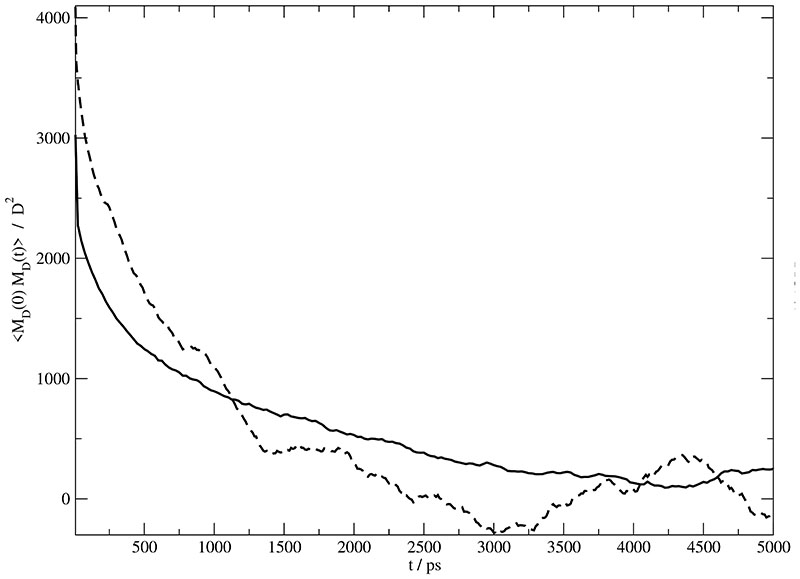
The time autocorrelation functions 〈MD(0) · MD(t)〉 of this collective dipole moment is shown in Fig. 7 for Set A (solid line) and Set B (dashed line). As usual, the statistics of these collective correlation functions is worse compared to the single particle analogon and demonstrates the needs for very long trajectory data. Since very different time scales are involved in these autocorrelation functions, multi-exponential fits are superior than the Kohlrausch function in this case. This diversity of time scales is already inherent to dynamical behavior of the cations or anions themselves and even enhanced by the mixing of both species. It turns out, that three exponential functions are necessary to reproduce the total amplitude,i.e. the initial value of the autocorrelation function, and the time behavior. The fitting parameter are {A1=1636 D2, , A2=1053 D2, , A3=434 D2, } and {A1=3384 D2, , A2=806 D2, , A3=655 D2, } for Set A and Set B. For the sake of simplicity we average the time constants according to
| (4) |
Fig. 7.
Autocorrelation of the collective rotational dipole moment 〈MD (0) · MD (t)〉 of . Solid and dashed lines correspond to Set A and B respectively.
Resulting average time constants are given in Table II. The average squared collective dipole moments are 3354 D2 and 4774 D2 for Set A and Set B.
So far, we have discussed effects resulting from the rotation of the molecular charge distribution. Now, we turn to translation as represented by the current J
| (5) |
where qi equals the net charge of a molecular ion, so to say, the sum of all qα belonging to the cation or anion as collected in a column of Table I. vc.m.,i is velocity of the center of mass of ions i. In molecular liquids, the integral over the time autocorrelation function of the current is traditionally used to compute the static conductivity σ. In a previous paper, however, we have learnt that the computation by means of an Einstein-Helfand (EH) approach is statistically superior.36 Thereby, the integral of the current
| (6) |
equals the collective translational dipole moment MJ(t). Actually, the static conductivity σ is obtained from the linear slope of the “dipolar displacement”:
| (7) |
The values computed for the two charge sets are given in Table II.
A popular approximation to compute the conductivity is the Nernst-Einstein equation
| (8) |
Here, N is the number of ion pairs, D+ and D− are the diffusion coefficients of cations and anions which are single-particle properties and can thus be averaged over all cations and anions, respectively. Therefore, the Nernst-Einstein equation only consists of the mere self terms and neglects all cross coupling between the ions. Thus, the comparison between σEH and σNE reveals the extent of collectivity in translational motion. Using the values of the diffusion coefficients given in Table II the resulting σNE exceeds the σEH by a factor of 1.5 and 1.2, respectively. In other words the collective contribution is negative and more pronounced for Set A showing the enhanced influence on collectivity of this charge set.
C. On the role of viscosity
Another collective property of primary importance for the present discussion is the viscosity. In previous studies we have found that the Einstein-Helfand method is an appropriate method to calculate the viscosity. Thereby, an extremely high statistical accuracy from long trajectory data is a must. Although we have only changed the charge set of the cation leaving the anion completely identical a rather drastic change in viscosity from Set A (η =70 mPa s) to Set B (η =42 mPa s) is observed. Surprisingly, higher partial charges as well as a higher molecular dipole moment do not lead automatically to a higher viscosity.
Apart from this principle observation the viscosity provides an excellent means for a systematic classification of dynamical parameters. In fact, the last column of Table II displays the ratio between Set A and Set B for all dynamic parameters given. Since the stretching factors β of the single particle dipolar correlation functions 〈μ+ (0) · μ+(t)〉 and 〈μ−(0) · μ−(t〉 are independent of the charge set, the ratio between the Kohlrausch time constants is equal to that of the respective average values 〈〉.
All these ratios are close to the ratio of the viscosities with slight deviations in case of 〈μ−(0) · μ−(t)〉 and the diffusion coefficients. Even anion dominated properties which are only implicitly influenced by changes of the cationic charge distribution the ratios are in reasonable accordance. This agreement of ratios is not restricted to single particle properties but also shows up for the correlation of the collective rotational dipole moment MD(t). Even more, collective translational motion as represented by the conductivity σEH obeys this universal ratio. In other words, collectivity as represented by the interaction or cross terms between like and unlike ions scales with the viscosity in the same way as all single particle properties. The fact that dynamic properties can be converted by viscosity scaling is not restricted to the present study but was also observed among different ILs, e.g. , BMIM+CF3COO− and .9,10
This viscosity scaling is supported by both the empirical Walden rule and results from hydrodynamic theory. Beyond all discussion concerning hydrodynamic radii or volumes the direct or indirect proportionality of dynamic parameters to the viscosity is a central concept, even valid in such complex system like ILs.9 Consequently, viscosity appears to be a compact measure to model both single particle and collective dynamics.
IV. Conclusion
The computation of all structural and dynamic properties given in this work requires sufficiently long simulation runs in the order of several tens of nanoseconds. The essential reason for this is the high viscosity of ILs slowing down molecular motions compared to simple molecular liquids. As a result, global properties whose equilibrium average must be zero show characteristic non-zero values even in nanosecond simulations. A typical example is the net polarization of the simulation box.45 Even for our very long simulations the average net polarization is rather small but still not zero. In this sense the vanishing of averaged collective properties turns out to be a criterion to judge the appropiate length of a simulation. Unfortunately, this criterion is at rival with efforts to improve the description of local interaction, in particular many body polarization forces.
As we decided to perform very long term simulations, the force field used is restricted to the classical concept of permanent partial charges. We have learnt that variation of the charge set has little influence on the structure, not only on the atom-atom radial distribution functions gHN (r) but also on the more sensitive orientational correlation functions g101(r) and g110(r). Consequently, one may conclude that the spatial anisotropy as characterized by the Lennard-Jones interactions plays the dominant role in orientational structure. In neutral molecular liquids the effect of electrostatics is usually estimated by considering the molecule’s multipole moments. In this study we have found that this way of interpretation works for the structure but not for the dynamics. Since multipoles are global features referring to the molecule as a whole, they are incapable to describe specific local interactions which seem to be important for the dynamics. This may offer an explanation why polarizable force fields accelerate dynamics,13 although they aim at the generation of additional dipoles. The present study shows that the acceleration of dynamics can also be achieved by reparametrization of the permanent charges, even if this new parametrization results in a higher molecular dipole moment.
The final point concerns the universal role of the viscosity. From this work and previous studies strong evidence is found that dynamical properties calculated for different molecular interactions may be simply converted by viscosity scaling.
Acknodlegement
This work was supported by the project P19807 of the FWF Austrian Science Fund.
References
- 1.Rovere M, Tosi MP. Rep Prog Phys. 1986;49:1001. [Google Scholar]
- 2.Galli G, Parrinello M. J Chem Phys. 1991;95:7504. [Google Scholar]
- 3.Okamoto Y, Hayashi H, Ogawa T. J non-crystalline solids. 1996;205–207:139. [Google Scholar]
- 4.Adya AK, Takagi R, Gaune-Escard M. Z Naturforsch. 1998;53a:1037. [Google Scholar]
- 5.Leonardo SMU, Siqueira JA, Ribeiro MCC. J Chem Phys. 2003;119:8002. [Google Scholar]
- 6.Salanne M, Simon C, Turq P, Madden PA. J Phys Chem B. 2007;111:4678. doi: 10.1021/jp067073a. [DOI] [PubMed] [Google Scholar]
- 7.Hunt PA. Mol Simulations. 2006;32:1. [Google Scholar]
- 8.Schröder C, Rudas T, Steinhauser O. J Chem Phys. 2006;125:244506. doi: 10.1063/1.2404674. [DOI] [PubMed] [Google Scholar]
- 9.Schröder C, Wakai C, Weingärtner H, Steinhauser O. J Chem Phys. 2007;126:084511. doi: 10.1063/1.2464057. [DOI] [PubMed] [Google Scholar]
- 10.Schröder C, Rudas T, Neumayr G, Gansterer W, Steinhauser O. J Chem Phys. 2007;127:044505. doi: 10.1063/1.2754690. [DOI] [PubMed] [Google Scholar]
- 11.Del Pópolo MG, Lynden-Bell RM, Kohanoff J. J Phys Chem B. 2005;109:5895. doi: 10.1021/jp044414g. [DOI] [PubMed] [Google Scholar]
- 12.Buhl M, Chaumont A, Schurhammer R, Wipff G. J Phys Chem B. 2005;109:18591. doi: 10.1021/jp0518299. [DOI] [PubMed] [Google Scholar]
- 13.Yan T, Burnham CJ, Del Pópolo MG, Voth GA. J Phys Chem B. 2004;108:11877 [Google Scholar]
- 14.Borodin O, Smith GD. J Phys Chem B. 2006;110:11481. doi: 10.1021/jp061593o. [DOI] [PubMed] [Google Scholar]
- 15.de Andrade J, Böes ES, Stassen H. J Phys Chem B. 2002;106:3546. [Google Scholar]
- 16.Shu Q, Yang B, Wang F-A. Chinese J Struct Chem. 2005;24:10831087 [Google Scholar]
- 17.Case DA, et al. Amber. Vol. 9. San Francisco; 2006. [Google Scholar]
- 18.MacKerell AD, Brooks B, Brooks CL, Nilson L, Roux B, Won Y, Karplus M. The Encyclopedia of Computational Chemistry. Vol. 1. John Wiley; 1998. [Google Scholar]
- 19.Jorgensen WL, Maxwell DS, Tirado-Tives J. J Am Chem Soc. 1996;118:11225 [Google Scholar]
- 20.Shah JK, Brennecke JF, Maginn EJ. Green Chem. 2002;4:112. [Google Scholar]
- 21.Del Pópolo MG, Voth GA. J Phys Chem B. 2004;108:1744. [Google Scholar]
- 22.Cadena C, Zhao Q, Snurr RQ, Maginn EJ. J Phys Chem B. 2006;110:2821. doi: 10.1021/jp056235k. [DOI] [PubMed] [Google Scholar]
- 23.Lee SU, Jung J, Hand Y-K. Chem Phys Lett. 2005;406:332. [Google Scholar]
- 24.Breneman CM, Wiberg KB. J Comput Chem. 1990;11:361. [Google Scholar]
- 25.Stone AJ, Alderton M. Mol Phys. 1985;56:1047. [Google Scholar]
- 26.Margulis CJ, Stern HA, Berne BJ. J Phys Chem B. 2002;106:12017 [Google Scholar]
- 27.Morrow TI, Maginn EJ. J Phys Chem B. 2002;106:12807 [Google Scholar]
- 28.Lopes NCJ, Deschamps J, Padua AAH. J Phys Chem B. 2004;108:2038. [Google Scholar]
- 29.de Andrade J, Böes ES, Stassen H. J Phys Chem B. 2002;106:13344 [Google Scholar]
- 30.Liu Z, Huang S, Wang W. J Phys Chem B. 2004;108:12978 [Google Scholar]
- 31.Hanke CG, Price SL, Lynden-Bell RM. Mol Phys. 2001;99:801. [Google Scholar]
- 32.Urahata SM, Ribeiro MCC. J Chem Phys. 2004;120:1855. doi: 10.1063/1.1635356. [DOI] [PubMed] [Google Scholar]
- 33.Brooks BR, Bruccoleri RE, Olafson BD, States DJ, Swaminathan S. J Comput Chem. 1983;4:187. [Google Scholar]
- 34.Darden T, York D, Pedersen L. J Chem Phys. 1993;98:10089 [Google Scholar]
- 35.Essmann U, Perera L, Berkowitz ML, Darden T, Lee H, Pedersen LG. J Chem Phys. 1995;103:8577. [Google Scholar]
- 36.Schröder C, Haberler M, Steinhauser O. J Chem Phys. 2008;128:134501. doi: 10.1063/1.2868752. [DOI] [PubMed] [Google Scholar]
- 37.Lopes JNC, Deschamps J, Padua AAH. J Phys Chem B. 2004;108:11250 [Google Scholar]
- 38.Hardacre C, Holbrey JD, McMath SEJ, Bowron DT, Soper K. J Chem Phys. 2003;118:273. [Google Scholar]
- 39.Huang J-F, Chen P-Y, Sun I-W, Wang SP. Inorg Chim Acta. 2001;320:7. [Google Scholar]
- 40.Blum L, Narten AH. Adv Chem Phys. 1976;34:203. [Google Scholar]
- 41.Steinhauser O, Bertagnolli H. Ber Bunsenges Phys Chem. 1981;85:45. [Google Scholar]
- 42.Alvarez F, Alegria A, Colmenero J. J Phys Rev B. 1991;44:7306. doi: 10.1103/physrevb.44.7306. [DOI] [PubMed] [Google Scholar]
- 43.Anderssen RS, Husain SA, Loy RJ. Anziam J. 2004;45:C800. [Google Scholar]
- 44.Press WH, Teukolsky SA, Vetterling WT, Flannery BP. Numerical recipes in C:The art of scientific computing. Cambridge university press; New York: 2002. [Google Scholar]
- 45.Bagno A, D’Amico F, Saielli G. J Mol Liquids. 2007;131–132:17. [Google Scholar]
- 46.Yoshida Y, Baba O, Saito G. J Phys Chem B. 2007;111:4742. doi: 10.1021/jp067055t. [DOI] [PubMed] [Google Scholar]
- 47.MacFarlane DR, Forsyth SA, Golding J, Deacon GB. Green Chem. 2002;4:444. [Google Scholar]


