Abstract
Adult kidney organoids have been described as strictly tubular epithelial and termed tubuloids. While the cellular origin of tubuloids has remained elusive, here we report that they originate from a distinct CD24+ epithelial subpopulation. Long-term-cultured CD24+-derived tubuloids represent a functional human kidney tubule. We show that kidney tubuloids can be used to model the most common inherited kidney disease, namely autosomal dominant polycystic kidney disease (ADPKD), reconstituting the phenotypic hallmark of this disease with cyst formation. Single-cell RNA sequencing of CRISPR/Cas9 gene-edited PKD1 and PKD2 knockout tubuloids and human ADPKD and control tissue show similarities in upregulation of disease-driving genes. Furthermore, in a proof of concept, we demonstrate that tolvaptan, the only approved drug for ADPKD, shows a significant effect on cyst size in tubuloids but no effect in a pluripotent-stem-cell-derived model. Thus, tubuloids derive from a tubular epithelial subpopulation and represent an advanced model for ADPKD disease modeling.
Introduction
Various groups have reported kidney organoids derived from human pluripotent stem cells (hPSCs), and improved differentiation protocols have led to mini kidney structures in a dish that contain many cellular constituents of the adult kidney.1–4 However, hPSC-derived organoids resemble early stages of human kidney development and contain non-kidney cell types.5 They might therefore not be the ideal system to model adult human disease or to study potential regenerative therapies. Recently, organoids of the human adult kidney have been reported as cells outgrowing from tubular fragments or from urine. They were termed tubuloids to reflect their strictly tubulo-epithelial origin and differentiation.6 Such structures might be superior to model features of epithelial kidney disease, since they are derived from adult human kidneys. However, the exact cellular origin of these tubuloids remains elusive, and it is unclear whether they can be utilized to induce an inherited, highly prevalent, human kidney disease phenotype by gene editing.
Here, we report that a distinct CD24+ kidney epithelial cell population gives rise to tubuloids and that these cells possess metabolically and gene regulatory distinct programs. CD24+ cells are scattered throughout the nephron. Their proximal tubule (PT) and Loop of Henle (LOH) fraction shows the strongest in vitro expansion and long-term growth of largely functional tubular structures. We also demonstrate that CD24+-cell-derived tubuloids can be used to model autosomal dominant polycystic kidney disease (ADPKD) using multiplex CRISPR/Cas9 gene editing, which led to rapid cyst formation. Using single-cell RNA sequencing (scRNA-seq) from ADPKD patient tissue and healthy human tissue as well as gene-edited tubuloids compared to controls, we demonstrate similarities in upregulation of reported disease-driving genes. Furthermore, we demonstrate that tolvaptan treatment reduces cyst size in tubuloids while it does not have any effect on cyst size in gene-edited iPSC organoids. Therefore, tubuloids represent an advanced model of human ADPKD and are useful for drug studies to identify novel treatment candidates.
Results
CD24+ cells are metabolically distinct
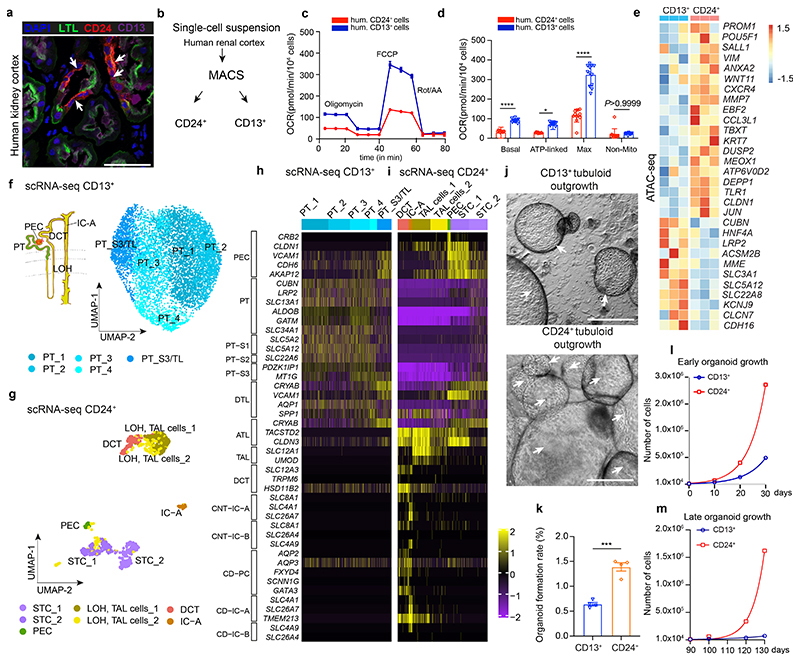
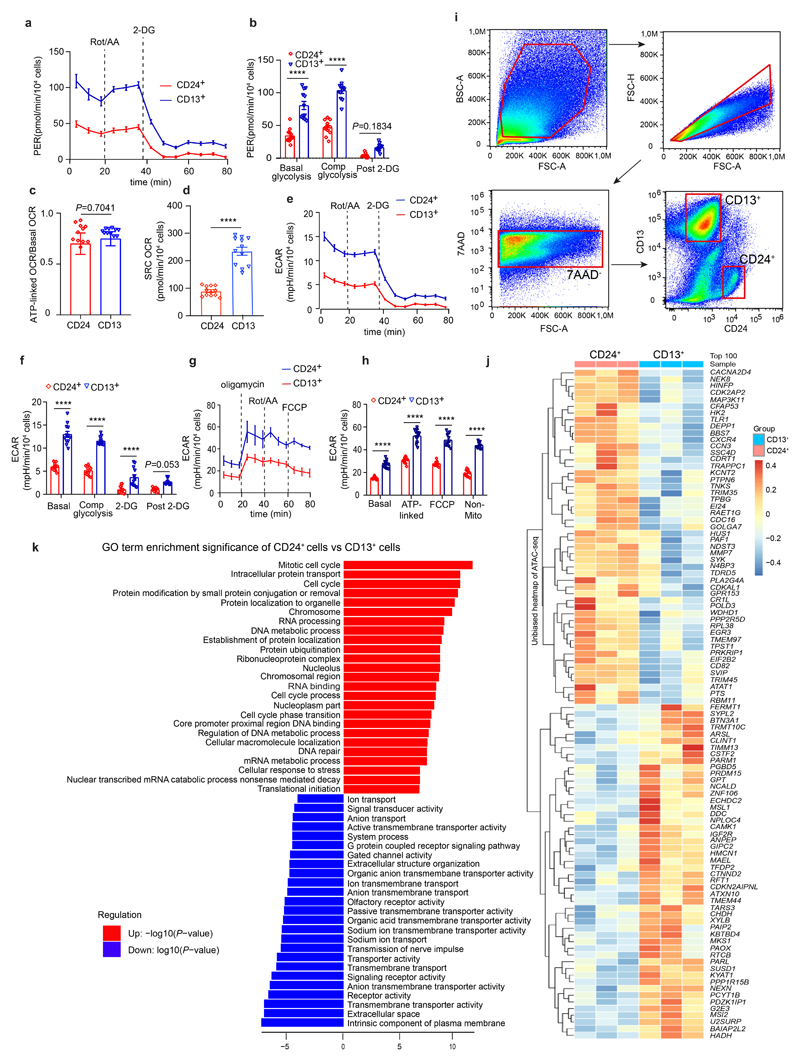
CD24+ cells that coexpress CD133 have been described as a potential progenitor population in human kidney.7–10 As reported,11 we detected CD24-expressing cells as a small scattered subset mainly among PT epithelium in human kidneys (Fig. 1a). We established primary cultures of isolated human CD13+ PT cells and primary CD24+ cells (Fig. 1b and Supplementary Fig. 1). It is widely accepted that adult progenitors reside in a niche that is defined by a low partial oxygen pressure and physiologic hypoxia.12 We therefore asked whether CD24+ cells have a different energy metabolism as compared to regular PT epithelium (CD13+). Interestingly, we detected a decreased basal and maximal oxygen consumption rate (OCR) in CD24+ cells as compared to CD13+ PT and changes in several other metabolic parameters (Fig 1c-d, Extended Data Fig. 1a-h). These data suggest a specialized metabolism of CD24+ cells different from PT.
Fig. 1. CD24+ cells are a distinct tubular subpopulation and the origin of human kidney tubuloids.
a, Human kidney tissue stained for lotus tetragonolobus lectin (LTL), CD13, CD24 (arrows) and DAPI (nuclei). Arrows indicate CD24 costaining with CD13/LTL cells. Scale bar, 50 μm. b, Scheme of cell isolation. c-d, Oxygen consumption rate (OCR) in CD24+ and CD13+ cells. Basal-unstimulated OCR; ATP-linked-oligomycin OCR; Max-FCCP OCR; Non-Mito-ROT/AA OCR; FCCP-Carbonyl cyanide-4 (trifluoromethoxy) phenylhydrazone; Rot/AA-rotenone/antimycin A. Statistical analysis in n = 12 mean ± s.d.(c), and n = 12 mean ± s.e.m.(d), 2-way-ANOVA post-hoc Tukey, *P = 0.0226 for ATP-linked OCR; ****P <0.0001 for basal unstimulated OCR, Max-FCCP OCR; non-significant, P >0.9999 for Non-Mito OCR (d). hum. = human (c, d). e, Heatmap displaying ATAC-seq peak count data in the transcription start site (TSS) of selected genes of CD13+ or CD24+ cells. f, Scheme of the human nephron with proximal tubule (PT), loop of Henle (LOH), distal convoluted tubule (DCT) and type A intercalated cells (IC-A) of the collecting duct and UMAP embedding for sorted CD13+ cells from the human kidney. n = 7,121 cells from proximal tubule: PT_1, 2, 3, 4, and S3 segment/ thin-limb of the LOH (S3/TL). g, UMAP embedding for sorted CD24+ cells from the human kidney. n = 868 cells, distal convoluted tubule cells (DCT), thick ascending limb cells from loop of Henle (TAL cells-1, 2), parietal epithelial cells (PEC), scattered tubule epithelial cells (STC1 and 2), and collecting duct type A intercalated cells (IC-A). h-i, Scaled gene expression of the reported Kidney Precision Medicine Project (KPMP) marker genes of the identified clusters in scRNA-seq of CD13+ cells (h) and CD24+ cells (i). j, Representative difference interference contrast (DIC) microscopy images of 30-day tubuloids. Arrows mark cysts and cyst borders. Scale bar 200 μm. k, Comparison of organoid formation rate. Statistical analysis using two-tailed unpaired t-test, n = 4 mean ± s.e.m, ***P = 0.0002. l-m, Early and late organoid growth curves. 2-way-ANOVA post-hoc Bonferroni, n = 2 from separate experiments, graph shows mean of the two experiments.
Distinct gene regulatory program in CD24+ cells
We analyzed the chromatin accessibility of CD24+ cells compared to CD13+ PT using an assay for transposase-accessible chromatin with sequencing (ATAC-seq). CD24+ and CD13+ cells were sorted by FACS (Extended Data Fig. 1i) from adult human kidney nephrectomy specimens and immediately subjected to ATAC-seq. When compared to CD13+ PT, CD24+ cells exhibited a distinct gene regulatory program (Fig. 1e, Extended Data Fig. 1j) with increased accessibility of genes associated with progenitor cells, dedifferentiation as well as inflammation. GO term analysis indicated cell-cycle activity, cellular responses to stress, and dedifferentiation (loss of normal tubule transport activity) of CD24+ cells (Extended Data Fig. 1k).
Single-cell RNA sequencing of CD24+ and CD13+ cells
To understand the differences between CD13+ and CD24+ cells at the single-cell level, we performed scRNA-seq of freshly sorted CD13+ and CD24+ cells from human kidneys. Unsupervised clustering and cell-type assignment revealed that CD13 strictly labels PT (S1-S3) and the thin limb of the LOH (Fig.1f and h, Supplementary Fig. 2a left) while CD24 sorting captures cells from various parts of the nephron (Fig. 1g and i, Supplementary Fig. 2a, right). Two large CD24+ populations (41.1%) showed expression of markers from the PT S3 segment and the thin limb of the LOH (Fig. 1g-i). We termed these populations scattered tubule epithelial cells (STC1, STC2). We further identified type A intercalated cells from the collecting duct (IC-A, SLC4A1+), parietal epithelial cells (PEC: VCAM1+, CLDN1+, KLK6+), distal convoluted tubule cells (DCT: SLC12A3+) and two thick ascending limb populations of the LOH (TAL1 and TAL2: SLC12A1+). These data indicated that only about half of the CD24+ cells were PT and thin LOH limb derived and thus showed overlap with the source of CD13+ cells.
To determine whether metabolic differences of the CD24+ cells as compared to the CD13+ cells can be caused by the CD24+ cells that are located in more distal parts of the nephron (TAL, DCT, IC-A), we next sorted CD24+/CD13+ double-positive cells as well as CD24-/CD13+ and repeated the metabolic analysis. These data indicated that CD24+ cells as a subpopulation of the CD13+ cells are metabolically distinct from CD13+ cells with decreased maximal OCR and spare respiratory capacity (Supplementary Fig. 2b-c).
CD24+ cells as the source of adult kidney tubuloids
Recently reported tubuloids from adult human kidneys have been established as outgrowing structures from digested tissue.6 However, the cellular origin of these tubuloids remains unknown. We sought to establish adult kidney tubuloids from isolated CD24+ cells and from regular PT (CD13+). The Wnt target gene LGR5 is one of the most widely used adult stem cell markers.13,14 While we did not detect expression of LGR5 in CD24+ cells we observed a higher accessibility in the transcriptional start site of the LGR4 gene and increased expression of LGR4 mRNA in CD24+ cells (Supplementary Fig. 2d-e). We thus utilized Wnt3a/RSPO1 treatment in our organoid protocol.
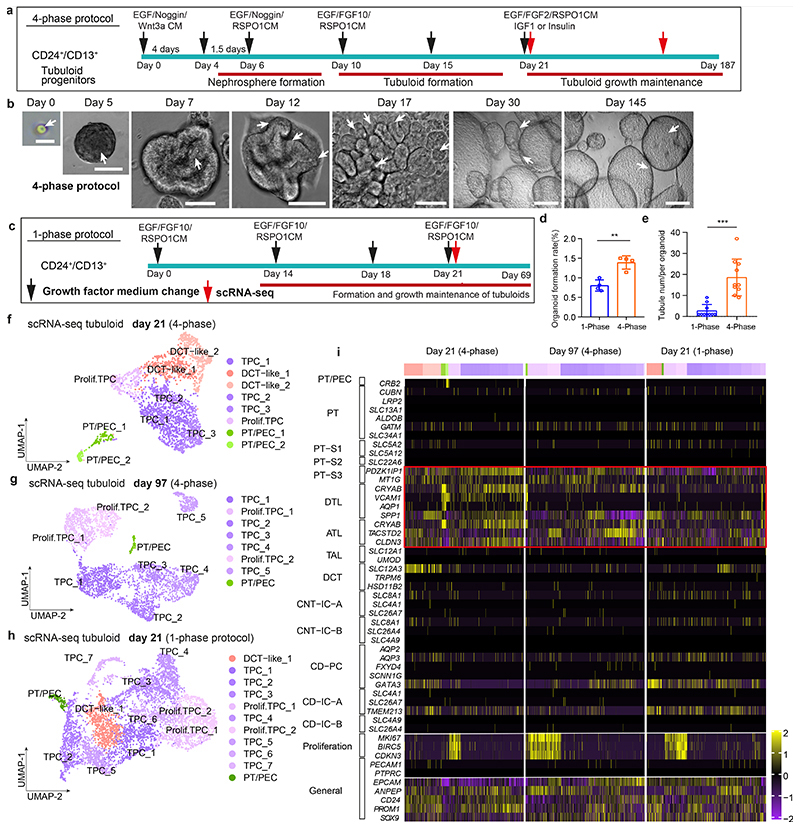
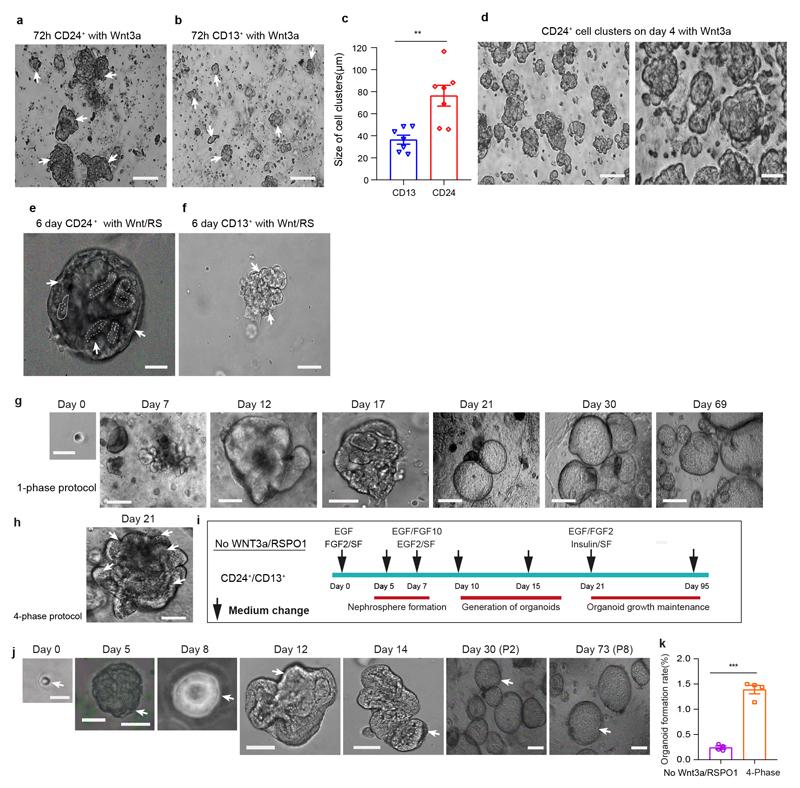
Organoid formation rate and population doublings of CD24+ cells were increased compared to CD13+ cells (Fig. 1j-m). We observed 4 phases of CD24+ cell growth and expansion into tubulo-epithelial organoids referred to as tubuloids (Fig. 2a-b, Extended Data Fig. 2a-f, Supplementary Videos 1–4, see Supplementary Notes). The tubuloid culture showed robust growth for >6 months (187 days; 23 passages). Compared to the 1-phase protocol by Schutgens et al.6, we observed an increased organoid formation rate using the 4-phase protocol and also more tubules within each tubuloid (Fig. 2c-e, Extended Data Fig. 2g-h). We further tried a protocol that solely uses EGF/FGF215 and demonstrated a reduced organoid formation rate in the absence of Wnt3a/RSPO1 as compared to the 4-phase protocol, confirming its importance for tubuloid formation (Extended Data Fig. 2i-k).
Fig. 2. Single-cell RNA sequencing of tubuloids.
a, Timeline of tubuloid generation (4-phase protocol). Black arrows indicate change of conditioned medium and growth factors, red arrows indicate timepoints for single-cell RNA sequencing. b, Representative images of CD24+-cell-derived tubuloids using the 4-phase protocol. Scale bars, 200 μm - day 30, day 145; 100 μm - day 0; 50 μm - day 5, 7, 12, 17. c, Schematic timeline of tubuloid generation using the 1-phase protocol. d-e, Quantification of tubuloid formation rate at day 22 (d) and number of tubuli within a tubuloid at day 25 (e) of CD24+ cells comparing 4-phase and 1-phase protocol. Statistical analysis in n = 4 mean ± s.d., two-tailed unpaired t-test with Welch’s correction, **P = 0.0020(d); n = 10 mean ± s.d., two-tailed unpaired t-test with Welch’s correction, ***P = 0.0002, mean = 18.60 tubuli per 4-phase tubuloid, 95% confidence interval = 9.464 to 22.34, indicating 95% of 4-phase tubuloids contained around 9-22 tubuli(e). Tubule num/per organoid indicates tubule numbers in each organoid (e). f, UMAP embedding of cells from an early tubuloid (day 21, 4-phase protocol). 2,291 cells in 8 clusters: tubuloid progenitors 1-3 (TPC1-3), proliferating TPC, distal convoluted tubule (DCT 1 and 2), proximal tubule / parietal epithelial cells (PT/PEC1 and 2). g, UMAP embedding of cells from a late tubuloid (day 97, 4-phase protocol). 3,693 single cells in 8 clusters:tubuloid progenitor cells (TPC1-5), proliferating tubuloid progenitor cells (Prolif. TPC 1-2), and cells that showed markers of parietal epithelial cells (PEC) and PT (PT/PEC). h, UMAP embedding of cells from an early tubuloid (day 21, 1-phase protocol). 5,631 cells in 11 clusters identified: TPC (TPC1-7), proliferating TPCs, (Prolif. TPC1-2), distal convoluted tubule cells (DCT-like-1), PT/PEC. i, Heatmap of marker gene expression for different nephron parts using Kidney Precision Medicine Project marker genes as well as selected general marker genes and proliferation markers of the early (day 21) and late (day 97) stage tubuloids (4-phase) and an early (day 21) tubuloid (1-phase protocol). For details on statistics and reproducibility, see Methods.
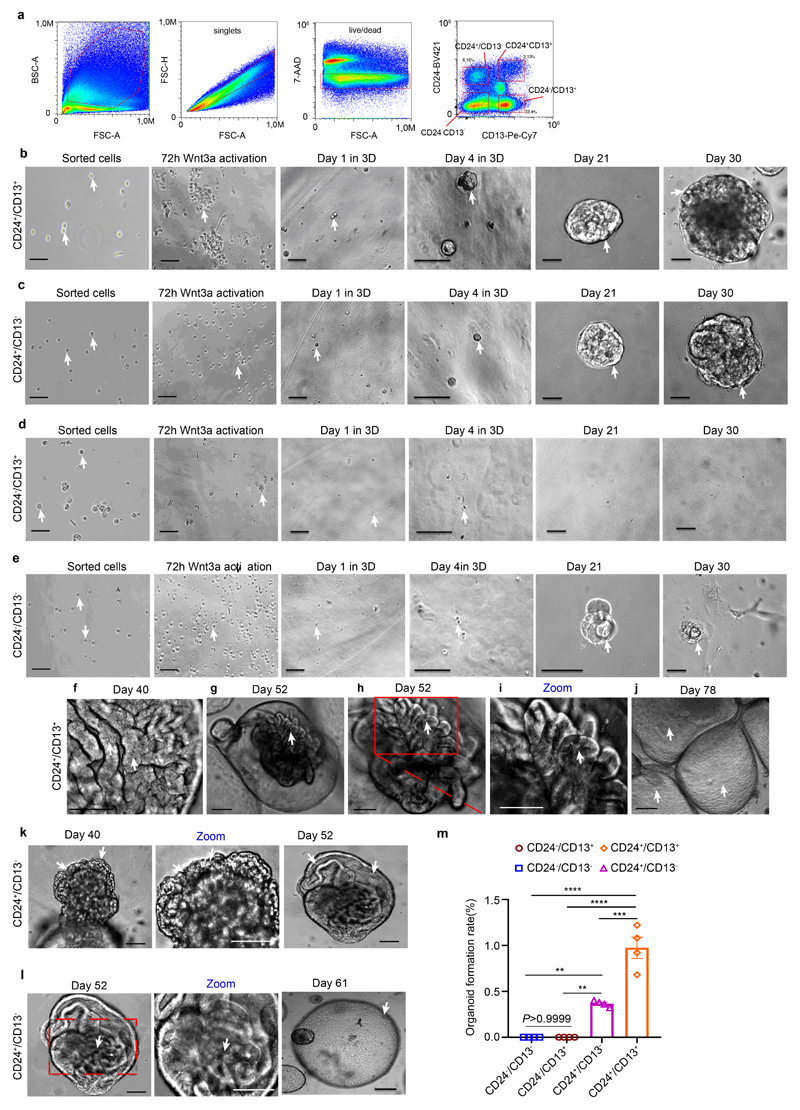
In summary, these data indicate that CD24+ cells are the origin of tubuloids and possess an increased in vitro growth and maintenance capacity compared to CD13+ PT cells. Since CD24+ cells can be found in several parts of the nephron we next asked if indeed their PT-S3/ LOH fraction (CD24+/CD13+) shows enhanced organoid formation rate as compared to other CD24+ cells (CD24+/CD13-) or CD13+ cells without CD24+ cells (CD24-/CD13+) or any other kidney cell type (CD24-/CD13-). Importantly, we observed organoid formation only from CD24+ cells (Extended Data Fig. 3a-l), with CD24+ cells from the PT and thin limb of the LOH (CD24+/CD13+) showing the best organoid formation rate as compared to CD24+ cells from any other location (CD24+/CD13-; Extended Data Fig. 3m).
Tubuloids represent mainly the proximal nephron
To understand the composition and differentiation of tubuloids, we next performed scRNA-seq from early (day 21) and late (day 97) tubuloids using the 4-phase protocol (Fig. 2a). Most tubuloid populations had a high expression of CD24 and CD13 (ANPEP) in line with their origin (Fig. 2f-i). The majority of cells (62.7%) in the early tubuloid were similar to the STC population in the human kidney (Fig. 1i) and characterized by expression of PT S3 markers such as PDZK1IP1 as well as markers of the thin limb of the LOH (descending thin limb, DTL; ascending thin limb, ATL; Fig. 2i; Supplementary Fig. 3a). The annotation was based on marker genes from the kidney precision medicine project (KPMP).16 We termed these populations tubuloid progenitor cells (TPC 1-3 and proliferating TPC) since these are the cells that form the largest parts of the tubuloids. We further detected smaller populations of DCT cells (DCT-like 1, DCT-like 2) characterized by SLC12A3 expression and two small populations that showed expression of PT and PEC marker genes (PT/PEC 1 and 2) (Fig. 2f and i, Supplementary Fig. 3a, Supplementary Notes).
Importantly, we only observed strong expression of genes that are associated with proliferation (MKI67, BIRC5, CDKN3) among the TPC populations (proliferating TPC) (Fig 2i). This suggested that primarily the PT (S3) and thin limb of the LOH derived cells sustain long-term growth in the tubuloids. In line with this, we primarily detected TPC and proliferating TPC (TPC1-5, prolif. TPC1-2) in the late-stage tubuloid (day 97, 97.9% of cells; Fig. 2g and i, Supplementary Fig. 3b). We further detected one small PT/PEC population in the late-stage tubuloid (Fig. 2g and i, Supplementary Fig. 3b, Supplementary Notes). We also performed scRNA-seq of a tubuloid generated from isolated CD24+ cells that were subjected to the published 1-phase protocol.6 Again, the majority of the cells (85.6%) showed a transcriptional marker profile of the PT S3 segment and the thin limb of the LOH and was thus annotated as TPC (TPC 1-7) and only TPC populations showed expression of proliferation marker genes (prolif. TPC 1-2) (Fig. 2h-i, Supplementary Fig. 3c). We further detected one population with a minor expression of SLC12A3 that we termed DCT-like 1 as well as one small PT/PEC population (Fig. 2h-i, Supplementary Fig. 3c, Supplementary Notes). Of note, due to de-differentiation the cell-type annotation within these organoids/tubuloids is difficult and similarly in the data reported by Schutgens et al.6 no classical marker genes are utilized for the cell-type annotation. However, using the reported KPMP guideline marker genes for the human nephron the annotation indicates that the majority of tubuloids are derived from CD24+ cells within the PT S3 and the LOH.
Tubuloids consist of functional polarized tubule epithelium
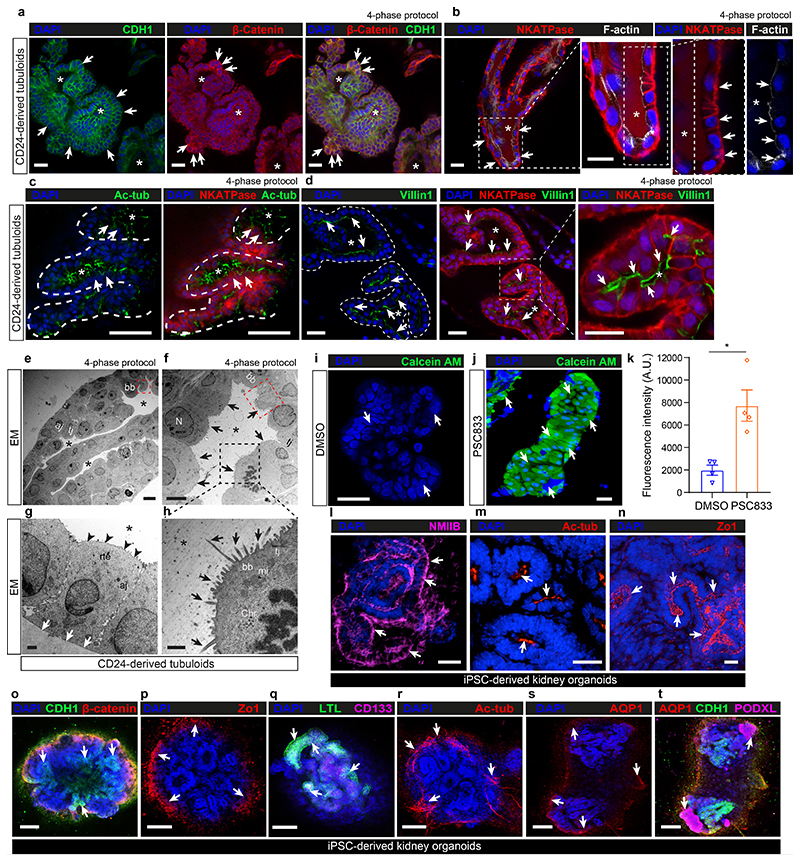
Immunostaining of tubuloids at day 21 confirmed that CD24+-derived tubuloids retain an epithelial differentiation and express E-cadherin (CDH1) and β-catenin (Fig. 3a, Supplementary Fig. 4a-b and f). Staining of the sodium potassium ATPase (NKATPase) showed a distinct basolateral pattern while F-actin was expressed at the apical side of the cells (Fig. 3b) indicating cell polarity within the tubuloids. Staining for acetylated tubulin indicated primary cilium formation at the luminal surface (Fig. 3c). We observed a Villin1 (VIL1) positive brush-border towards the lumen of the tubuloids (Fig. 3d). By electron microscopy, epithelial cells in the tubuloids showed typical features of human adult PT epithelium, including tight and adherens junctions, lumen formation and polarization (Fig. 3e-h). CD24+-cell-derived tubuloids showed Zonula occludens protein 1 (Zo1) expression (Supplementary Fig. 4c). Non-muscle myosin IIB (NMIIB), a motor protein interacting with the actin cytoskeleton was also strongly expressed in tubuloids (Supplementary Fig. 4d). The epithelium of the tubuloids also showed expression of CD133 and aquaporin 1 while the podocyte marker PODXL was not expressed (Supplementary Fig. 4e-f) as expected. The percentage of tubuloids that were positively stained for the markers described above was quantified, human kidney tissue was used as validation of staining (Supplementary Fig. 4g-h).
Fig. 3. CD24+-cell-derived tubuloids represent functional proximal tubules while iPSC-derived organoids represent various parts of the adult kidney.
a, Representative images of tubuloids (4-phase) derived from CD24+ cells stained for CDH1 (E-cadherin), β-catenin and DAPI (nuclei). Scale bar 50 μm. b, Representative images of tubuloids (4-phase) stained for Na+/K+-ATPase (NKATPase), apical filamentous actin (F-actin) and DAPI. Scale bar 50 μm. c, Representative images of tubuloids (4-phase) stained for basolateral acetylated tubulin (Ac-tub), Na+/K+-ATPase and DAPI. Scale bar 50 μm. d, Representative images of tubuloids (4-phase) stained for Villin1 (brush border) with Na+/K+-ATPase and DAPI. Scale bar 50 μm. e-h, Representative transmission electron microscopy (TEM) images of tubuloids (4-phase, day 21). Arrows mark cell borders and microvilli (h). N = nucleus; tj = tight junction; aj = adherens junction, bb = brush border, mi = mitochondria, chr = chromosome, rte = renal tubule epithelium; red dashed squares indicate bb; black dashed squares mark cilia. Black arrows mark the apical and white arrows the basolateral side of epithelial cells. Scale bars, 100 μm - e; 5 μm - f; 1 μm - g and h. i-k, Representative images (i-j) and quantification (k) of intracellular calcein-AM accumulation in tubuloids in the presence of the P-gp transporter inhibitor PSC833 or vehicle (0.2% DMSO). two-tailed unpaired t-test with Welch’s correction, n = 4 mean ± s.e.m., *P = 0.0207. Scale bars, 50 μm - i; 100 μm - j. l-t, Representative images of human iPSC-derived kidney organoids stained for NMIIB (l), acetylated tubulin (Ac-tub; m and r), Zo1 (n and p), CDH1 and β-catenin (o), CD133 and LTL (q), AQP1 (s) and AQP1 with podocalyxin (PODXL, t). DAPI was used to counterstain nuclei in all images. Scale bars, 50 μm: o-t; 25 μm. Stars in all images indicate renal tubule lumen(a-h). Arrows indicate positive stainings in immunofluorescent images (a-d, i, j, l-t). For details on statistics and reproducibility, see Methods.
P-glycoprotein (P-gp) is an ATP-dependent efflux transporter located at the apical membrane of the renal PT and can be blocked using the compound PSC833. To evaluate if CD24+-cell-derived tubuloids contain P-gp transporter function, we exposed them to PSC833, and then incubated with its substrate calcein-AM. Fluorescent calcein prominently accumulated in the tubuloids when P-gp efflux transport function of the tubuloids was inhibited by PSC833 (Fig. 3i-k), confirming activity of P-gp.
We next compared the adult kidney tubuloids with iPSC-derived kidney organoids (Fig. 3l-t). As expected, iPSC-derived organoids contained segments of tubule-like structures with expression of E-cadherin/β-catenin, and PT-like segments that stained positive for LTL and AQP1 (Fig. 3l-t) while various other parts did not stain for these markers. Zo1, NMIIB and acetylated tubulin were also detectable in tubule-like segments of iPSC organoids (Fig. 3l-t). In sharp contrast to the tubuloids, a population of epithelial cells in the iPSC-derived organoids expressed the podocyte marker podocalyxin (Fig. 3t). Taken together, we demonstrate a strictly tubule-epithelial origin and differentiation of tubuloids in contrast to iPSC-derived kidney organoids, which differentiate into various different parts of the kidney as well as other non-kidney off-target cell types.5
Modeling adult polycystic kidney disease in tubuloids
One key advantage of organoids is human disease modeling in the dish. While this has been successfully accomplished with hPSC-derived kidney organoids for certain disease states, tubuloids may constitute a more accurate model for the adult human tubule and do not contain early developmental stage cell-types or off-target cell-types from differentiation protocols.
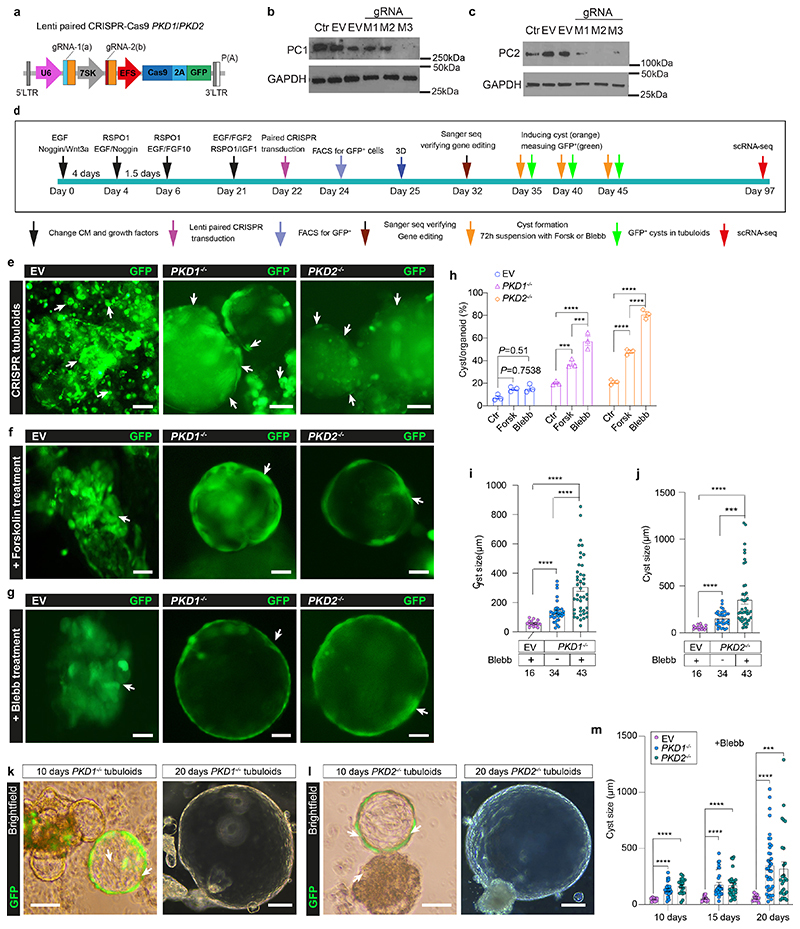
ADPKD is the most common hereditary kidney disease17 and accounts for about 10% of all end-stage renal disease patients. Mutations in two large multi-exon genes, PKD1 and PKD2, cause the disease. Tolvaptan has recently been approved for treatment, but potent and truly curative therapies with no or limited adverse effects are still missing. We therefore aimed to model ADPKD in tubuloids to develop an in vitro platform that resembles cyst formation. Since CRISPR/Cas9-induced insertions and deletions (indel) are often still in frame, which reduces knockout efficiency,18 we established a lentiviral multiplex CRISPR cloning vector (Supplementary Fig. 5a, Supplementary Fig. 6) for effective transduction of organoids and then used it to establish a paired CRISPR/Cas9 construct for targeting two locations of either the PKD1 or PKD2 gene locus (Fig. 4a, Supplementary Fig. 5b-c, Supplementary Fig. 7-8). We compared different promoter assembly strategies for the paired lentiviral PKD1 and PKD2 gene editing (Supplementary Fig. 5d-i; Supplementary Fig. 9-12). Western blot analysis indicated that a U6 and 7SK driven gRNA expression system led to sufficient knockout of PC1 protein (M3 clone, Fig. 4b) or PC2 protein (M2 and M3 clone, Fig. 4c) whereas using two U6 promoters for both gRNA pairs did not result in sufficient protein loss (M1 clone, Fig. 4b-c).
Fig. 4. Lentiviral paired CRISPR/Cas9 models adult polycystic kidney disease with rapid cyst formation in tubuloids.
a, Scheme of lentiviral paired CRISPR/Cas9. b-c, Representative Western blots of gene-edited tubuloids. M1-two U6 paired gRNAs, M2/M3-U6 and 7SK paired gRNAs; Ctr-none-transduction, EV-empty vector, GAPDH-loading control. Uncropped Western blot in Supplementary Fig. 18a-d. d, Timeline of gene-editing in tubuloids. e, Representative images of EV, PKD1-/-, PKD2-/- tubuloids at 10 days after transduction. Scale bar 100 μm, e-middle and right; 50 μm, e-left. f-h, Representative images (f-g) and quantification of cyst formation rate (h) using 2-way-ANOVA post-hoc Bonferroni in n = 3 mean ± s.e.m., non-significant for EV Forsk or Blebb vs Ctr; PKD1-/- Forsk vs Ctr, ***P = 0.0007; PKD1-/- Blebb vs Forsk, ***P = 0.0001; PKD1-/- Blebb vs Ctr and PKD2-/- Forsk or Blebb vs Ctr, Blebb vs Forsk, ****P <0.0001(h). Scale bar 100 μm, f-left, g-middle; 50 μm, f-middle and right, g-left and right. Ctr-DMSO. i-j, Quantification of cysts with Brown-Forsythe and Welch ANOVA test post-hoc Tamhane’s T2 in n = 43 PKD1-/- or PKD2-/-+Blebb, n = 34 PKD1-/- or PKD2-/- alone vs n = 16 EV+Blebb mean ± s.d.(i-j), ****P <0.0001 in PKD1-/- for Blebb vs alone, Blebb or alone vs EV(i), in PKD2-/- for Blebb or alone vs EV(j); ***P = 0.0004 in PKD2-/- for Blebb vs alone(j). k-l, Representative images of PKD1-/- (k) and PKD2-/- (l) at day 10 and 20 treated with Blebb. Scale bar 200 μm, right of k-l; 100μm, left of k-l. m, Statistical analysis of cysts using 2-way-ANOVA post-hoc Bonferroni, day 10 in n = 26 PKD1-/- or n = 21 PKD2-/- vs n = 9 EV mean ± s.d.; day 15 in n = 29 PKD1-/- or n = 26 PKD2-/- vs n = 11 EV mean ± s.d.; day 20 in n = 38 PKD1-/- or = 27 PKD2-/- vs =11 EV mean ± s.d., ***P = 0.0004, day 20 of PKD2-/- vs EV; ****P<0.0001, day 10 of PKD1- -/- or PKD2-/- vs EV, day 15 of PKD1-/- or PKD2-/- vs EV, day 20 of PKD1-/- vs EV. For details on statistics and reproducibility, see Methods.
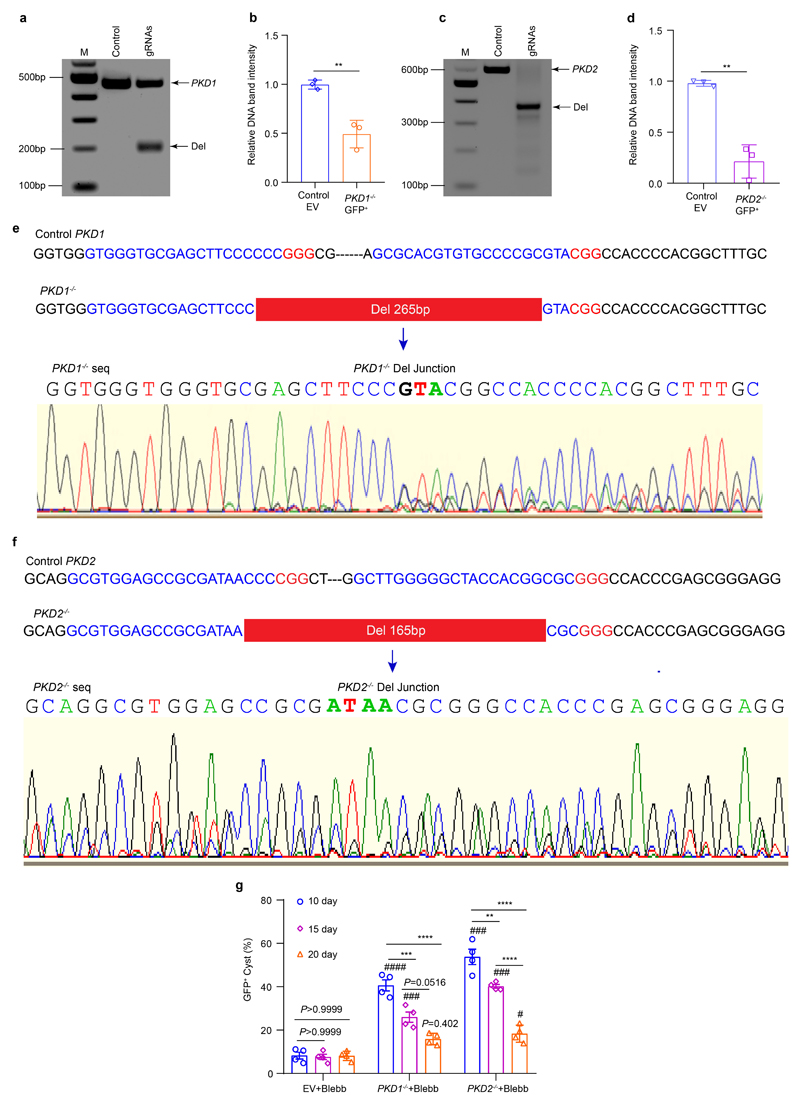
We therefore utilized U6- and 7SK-driven gRNA expression for gene editing of PKD1 and PKD2 in tubuloids and observed considerable GFP expression at 48 hours after transduction (Supplementary Fig. 13a). As control (EV) we utilized the same virus without gRNA. We verified transduction efficacy by flow cytometry (Fig. 4d-e Supplementary Fig. 13b-i). Efficient knockout was validated in sorted GFP+ cells from tubuloids at day 10 after transduction (Fig. 4d-e) by PCR (Extended Data Fig. 4a-d) and Sanger sequencing indicating a deletion of 265 bp in the PKD1 gene (Extended Data Fig. 4e, Supplementary Fig. 7) and 165 bp in the PKD2 gene (Extended Data Fig. 4f, Supplementary Fig. 8).
Cyst formation in PKD1-/- and PKD2-/- tubuloids
We noticed cyst formation in the paired PKD1 or PKD2 CRISPR/Cas9 transduced tubuloids at day 10 after transduction (Fig. 4e, Supplementary video 5). However, cyst formation rates remained very low at 9-20%. It has been reported that elevated renal cAMP levels promote cyst growth and the cAMP agonist forskolin can induce a rapid and dose-dependent cyst formation in organoids derived from PKD-/- hPSC.19 Furthermore, the myosin II ATPase inhibitor blebbistatin as well as removal of adherent cues reportedly increase cyst growth in hPSC-derived kidney organoids.19,20 Interestingly, we observed a significant increase of cyst formation rate by both substances using a suspension culture (Fig. 4f-h). Blebbistatin treatment yielded the highest cyst formation rate (Fig. 4h) and also increased the cyst size (Fig. 4i-j). Next, we also quantified the percentage of GFP+ cysts, which was significantly higher in gene edited PKD-/- tubuloids (40-50%, at day 10 after transduction as compared to control (Extended Data Fig. 4g, Supplementary Notes). We next asked whether blebbistatin treatment of tubuloids in 3D culture can affect subsequent cystgrowth in suspension culture. Interestingly, the cysts that originated from PKD-/- tubuloids exhibited an increase in size proportional to the timespan of prior blebbistatin exposure (Fig. 4k-m).
Cysts in PKD knockout tubuloids resemble human ADPKD tissue
Confocal analysis confirmed that cyst formation occurred in GFP+ cells of PKD-/- tubuloids, but not in control tubuloids (Supplementary Fig. 14a-j). The GFP signal intensity was increased within the cysts (Supplementary Fig. 14c). Cysts of PKD-/- tubuloids in the absence or presence of blebbistatin were formed by single or double lined epithelial cells, which co-stained for Zo-1 and NMIIB (Supplementary Fig. 14b-h) as well as E-cadherin (CDH1) and acetylated tubulin (Supplementary Fig. 14i-j). The cyst lining epithelial cells were oriented with the primary cilia towards the cyst lumen (Supplemesntary Fig. 14i). When comparing the cyst morphology of the gene-edited tubuloid with cysts in human ADPKD kidney tissue we observed striking similarities (Supplementary Fig. 15a-d).
Single-nucleus RNA sequencing of human ADPKD tissue
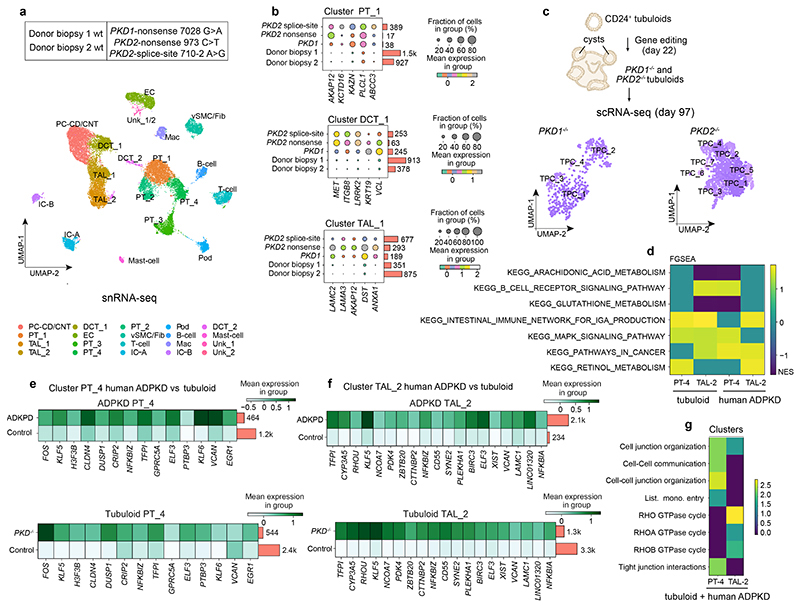
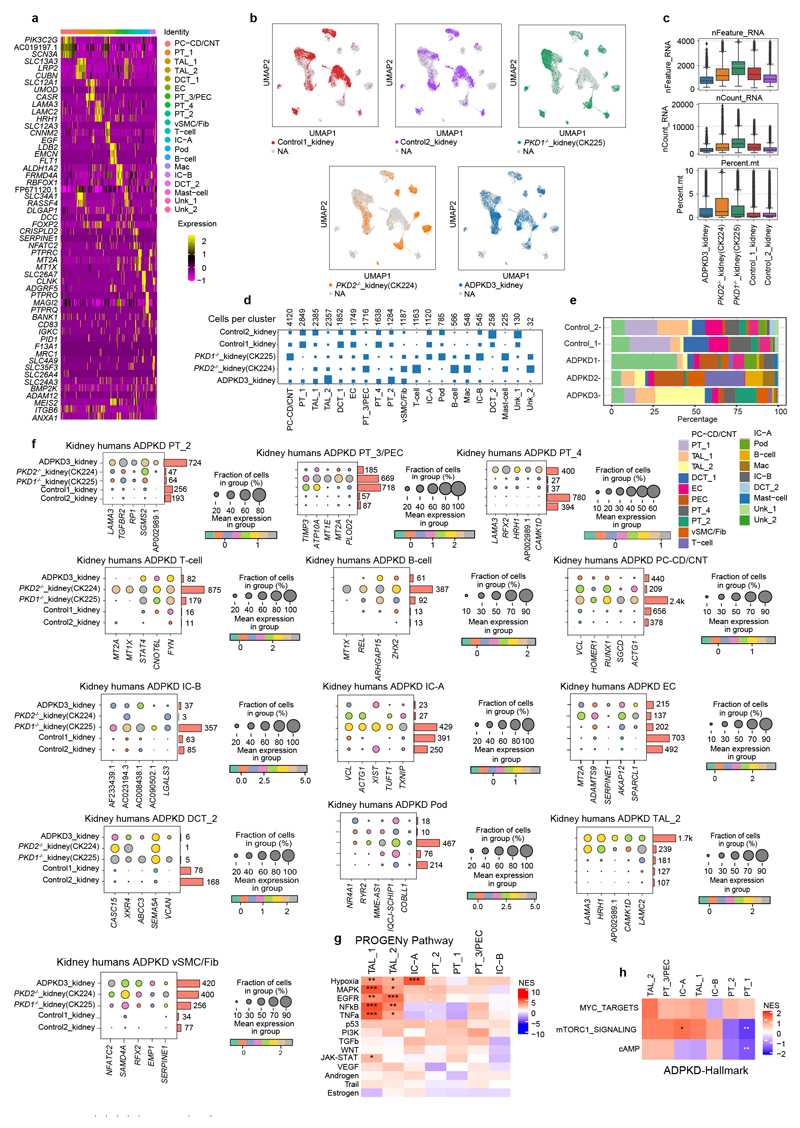
We next performed single-nucleus (sn) RNA-seq of human ADPKD tissue (n = 3 patients with PKD1 or PKD2 mutations) and two kidney donor biopsies as healthy controls (Fig. 5a, Extended Data Fig. 5a-c). We observed an enrichment of specific immune cell clusters in ADPKD (Extended Data Fig. 5d-e). Using differential gene expression analysis, we observed increased expression of genes with a proposed role in processes associated with ADPKD including upregulation of AKAP12 in PT and LOH, MET and LRRK2 in the DCT and VCL in DCT and collecting duct (Fig. 5b, Extended Data Fig. 5f, Supplementary Notes).
Fig. 5. Single-cell RNA sequencing of human ADPKD kidney tissue compared to healthy human kidney tissue and gene edited PKD1-/- and PKD2-/- tubuloids.
a, Overview of the human kidney tissue and PKD1/2 genotype used for single-nucleus RNA sequencing (snRNA-seq) and UMAP embedding of n = 26,509 single cells from the 5 human kidney samples. Labels refer to identified cell types. EC, endothelial cells; Mac, macrophages; Fib, fibroblasts; vSMC, vascular smooth muscle cells; PT, proximal tubular cells; Pod, podocytes; vSMC, vascular smooth muscle cells; IC-A/B, intercalated cells A/B; DCT, distal convoluted tubular cells; PC-CD/CNT, principal cells of connecting tubule/collecting duct; TAL, thick ascending limb tubular cells; unk, unknown. b, Top 5 upregulated genes in human ADPKD vs donor biopsies c, Scheme of gene editing and single-cell RNA sequencing (scRNA-seq) in tubuloids. UMAP embedding of n = 496 single cells from PKD1 gene edited tubuloids (4-phase, PKD1-/-)(middle) and n = 1,483 cells from PKD2 gene edited tubuloids (PKD2-/-)(right), tubuloid progenitor cells (TPC). d, Common dysregulated pathways obtained from gene set enrichment with KEGG pathway analysis using all differentially expressed genes in human ADPKD vs donor biopsies in PT-4 and TAL-2 cells with the cells of the tubuloids that mapped to PT-4 and TAL-2 using Symphony. e-f, Top selected commonly upregulated genes in human ADPKD vs donor biopsies and the cells that mapped to PT-4 (e) and TAL-2 (f) in gene edited tubuloids (PKD-/- tubuloids) vs control tubuloids. g, Gene set over-representation analysis with Reactome pathways for the common upregulated genes in human tissue (ADPKD vs donor biopsies) and tubuloids (PKD-/- vs control).
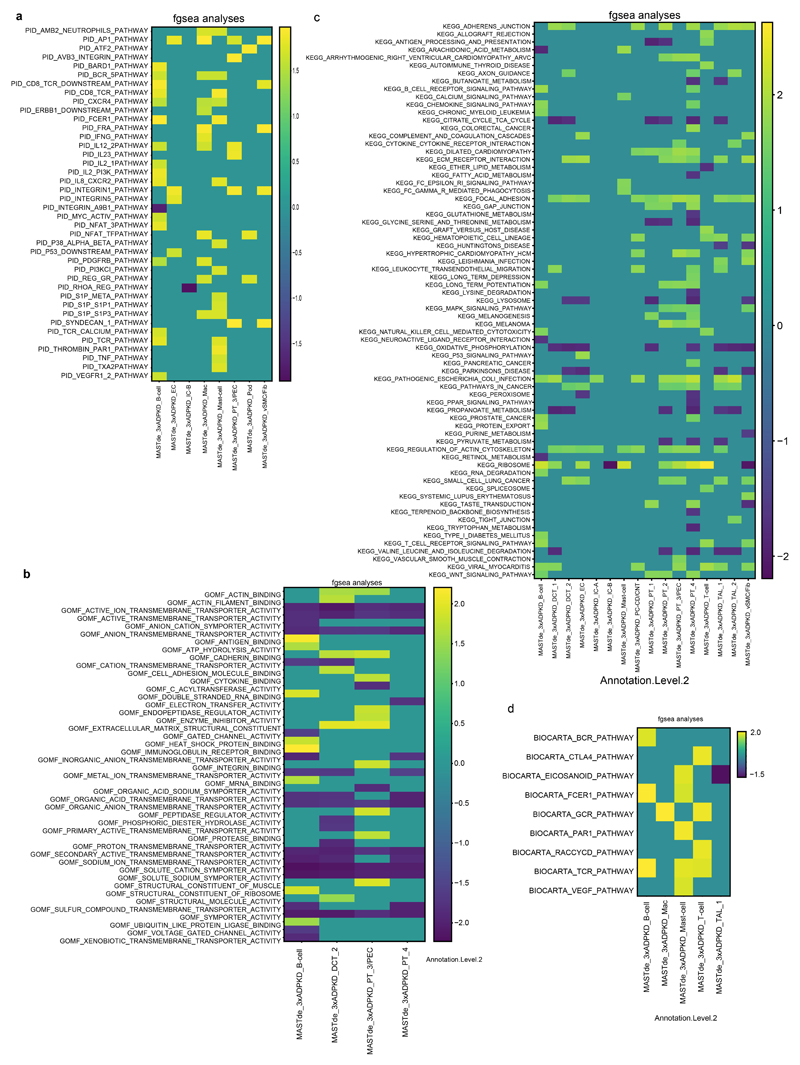
Using PROGENY, we observed increased hypoxia, MAPK, EGFR, NFkB and TNFα signaling activity particularly in LOH and collecting duct clusters of the human ADPKD tissue (Extended Data Fig. 5g). We detected increased expression of mTOR, MYC and cAMP target genes in several epithelial cell populations from the ADPKD tissue (Extended Data Fig. 5h), suggesting that these epithelial populations represent cyst-lining epithelial cells. Gene set enrichment and GO-Term analyses pointed towards pro-inflammatory pathways in various immune cell populations and enrichment of terms associated with cytoskeleton, focal adhesion, tight junctions as well as MAPK signaling in epithelial cell clusters (Extended Data Fig. 6).
Overrepresentation analysis of the ADPKD compared to the healthy kidney data pointed towards PI3-Akt and MET signaling in PT, PI3-Akt, BRAF, MAPK and RHO-GTPase signaling in DCT and MET, MAPK signaling among various other pathways in TAL and collecting duct epithelium (Supplementary Fig. 16). Many of these pathways have been reported as key players in ADPKD.21–24
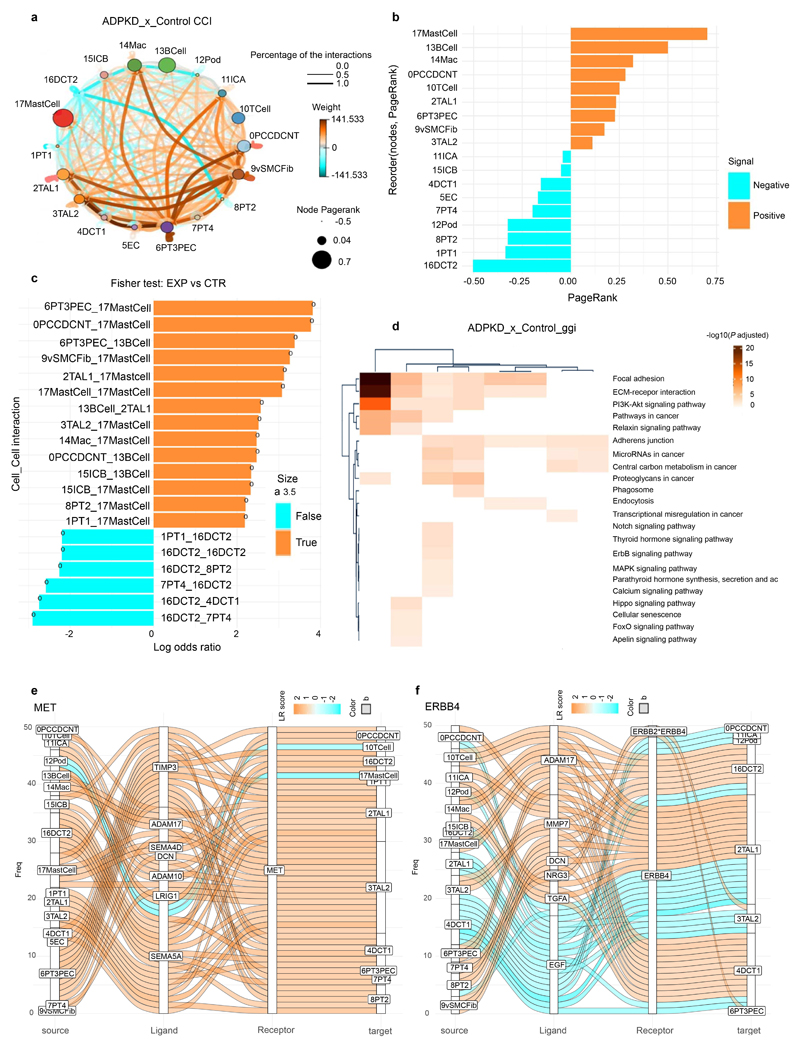
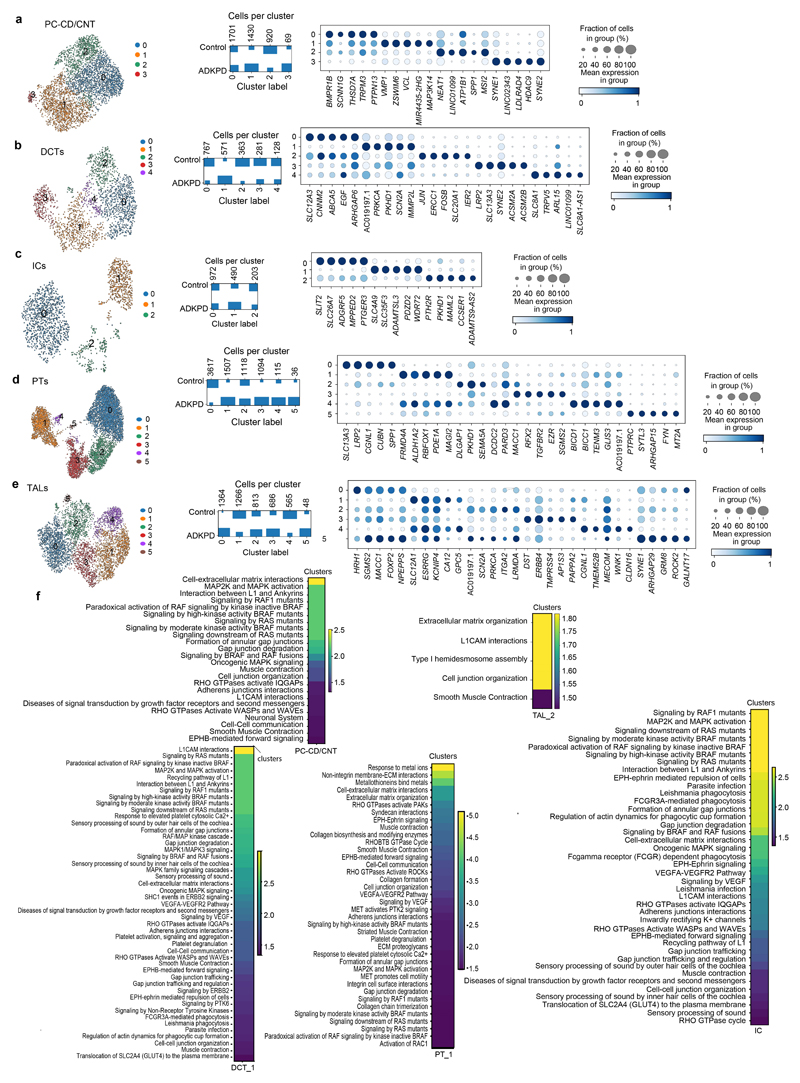
CrossTalkeR25 analyses indicated increased signaling between epithelial cell types and immune cells as well as fibroblasts in ADPKD (Extended Data Fig. 7a-f). We further performed subclustering analysis of the epithelial populations (Extended Data Fig. 8, Supplementary Notes). Overall, these data provide an unbiased snRNA-seq atlas of human ADPKD as compared to healthy human kidney.
Transcriptomic comparison between PKD tubuloids and human tissue
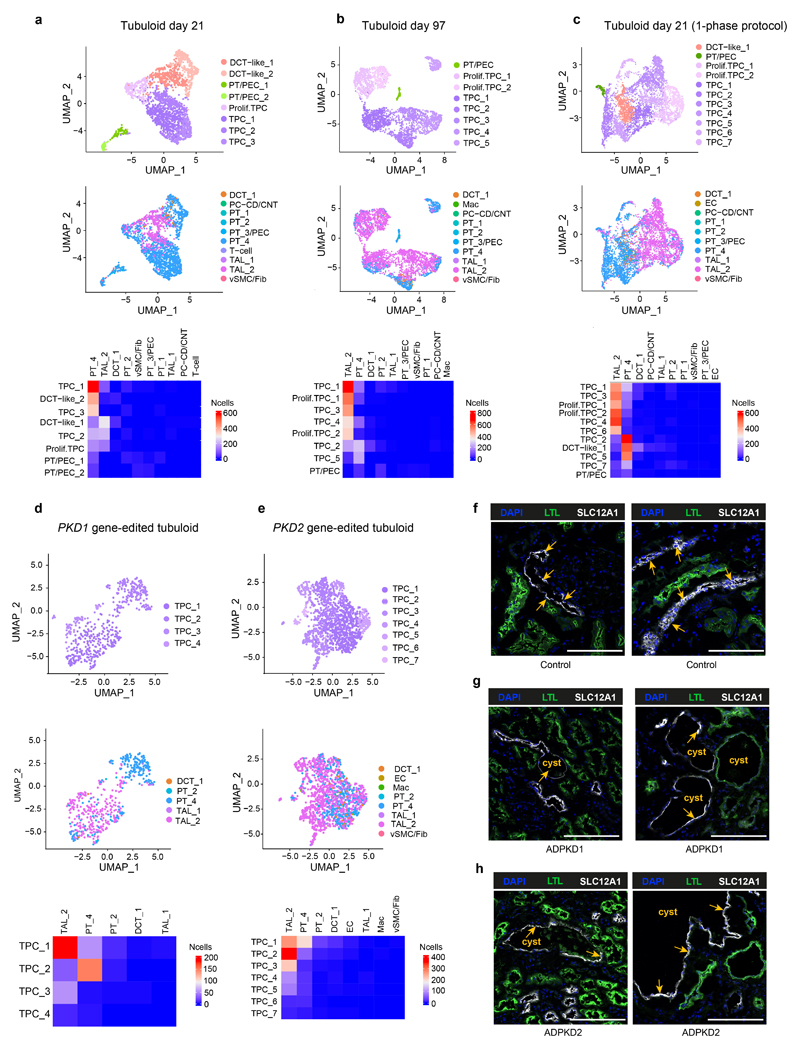
To compare the gene edited ADPKD tubuloid model to the human disease, we next performed scRNA-seq from tubuloids after transduction with the PKD1 or PKD2 paired CRISPR/Cas9 editing construct (Fig. 5c, Supplementary Fig. 17a-c). We mapped the tubuloid cell clusters to the human kidney tissue data using Symphony26 and observed that most tubuloid clusters map to PT_4 and TAL_2 (Extended Data Fig. 9a-e). This analysis also confirmed our annotation and indicated that tubuloids are mainly representing the proximal part of the nephron. Staining of human ADPKD kidney tissue indicated that cysts can also be derived from proximal parts of the nephron (Extended Data Fig. 9f-h) in line with the literature.27–29
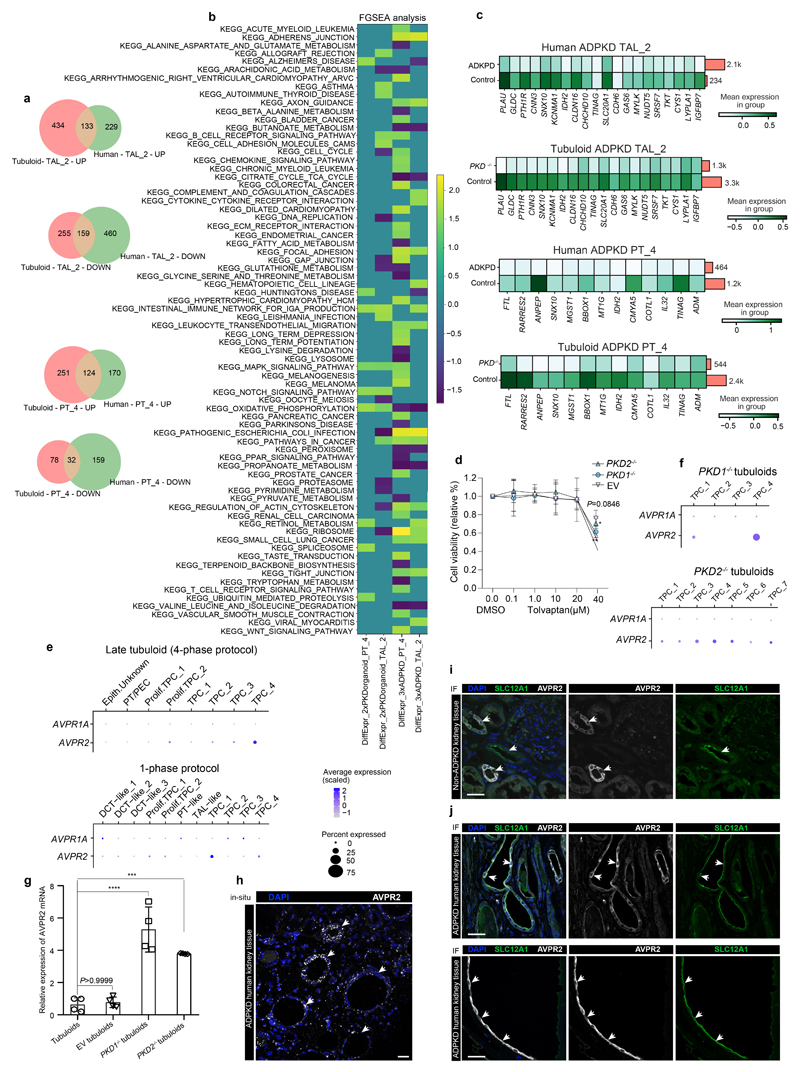
We then compared all genes that were differentially expressed in PT_4 and TAL_2 of the human tissue as compared to the cells that mapped to PT_4 and TAL_2 from the tubuloids (>94% of the tubuloid cells, Extended Data Fig. 10a). Common enriched pathways included MAPK signaling and Retinol metabolism, among others (Fig. 5d, Extended Data Fig. 10b). MAPK signaling has been reported to be active in cyst-lining cells and it has been suggested that cAMP could contribute directly to ERK activation via PKA, Rap-1 and B-Raf to promote cyst growth.23,30 Retinoic acid has been demonstrated to induce transcription of PKD131 and transgenic mice overexpressing a functional human PKD1 gene develop renal cysts.32,33
We next focused on the top common significantly and differentially expressed genes in PT_4 and TAL_2 between human tissue (ADPKD vs donor biopsies) and the tubuloid-derived cells that mapped to human tissue PT_4 and TAL_2 using Symphony. Among the common significantly upregulated genes in human disease and gene-edited tubuloids as compared to controls we identified SYNE2, PLEKHA1, BIRC3, RHOU, EGR1 (Fig. 5e-f, Supplementary Notes). Common downregulated genes included ANPEP, SLC20A1 and CDH6, among others, pointing towards epithelial dedifferentiation (Extended Data Fig. 10c).
To compare the common reactome terms enriched in PT_4 and TAL_2 we performed an overrepresentation analysis of the significantly common upregulated genes in gene-edited tubuloids and human disease. This analysis indicated enrichment of terms such as tight junction interaction, cell-junction organization in PT-4 and RHO-GTPase cycle in TAL-2 (Fig. 5g). Tight-junction composition has been reported to be altered in ADPKD34 and an impaired formation of desmosomal junctions has also been reported in ADPKD.35 Furthermore, work from several groups has demonstrated an important role of the Rho family of GTPases in cystogenesis.24,36
In summary, our data indicate that PKD1-/- and PKD2-/- tubuloids resemble human ADPKD cyst formation and cyst morphology and that some of the reported molecular mechanisms of ADPKD are also altered in the PKD-/- tubuloids. Of note, ADPKD in humans develops over many years in a heterogeneous environment with immune cells and inflammation as well as mesenchymal cells, perfusion and altered filtration which we are obviously lacking within the gene-edited tubuloids.
Tolvaptan reduces cyst size in ADPKD tubuloids
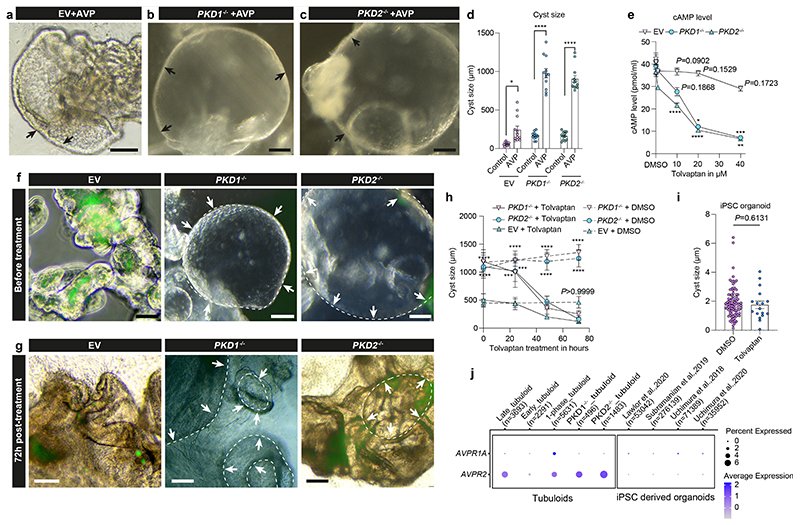
Increased intracellular cAMP levels play a central role in ADPKD and vasopressin promotes intracellular cAMP generation via its AVPR2 receptor. Tolvaptan has been demonstrated to lower cAMP levels as an AVPR2 antagonist resulting in reduced cyst growth and disease progression37. Incubation with AVP significantly increased growth of PKD-/- cysts (Fig. 6a-d) while we detected a dose dependent effect of tolvaptan on cAMP levels in PKD1-/- and PKD2-/- tubuloids (Fig. 6e). Based on these results and cytotoxicity data (Extended Data Fig. 10d) we next used a dosage of 15 μM tolvaptan to study a potential effect on cyst size. We observed a time-dependent effect of tolvaptan treatment on cyst size in both PKD1-/- and PKD2-/- tubuloids (Fig. 6f-h). Importantly, we did not observe an effect of tolvaptan treatment on iPSC-derived ADPKD cysts (Fig. 6i) in line with published experiments.38 The reason for this might be that AVPR2, the primary target of tolvaptan, is expressed in tubuloids while it is not expressed in iPSC-derived kidney organoids (Fig. 6j, Extended Data Fig. 10e-f). Interestingly, we detected an increased expression level of AVPR2 in PKD1-/- or PKD2-/- tubuloids as compared to control tubuloids (Extended Data Fig. 10g) in line with studies by Torres et al.39 and others40 showing upregulation of AVPR2 in ADPKD. Single-molecule fluorescence in situ hybridization (smFISH) and immunostaining suggested widespread AVPR2 expression in cyst-lining cells in human ADPKD tissue (Extended Data Fig. 10h-j).
Fig. 6. Gene-edited ADPKD tubuloids represent a platform for tolvaptan testing.
a-d, Representative images (a-c) and quantification of cyst size (d) in EV, PKD1-/-, PKD2-/- treated with AVP vs control. 2-way-ANOVA post-hoc Bonferroni in n = 12 mean ± s.e.m., *P = 0.0165 for EV+AVP vs control; ****P< 0.0001 for PKD1-/-or PKD2-/-+AVP vs control(d). Scale bars, 200 μm - b and c, 100 μm - a. e, Quantification of cAMP in EV, PKD1-/-, PKD2-/- treated with tolvaptan (0.1-40 μM) or DMSO (0.0) as control. 2-way ANOVA post-hoc Tukey in n = 3 mean ± s.d., compared to control 0.1 μM tolvaptan, P = 0.9779 in EV, P = 0.5354 in PKD1-/-, P >0.9999 in PKD2-/-; 1 μM tolvaptan, P = 0.4963 for EV, P = 0.5975 for PKD1-/-, P = 0.0956 for PKD2-/- non-significant for 10-40 μM tolvaptan in EV; 10 μM tolvaptan in PKD1-/-, P = 0.1868, PKD2-/-, ****P<0.0001; 20μM tolvaptan, *P = 0.0136 for PKD1-/-, ****P<0.0001 for PKD2-/-; 40 μM tolvaptan, ***P = 0.0007 for PKD1-/-, **P = 0.0015 for PKD2-/-. f-h, Representative images (f-g) and quantification (h) of EV, PKD1-/- and PKD2-/- subjected to tolvaptan or DMSO with different times. 2-way-ANOVA post-hoc Tukey in n = 3 mean± s.e.m., for tolvaptan treatment: 0.0 hour, ****P <0.0001 PKD1-/- vs EV, ***P = 0.0001 PKD2-/- vs EV; 24 hour, ***P = 0.0003 for PKD1-/- vs EV; ***P = 0.0002 for PKD2-/- vs EV; 48-72hour, non-significant in cyst size for PKD1-/- or PKD2-/- vs EV (P = 0.4014 for 48 h or P = 0.5268 for 72 h in PKD1-/- vs EV, P = 0.0818 for 48 h or P = 0.9403 for 72h in PKD2-/- vs EV). 24-72 hours for DMSO: ****P <0.0001 in PKD1-/- or PKD2-/- vs EV; comparing 72 hour post-treatment with before treatment: non-significant for EV; ****P <0.0001 for PKD1-/- or PKD2-/-(h). Scale bars, 200 μm - f and g. i, Quantification of cyst size in iPSC-derived ADPKD organoids (PKD2 gene editing) treated with tolvaptan or DMSO. n = 88 vs n = 17 mean ± s.e.m., two-tailed unpaired t-test. j, Expression of AVPR1A, AVPR2 in tubuloids and published scRNA-seq datasets from iPSC-derived organoids. For details on statistics and reproducibility, see Methods.
Discussion
Tubuloids have been recently reported as a tool to study human kidney epithelial homeostasis and disease.6 However, their exact cellular source in the human kidney remained unclear. In this study, we report that kidney tubuloids originate from CD24+ cells. Importantly, we could demonstrate that other renal cells are not able to generate tubuloids while CD24+ cells from the PT and LOH have the overall highest organoid formation capacity and outcompete CD24+ cells from other nephron parts in long-term tubuloid cultures. Human CD24+ cells maintain low oxygen metabolism in vitro and display a distinct gene-regulatory program with increased accessibility of various genes that have previously been associated with a progenitor-like phenotype. While early-stage tubuloids contained proximal and distal tubule cells with a potential minor contribution of PECs, only the S3 part of the PT and the downstream thin limb of the LOH ultimately expanded and formed the vast majority of late stage tubuloids with features of a functional and polarized tubule. We further demonstrate the use of a 4-phase tubuloid protocol that results in higher organoid formation rate and more tubules within a given organoid as compared to the published 1-phase protocol. Tubuloids generated with the 4-phase protocol presented here contain different parts of the tubule with PT, LOH and DCT at early time-points while we only identified PT and thin limb of the LOH at late time-points. The original tubuloid paper10 reports similar findings but also presence of collecting duct cells, which we did not observe. This difference might be due to the use of different marker genes for cell-type annotation or likely also by the different protocol with generation of tubuloids from purified CD24+ cells in our protocol as compared to culture of tubular fragments by Schutgens et al.10
hPSC-derived kidney organoids have recently emerged as a tool for disease modeling. However, these organoids still contain various cell types that lack kidney-specific differentiation (off-target). Transcriptionally, they also appear to represent an earlier developmental stage than the adult human kidney, as recently shown by scRNA-seq.5,20 Therefore, it is questionable if disease modeling in hPSC-derived kidney organoids generated by currently available protocols sufficiently mimic certain features of the adult human kidney situation and thus can serve for disease modeling, target identification and validation approaches. Kidney tubuloids derived from CD24+ cells may be more useful to model features of diseases such as ADPKD that originate from the tubule epithelium and thus can become a valuable translational tool to study disease mechanisms and identify novel therapeutics. Indeed, comparing snRNA-seq data from human ADPKD and control tissue and scRNA-seq of gene-edited PKD1-/- or PKD2-/- tubuloids suggests specific similarities within important pathways associated with cystogenesis. Furthermore, we could demonstrate that tolvaptan treatment reduces the cyst size in PKD-/- tubuloids while it does not affect the cyst size in iPSC derived PKD-/- kidney organoids.
Taken together, our data indicate that CD24+ cells are the source of kidney tubuloids and that these adult kidney tubuloids represent an advanced model of adult human polycystic kidney disease that will hopefully be useful for the development of interventional strategies.
Methods
Ethics statements and patient tissue collection
The study complies with all relevant ethical regulations and was approved by the Ethical board of the RWTH Aachen University (EK016/17) and the Erasmus Medical Center, Rotterdam (no. 196.927/2000/235, MEC20130-188). For full details on patients see Supplementary Methods.
Plasmid construction
The LentibbCas9v2eGFP vector was assembled using LentiCRISPRv2GFP originally developed by David Feldser’s laboratory (82416, Addgene) as a backbone. We used paired gRNAs for targeting exon 36 and 37 of PKD1 gene or exon 1 of the PKD2 gene. Lentiviral paired gRNA CRISPR/Cas9 engineering assembly was performed similarly to recent publications41 with some modifications: the first, gRNA-1 or gRNA-a was cloned into pX330 expression vectors, provided by Feng Zhang’s laboratory (42230, Addgene); gRNA-2 or gRNA-b was introduced into the ph7SK-gRNA expression vector, developed by Charles Gersbach’s laboratory (53189, Addgene), fragments containing gRNA-1 and 2 expression cassettes (or fragments including gRNA-a gRNA-b expression cassette) were then simultaneously transferred into upstream EFS promoter of LentibbCas9v2eGFP vector by Golden Gate assembly. For full details see Supplementary Methods.
Preparation of Wnt3a and RSPO1 conditioned media
Preparation of Wnt3a and RSPO1 conditioned media was performed similarly to previous studies42,43. For full details see Supplementary Methods.
Isolation of cells from human kidneys
Human nephrectomy tissue specimens were used to establish CD13+ and CD24+ primary cell culture and tubuloids. The tissue was dissected and minced. The fragments were digested by 1 mg/ml of collagenase (C-4-22, Millipore) in DMEM/F12 medium with DNase I (D5025, Sigma) plus 1/50 Liberase (540102001, Roche) for 45 minutes at 37 °C with 160 rpm using a thermal shaker. The digested fragments were passed through 70-μm and 40-μm cell strainers (352350, 431750, Corning). MACS isolation of CD24+ cells was performed using CD24 microBeads kit (130-095-951), CD13+ cells were the first labeled by biotin-conjugated mouse anti-human CD13 antibody (130-119-572) and then anti-biotin microBeads (130-090-485, Miltenyi Biotec). CD24+ cells or CD13+ cells were purified by positive selection with LS columns (130-042-401, Miltenyi Biotec). For fluorescence activated cell sorting (FACS), freshly isolated kidney single-cell suspension was first incubated with 5 μl of Human TruStain FcX™ (422302, Biolegend) in 100 μl of cell suspension at room temperature for 10 minutes, then incubated with Pe/Cy7 or BV421 anti-human CD24 antibody (#311120, #311122, Biolegend) and PE anti-human CD13 Antibody (#301704, Biolegend). Following this the cells were washed twice with Cell Staining Buffer (420201, Biolegend), resuspended in 500 μl of Cell Staining Buffer and sorted using an SH800 Cell Sorter (Sony, Biotechnology). For full details see Supplementary Methods.
Primary kidney tubular cell culture
Isolated CD24+ cells or CD13+ cells were seeded to T25 flasks in Advanced DMEM/F12 medium supplemented with 20 ng/ml EGF(AF-100-15, Peprotech), 500 ng/ml insulin (8923023, Sanofi) plus 1% B27 minus vitamin A, 1% penicillin/streptomycin, 1% L-glutamine, 20 mM HEPES (Thermo Fisher Scientific). The primary cell cultures were split after 7-8 days. The P2 cells were used for various experimental analyses.
Cell viability, metabolism assays and ATAC-sequencing
To optimize ATAC-seq library preparation with decreased mitochondrial DNA content and low cell numbers, we developed a two-step lysis method. 1,000-8,000 CD24+ cells or CD13+ cells were FACS sorted from human kidneys and centrifuged at 500g for 5 minutes. Pellets were then resuspended in 50 μl ice-cold hypotonic buffer, incubated for 3 minutes on ice and centrifuged at 500g for 9 minutes. Pellets were lysed in 50 μl lysis buffer plus 0.01% Digitonin, centrifuged at 500g for 9 minutes and resuspended in 50 μl of a transposase reaction mix, including 25 μl 2XTD buffer, 0.5 μl tagment DNA enzyme 1 and 24.5 μl nuclease-free water. The transposition reaction was incubated at 37 °C for 30 min. Following this the transposed DNA was purified and eluted in 15 μl nuclease free water. Transposed DNA was amplified by two rounds of PCR using NEBNext 2× Master mix with custom Nextera PCR primers. The quality of the library was checked by Agilent D1000 ScreenTape on 2200 TapeStation system. The ATAC-seq libraries of CD24+ or CD13+ primary kidney cells were loaded on Illumina NextSeq 500 for 75-bp paired-end sequencing. For full details see Supplementary Methods.
Adult kidney tubuloid culture
Freshly purified cells were plated into single wells of 12-well plates with 50% Wnt3a conditioned medium in Advanced DMEM/F12 medium supplemented with 50 ng/ml EGF, 5 ng/ml Noggin (120-10C, Peprotech), 10 μM Y27632 (S1049, Selleckchem) and 2% B27 minus vitamin A. At day 4 single cells were prepared using Accutase (A6964, Sigma) and resuspended at 5 × 10⁴ cells in 50 μl of 10% RSPO1 conditioned medium plus 50 ng/ml EGF, 5 ng/ml Noggin, 10 μM Y27632 and 2% B27 minus vitamin A, with 150 μl of Matrigel (356231, Corning) on ice. The cell-Matrigel mixture was transferred into tissue culture plates (40 μl/well in 24-well plates or 25 μl/well in μ-Slide 8-well chamber (80826, ibidi)). After 36-48 h, the RSPO1/EGF/Noggin conditioned medium was replaced by organoid differentiation medium composed of 10% RSPO1 conditioned medium supplemented with 100 ng/ml FGF10 (100-26, Peprotech), 50 ng/ml EGF and cultured for 15 days, with a medium exchange every 2-3 days. For long-term culture, the tubuloids were grown in maintenance medium consisting of Advanced DMEM/F12 supplemented with 50 ng/ml EGF, 50 ng/ml FGF2, 100 ng/ml IGF1, 500 ng/ml of Insulin, 2 % B27 minus vitamin A. For full details see Supplementary Methods.
iPSC-derived kidney organoid differentiation and staining
hPSC stocks were maintained in mTeSR1 medium with daily medium changes and weekly passaging using Accutase or ReLeSR (STEMCELL Technologies, Vancouver). For differentiation into organoids, iPSCs (WTC-11 cell line, Coriell # GM25256) bearing knockout mutations in PKD2 were plated at 2,000 cells/well in 24-well plates, or 200 cells/well in 384-well plates, pre-coated with 300 μl of DMEM-F12 containing 0.2 mg/ml Matrigel and sandwiched the following day with 0.2 mg/ml Matrigel in 500 μl of mTeSR1 (STEMCELL Technologies, Vancouver) to produce scattered, isolated spheroid colonies. Coating and plating of 384-well plates was performed using a Matrix Wellmate liquid handling robot. 48 h after sandwiching, hPSC-derived spheroids were treated with 12 μM CHIR99021 (Tocris Bioscience) for 36 h in 1,000 μl of Advanced RPMI + 1× Glutamax + Pen-strep (all from Thermo Fisher Scientific), then changed to RB (Advanced RPMI + 1× Glutamax + 1× B27 Supplement, all from Thermo Fisher Scientific). For full details see Supplementary Methods.
Real-time RT-qPCR
Total RNA was purified from primary kidney cells or tubuloids using RNeasy MiniKit (74104, Qiagen). 500 ng of RNA was used as a template to synthesize cDNA with SuperScript III First-Strand Synthesis System (18080051, Thermo Fisher Scientific). Quantitative RT-qPCR was performed in quadruplicates with cDNA (1:10 dilution), 300 nM primers and iTAQ SYBR Green Supermix (172-524, Bio-Rad) using CFX Connect Real-time PCR Detection System (Bio-Rad). GAPDH was used as the housekeeping gene. For full details see Supplementary Methods.
Transmission electron microscopy
The tubuloids were embedded in pure Epon and polymerization of Epon was performed at 90 °C for 2 hours. Ultrathin sections were cut using ultramicrotome (Reichert Ultracut S, Leica, Wetzlar, Germany) and contrast was enhanced by staining with 0.5% uranyl acetate and 1% lead citrate (both EMS, Munich, Germany). The sections were visualized using an acceleration voltage of 60 kV using a Zeiss Leo 906 transmission electron microscope (Carl Zeiss, Oberkochen, Germany). For full details see Supplementary Methods.
P-gp transport assay
Tubuloids were disrupted using a P200 pipette and cultured overnight with 5 μM P-gp inhibitor PSC-833(4042, Tocris) in organoid maintenance medium or 0.2% DMSO in organoid maintenance medium as control. After washing in Hank’s buffer (14025050,Gibco) tubuloids were treated with 1 μM calcein-AM (C1430, Invitrogen) in Hank’s buffer supplemented with 5 μM P-gp inhibitor or 0.2% DMSO for 1 hour at 37 °C. After washing tubuloids were fixed in 4% PFA, and counterstained by 1 μg/ml DAPI for 15 minutes. P-pg transport image analyses were performed on a LSM 710 (Zeiss). For full details see Supplementary Methods.
PKD gene editing in tubuloids
Lentiviral particles were produced by transfecting 293FT (R70007, Thermo Fisher Scientific) grown in 60-mm dishes with 1 μg lentiviral paired CRISPR/Cas9, 750 ng psPAX2(12260, Addgene) and 250 ng pMD2.G(12259, Addgene) using TransIT-LT1 (MIR 2300, Mirusbio). The filtered virus containing supernatants were used for infecting tubuloids. For full details see Supplementary Methods.
Western blotting
Cells were lysed in RIPA buffer boiled at 95 °C for 5 min. And after quantification loaded to 4-15% mini-Protean TGX gel (4568086, Bio-Rad) and transferred to PVDF membranes (162-0177, Bio-Rad). The membranes were blotted for polycystin-1, rabbit polyclonal antibody (1:2,000, ABT128, Millipore) or polycystin-2, mouse monoclonal antibody (1:1,000, sc-47734, Santa Cruz Biotechnology). GAPDH was used for loading control, mouse monoclonal antibody (1:2,000, NB300-221, NovusBio). For full details see Supplementary Methods.
Cytogenesis assays
PKD1-/-, PKD2-/- and EV tubuloids were plated to 24-well plate or μ-Slide 8-well chambers as above and cultured in 3D culture system with EGF/FGF2/IGF1/insulin in RSPO1 conditioned medium. Cysts were counted at 4× magnification (smaller cysts were confirmed by 10× or 20× magnification) using Nikon Eclipse Ts2 inverted microscope at day 21 after initiating 3D culture. Chemical cyst formation was stimulated by liquid-handling robots as described previously19,20 with some modifications. In detail, tubuloids were cultured in 3D with EGF/FGF2/IGF1/insulin conditioned medium and moved to 48-well plates in suspension culture on 10, 15 and 20 day of 3D culture after transduction, respectively. 5 μM forskolin or 10 μM blebbistatin were added to culture in suspension and incubated for 72 h with a medium exchange every 2-3 days. The cysts were imaged using a Nikon Eclipse Ts2 inverted microscope, cyst size was quantified using Fiji-ImageJ. For full details see Supplementary Methods.
Immunostaining and imaging
For whole-mount staining of tubuloids samples were washed in PBS and fixed with 4% PFA in a μ-Slide 8-well chamber for 20 min. After blocking in 5% normal donkey serum at RT for 1 h tubuloids were incubated with primary antibodies in antibody dilute buffer (0.3% Triton X-100 and 1% BSA in PBS) at 4 °C overnight, followed by washing and incubation at 4 °C overnight with the secondary antibodies and subsequent DAPI staining (1mg/ml at 1:1,000). For immunofluorescence staining of paraffin sections, the sections were deparaffinized and rehydrated, then antigen retrieval was performed using a microwave in 1× Antigen Unmasking Solution (H-3300, Vector labs) and staining using standard protocols. For full details see Supplementary Methods.
RNA in-situ hybridization
ISH was performed as previously described44. For full details see Supplementary Methods.
Cell viability assay
CellTiter-Glo 3D cell viability assay was used as previously described with some modifications45. For full details see Supplementary Methods.
cAMP assay
PKD-/- tubuloids and EV tubuloids were cultured in organoid growth medium supplemented with 1 μM AVP. After a 3-day incubation with AVP, 5 different doses (0.1-40 μM) of tolvaptan dissolved in DMSO or DMSO (vehicle) were added in triplicates. To measure intracellular cAMP level, 72-hour treated PKD-/- tubuloids and EV tubuloids were harvested, and pelleted at 300g for 5 minutes, then incubated in 500 μl of Cell Recovery Solution on ice for 1 hour. The cells were counted in organoid growth medium via a hemocytometer and subsequently washed twice in PBS. 1 × 10⁵ cells from each condition were transferred into 1.5-ml tubes, washed 3 times in PBS, resuspended in 125 μl of 1× Cell Lysis Buffer and frozen at-20 °C. Following two additional freeze-thaw cycles cells were centrifuged at 600g (4 °C) for 10 minutes and the supernatants were carefully transferred into 96-well plates. The cAMP levels were measured at 450 nm in a plate reader (Cytation 5, Biotek, Berlin, Germany) and assessed according to the manufacturer’s instruction of cAMP Parameter assay kit (KGE002B, R&D Systems, Wiesbaden-Nordenstadt, Germany).
Time-course imaging of cyst-size post-tolvaptan treatment
PKD1 and PKD2 gene-edited tubuloids and EV tubuloids were cultured in organoid growth medium supplemented with 1 μM AVP as described above. After a 3-day incubation of tubuloids with AVP the tubuloids were treated with tolvaptan or DMSO (vehicle) in triplicates. For time-course imaging the tubuloids were treated with 15 μM tolvaptan or DMSO plus 1 μM AVP in triplicates. Images were taken on an inverted Nikon ECLipse, Ts2-FL (Tokyo, Japan) immediately pre-treatment and at 24 hours, 48 hours and 72 hours post-treatment.
Single-cell RNA-seq of tubuloids
Single-cell suspension of tubuloids and primary human kidney cells were run on a Chromium Single Cell Chip kit with subsequent library preparation using 10x Genomics reagents (PN-120236, PN-120237, PN-120262). The library quality was determined using D1000 ScreenTape on the 2200 TapeStation system (Agilent Technologies). Sequencing was performed on an Illumina Novaseq platform using S1 and S2 flow cells. For full details see Supplementary Methods.
Nuclei isolation
For snRNA-seq, nuclei were isolated with Nuclei EZ Lysis buffer (NUC-101; Sigma-Aldrich) supplemented with protease inhibitor (Roche) and RNase inhibitor AM2696, Life Technologies). Samples were homogenized using a Dounce homogenizer (885302-0002; Sigma-Aldrich) in 1 ml of ice-cold Nuclei EZ Lysis buffer, and incubated on ice for 2 min with an additional 1 ml of lysis buffer. The pellet was resuspended, washed with 4 ml of buffer. Following centrifugation, the pellet was resuspended in nuclei suspension buffer (1× PBS, 1% bovine serum albumin, 0.1% RNase inhibitor). For full details see Supplementary Methods.
Genotyping of PKD1 and PKD2 genes from ADPKD kidney tissue
For analysis of the PKD1 (NM_001009944.3) and PKD2 (NM_000297.4) gene a custom targeted NGS panel was used. Library preparation was done with the Lotus™ DNA Library Prep Kit and a probe-based capture protocol was used to enrich target regions (IDT, Custom Gene Panel). Subsequent sequencing of pooled libraries was performed on a MiSeq sequencing platform (Illumina). Annotation and bioinformatic prioritization of variants was performed using KGGSeq (v1.0, http://pmglab.top/kggseq/index.htm). For full details see Supplementary Methods.
Analysis of ATAC-seq data
Generation of fastq files and adapter removal were completed with the Illumina software bcl2fastq (v2.20) [https://support.illumina.com/sequencing/sequencing_software/bcl2fastq-conversion-software.html]. Library complexity was evaluated with Preseq (version 2.0)46. Sequence quality control was performed with FastQC (http://www.bioinformatics.babraham.ac.uk/projects/fastqc). Reads were aligned to the human reference genome (GRCh38/hg38) using bwa (version 0.7.17)47 with default parameters. Mitochondrial reads were filtered out using samtools48 (version 0.1.19). Peak calling was performed using common software MACS2 (version 2.2.5).49 BigWig track files for visualization of peaks in genome browsers were generated using the rtracklayer package (version 1.44.2)50 and normalized with 1 Million as scaling factor. After generating a merged peak file from all samples, peaks annotation was performed using ChIPseeker (version 1.20.0)51. For downstream analysis only peaks overlapping a 1-kb region around a TSS were selected. The featureCounts software from the Rsubread package (version 1.34.7)52 was used to count reads mapping on a region overlapping the selected peaks. Analysis of differential chromatin accessibility was performed using DESeq2 (version 1.24.0)53. For full details see Supplementary Methods.
Analysis of single-cell and single-nucleus RNA-seq data
Demultiplexing and alignment was performed using the cellranger mkfastq utility with the default/mandatory parameters. FastQ files were aligned to the human reference genome (GRCh38 assembly) and the UMI expression was quantified using CellRanger (10x Genomics, version 3.1). The dataset was analyzed using the Seurat R package (version 3.1.0)54. The cell type assignment among the resulting cell clusters was manually curated. For this, gene specificity scores and gene conditional probabilities for each cluster were obtained using genesorteR (version 0.3.1)55. The human tissue samples were integrated using Harmony (v.1.0) with default parameters and considering every sample library and laboratory as an individual batch56. Differentially expressed genes were tested by pseudo-bulking expression profiles56. Each subset of pseudo-bulk profiles were processed separately by a filtering step of lowly expressed genes, Trimmed Mean of M-values normalization57. Then the count data was fitted using the negative binomial generalized linear model with quasi-likelihood dispersion estimation, and tested for differences using the edgeR quasi-likelihood pipeline (v.3.26.7)58. Differentially expressed genes were considered at a false discovery rate of 5% after multiple testing correction. The enrichment of biological pathways were tested using fgsea (v.1.0.1)59, with an ad-hoc collection of gene sets related to ADPKD (MYC targets, mTOR1 signaling and cAMP) from MSigDB60, on the ranking of differential expression of each cystic cell population. Footprint-based pathway activity was estimated using PROGENy61,62, applied on the ranking of differential expression. MAST (v1.10.0) was used to find differentially expressed genes in each major cluster and perform gene-set enrichment analysis with KEGG, REACTOME, PID and BIOCARTA, and over-representation analysis of up-regulated genes in ADPKD cells as compared to control cells as described below. To compare cell types found in the human tissue to the tubuloid cells from the organoids, Symphony (v.0.1.0)26 was used to compress the integrated reference of the human tissue samples, which was created with Harmony before. Ligand-receptor analysis was performed using the CellphoneDB method implemented in LIANA63, followed by Crosstalkr64 to identify most relevant ligand receptor pairs per condition. For full details see Supplementary Methods.
Statistical Analysis and Reproducibility
Data are presented as mean ± s.e.m. if not specified otherwise in the legends. Comparison of two groups was performed using unpaired t-test. For multiple group comparison one-way ANOVA with Bonferroni’s multiple comparison test was applied or two-way ANOVA with Bonferroni or Tukey’s multiple comparisons test. Statistical analyses were performed using GraphPad Prism 8 (GraphPad Software Inc., San Diego, CA), a P value of less than 0.05 was considered significant. The number of samples for each group was chosen on the basis of the expected levels of variation and consistency. The depicted RNAscope, immunofluorescence micrographs and western blot micrographs are representative. All studies were performed at least twice, and all repeats were successful.
Extended Data
Extended Data Fig. 1. Metabolism and DNA accessibility in CD24+ cells as compared to CD13+ cells.
a-b, Cellular glycolysis and proton efflux rate (PER) of CD24+ cells as compared to CD13+ cells. Statistical analysis in n = 12 mean ± s.e.m. (a-b), 2-way ANOVA post-hoc Bonferroni, non-significant for post 2-deoxy-D-glucose (2-DG, a glucose analog that inhibits glycolysis) in CD24+ cell vs CD13+ cells, P = 0.1834 (b); Basal glycolysis and comp glycolysis (compensatory glycolysis) in CD24+ cells vs CD13+ cells, ****P < 0.0001. c, ATP-linked versus basal oxygen consumption rate (OCR) between CD24+ cells and CD13+ cells in n = 12 mean ± s.e.m., P = 0.7041, non-significant using a two-tailed (also called two-sided) unpaired t-test with Welch’s correction. d, Spare respiratory capacity (SRC) of CD24+ cells compared to CD13+ cells, n = 12 mean ± s.e.m., ****P <0.0001 by a two-tailed unpaired t-test with Welch’s correction. e-f, Extracellular acidification rates (EACR) of CD24+ cells compared to CD13+ cells during anaerobic glycolysis. n = 12 mean ± s.e.m.(e-f), 2-way-ANOVA with post-hoc Bonferroni, non-significant, P = 0.053 for Post 2-DG in CD24+ cells vs CD13+ cells, ****P <0.0001 for Basal, Compensatory glycolysis and 2-DG in CD24+ cells vs CD13+ cells(f). g-h, Extracellular acidification rates (EACR) in CD24+ cells compared to CD13+ cells during aerobic mitochondrial respiration. n = 12 mean ± s.d. (g-h), ****P <0.0001 for Basal, Oligomycin-ATP-linked, FCCP, and non-Mito-Rot/AA in CD24+ cells vs CD13+ cells by 2-way-ANOVA with post-hoc Bonferroni(h). i, FACS gating for sorting of CD13+ or CD24+ cells. j, Scaled heat map showing the chromatin accessibility of top 50 most accessible promoter regions in CD24+ cells or CD13+ cells. k, Top 25 upregulated and downregulated GO terms in CD24+ cells versus CD13+ cells based on the genome-wide measured chromatin accessibility by ATAC-seq.
Extended Data Fig. 2. Wnt3a/RSPO1 activated growth and expansion of CD24+ cells.
a-d, Representative images and quantification of cell-cluster sizes of Wnt3a conditioned medium (CM) treated CD24+ cells compared to CD13+ cells at 72 hours. Statistical analysis in n = 7 mean ± s.e.m., **P = 0.0045 by two-tailed t-test with Welch’s correction(c); CD24+ cells formed large cell clusters before Wnt3a was removed at day 4 (d). Scale bars 100 μm-a and b; 50 μm-d. e-f, Expansion of CD24+ cells into early tubuloids at day 6, which subjected to 4-phase protocol under Wnt3a/RSPO1 conditioned medium (e); CD13+ cells that subjected to 4-phase protocol under Wnt3a/RSPO1 conditioned medium, did not produce tubuloids and presented as loose cell-aggregates with vacuole formation (f). Scale bar 50 μm: e and f. g, Representative images of CD24+ cell derived organoid formation at day 7, 12, 17, 21 as well as organoid growth maintenance at day 30 and day 69, which were subjected to the 1-phase protocol published by Schutgens et al. Scale bar, 200 μm: day 21, 30, 69; 100 μm: day 0, 7, 17; 50 μm: day 12. h, Representative image of CD24+ cell derived organoid formation at day 21 that was subjected to the 4-phase protocol. Scare bar 50μm. i-j, Schematic (I) and representative images of CD24+ cells subjected to a tubuloid protocol without WNT3a/RSPO1(j). In the schematic, a FGF2, FGF10 stability factor (SF), heparin was used in this protocol, stability factor (SF) represents heparin (i). Scale bars 200 μm-m at day 30, 73; 100 μm-m at day 0, day 14; 50 μm-m at day 5, 8, 12 (j). k, Organoid formation rate comparison between CD24+ cell subjected to the 4-phase protocol without Wnt3a/RSPO1 (i-j) and the original 4-phase protocol, n = 4 mean ± s.e.m with two-tailed unpaired t-test with Welch’s correction, ***P = 0.0003. Arrows mark borders of tubuloids. Wnt-Wnt3a; RS-RSPO1. For details on statistics and reproducibility, see Methods.
Extended Data Fig. 3. CD24+ cells are the cellular origin of adult kidney tubuloids.
a, FACS gating for sorted CD24+/CD13+, CD24+/CD13-, CD24-/CD13+ and CD24-/CD13- cells. b-e, Representative bright field images of sorted CD24+/CD13+(b); CD24+/CD13-(c); CD24-/CD13+(d) and CD24-/CD13- cells (e) subjected to the 4-phase organoid formation and expansion protocol. Note that only the populations, that contain CD24+ cells were able to form tubuloids (b, c). Arrows mark cells, borders of nephrospheres or tubuloids. Scale bar 100 μm-b-e: sorted cells, 72h Wnt3a, Day 1 in 3D; 50 μm-b-e: Day 4 in 3D, Day 21, Day 30. f-l, Representative DIC (differential interference contrast) images exhibited growth and expansion of tubuloids from CD24+/CD13+ cells(f-j) and CD24+/CD13- cells(k-l). h represents a zoom from g. Red square marks tubuli in a tubuloid at day 52. Arrows mark cells, borders of tubuli or tubuloids. Scale bars, 200 μm: j;100 μm: g, l at -day 61; 50 μm: f, h, i, k at day 40, l at day 52, l -zoom in. m, Comparison of tubuloid formation rates in CD24+/CD13+, CD24+/CD13-, CD24- /CD13+ and CD24-/CD13- cells. Statistical analysis was performed by 2-way ANOVA with post-hoc Bonferroni correction in n = 4 mean ± s.e.m., non-significant, P >0.9999 for CD24-/CD13- vs CD24-/CD13+; **P = 0.0077 for CD24+/CD13- vs CD24-/CD13+ or CD24-/CD13-; ***P = 0.0002 for CD24+/CD13+ vs CD24+/CD13-; ****P <0.0001 for CD24+/CD13+ vs CD24-/CD13+ or CD24-/CD13- cells. Arrows mark cells, borders of cells or tubuloids.
Extended Data Fig. 4. Gene-editing resulted in a precise deletion within the human PKD1 or PKD2 gene.
a-d, Representative images of a horizontal agarose gel electrophoresis for PCR amplified DNA fragments of the target region using sorted GFP+ cells from PKD1-/-, PKD2-/- and control (lentibbCas9v2eGFP) tubuloids at day 7 of transduced tubuloids in 3D (day 10 after transduction, a and c), quantification of the knockout efficiency from paired gRNA gene editing of PKD1 gene (b) and paired gRNA gene editing of PKD2 gene (d) by measurement of the relative band intensity. Statistical analysis was performed by two-tailed unpaired t-test with n = 3 mean ± s.d., **P = 0.0041 in PKD1-/- tubuloids vs control (b); and n = 3 mean ± s.d., **P = 0.0013 in PKD2-/- tubuloids vs control (d). Uncropped DNA gel images in Supplementary Fig. 18, e-f, Sanger sequencing of the paired CRISPR/Cas9 targeting region revealed an accurate deletion of 265bp in the PKD1 gene (e) and 165bp in the PKD2 gene (f) at day 7 of the transduced kidney tubuloids in 3D (10 days after transduction). g, Quantification of the percentage of GFP+ cysts in control (EV) and PKD1-/-, PKD2-/- tubuloids at 10, 15 and 20 days after transduction that were treated with blebbistatin (Blebb), then transferred into suspension culture for 72 hours. Statistical analysis using 2-way-ANOVA post-hoc Bonferroni in n = 4 mean ± s.e.m., P >0.999, no significant in GFP+ cyst rate of EV tubuloids between day 20 and 15 or 10 each other; P = 0.0516 in GFP+ cyst rate of PKD1-/- +Blebb for day 20 vs 15; ***P = 0.0007 in GFP+ cyst rate of PKD1-/- +Blebb for day 15 vs 10; ****P <0.0001 in GFP+ cyst rate of PKD1-/- +Blebb for day 20 vs 10; **P = 0.0020 in GFP+ cyst rate of PKD2-/- +Blebb for day 15 vs 10; ****P <0.0001 in GFP+ cyst rate of PKD2-/- +Blebb for day 20 vs 15 or 10. ###P <0.001 in PKD1-/- or PKD2-/- +Blebb for day 15 and 10; P = 0.402 in PKD1-/- and #P = 0.048 in PKD2-/- for day 20, by 2-way-ANOVA with post-hoc Bonferroni vs EV+Blebb on the same day.
Extended Data Fig. 5. Single nuclei ADPKD transcriptomic data.
a, Scaled gene expression of the top 3 differentially over-expressed genes (sorted by log2-fold-changes) in each cluster. b, Individual UMAP embeddings of nuclei from each of the 5 human kidney specimens. c, Number of genes, cell count and percentage of reads mapped to mitochondrial genes for each human sample. Box-whisker plots. d, Contribution of each sample toward the composition of the major cell types identified in human samples. e, Cell-type distribution was shown per condition and percentage of cells. f, Top 5 upregulated genes in human ADPKD vs donor biopsies. g, Heatmap of pathway activity using PROGENY comparing the integrated ADPKD kidney tissue data to the donor biopsies, indicating increased pathway activity in several cystic epithelial clusters as compared to their nephron counterparts in the healthy tissue. ***P <0.001; **P < 0.01; *P <0.05. P: Adjusted P-value by Benjamini & Hochberg method for multiple testing, from a nominal P-value obtained from an enrichment test with 10,000 permutations. h, Heatmap of gene-set enrichment of hallmark pathways of ADPKD comparing the integrated human ADPKD tissue data to the control data from donor biopsies. ***P <0.001; **P <0.01; *P <0.05. P: Adjusted P-value by Benjamini & Hochberg method, two-tailed, from a nominal P value obtained from an enrichment test with 1,000 permutations.
Extended Data Fig. 6. Pathway analysis of human ADPKD and control kidney tissue.
a, Gene set enrichment with PID pathway database in human ADPKD kidney tissue compared to controls. b, Gene set enrichment with GO Molecular function terms in human ADPKD kidney tissue compared to controls. c, Gene set enrichment with KEGG pathways in human ADPKD kidney tissue compared to controls. d, Gene set enrichment with BIOCARTA gene sets in human ADPKD kidney tissue compared to controls.
Extended Data Fig. 7. Receptor ligand interaction analysis in human ADPKD kidney tissue snRNA-seq data compared to healthy human kidney tissue.
a, Cell-cell interaction based on CrossTalkeR for all cell-clusters in human ADPKD kidney tissue snRNA-seq data as compared to control tissue (donor biopsies) snRNA-seq data. Color indicates weight of interaction. Orange and cyan color signifies cell-cell interaction enrichment in ADPKD and controls, respectively. b, PageRank log ratio for cell-type ranking based on the in-coming and outgoing interactions. Orange and cyan color signifies cell-cell interaction enrichment in ADPKD and controls, respectively. c, PageRank log ratio for cell-gene interaction ranking. Orange and cyan color signifies cell-cell interaction enrichment in ADPKD and controls, respectively. d, Heatmap of KEGG pathway enrichment using top 100 high-scoring dysregulated genes using the different ranking measures. e, Sankey plot summarizing top 50 out of 566 significant MET ligand-receptor interactions from major cell types. f, Sankey plot summarizing top 50 out of 291 significant ERBB4 ligand-receptor interactions from major cell types.
Extended Data Fig. 8. Subclustering analysis of selected populations in human ADPKD and control tissue snRNA-seq data.
a, Subclustering of principal cells of the collecting duct and epithelial cells of the connecting tubule (PC-CD/CNT), relative distribution of cells per subcluster in ADPKD and control tissue (donor biopsies) and top filtered marker genes of subclusters. b, Subclustering of cells from the distal convoluted tubule (DCT), relative distribution of cells per subcluster in ADPKD and control tissue (donor biopsies) and top filtered marker genes of subclusters. c, Subclustering of collecting duct intercalated cells (ICs), relative distribution of cells per subcluster in ADPKD and control tissue (donor biopsies) and top filtered marker genes of subclusters. d, Subclustering of proximal tubule epithelial cells (PTs), relative distribution of cells per subcluster in ADPKD and control tissue (donor biopsies) and top filtered marker genes of subclusters. e, Subclustering of cells from the Loop of Henle (LOH) thick ascending limb (TAL), relative distribution of cells per subcluster in ADPKD and control tissue (donor biopsies) and top filtered marker genes of subclusters. f, Overrepresentation analyses with Reactome pathway database using up-regulated DE genes obtained from ADPKD vs control comparison.
Extended Data Fig. 9. Symphony mapping of tubuloid cells to human kidney snRNA-seq data.
a-e, Symphony mapping of tubuloid cell clusters from different tubuloids generated (a, early tubuloid 4-phase; b, late tubuloid 4-phase; c, tubuloid 1-phase; d, PKD1 gene edited tubuloid; e, PKD2 gene edited tubuloid) to the integrated human kidney snRNA-seq data from donor biopsies. f, Representative Immunofluorescent staining of the proximal tubular marker LTL (green) and the TAL marker SLC12A1 (white), non-ADPKD human kidney tissue. Scale bars 75 μm. g-h, Representative immunofluorescent staining of the proximal tubular marker LTL (green) and the TAL marker SLC12A1 (white) on human ADPKD tissue sections showing epithelial cysts lined by TAL marker SLC12A1+ cells (arrows). Nuclei were counterstained with DAPI. Scale bars 75 μm. For details on statistics and reproducibility, see Methods.
Extended Data Fig. 10. Gene expression in gene edited tubuloids as compared to human kidneys and AVPR2 expression in tubuloids.
a, Venn diagram of separately commonly up and downregulated genes in TAL cluster TAL_2 and PT_4 in human ADPKD kidney tissue versus healthy human kidney (donor biopsies) and the gene edited tubuloids as compared to control tubuloids. b, Commonly dysregulated pathways obtained from gene set enrichment with KEGG pathways using all differentially expressed (DE) genes in human ADPKD vs donor biopsies in PT-4 and TAL-2 cells with the cells of the tubuloids that mapped to PT-4 and TAL-2 using Symphony. c, Top selected commonly downregulated genes in human ADPKD vs donor biopsies and the cells that mapped to PT-4 and TAL-2 in PKD-/- vs Control. d, Results of the CellTiter-Glo 3D Cell Viability assay from control (EV), PKD1-/- and PKD2-/- tubuloids subjected to different doses of tolvaptan. 0.0 indicates 0.2% DMSO treated tubuloids as a control. 2-way ANOVA post-hoc Bonferroni in n = 3 mean ± s.e.m. No significant difference in cell viability for DMSO control (0.0 μM tolvaptan, 0.2% DMSO) compared to 0.1 to 20 μM tolvaptan treated EV tubuloids, PKD1-/-, PKD2-/- tubuloids, P >0.9999; 40 μM tolvaptan vs DMSO control, P = 0.0846 for EV tubuloids, **P = 0.0019 for PKD1-/- tubuloids, and *P = 0.0215 for PKD2-/- tubuloids. e-f, Dotplots of AVPR1A and AVPR2 average scaled mRNA expression in tubuloids (late and 1-phase protocol) (e) and PKD1-/- as well as PKD2-/- (f). g, Relative mRNA expression for AVPR2 (V2R) in non-treated tubuloids as compared to tubuloids transduced with a lentivirus control (EV) and tubuloids were gene edited by lenti paired CRISPR/Cas9 for either PKD1 or PKD2. 1-way-ANOVA with post-hoc Bonferroni in n = 4 mean ± s.d., PKD1-/- tubuloids vs EV tubuloids, ****P <0.0001; PKD2-/- tubuloids vs EV tubuloids, ***P = 0.0006; PKD1-/- tubuloids vs normal tubuloids, ****P <0.0001; PKD2-/- tubuloids vs normal tubuloids, ***P = 0.0004; EV tubuloids vs normal tubuloids, P >0.9999. h, Representative in-situ hybridization of AVPR2, human ADPKD2 kidney tissue section. AVPR2 mRNA was detected in cyst-lining epithelial cells. Scale bar 50 μm. i, Representative immunofluorescent staining of the LOH marker SLC12A1 and AVPR2 in collecting duct epithelial cells. Scale bars 50 μm. j, Representative immunofluorescent staining of the LOH marker SLC12A1 and AVPR2 in ADPKD cyst lining epithelial cells. Scale bars 50 μm. For details on statistics and reproducibility, see Methods.
Supplementary Material
Acknowledgements
We thank Dr. Müller-Newen and Sabrina Ernst of the Interdisziplinäres Zentrum für Klinische Forschung (IZKF) Aachen, confocal microscopy facility and Dr. Michael Vogt of the IZKF Aachen, two-photon imaging facility for assistance with imaging and image analysis. We further thank the IZKF Aachen Genomics Facility for support. This work was supported by grants of the German Research Foundation (DFG: SFBTRR219 to R.K. and J.F., CRU344-4288578857858, CRU5011-445703531), by Grants of the European Research Council (ERC-StG CureCKDHeart 677448, ERC-Con TargetCKD 101043403), a Grant of the Else Kroener Fresenius Foundation (EKFS), the Dutch Kidney Foundation (DKF), TASKFORCE EP1805, the NWO VIDI 09150172010072 and a Grant of the Leducq Foundation all to R.K.. This work was also supported by the BMBF eMed Consortia Fibromap (to I.C., R.K.S. and R.K.), and grants of the DFG (Project IDs 322900939, 454024652, 432698239 & 445703531) to P.B.. Further funding came from START-Program of the Faculty of Medicine, RWTH Aachen to K.H. and T.S., the German Society of Internal Medicine to T.S. and the Dutch Kidney Foundation (14A3D10) to B.S.. We thank Ivan Gomez for technical assistance. Work in the Freedman laboratory was supported by NIH awards R01DK117914, U01DK127553, UG3TR002158, and UG3TR003288, and by the Lara Nowak Macklin Fund.
Footnotes
Author contributions
Y.X. designed and carried out experiments, analyzed results and wrote the manuscript, C.K. designed and performed some experiment, analyzed the data and contributed to writing, J.P.P., S.H., F.P., J.N., H.K., analyzed the scRNA-seq data, J.K. and J.S. recruited patients and collected clinical data and reviewed the manuscript, A.T.A. analyzed the ATAC-seq data, B.F. performed the iPSC experiment and contributed to data interpretation and writing, M.H., Tu.S., K.H., J.J. and S.M. performed some experiments, M.L., J.M. helped with the Seahorse experiments, E.M.B. and P.B. performed the electron microscopy experiments, C.Kn. and I.K. performed genotyping of the patient specimens, M.R. and C.B. consented patients and provided living donor biopsies, B.F. performed the iPSC experiments. R.H. and E.B. performed the sequencing and alignment of the scRNA-seq, F.P., J.J., I.K., J.S.R, Z.L., T.B.H., A.K. T.S., M.E.J.R., I.C., M.R., C.B., Tu.S., M.R., C.v.R., B.S., E.J.H., J.G., R.K.S. and J.F. contributed to interpretation of the results. All authors reviewed the manuscript. R.K. planned the project and experiments, analyzed and interpreted the data, wrote the manuscript and obtained funding. All authors revised and approved the manuscript.
Competing interests
All authors declare no competing interests. Disclosures: R.K. reports unrelated funding from Travere Therapeutics, Galapagos and Novo Nordisk and unrelated honoraria from Bayer, Pfizer, Grünenthal and Novo Nordisk. SH reports unrelated funding from Novo Nordisk. J.S.R. reports unrelated funding from GSK and Sanofi and unrelated fees from Travere Therapeutics and Astex Therapeutics. All other authors have nothing to disclose.
Data availability
Processed gene expression values from the single-cell RNA-seq are available at https://doi.org/10.6084/m9.figshare.11786238. The code for reproducible analysis of the single-cell data is available at: https://github.com/saezlab/Xu_tubuloid and https://github.com/KramannLab/kidney_human_organoids github repositories. Processed data from the ATAC-seq analysis are available for peer-review under the private link at https://figshare.com/s/728705bc42446275044d in FigShare. These data have a reserved DOI (https://doi.org/10.6084/m9.figshare.11848281). All raw data are available in the controlled EGA access repository EGAS00001006551.
Code availability
The computer code to reproduce the analysis of ATAC-seq data is available at https://github.com/ATA82/ATAC_Seq_Xu in GitHub. The specific software and methods used for the analysis are described in the README file of the repository.
References
- 1.Takasato M, et al. Kidney organoids from human iPS cells contain multiple lineages and model human nephrogenesis. Nature. 2015;526:564–568. doi: 10.1038/nature15695. [DOI] [PubMed] [Google Scholar]
- 2.Morizane R, et al. Nephron organoids derived from human pluripotent stem cells model kidney development and injury. Nat Biotechnol. 2015;33:1193–1200. doi: 10.1038/nbt.3392. [DOI] [PMC free article] [PubMed] [Google Scholar]
- 3.Taguchi A, et al. Redefining the in vivo origin of metanephric nephron progenitors enables generation of complex kidney structures from pluripotent stem cells. Cell Stem Cell. 2014;14:53–67. doi: 10.1016/j.stem.2013.11.010. [DOI] [PubMed] [Google Scholar]
- 4.Freedman BS, et al. Modelling kidney disease with CRISPR-mutant kidney organoids derived from human pluripotent epiblast spheroids. Nat Commun. 2015;6:8715. doi: 10.1038/ncomms9715. [DOI] [PMC free article] [PubMed] [Google Scholar]
- 5.Wu H, et al. Comparative Analysis and Refinement of Human PSC-Derived Kidney Organoid Differentiation with Single-Cell Transcriptomics. Cell Stem Cell. 2018;23:869–881.:e8. doi: 10.1016/j.stem.2018.10.010. [DOI] [PMC free article] [PubMed] [Google Scholar]
- 6.Schutgens F, et al. Tubuloids derived from human adult kidney and urine for personalized disease modeling. Nat Biotechnol. 2019;37:303–313. doi: 10.1038/s41587-019-0048-8. [DOI] [PubMed] [Google Scholar]
- 7.Lazzeri E, et al. Regenerative potential of embryonic renal multipotent progenitors in acute renal failure. J Am Soc Nephrol. 2007;18:3128–3138. doi: 10.1681/ASN.2007020210. [DOI] [PubMed] [Google Scholar]
- 8.Romagnani P, Remuzzi G. CD133+ renal stem cells always co-express CD24 in adult human kidney tissue. Stem Cell Res. 2014;12:828–829. doi: 10.1016/j.scr.2013.12.011. [DOI] [PubMed] [Google Scholar]
- 9.Romagnani P. Family Portrait. The American Journal of Pathology. 2011;178:490–493. doi: 10.1016/j.ajpath.2010.11.044. [DOI] [PMC free article] [PubMed] [Google Scholar]
- 10.Sagrinati C, et al. Isolation and Characterization of Multipotent Progenitor Cells from the Bowman’s Capsule of Adult Human Kidneys. Journal of the American Society of Nephrology. 2006;17:2443–2456. doi: 10.1681/ASN.2006010089. [DOI] [PubMed] [Google Scholar]
- 11.Smeets B, et al. Proximal tubular cells contain a phenotypically distinct, scattered cell population involved in tubular regeneration. J Pathol. 2013;229:645–659. doi: 10.1002/path.4125. [DOI] [PMC free article] [PubMed] [Google Scholar]
- 12.Teslaa T, Teitell MA. Pluripotent stem cell energy metabolism: an update. The EMBO Journal. 2015;34:138–153. doi: 10.15252/embj.201490446. [DOI] [PMC free article] [PubMed] [Google Scholar]
- 13.Huch M, et al. Long-term culture of genome-stable bipotent stem cells from adult human liver. Cell. 2015;160:299–312. doi: 10.1016/j.cell.2014.11.050. [DOI] [PMC free article] [PubMed] [Google Scholar]
- 14.Barker N, et al. Lgr5+ ve stem cells drive self-renewal in the stomach and build long-lived gastric units in vitro. Cell Stem Cell. 2010;6:25–36. doi: 10.1016/j.stem.2009.11.013. [DOI] [PubMed] [Google Scholar]
- 15.Lancaster MA, et al. Cerebral organoids model human brain development and microcephaly. Nature. 2013;501:373–379. doi: 10.1038/nature12517. [DOI] [PMC free article] [PubMed] [Google Scholar]
- 16.El-Achkar TM, et al. A multimodal and integrated approach to interrogate human kidney biopsies with rigor and reproducibility: guidelines from the Kidney Precision Medicine Project. Physiol Genomics. 2021;53:1–11. doi: 10.1152/physiolgenomics.00104.2020. [DOI] [PMC free article] [PubMed] [Google Scholar]
- 17.Cornec-Le Gall E, Alam A, Perrone RD. Autosomal dominant polycystic kidney disease. Lancet. 2019;393:919–935. doi: 10.1016/S0140-6736(18)32782-X. [DOI] [PubMed] [Google Scholar]
- 18.Guo T, et al. Harnessing accurate non-homologous end joining for efficient precise deletion in CRISPR/Cas9-mediated genome editing. Genome Biology. 2018;19 doi: 10.1186/s13059-018-1518-x. [DOI] [PMC free article] [PubMed] [Google Scholar]
- 19.Cruz NM, et al. Organoid cystogenesis reveals a critical role of microenvironment in human polycystic kidney disease. Nature Materials. 2017;16:1112–1119. doi: 10.1038/nmat4994. [DOI] [PMC free article] [PubMed] [Google Scholar]
- 20.Czerniecki SM, et al. High-Throughput Screening Enhances Kidney Organoid Differentiation from Human Pluripotent Stem Cells and Enables Automated Multidimensional Phenotyping. Cell Stem Cell. 2018;22:929–940.:e4. doi: 10.1016/j.stem.2018.04.022. [DOI] [PMC free article] [PubMed] [Google Scholar]
- 21.Margaria JP, Campa CC, De Santis MC, Hirsch E, Franco I. The PI3K/Akt/mTOR pathway in polycystic kidney disease: A complex interaction with polycystins and primary cilium. Cell Signal. 2020;66:109468. doi: 10.1016/j.cellsig.2019.109468. [DOI] [PubMed] [Google Scholar]
- 22.Qin S, et al. Failure to ubiquitinate c-Met leads to hyperactivation of mTOR signaling in a mouse model of autosomal dominant polycystic kidney disease. J Clin Invest. 2010;120:3617–3628. doi: 10.1172/JCI41531. [DOI] [PMC free article] [PubMed] [Google Scholar]
- 23.Yamaguchi T, et al. Cyclic AMP activates B-Raf and ERK in cyst epithelial cells from autosomal-dominant polycystic kidneys. Kidney Int. 2003;63:1983–1994. doi: 10.1046/j.1523-1755.2003.00023.x. [DOI] [PubMed] [Google Scholar]
- 24.Cai J, et al. A RhoA-YAP-c-Myc signaling axis promotes the development of polycystic kidney disease. Genes Dev. 2018;32:781–793. doi: 10.1101/gad.315127.118. [DOI] [PMC free article] [PubMed] [Google Scholar]
- 25.Nagai JS, Leimkühler NB, Schaub MT, Schneider RK, Costa IG. CrossTalkeR: analysis and visualization of ligand–receptorne tworks. Bioinformatics. 2021 doi: 10.1093/bioinformatics/btab370. [DOI] [PMC free article] [PubMed] [Google Scholar]
- 26.Kang JB, et al. Efficient and precise single-cell reference atlas mapping with Symphony. Nat Commun. 2021;12:5890. doi: 10.1038/s41467-021-25957-x. [DOI] [PMC free article] [PubMed] [Google Scholar]
- 27.Baert L. Hereditary polycystic kidney disease (adult form): a microdissection study of two cases at an early stage of the disease. Kidney Int. 1978;13:519–525. doi: 10.1038/ki.1978.75. [DOI] [PubMed] [Google Scholar]
- 28.Wilson PD. Polycystic kidney disease. N Engl J Med. 2004;350:151–164. doi: 10.1056/NEJMra022161. [DOI] [PubMed] [Google Scholar]
- 29.Schäfer K, et al. Characterization of the Han:SPRD rat model for hereditary polycystic kidney disease. Kidney International. 1994;46:134–152. doi: 10.1038/ki.1994.253. [DOI] [PubMed] [Google Scholar]
- 30.Nagao S, et al. Renal activation of extracellular signal-regulated kinase in rats with autosomal-dominant polycystic kidney disease. Kidney Int. 2003;63:427–437. doi: 10.1046/j.1523-1755.2003.00755.x. [DOI] [PubMed] [Google Scholar]
- 31.Islam MR, et al. Retinoic acid-dependent activation of the polycystic kidney disease-1 (PKD1) promoter. Am J Physiol Renal Physiol. 2008;295:F1845–54. doi: 10.1152/ajprenal.90355.2008. [DOI] [PMC free article] [PubMed] [Google Scholar]
- 32.Pritchard L, et al. A human PKD1 transgene generates functional polycystin-1 in mice and is associated with a cystic phenotype. Hum Mol Genet. 2000;9:2617–2627. doi: 10.1093/hmg/9.18.2617. [DOI] [PubMed] [Google Scholar]
- 33.Puri S, et al. Ets factors regulate the polycystic kidney disease-1 promoter. Biochem Biophys Res Commun. 2006;342:1005–1013. doi: 10.1016/j.bbrc.2006.02.045. [DOI] [PubMed] [Google Scholar]
- 34.Yu ASL, Kanzawa SA, Usorov A, Lantinga-van Leeuwen IS, Peters DJM. Tight junction composition is altered in the epithelium of polycystic kidneys. J Pathol. 2008;216:120–128. doi: 10.1002/path.2392. [DOI] [PMC free article] [PubMed] [Google Scholar]
- 35.Russo RJ, et al. Impaired formation of desmosomal junctions in ADPKD epithelia. Histochem Cell Biol. 2005;124:487–497. doi: 10.1007/s00418-005-0055-3. [DOI] [PubMed] [Google Scholar]
- 36.Rogers KK, Jou T-S, Guo W, Lipschutz JH. The Rho family of small GTPases is involved in epithelial cystogenesis and tubulogenesis. Kidney Int. 2003;63:1632–1644. doi: 10.1046/j.1523-1755.2003.00902.x. [DOI] [PubMed] [Google Scholar]
- 37.Wang X, Wu Y, Ward CJ, Harris PC, Torres VE. Vasopressin directly regulates cyst growth in polycystic kidney disease. J Am Soc Nephrol. 2008;19:102–108. doi: 10.1681/ASN.2007060688. [DOI] [PMC free article] [PubMed] [Google Scholar]
- 38.Shimizu T, et al. A novel ADPKD model using kidney organoids derived from disease-specific human iPSCs. Biochem Biophys Res Commun. 2020;529:1186–1194. doi: 10.1016/j.bbrc.2020.06.141. [DOI] [PubMed] [Google Scholar]
- 39.Torres VE, et al. Effective treatment of an orthologous model of autosomal dominant polycystic kidney disease. Nat Med. 2004;10:363–364. doi: 10.1038/nm1004. [DOI] [PubMed] [Google Scholar]
- 40.Gattone VH, 2nd, Maser RL, Tian C, Rosenberg JM, Branden MG. Developmental expression of urine concentration-associated genes and their altered expression in murine infantile-type polycystic kidney disease. Dev Genet. 1999;24:309–318. doi: 10.1002/(SICI)1520-6408(1999)24:3/4<309::AID-DVG14>3.0.CO;2-5. [DOI] [PubMed] [Google Scholar]
- 41.Kabadi AM, Ousterout DG, Hilton IB, Gersbach CA. Multiplex CRISPR/Cas9-based genome engineering from a single lentiviral vector. Nucleic Acids Res. 2014;42:e147. doi: 10.1093/nar/gku749. [DOI] [PMC free article] [PubMed] [Google Scholar]
- 42.Broutier L, et al. Culture and establishment of self-renewing human and mouse adult liver and pancreas 3D organoids and their genetic manipulation. Nat Protoc. 2016;11:1724–1743. doi: 10.1038/nprot.2016.097. [DOI] [PubMed] [Google Scholar]
- 43.Fujii M, Matano M, Nanki K, Sato T. Efficient genetic engineering of human intestinal organoids using electroporation. Nat Protoc. 2015;10:1474–1485. doi: 10.1038/nprot.2015.088. [DOI] [PubMed] [Google Scholar]
- 44.Kuppe C, et al. Decoding myofibroblast origins in human kidney fibrosis. Nature. 2021;589:281–286. doi: 10.1038/s41586-020-2941-1. [DOI] [PMC free article] [PubMed] [Google Scholar]
- 45.Costales-Carrera A, et al. Plocabulin Displays Strong Cytotoxic Activity in a Personalized Colon Cancer Patient-Derived 3D Organoid Assay. Mar Drugs. 2019;17 doi: 10.3390/md17110648. [DOI] [PMC free article] [PubMed] [Google Scholar]
- 46.Daley T, Smith AD. Predicting the molecular complexity of sequencing libraries. Nat Methods. 2013;10:325–327. doi: 10.1038/nmeth.2375. [DOI] [PMC free article] [PubMed] [Google Scholar]
- 47.Li H, Durbin R. Fast and accurate short read alignment with Burrows-Wheeler transform. Bioinformatics. 2009;25:1754–1760. doi: 10.1093/bioinformatics/btp324. [DOI] [PMC free article] [PubMed] [Google Scholar]
- 48.Li H, et al. 1000 Genome Project Data Processing Subgroup. 2009. The sequence alignment/map format and samtools. Bioinformatics. 2009;25:2078–2079. doi: 10.1093/bioinformatics/btp352. [DOI] [PMC free article] [PubMed] [Google Scholar]
- 49.Feng J, Liu T, Qin B, Zhang Y, Liu XS. Identifying ChIP-seq enrichment using MACS. Nature Protocols. 2012;7:1728–1740. doi: 10.1038/nprot.2012.101. [DOI] [PMC free article] [PubMed] [Google Scholar]
- 50.Lawrence M, Gentleman R, Carey V. rtracklayer: an R package for interfacing with genome browsers. Bioinformatics. 2009;25:1841–1842. doi: 10.1093/bioinformatics/btp328. [DOI] [PMC free article] [PubMed] [Google Scholar]
- 51.Yu G, Wang L-G, He Q-Y. ChIPseeker: an R/Bioconductor package for ChIP peak annotation,comparison and visualization. Bioinformatics. 2015;31:2382–2383. doi: 10.1093/bioinformatics/btv145. [DOI] [PubMed] [Google Scholar]
- 52.Liao Y, Smyth GK, Shi W. featureCounts: an efficient general purpose program for assigning sequence reads to genomic features. Bioinformatics. 2014;30:923–930. doi: 10.1093/bioinformatics/btt656. [DOI] [PubMed] [Google Scholar]
- 53.Love MI, Huber W, Anders S. Moderated estimation of fold change and dispersion for RNA-seq data with DESeq2. Genome Biol. 2014;15:550. doi: 10.1186/s13059-014-0550-8. [DOI] [PMC free article] [PubMed] [Google Scholar]
- 54.Stuart T, et al. Comprehensive Integration of Single-Cell Data. Cell. 2019;177:1888–1902.:e21. doi: 10.1016/j.cell.2019.05.031. [DOI] [PMC free article] [PubMed] [Google Scholar]
- 55.Ibrahim MM, Kramann R. genesorteR: Feature Ranking in Clustered Single Cell Data. bioRxiv. 2019:676379. doi: 10.1101/676379. [DOI] [Google Scholar]
- 56.Tung P-Y, et al. Batch effects and the effective design of single-cell gene expression studies. Scientific Reports. 2017;7 doi: 10.1038/srep39921. [DOI] [PMC free article] [PubMed] [Google Scholar]
- 57.Robinson MD, Oshlack A. A scaling normalization method for differential expression analysis of RNA-seq data. Genome Biol. 2010;11:R25. doi: 10.1186/gb-2010-11-3-r25. [DOI] [PMC free article] [PubMed] [Google Scholar]
- 58.Chen Y, Lun ATL, Smyth GK. From reads to genes to pathways: differential expression analysis of RNA-Seq experiments using Rsubread and the edgeR quasi-likelihood pipeline. F1000Res. 2016;5:1438. doi: 10.12688/f1000research.8987.1. [DOI] [PMC free article] [PubMed] [Google Scholar]
- 59.Korotkevich G, et al. Fast gene set enrichment analysis. bioRxiv. 2016 doi: 10.1101/060012. [DOI] [Google Scholar]
- 60.Liberzon A, et al. Molecular signatures database (MSigDB) 3.0. Bioinformatics. 2011;27:1739–1740. doi: 10.1093/bioinformatics/btr260. [DOI] [PMC free article] [PubMed] [Google Scholar]
- 61.Holland CH, et al. Robustness and applicability of transcription factor and pathway analysis tools on single-cell RNA-seq data. Genome Biol. 2020;21:36. doi: 10.1186/s13059-020-1949-z. [DOI] [PMC free article] [PubMed] [Google Scholar]
- 62.Schubert M, et al. Perturbation-response genes reveal signaling footprints in cancer gene expression. Nat Commun. 2018;9:20. doi: 10.1038/s41467-017-02391-6. [DOI] [PMC free article] [PubMed] [Google Scholar]
- 63.Dimitrov D, et al. Comparison of methods and resources for cell-cell communication inference from single-cell RNA-Seq data. Nat Commun. 2022;13:3224. doi: 10.1038/s41467-022-30755-0. [DOI] [PMC free article] [PubMed] [Google Scholar]
- 64.Nagai JS, Leimkühler NB, Schaub MT, Schneider RK, Costa IG. CrossTalkeR: Analysis and Visualisation of Ligand Receptor Networks. doi: 10.1101/2021.01.20.427390. [DOI] [PMC free article] [PubMed] [Google Scholar]
Associated Data
This section collects any data citations, data availability statements, or supplementary materials included in this article.
Supplementary Materials
Data Availability Statement
Processed gene expression values from the single-cell RNA-seq are available at https://doi.org/10.6084/m9.figshare.11786238. The code for reproducible analysis of the single-cell data is available at: https://github.com/saezlab/Xu_tubuloid and https://github.com/KramannLab/kidney_human_organoids github repositories. Processed data from the ATAC-seq analysis are available for peer-review under the private link at https://figshare.com/s/728705bc42446275044d in FigShare. These data have a reserved DOI (https://doi.org/10.6084/m9.figshare.11848281). All raw data are available in the controlled EGA access repository EGAS00001006551.
The computer code to reproduce the analysis of ATAC-seq data is available at https://github.com/ATA82/ATAC_Seq_Xu in GitHub. The specific software and methods used for the analysis are described in the README file of the repository.


