Abstract
Cellular senescence is a stable type of cell cycle arrest triggered by different stresses. As such, senescence drives age-related diseases and curbs cellular replicative potential. Here, we show that 3-deazaadenosine (3DA), an S-adenosyl homocysteinase (AHCY) inhibitor, alleviates replicative and oncogene-induced senescence. 3DA-treated senescent cells showed reduced global Histone H3 Lysine 36 trimethylation (H3K36me3), an epigenetic modification that marks the bodies of actively transcribed genes. By integrating transcriptome and epigenome data, we demonstrate that 3DA treatment affects key factors of the senescence transcriptional program. Remarkably, 3DA treatment alleviated senescence and increased the proliferative and regenerative potential of muscle stem cells from very old mice in vitro and in vivo. Moreover, ex vivo 3DA treatment was sufficient to enhance the engraftment of human umbilical cord blood (UCB) cells in immunocompromised mice. Together, our results identify 3DA as a promising drug enhancing the efficiency of cellular therapies by restraining senescence.
Keywords: 3DA, senescence, AHCY, cord blood cells, muscle stem cells
Introduction
Senescence is a stress response that preserves tissue homeostasis by preventing the replication of old, preneoplastic or damaged cells 1. Senescent cells undergo a stable cell cycle arrest and display profound changes in nuclear and chromatin organization, gene expression, cell metabolism and secretory profile 2. Depending on the physiological context, senescence can be either beneficial or detrimental. Induction of senescence can restrain tumor progression 3 and limit fibrosis 4. However, the aberrant accumulation of senescent cells contributes to ageing and age-related pathologies 5. Moreover, there is now strong evidence that the selective elimination of senescent cells delays the onset of age-related diseases or at least ameliorates their symptoms 6. Given the causative role of senescence in the ageing process and its contribution to multiple age-related diseases, senescent cells are prime targets for drug-induced elimination (i.e. senolysis)7, but alternative strategies are also pursued. One such strategy is rejuvenating senescent cells 8,9.
The two defining hallmarks of senescent cells are a stable cell cycle arrest (mediated by the transcriptional upregulation of cyclin dependent kinase inhibitors such as p16INK4a) and the secretion of a complex combination of factors collectively referred to as the senescence-associated secretory phenotype (SASP). The SASP is widely believed to mediate many of the detrimental effects exerted by senescent cells, and consequently strategies have been devised to target it 10,11. A progressive induction of senescence, especially in adult stem cell populations has been associated with age-dependent declines in tissue function 12,13. With age, stem cell populations undergo senescence and, as a result, the ability of the tissue to repair after damage gradually diminishes 14. Consequently, strategies aimed at alleviating stem cell senescence have the potential to preserve the regenerative potential in aged tissues. As cellular senescence is one of the main impasses for the expansion of stem cells ex vivo, drugs that prevent the onset of senescence could also be used to optimize the generation of stem cells for subsequent cellular therapies.
We have previously performed high-throughput drug screens to identify cardiac glycosides as broad-spectrum senolytics 15. Here, we followed a similar approach to identify drugs alleviating senescence. We found that treatment with 3-deazaadenosine (3DA), a S-adenosyl homocysteinase (AHCY) inhibitor 16,17, partially prevents both replicative and oncogene-induced senescence. We confirmed the potential benefits of 3DA treatment in ex vivo cultures and engraftment experiments of geriatric muscle stem cells and human umbilical cord blood (UCB) cells suggesting that, by inhibiting senescence, 3DA could improve the efficiency of cellular therapies.
Results
Drug screens for compounds alleviating senescence
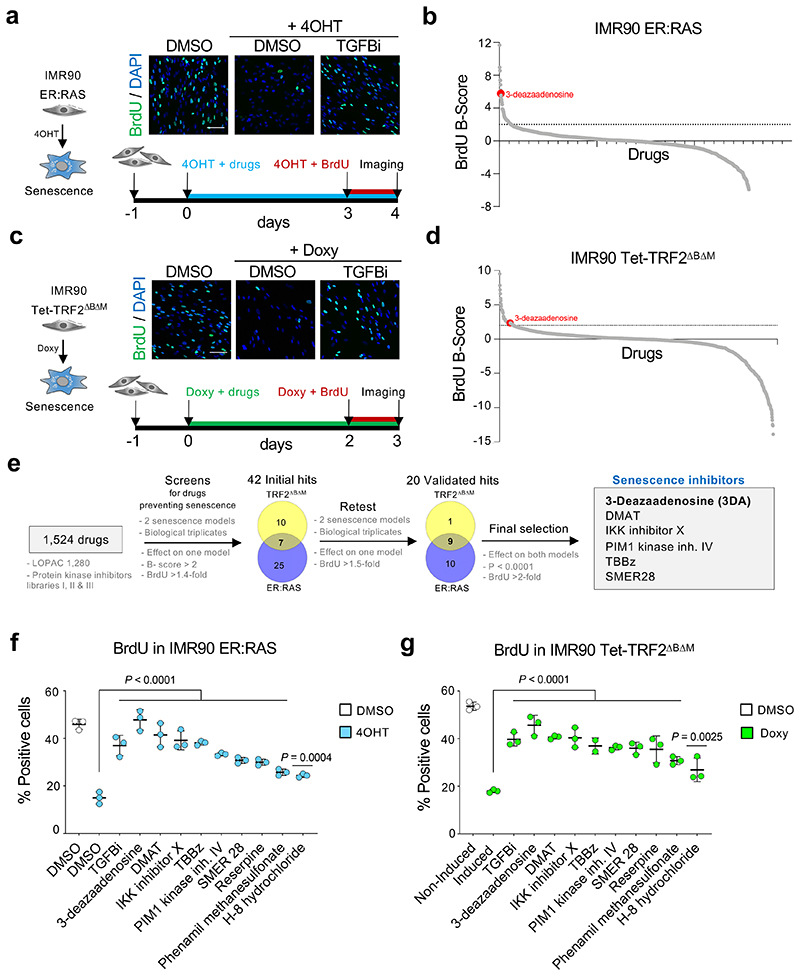
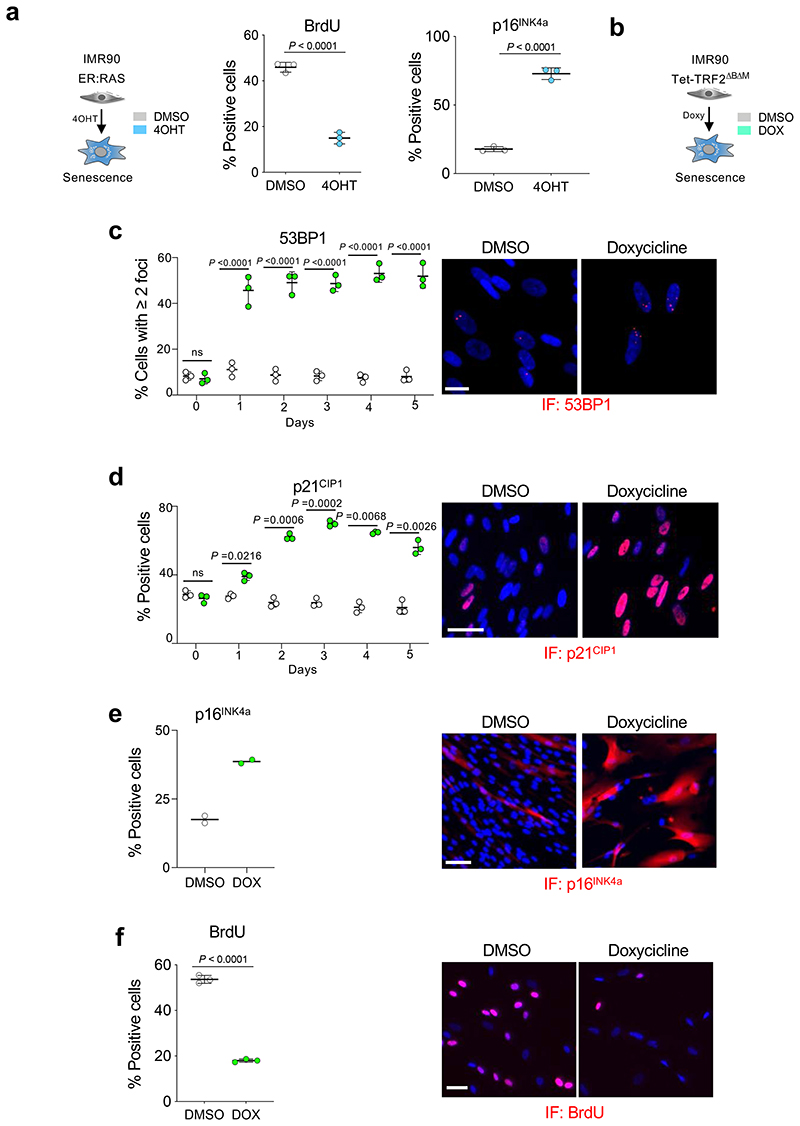
Senescence can be triggered by multiple stresses ranging from oncogenic activation to replicative exhaustion or treatment with chemotherapeutic drugs 1. To identify compounds that prevent or alleviate senescence, we used two different models of cellular senescence. First, we took advantage of a widely used model of oncogene-induced senescence (OIS), 18, in which a 4-hydroxytamoxifen (4-OHT)-inducible oncogenic RAS chimeric protein ER:RASV12 is expressed in IMR90 human fibroblasts (Extended Data Fig. 1a). We also used a second model in which the expression of a dominant-negative, doxycycline-inducible TRF2 protein, TRF2ΔBΔM 19,20 induces telomere dysfunction to cause senescence (Extended Data Fig. 1b-f). As a positive control for preventing senescence induction, we treated cells undergoing senescence with 4 μM of TGF-b RI kinase inhibitor II (TGFBi), which resulted in a higher percentage of cells incorporating BrdU when compared to untreated cells 18 (Fig. 1a,c). We assessed the effect that 1,524 drugs (those part of the LOPAC 1,280 and the InhibitorSelect Protein kinase inhibitor libraries I, II and III) have on cells undergoing OIS and after normalization selected 32 initial hits for further testing (B-score>2 and BrdU 1.4-fold higher than the control, Fig. 1b).
Figure 1. Screen for drugs alleviating senescence identifies 3-deazaadenosine (3DA).
a, Screen in a model of oncogene-induced senescence. Representative immunofluorescence images (top). BrdU incorporation, which indicates proliferation, is stained green. TGF-β RI kinase inhibitor II is included as a positive control. Scale bar, 100 μm. Experimental design for the screen in oncogene-induced senescence using inducible IMR90 ER:RAS cells (bottom). b, BrdU raw values for the screen were normalized using the B score method. 3DA is highlighted in red. c, Screen in a model of senescence induced by telomere uncapping. Representative immunofluorescence images (top). BrdU incorporation, which indicates proliferation, is stained green. Scale bar, 100 μm. Experimental design for the screen in IMR90 tet-TRF2ΔBΔM cells (bottom). d, BrdU raw values for the screen were normalized using the B score method. 3DA is highlighted in red. e, Summary of the screens for drugs alleviating senescence. Venn diagrams (not to scale) show number of drugs passing the filters and overlap between replicative and oncogene-induced senescence. f, Quantification of immunofluorescence staining for BrdU of IMR90 ER:RAS cells 4 days after treatment with 4OHT or vehicle (DMSO) and the 9 senescence inhibitors validated in the screen in both senescence models (n = 3). g, Quantification of immunofluorescence staining for BrdU of IMR90 tet-TRF2ΔBΔM cells 3 days after treatment with doxycycline or vehicle (DMSO) and the 9 senescence inhibitors validated in the screen in both senescence models (n = 3). All statistical significances were calculated using one-way ANOVA. All error bars represent mean ± s.d; n represents independent experiments.
To identify drugs that behave as general inhibitors of senescence, we screened the same library on cells expressing TRF2ΔBΔM and selected 17 hits that delayed senescence arrest (Fig. 1d). 7 of these drugs have also been identified in the screen on IMR90 ER:RAS cells. We took forward 42 drugs selected from both screens (Fig. 1e). Retesting in both models of senescence validated 20 drugs that partially prevented the senescence growth arrest in at least one of the models. 9 out of these 20 drugs have an effect in both senescence models (Fig. 1f-g). By imposing more strict criteria (p<0.0001 and BrdU > 2-fold higher than the control), we identified 6 compounds (Fig. 1e, right) with the ability to alleviate senescence (Fig. 1e). Amongst those, 3-deazaadenosine (3DA), a S-adenosyl homocysteinase (AHCY) inhibitor 16,17 performed consistently well in both systems and was selected as a candidate drug to alleviate senescence.
Treatment with 3DA alleviates senescence
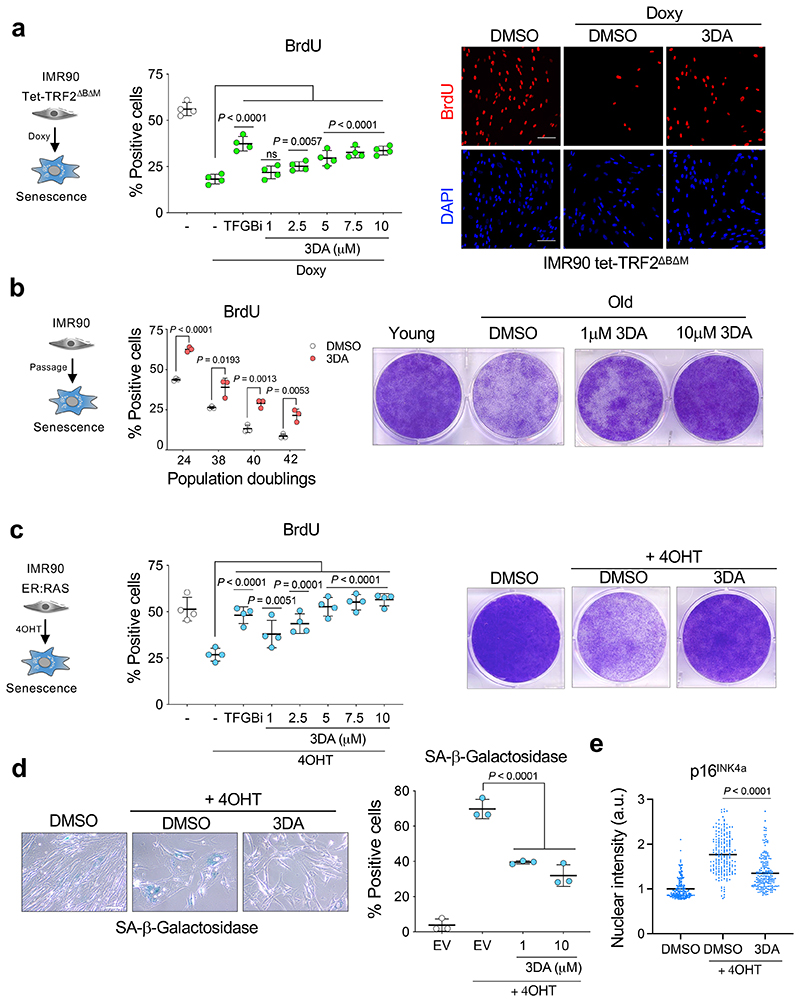
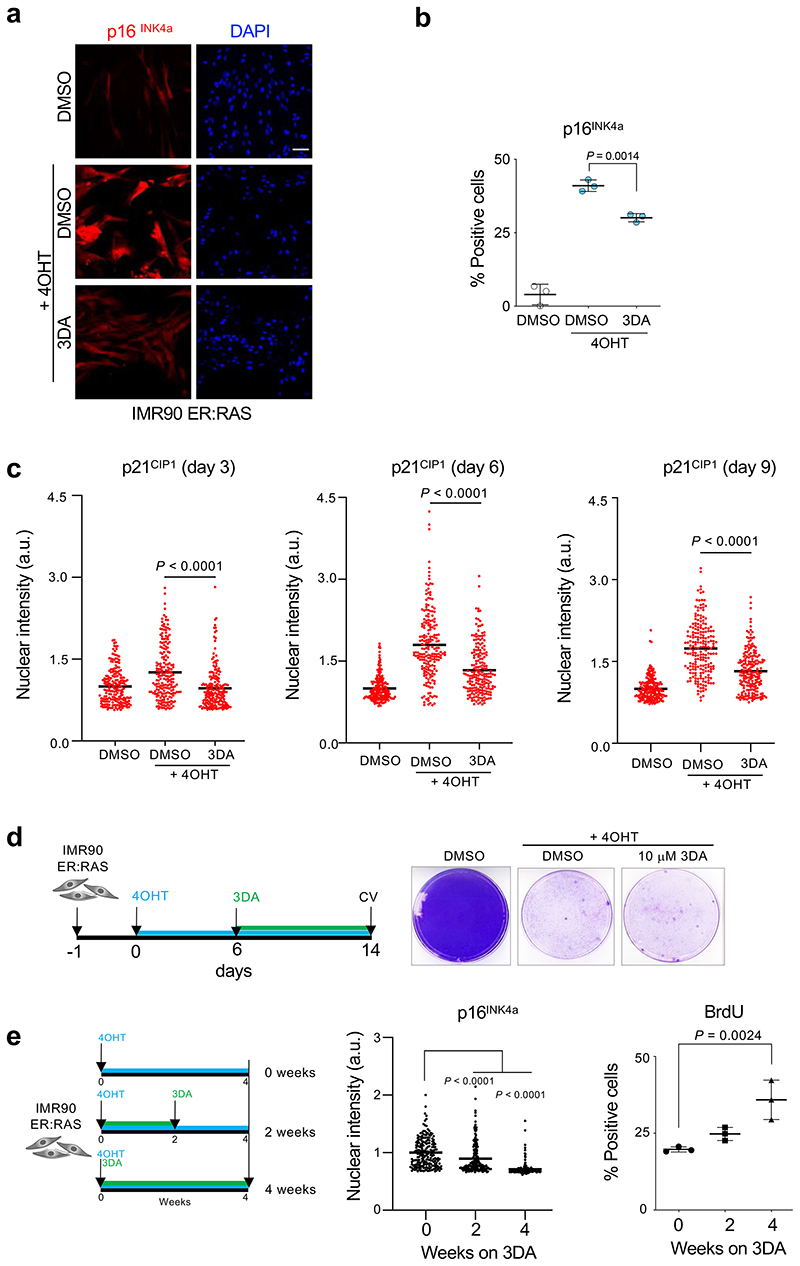
To investigate the ability of 3DA to alleviate senescence, we used the IMR90 Tet-TRF2ΔBΔM model. 3DA partially prevented the growth arrest associated with senescence in a dose dependent manner in this model (Fig. 2a). While expression of TRF2ΔBΔM causes telomere uncapping and results in a DNA damage response (DDR) that mimics what we observed during senescence 21, we decided to assess the effect that treatment with 3DA has on cells undergoing replicative senescence. We therefore treated IMR90 fibroblasts with 3DA. We observed a gradual loss of replicative potential in IMR90 cells during serial passage as measured by assessing the percentage of cells incorporating BrdU (Fig. 2b, middle panel). Concurrently, treatment with 3DA increased the subset of cells dividing at each passage, resulting in an extension of the replicative potential of old cells (Fig. 2b, middle and right). To further assess the ability of 3DA to alleviate senescence, we used IMR90 ER:RAS. Treatment with 3DA prevented the growth arrest associated with OIS in a dose-dependent manner as assessed by BrdU incorporation (Fig. 2c, middle) and colony formation (Fig. 2c, right). The effect that 3DA had on alleviating senescence was further confirmed as the induction of SA-β-Galactosidase activity was impaired in 3DA treated cells (Fig. 2d). Demonstrating the global effect caused by 3DA on senescence induction, treatment with 3DA partially prevented the upregulation of p16INK4a (Fig. 2e and Extended Data Fig. 2a,b) and p21CIP1 (Extended Data Fig. 2c). While the above results provide evidence that 3DA treatment facilitates senescence bypass, 3DA does not promote senescence escape (Extended Data Fig. 2d). Importantly, treatment with 3DA for 2 weeks (followed by 2 weeks off 3DA) still results in a higher percentage of proliferating cells and lower levels of p16INK4a when compared with control (DMSO-treated) cells (Extended Data Fig. 2e). This experiment suggests that a transient treatment with 3DA alleviates senescence and produces beneficial effects extending beyond the treatment time.
Figure 2. Treatment with 3-deazaadenosine attenuates replicative and oncogene-induced senescence.
a, Left, quantification of immunofluorescence staining for BrdU of IMR90 tet-TRF2ΔBΔM cells 3 days after treatment with doxycycline or vehicle (DMSO) and increasing concentrations of 3DA (n = 4). The statistical significance was calculated using one-way ANOVA. Right, representative immunofluorescence images. BrdU incorporation, which indicates proliferation, is stained in red. Scale bar, 100 μm. b, Left, quantification of immunofluorescence staining for BrdU in young (population doubling (PD) 24) versus old (PD ~38-44) IMR90 cells after treatment with 10 μM 3DA or vehicle (DMSO) (n = 3). The statistical significance was calculated using unpaired two-tailed t-tests. Right, crystal violet-stained, young and old IMR90 cells treated with 3DA or vehicle (DMSO). Images are a representative experiment out of 3. c, Left, quantification of immunofluorescence staining for BrdU of IMR90 ER:RAS cells 4 days after treatment with 4OHT or vehicle (DMSO) and increasing concentrations of 3DA (n = 4). The statistical significance was calculated using one-way ANOVA. Right, crystal violet-stained, six-well dishes of IMR90 ER:RAS cells treated with 3DA or vehicle (DMSO). Images are a representative experiment out of 3. d, Left, representative images of SA-β-Galactosidase staining of IMR90 ER:RAS cells 8 days after treatment with 4OHT or vehicle (DMSO) and 3DA; right, quantification (n = 3). The statistical significance was calculated using one-way ANOVA. Scale bar, 100 μm. e, Single-cell nuclear intensity values for p16INK4a in control and senescent IMR90 ER:RAS cells treated with 10 μM 3DA or vehicle (DMSO) for 6 days in a representative experiment out of 4 (n = 200 cells per condition). The statistical significance was calculated using unpaired two-tailed t-test. All error bars represent mean ± s.d; n represents independent experiments.
AHCY knockdown prevents induction of senescence
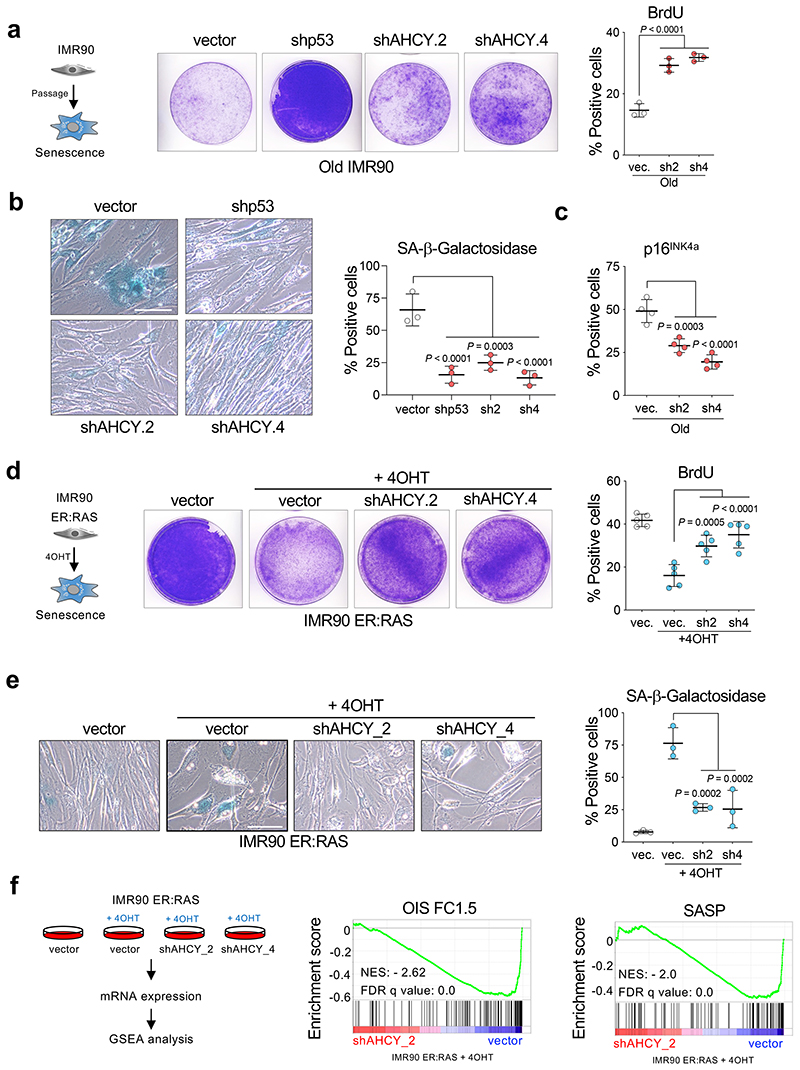
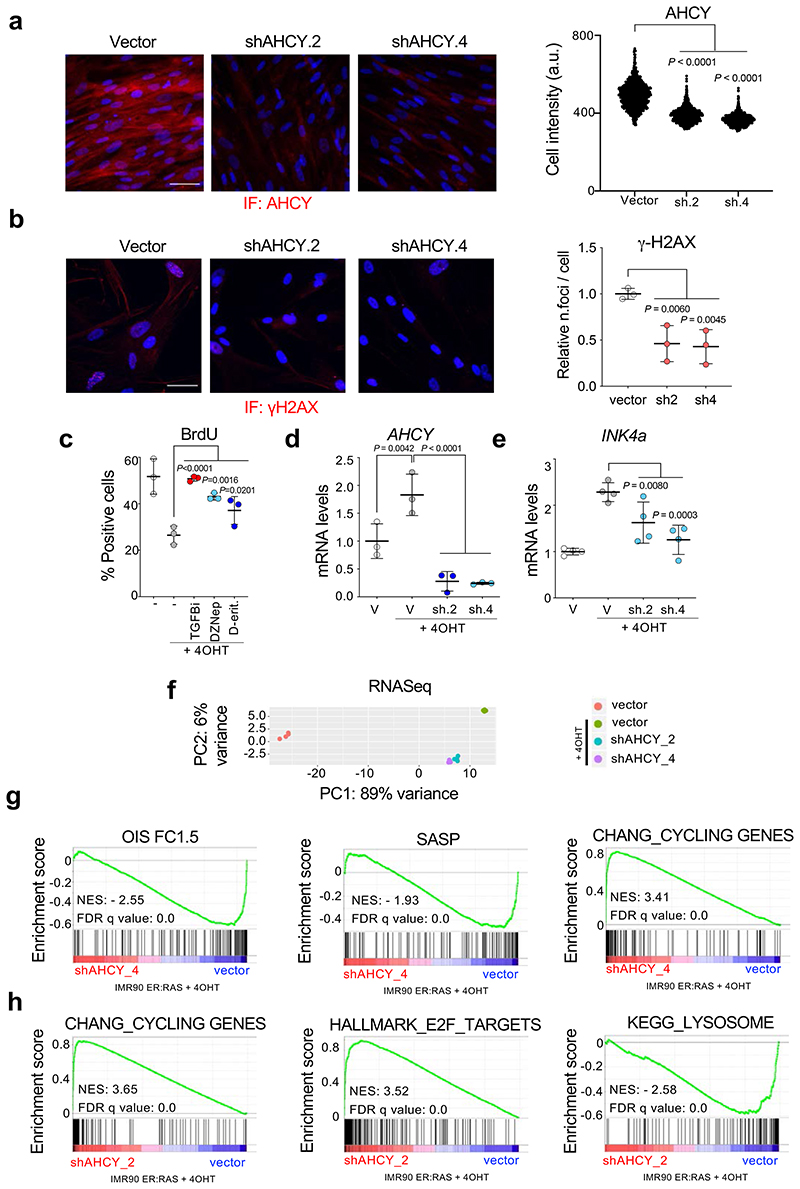
3DA inhibits S-adenosylhomocysteinase (AHCY) 16. To understand whether prevention of senescence by 3DA is due to on-target inhibition of AHCY, we designed two shRNA vectors that knocked down AHCY (Extended Data Fig. 3a). AHCY depletion increased the proliferative potential of old IMR90 cells, as assessed by colony formation (Fig. 3a, middle) and BrdU incorporation (Fig. 3a, right). Moreover, knockdown of AHCY resulted in reduced senescence of IMR90 cells, as shown by a decrease in the percentage of cells positive for SA-β-galactosidase (Fig. 3b), p16INK4a expression (Fig. 3c), and DNA damage (Extended Data Fig. 3b). Two other AHCY inhibitors, 3-deazaneplanocin (DZNep) and D-eritadenine (D-Erit), also prevented the growth arrest associated with OIS induction, further suggesting that the effect is on-target (Extended Data Fig. 3c). Knockdown of AHCY (Extended Data Fig. 3d) also prevented OIS, alleviating the senescent cell growth arrest (Fig. 3d), resulting in a decreased percentage of cells positive for SA-β-galactosidase (Fig. 3e) and reduced expression of p16INK4a (Extended Data Fig. 3e). Of note, AHCY expression was upregulated in cells undergoing OIS (Extended Data Fig. 3d). To better understand how AHCY knockdown impacts senescence onset, we performed transcriptome analysis of senescent cells after AHCY knockdown (Fig. 3f and Extended Data Fig. 3f-h). Principal component analysis (PCA) placed cells with reduced AHCY expression in an intermediate position between growing and senescent cells (Extended Data Fig. 3f). Gene set enrichment analysis (GSEA) further confirmed that depletion of AHCY with two independent shRNAs prevented senescence and caused downregulation of the SASP while increasing proliferation (Fig. 3f and Extended Data Fig. 3g-h). Overall, the above results indicate that inhibition or depletion of AHCY prevents senescence onset.
Figure 3. AHCY knockdown attenuates replicative and oncogene-induced senescence.
a, Left, crystal violet-stained, old (PD ~40-44) IMR90 cells infected with different pGIPZ shRNAs against AHCY, TP53 or the parental pGIPZ vector. Images are from a representative experiment out of 3. Right, quantification of immunofluorescence staining for BrdU incorporation in cells from the same experiment (n = 3). b, Left, representative images of SA-β-Galactosidase staining. Scale bar, 100 μm; right, quantification (n = 3). c, Quantification of cells expressing p16INK4a as measured by IF (n = 4). d, Left, crystal violet-stained, cultures of IMR90 ER:RAS cells infected with different pGIPZ shRNAs against AHCY, TP53 or the parental pGIPZ vector. Images are a representative experiment out of 3. Right, quantification of immunofluorescence staining for BrdU of cells from the same experiment (n = 5). e, Left, representative images of SA-β-Galactosidase staining. Scale bar, 100 μm; right, quantification (n = 3). f, Left, experimental design for transcriptional profiling of IMR90 ER:RAS cells infected with two different pGIPZ shRNAs against AHCY or the parental pGIPZ vector. Right, GSEA signatures for oncogene-induced senescence and SASP. All statistical significances were calculated using one-way ANOVA. All error bars represent mean ± s.d; n represents independent experiments.
Impaired histone H3 K36 methylation upon 3DA treatment
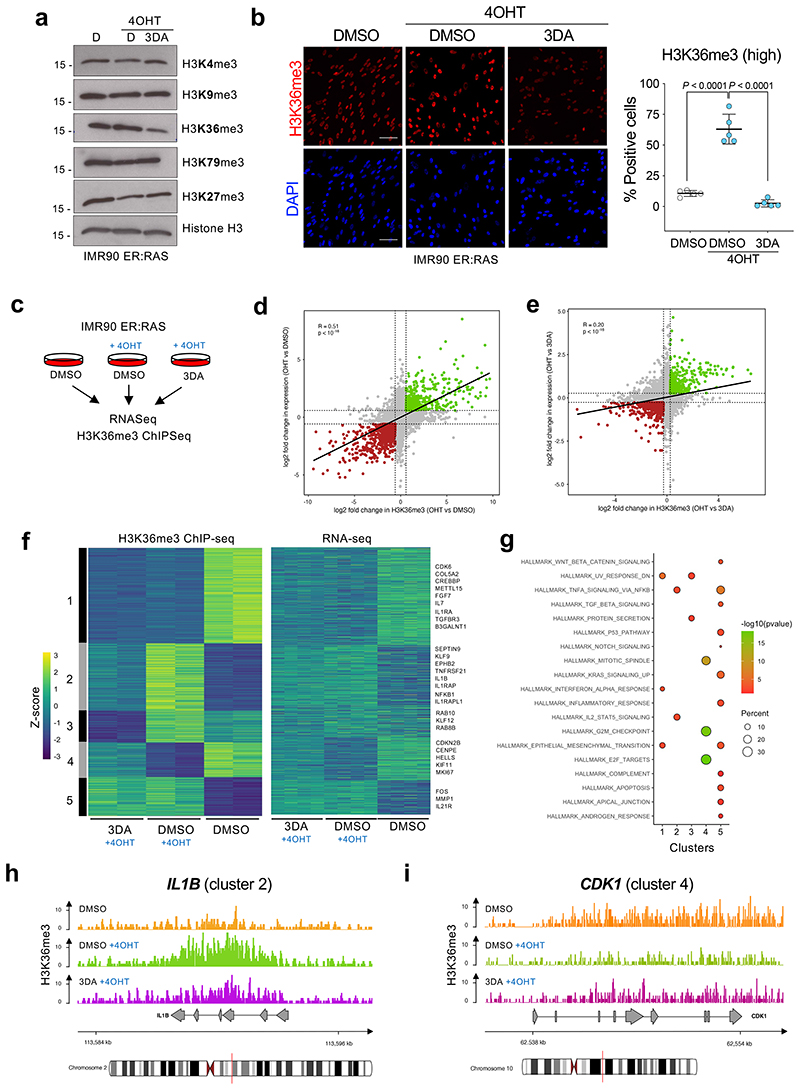
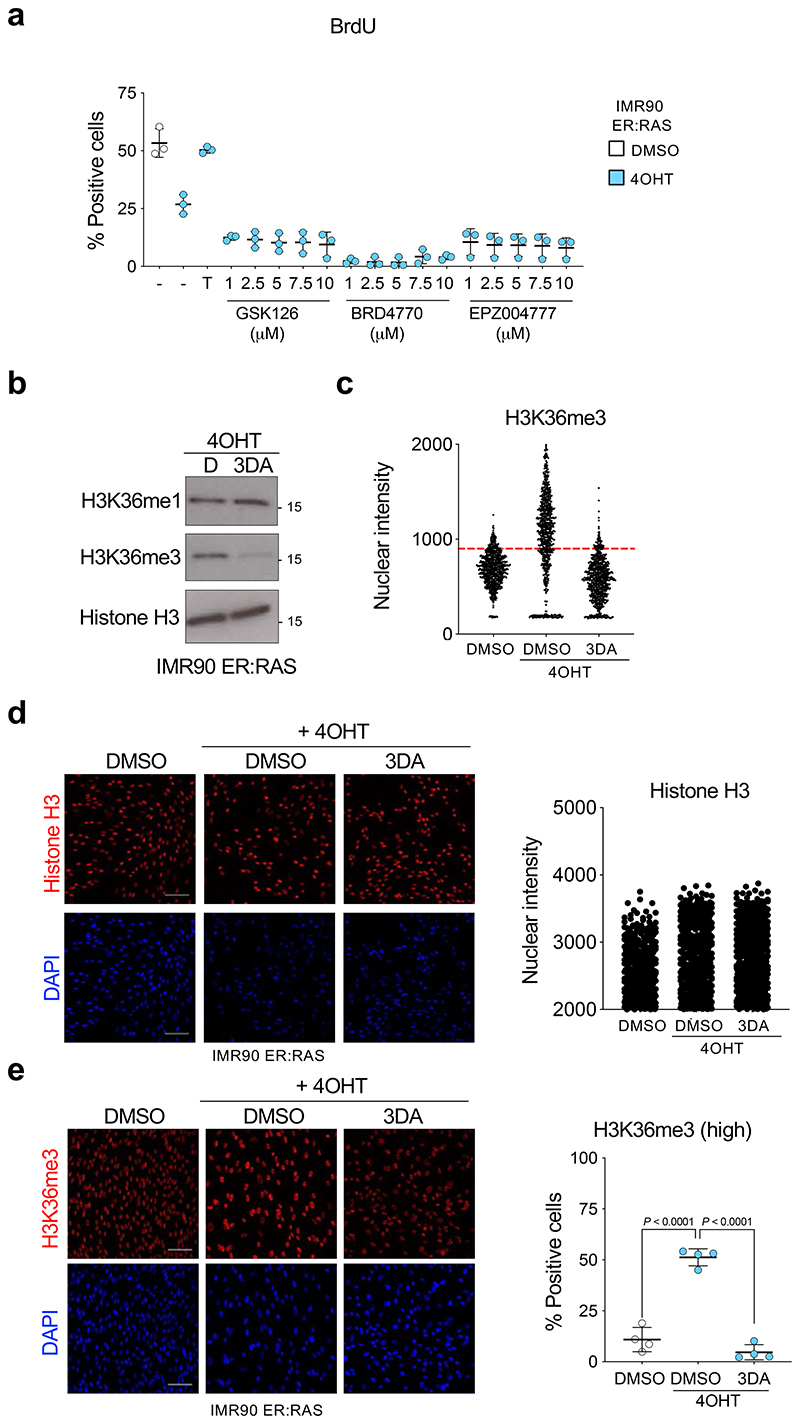
3DA inhibits S-adenosylhomocysteinase (AHCY), leading to the accumulation of adenosylhomocysteine, and to by-product inhibition of S-adenosyl-L-methionine (SAM)-dependent methyltransferases 22. Interestingly, AHCY inhibition has been shown to affect the activity of a specific histone methylase, EZH2 (that methylases H3 K27) in cancer cells 23. However, treatment with either GSK126 (an inhibitor of the H3 K27 methylase EZH2), BRD4770 (an inhibitor of the H3 K9 methylase EHMT2) or EPZ004777 (an inhibitor of the H3 K79 methylase DOT1L) rather than prevent, exacerbated senescence (Extended Data Fig. 4a). To investigate whether 3DA affects histone methylation, we analysed different histone marks by western blot. H3K36me3 was the only histone mark reduced in 3DA-treated senescent cells (Fig. 4a). Consistent with the overall decrease of H3K36me3 levels, we detected a higher H3K36me1 level in 3DA-treated senescent cells (Extended Data Fig. 4b). Taking advantage of quantitative IF, we observed that treating cells undergoing OIS with 3DA resulted in lower levels of H3K36me3. The latter was quantified at the single-cell level using a stringent threshold (Fig. 4b, Extended Data Fig. 4c). This difference was not linked to a change in overall histone 3 levels (Extended Data Fig. 4d), was already present at the early stages of OIS induction (Fig. 4b, day 4) and persisted upon senescence establishment (Extended Data Fig. 4e, day 6).
Figure 4. 3DA treatment affects histone H3 K36 methylation during OIS.
a, Immunoblots of histones extracted from IMR90 ER:RAS cells after 4OHT induction and treatment with 10 μM 3DA or vehicle (DMSO). Immunoblot of Histone H3 is included as a sample processing control. Immunoblots are a representative experiment out of three. b, Left, representative immunofluorescence images of H3K36me3 staining (red) in IMR90 ER:RAS cells 4 days after 4OHT induction. Cells were treated with 10 μM 3DA or vehicle (DMSO). Scale bar, 100 μm; right, quantification (n = 5). Statistical significances were calculated using one-way ANOVA. Error bars represent mean ± s.d; n represents independent experiments. c, Experimental design for transcriptional profiling of IMR90 ER:RAS cells 6 days after after 4OHT induction and treatment with 10 μM 3DA or vehicle (DMSO). d, Fold-fold plot comparing fold change in gene expression and ChIP-seq signal in 4OHT versus DMSO treatment. e, Fold-fold plot comparing fold change in gene expression and ChIP-seq signal in 3DA versus 4OHT treatment. The Pearson’s product-moment correlation R and the associated p-value are reported in d and e. f, Heatmap depicting the level of H3K36me3 ChIP-seq signal (Z-score) and the expression level of the closest / overlapping genes (Z-score) for peaks defined as differential between DMSO + OHT vs DMSO, or 3DA + OHT vs DMSO. ChIP-seq data were partitioned into five modules using k-mean clustering. Example genes are displayed on the right side for each module. g, Functional over-representation map depicting enriched hallmark genesets for each module. Circles are colour coded according to the FDR-corrected p-values based on the hypergeometric test. Size is proportional to the percentage of genes in the hallmark gene set belonging to the cluster. hi, Representative genome browser snapshots showing H3K36me3 normalized signal at IL1B (module 2, h) and CDK1 (module 4, i) gene loci for DMSO (orange), DMSO + 4OHT (green) and 3DA + 4OHT (violet) conditions. Data are expressed as normalized counts per million reads (CPM) in 200bp non-overlapping windows.
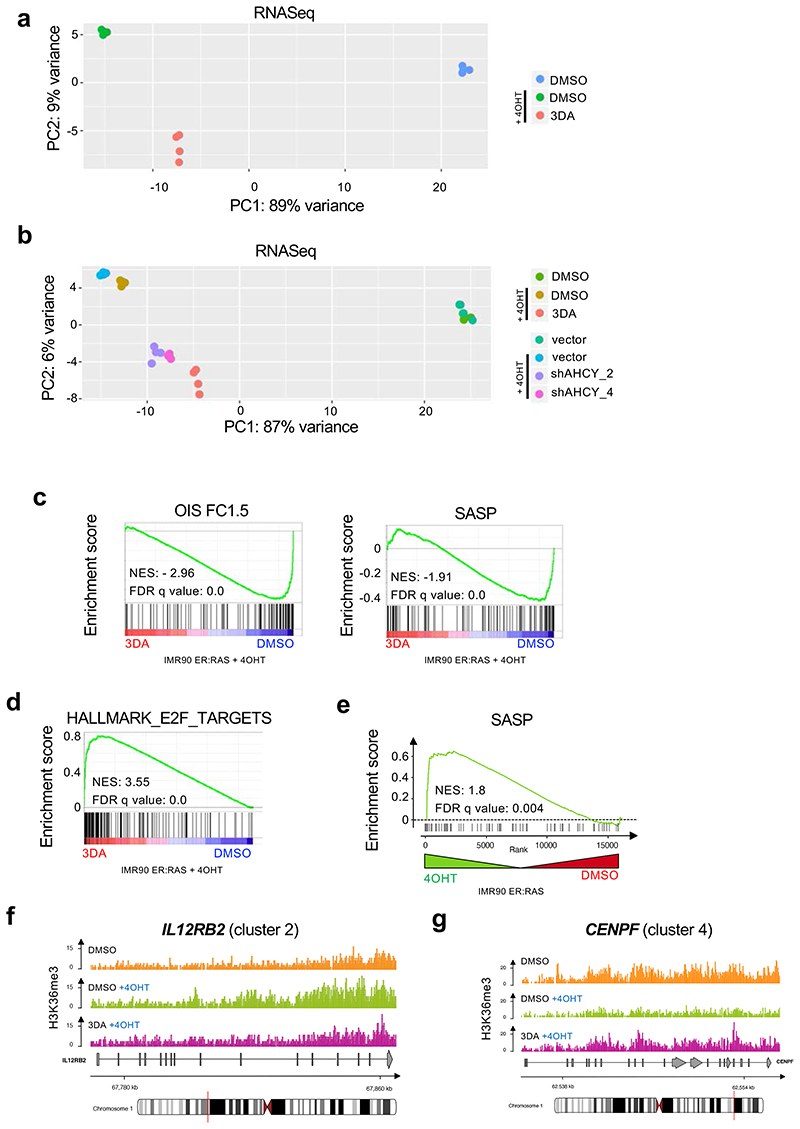
To dissect further the gene-regulatory mechanism of 3DA treatment, we determined global gene expression profiles by RNA-seq. We comprehensively mapped genomic H3K36me3 by ChIP-seq in proliferating (DMSO), senescent (4OHT plus DMSO), and 3DA-treated senescent cells (4OHT plus 3DA, Fig. 4c). Transcriptome PCA analysis, showed that senescent cells treated with 3DA, clustered with senescent cells in which AHCY has been knocked down and were found in an intermediate place between growing and senescent cells (Extended Data Fig. 5a,b). GSEA confirmed that 3DA treatment prevented senescence, resulting in downregulation of the SASP and other senescence signatures and upregulation of E2F-related signatures (Extended Data Fig. 5c,d). Methylation of H3K36 is mostly associated with transcription of active euchromatin, although it has also been implicated in other processes 24. Intriguingly, GSEA showed an enrichment of H3K36me3 levels in SASP genes during OIS (Extended Data Fig. 5e). Integrative analysis revealed a genome-wide positive correlation (R = 0.51, p < 10, Fig. 4d) between H3K36me3 levels and transcriptome changes in senescent cells when compared to proliferating cells. The correlation was weaker when senescent cells were compared to 3DA-treated senescent cells (R = 0.20, p < 10-16, Fig. 4e). The data suggested that 3DA impacts H3K36me3 levels and transcription differentially across the genome. To stratify and visualize this differential impact, we performed k-means clustering and functional overrepresentation profiling (Fig. 4f), which identified five correlated H3K36me3-gene expression modules (Sup. Table 1), revealing three key features. First, H3K36me3 levels drop globally upon 3DA treatment in senescent cells (664 among a total of 1926 regions, see modules 2-3, Fig. 4f), thus, corroborating the immunoblot results of Figure 4a and this drop is mirrored, by-and-large, in a decrease in gene expression (3DA-responsive genes). Second, some loci surprisingly accumulate (268 amongst a total of 1926 regions, see cluster 4) or display no change in H3K36me3 levels (994 amongst a total of 1926 regions, see modules 1 and 5) (3DA-unresponsive genes) and this is mirrored in an increase or no change in gene expression. Third, functional overrepresentation profiles disclosed that amongst the 3DA-responsive genes (modules 2-3), i.e., genes that showed a concomitant decrease in H3K36me3 levels and gene expression, there was a subset of SASP genes such as IL1B (Fig. 4g-h) and IL12RB2 (Extended Data Fig. 5f). Interestingly, among the genes showing an increase in H3K36me3 levels and gene expression (module 4), were many E2F targets involved in cell cycle progression, such as CDK1 (Fig. 4i) or CENPF (Extended Data Fig. 5g). Together, our data suggest that 3DA treatment differentially impacts H3K36me3 to affect senescence.
Disrupting H3K36 methylation affects senescence induction
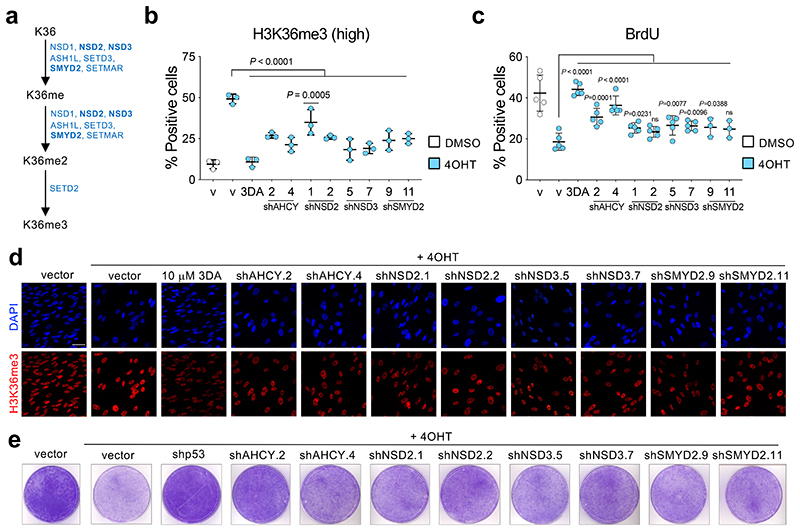
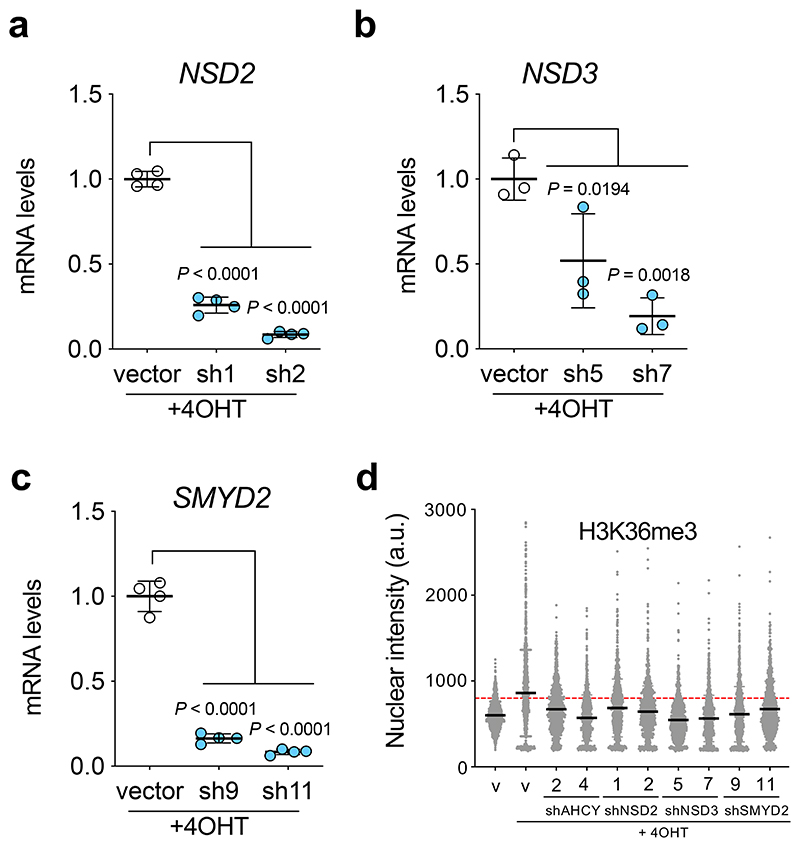
The changes in H3K36 methylation might explain how 3DA prevents senescence or could just be a consequence of senescence prevention. To distinguish between these two possibilities, we decided to target H3K36 methylation directly. Given that at least 8 methyltransferases regulate H3K36 methylation (Fig. 5a), we decided to test how three of these enzymes (NSD2, NSD3 and SMYD2) affect H3K36me3 and growth arrest during OIS. To this end, we generated shRNAs targeting NSD2, NSD3 and SMYD2 (Extended Data Fig. 6a-c). Knockdown of these methyltransferases resulted in reduced overall H3K36me3 levels during OIS (Fig. 5b, d and Extended Data Fig. 6d). Knockdown of these enzymes partially prevented the growth arrest induced during OIS, as assessed measuring BrdU incorporation (Fig. 5c) or assessing colony formation (Fig. 5e). The extent of prevention achieved upon knockdown of NSD2, NSD3 or SMYD2 was lower than that caused by knockdown of AHCY or treatment with 3DA, suggesting redundancy and open the possibility to other additional mechanisms. Overall, our results indicate that 3DA prevents senescence at least in part through indirect inhibition of H3K36 methyltransferases.
Figure 5. Interfering with H3K36 methyltransferases affects senescence induction.
a, Eight different methyltransferases - NSD1, NSD2, NSD3, ASH1L, SETD2, SETD3, SMYD2, SETMAR - are involved in the sequence leading to histone H3 tri-methylation at lysine 36. b, Quantification of immunofluorescence staining for H3K36me3 7 days after vehicle (DMSO) or 4OHT induction of IMR90 ER:RAS cells infected with different pGIPZ shRNAs against NSD2, NSD3, SMYD2, AHCY or the parental pGIPZ vector (n = 3). Treatment with 3DA was included as positive control. c, Quantification of immunofluorescence staining for BrdU 4 days after vehicle (DMSO) or 4OHT induction from the experiment described in b (n = 5 except for SMYD2 n = 3). d, Representative immunofluorescence images of H3K36me3 staining (red). Scale bar, 50 μm. Quantification is shown in b. e, Crystal violet-stained, 10 cm dishes of IMR90 ER:RAS from the experiment described in b. All statistical significances were calculated using one-way ANOVA. All error bars represent mean ± s.d; n represents independent experiments.
3DA enhances engraftment of geriatric muscle stem cells
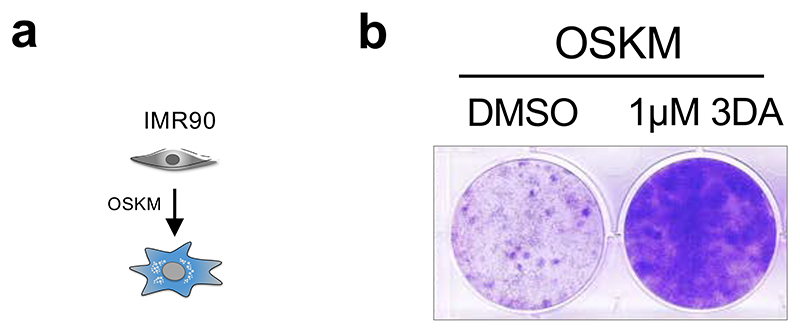
The accumulation of senescent cells contributes to ageing and disease and limits the proliferative potential of old cells, including stem cells 5. Intriguingly, the AHCY inhibitor DZNep has been shown to facilitate the generation of induced pluripotent stem cells (iPSCs) by stimulating Oct4 expression 25. We previously showed that senescence limits the generation of iPSCs, a process termed reprogramming-induced senescence (RIS) 26. Therefore, we asked the question as to whether 3DA could also inhibit RIS. IMR90 fibroblasts were transduced with a retroviral vector expressing reprogramming factors (OCT4, SOX2, KLF4, and cMYC, collectively referred to as OSKM, Extended Data Fig. 7a). Indeed, treatment with 1 μM 3DA prevented the senescence-associated growth arrest induced during reprogramming (Extended Data Fig. 7b).
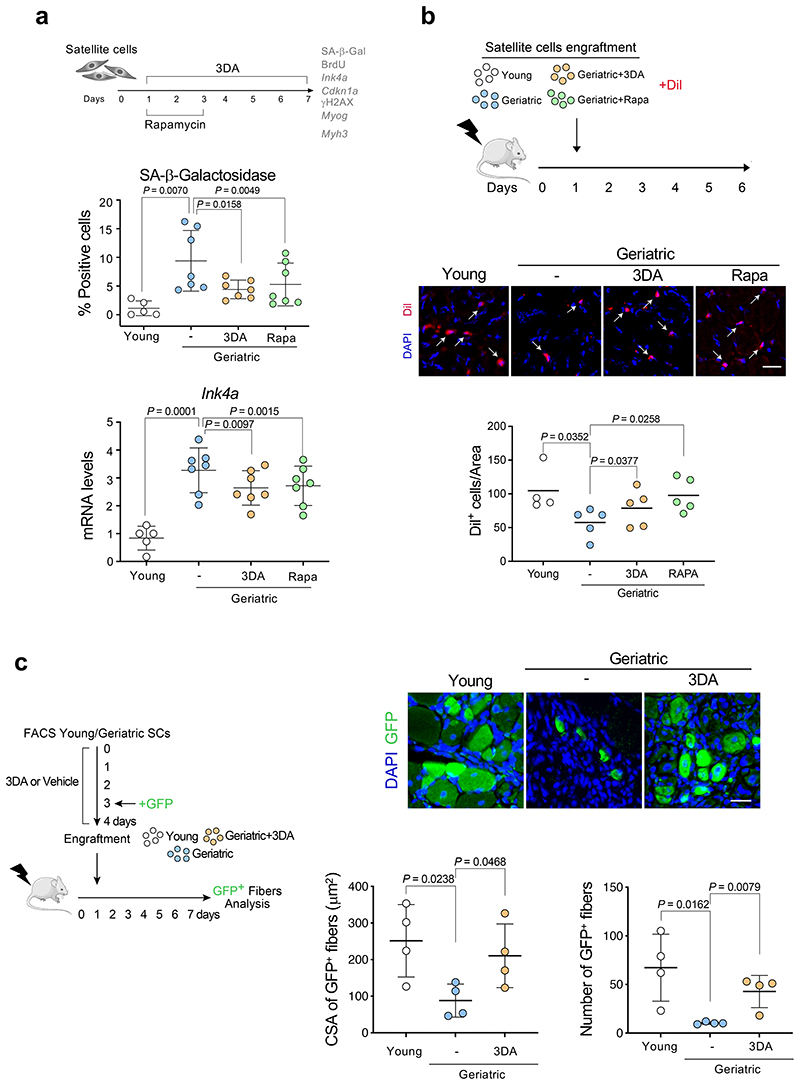
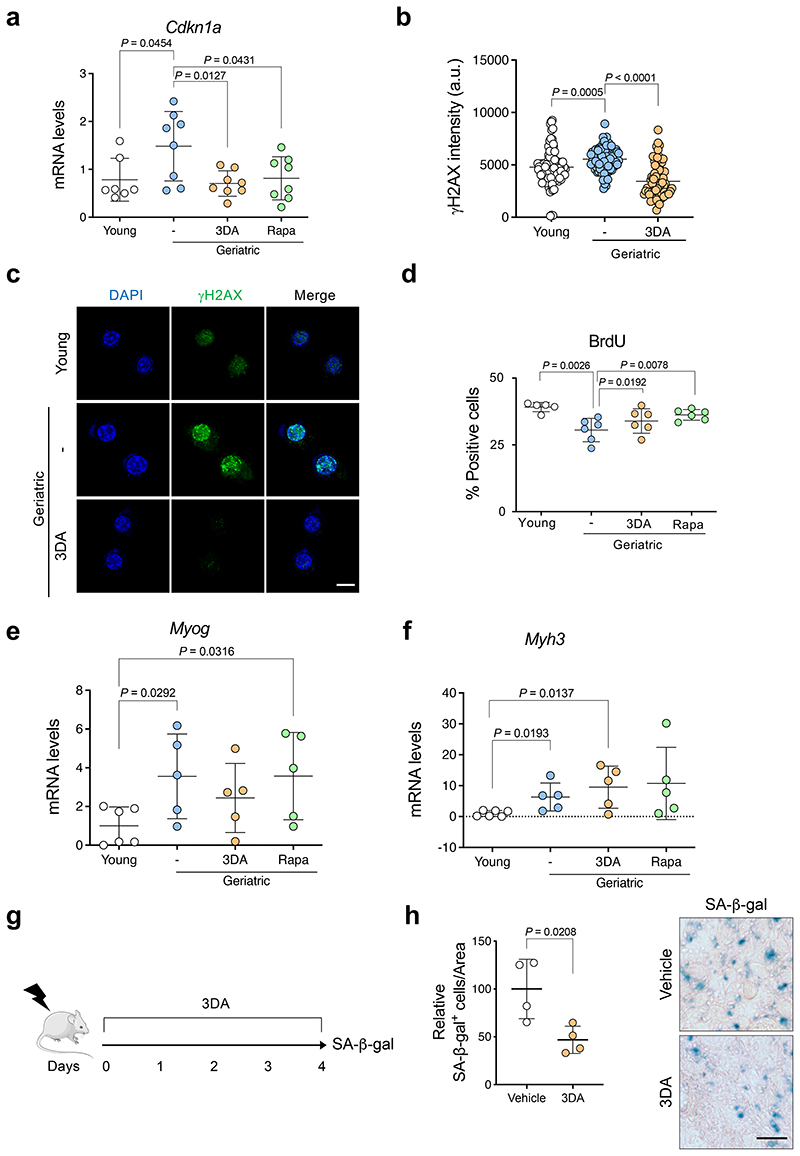
To investigate whether 3DA can mitigate the detrimental effects of physiological age-induced senescence, we used skeletal muscle stem cells (also known as satellite cells) from very old (geriatric) mice. Satellite cells sustain skeletal muscle regeneration and their regenerative decline at geriatric age has been attributed to senescence entry and loss of proliferative potential 14. Of note, induction of autophagy by rapamycin treatment can prevent senescence and induce proliferation in cultured geriatric satellite cells 27. Accordingly, we next tested the functional consequences of 3DA treatment on satellite cells isolated from geriatric mice, using rapamycin as an experimental control (Fig. 6a). We observed that treatment with 3DA reduced the percentage of senescent geriatric satellite cells, as assessed by SA-β-galactosidase staining (Fig. 6a) or by quantifying the expression of Ink4a (that encodes for p16Ink4a, Fig. 6a), Cdkn1a (that encodes for p21Cip1, Extended Data Fig. 8a), and the intensity of g-H2A.X (as indicator of DNA damage, Extended Data Fig. 8b, c). Satellite cells derived from young mice were analysed in parallel as a negative control for senescence entry (Fig. 6a). While treatment of myoblasts with 3DA was described to induce differentiation into myofibers 28, a higher proportion of geriatric satellite cells treated with 3DA or rapamycin retained replicative potential, as measured by quantification of BrdU incorporation (Extended Data Fig. 8d), consistent with reduced expression of myogenic differentiation-specific genes (Myogenin, Myog; and Myosin heavy chain 3, Myh3) (Extended Data Fig. 8e-f).
Figure 6. 3DA enhances the proliferative and engraftment potential of geriatric satellite cells in conditions of muscle damage.
a, Experimental design. Satellite cells isolated from muscles of young (2-3 months, n = 5) versus geriatric (28-31 months, n = 7) mice and were cultured for 7 days. Cells were treated with 10 μM 3DA during 6 days or with 100 ng/ml rapamycin for 2 days as indicated. Results from these experiments are shown in this figure and Extended Data Fig. 8a-d. Quantification of SA-β-Galactosidase staining and expression levels for mouse Ink4a mRNA (encoding for p16Ink4a) are shown. b, Experimental design. Equal numbers of satellite cells isolated from young and geriatric mice, previously treated with 3DA, rapamycin or vehicle, were stained with Dil, and transplanted into pre-injured muscle of recipient immunodeficient mice for 5 days. Representative images of Dil+ cells in cryosections of tibialis anterior muscle after 5 days of engraftment (arrows indicate Dil+ cells) and quantification of Dil+ cells (n = 4 for young; n=5 for geriatric) are shown. c, Experimental design. Equal numbers of satellite cells, freshly isolated from young and geriatric mice, were treated with 3DA or vehicle, transduced with GFP lentivirus, and transplanted into the pre-injured muscle of the recipient immunodeficient mice for 6 days. Representative images of GFP+ fibers in cryosections of tibialis anterior muscle after 6 days of engraftment and quantification of cross-sectional area (CSA) and the number of GFP+ fibers (n = 4 mice per group). Statistical significances were calculated using two-tailed paired t test for geriatric versus geriatric 3DA (Fig 6b) and two-tailed unpaired t test for the rest of the graphs. All error bars represent mean ± s.d; n represents number of mice. Scale bars 20 μm. This figure was partly generated using Servier Medical Art, provided by Servier, licensed under a Creative Commons Attribution 3.0 unported license.
To investigate whether 3DA (or rapamycin) treatment could rescue the cell-intrinsic regenerative block of geriatric cells, we engrafted young and geriatric satellite cells (pretreated with 3DA or rapamycin, or the control vehicle, and stained with Dil) into pre-injured muscles of immunodeficient recipient mice (Fig. 6b). We found that 3DA treatment significantly restored expansion of geriatric cells after a four-day engraftment (Fig. 6b). To assess the functional impact, we treated freshly isolated satellite cells from young and geriatric animals with 3DA or vehicle, labelled with green fluorescent protein (GFP), and injected them into pre-injured immunodeficient mice. Six days post-transplantation, we assessed the number and size of the GFP+ fibers derived from the engrafted satellite cells (Fig 6c). As expected 29, we observed a marked decrease in the engrafting potential of geriatric satellite cells compared to young cells. Strikingly, pre-treatment with 3DA restored the engrafting and regenerative capacity of geriatric satellite cells, as observed by the increased number of the newly generated GFP+ fibers and their larger cross-sectional area (CSA), similar to that obtained by engraftment of young SCs (Fig 6c).
In addition, treatment of mice with 3DA reduced the number of SA-β-gal+ cells in injured muscle (Extended Data Fig. 8g-h). Overall, the above results suggest that the ability of 3DA to prevent senescence is not restricted to fibroblasts but extends to somatic stem cells. Treatment with 3DA alleviates the detrimental effects of senescence, ameliorates the age-associated loss of stem cell function in vivo under tissue regeneration conditions and has functional implications, such as the qualitative and quantitative enhanced formation of myofibers in response to muscle injury.
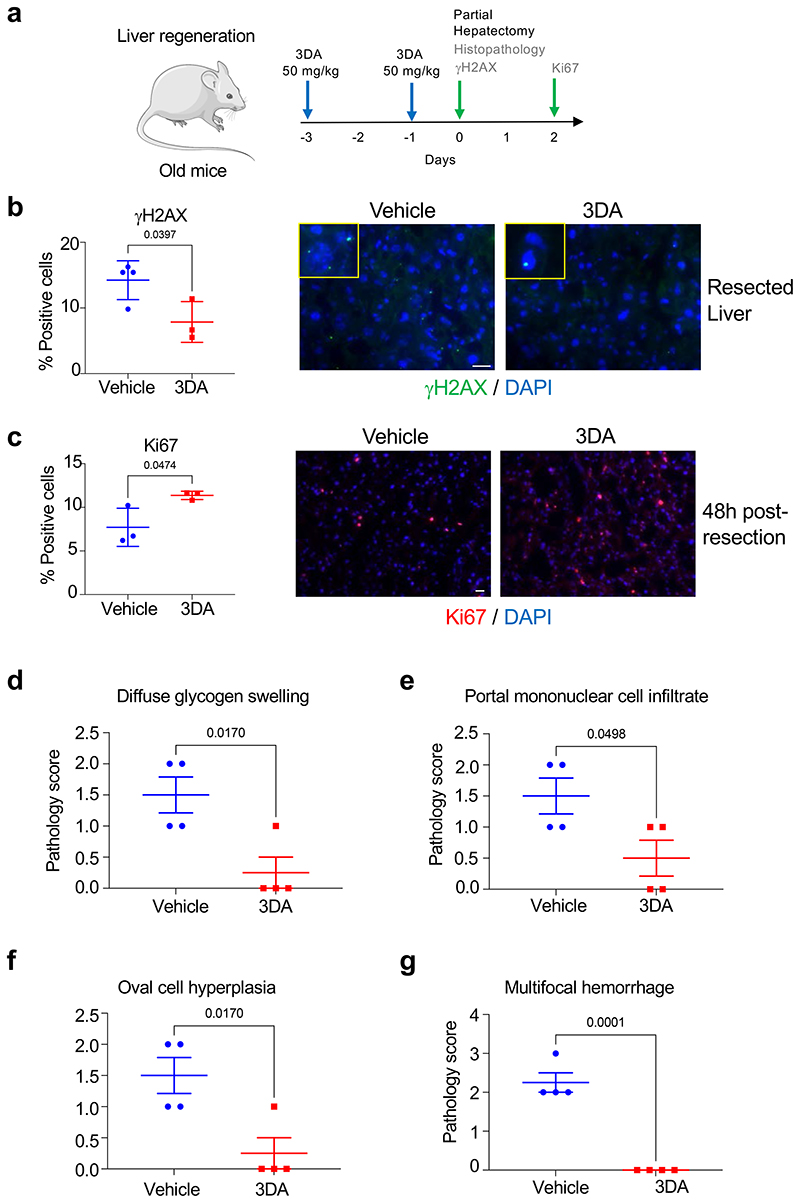
Preliminary results from a model of liver regeneration in aged mice showed that pretreatment with 3DA reduces the number of cells showing DNA damage enhances their regenerative potential after partial liver resection (Extended Data Fig. 9a-c). In addition, histological assessment of the livers from aged mice treated with 3DA showed an improvement in several pathological parameters (Extended Data Fig. 9d-g). An increase in glycogen aggregates had been observed in senescent cells and aged tissues 30. Treatment with 3DA resulted in reduced diffuse glycogen swelling (Extended Data Fig. 9d). Liver regeneration is normally driven by hepatocyte proliferation. Oval cell hyperplasia is used as an alternative regeneration mechanism when hepatocyte proliferation is impaired (e.g. when hepatocytes are driven into senescence) 31,32. Oval cell hyperplasia was present in control mice but largely absent in mice treated with 3DA (Extended Data Fig. 9f). These experiments further suggest that 3DA can positivly impact regeneration by targeting cellular senescence
3DA ex vivo improves umbilical cord blood cells engraftment
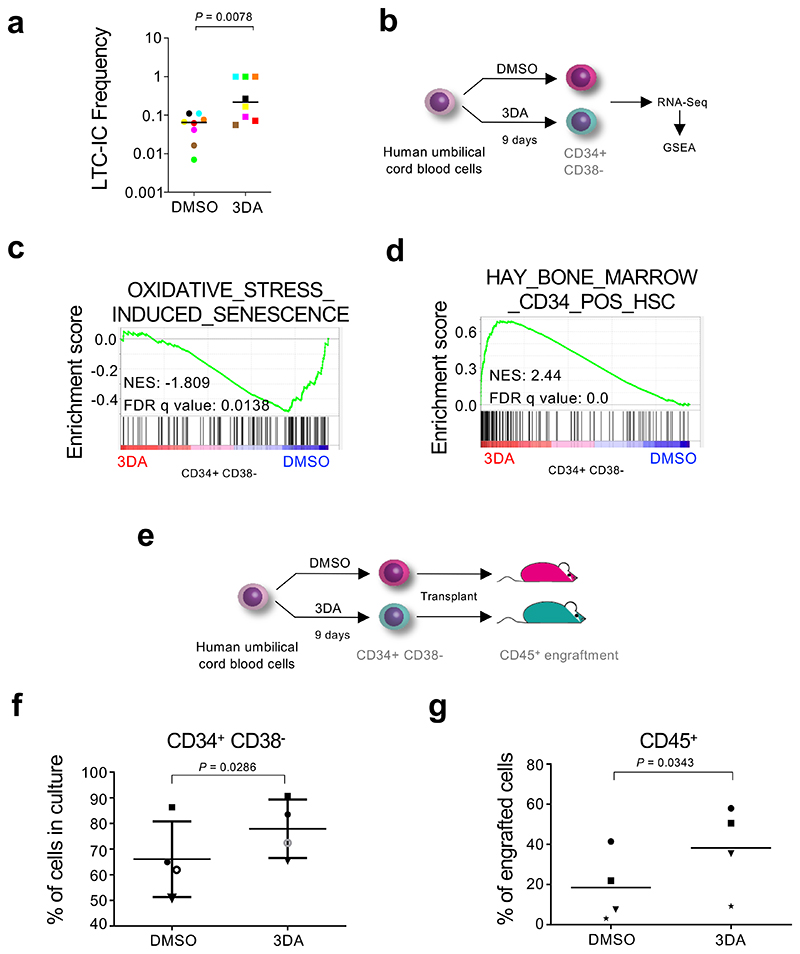
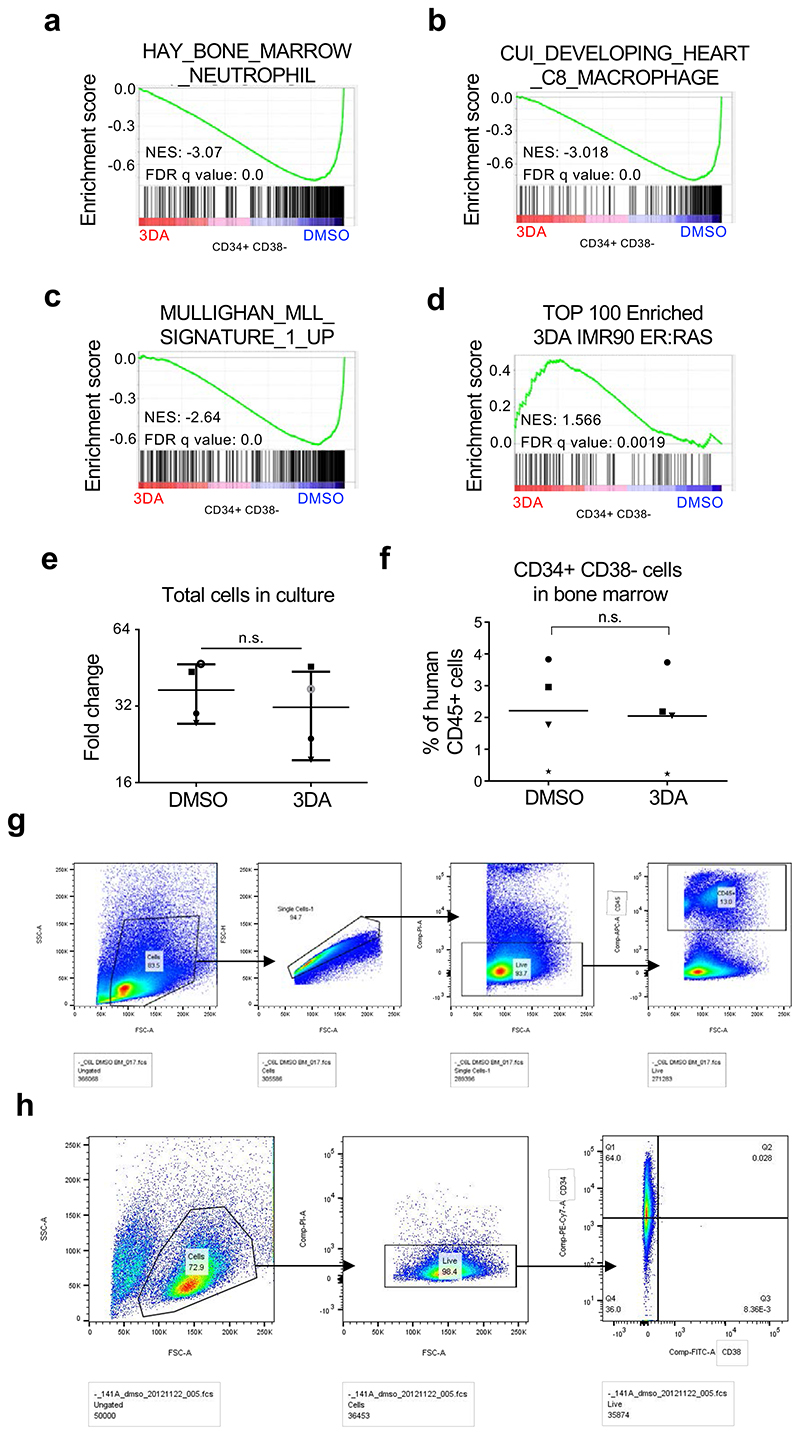
Allogeneic transplantation of hematopoietic stem cells (HSC) is a standard therapy for many blood disorders. Umbilical cord blood (UCB) is a source of HSC for transplant that allows for less stringent cross-matching and results in lower incidence of graft versus host disease 33. A factor limiting a more widespread adoption of UCB for transplants is the low number of HSCs found per UCB unit that can compromise grafting efficiency in adults 34. Ex vivo expansion of HSCs is invariably associated with loss of stem cell potential. We assessed whether treatment with 3DA could increase the frequency of human primitive hematopoietic stem and progenitor cells (HSPCs). To this end, we performed in vitro long-term cultureinitiating cells assays (LTC-IC) to detect and quantitate primitive human hematopoietic cells. We cultured sorted CD34+ cells in the presence of 10 μM 3DA for five weeks and replaced after five weeks the medium through methylcellulose for two further weeks. Treatment with 3DA caused a significant increase in the long-term culture-initiating cell frequency (LTC-IC), suggesting that 3DA prevents loss of stem cell potential in human cord-blood derived HSPCs in vitro (Fig. 7a). In line with these results, in vitro suspension culture of cord-blood derived CD34+ HSPCs in the presence of 10 μM 3DA for nine days (Fig. 7b) resulted in an increase in the percentage of UCB cells with stem cell potential (CD34+ CD38-, Fig. 7f, and Extended Data Fig. 10g)), but not in the total number of cells (Extended Data Fig. 10e).
Figure 7. 3-deaazadenosine improves the engraftment of umbilical cord blood cells.
a, Frequency of long-term culture initiating cells of cord blood-derived CD34+ cells upon treatment with 10 μM 3DA or the vehicle (DMSO). The number of cells that needed to be plated for one LTC-IC to develop is indicated. Identically coloured circles indicate paired experimental and control samples that originate from the same cord. Statistical significance was determined using two-tailed Wilcoxon matched-pairs signed rank test (n = 8 independent experiments). b, Experimental design for the cord blood RNA-seq experiment. c, GSEA signature for oxidative stress-induced senescence. d, GSEA signature for Hay bone marrow CD34+ hematopoietic stem cells (HSC). e, Experimental design for the cord blood transplant experiment. f, Cord blood derived human hematopoietic stem and progenitor (CD34+) cells were treated at day 1, 4 and 7 with 10 μM 3DA or DMSO and analysed before xenotransplantation at day nine. Changes in cell surface markers CD34 and CD38 were analyzed by flowcytometry. The percentage of CD34+CD38-cells is shown. Data are represented as mean ± SD. g, 1.5x10⁶ cells from the experiment described in c. were transplanted into NSG mice. The engraftment of human (CD45+) cells in peripheral blood is significantly higher in the 3DA treated group. Data are represented as mean. For f and g, each shape (open cicle, closed circle, star, square or triangle) represents a different cord blood sample. Each shape is the average of 2-3 mice transplanted with that cord blood sample (n = 4 independent cord blood samples). Statistical significance was determined using two-tailed pared t test.
To elucidate if the enhanced stem cell potential of 3DA-treated cells was related to the 3DA effect on senescence, we carried out RNA-Seq of CD34+ CD38-cells after nine days of treatment with 3DA or vehicle (DMSO) (Fig. 7b). This analysis showed a reversion of senescence signatures (Fig. 7c, and Extended Data Fig.10d). Interestingly, and related to the effect that AHCY inhibitors have on stemness 25, we also observed that treatment with 3DA results in the upregulation of stemness (Fig. 7d) and downregulation of differentiation signatures (Extended Data Fig. 10a-b). The above results suggest that the increase in cell fitness caused by 3DA treatment could relate to both its ability to alleviate senescence and affect stemness.
Because human hematopoietic stem cell potential is best evaluated with xenotransplantation studies, we transplanted immunocompromised NSG mice with cells that had been exposed to 3DA for nine days and compared the engraftment of these cells with cells incubated in DMSO at 18-31 weeks after transplant (Fig. 7e). Even though 3DA treatment did not cause an increase of human CD34+ CD38-cells, nor an increase of total CD45+ population in bone marrow (Extended Data Fig. 10f), we did observe a significant increase of human donor-derived CD45+ cells present in peripheral blood of 3DA-treated CD34+ cells (Fig. 7g, and Extended Data Fig. 10h). Significantly, none of the mice xenotransplanted with 3DA-treated cells developed leukemia and we did not observe evidence of leukemogenic transformation (Extended Data Fig.10c), suggesting no acute safety concerns, at least in a transient ex vivo setting. Thus, the above experiments indicate that ex vivo treatment with 3DA during the process of UCB expansion prior to transplant is sufficient to increase the clonogenic potential of UCB-derived HSPCs and to preserve their stem cell potential.
Discussion
Research in the last decade has shown how senescent cells accumulate during ageing and contribute to pathologies as diverse as cancer, fibrosis, ophthalmological and neurodegenerative disease 5. Consequently, substantial work has been carried out to target senescence for therapeutic benefit. However, based on genetic evidence for their detrimental role 6,35, most of those efforts have concentrated on finding drugs that selectively kill senescent cells (senolytics) 7 or target the SASP 10,11. In the present study, we have taken an alternative strategy and screened for drugs that alleviate senescence. Amongst the compounds identified, 3-deazaadenosine (3DA), an S-adenosyl homocysteinase (AHCY) inhibitor, prevented senescence induced by different stressors. In particular, by using other drugs and shRNAs, we could confirm that the ability of 3DA to alleviate senescence was due to on-target AHCY inhibition.
Inhibition of AHCY leads to adenosyl-homocysteine accumulation and by-product inhibition of S-adenosyl-L-methionine (SAM)-dependent methyltransferases 22. Interestingly, the inhibition of AHCY in cancer cells impacted on EZH2-mediated methylation of histone H3K27 23. However, in the context of senescence induction, 3DA does not affect H3K27me3 but rather H3K36me3. H3K36me3 is a mark associated with gene bodies of transcribed genes. Thus, while we observed a global downregulation of H3K36me3 in senescent cells treated with 3DA, H3K36me3 changes were rather gene-specific. Amongst the genes part of module 2 (showing reduced H3K36me3 and reduced expression on 3DA treated cells) were SASP components, such as IL1B (Fig 4f-h). As we have previously demonstrated that interfering with IL1 signalling allows OIS escape 18, this could contribute to explain why treatment with 3DA alleviates senescence. The relation between 3DA, inhibition of H3K36me3 and senescence was confirmed by knockdown of several H3K36 methyltransferases blunted senescence induction. The partial effects observed might reflect multiple factors, such as the fact that there are at least 8 H3K36me3 methyltransferases, and the possibility that 3DA and AHCY affect other undefined pathways impacting on senescence regulation (e.g. by inhibiting other methyltransferases or through effects mediated by changes in levels of adenosine or homocysteine). Of note, acute NSD2 knockdown can induce senescence 36. Differences with our study might be caused by the partial NSD2 knockdown that we observe and point to context-dependent effects associated with histone methyltranferase inhibition.
Senescence of adult stem cells causes declines in tissue function 12,13, and this is particularly prominent in old age 14,27. We have been able to expand the protective role of 3DA to stem cells, including aged stem cells. While injured-induced senescence can facilitate reprogramming in vivo 37, including reprogramming of muscle stem cells (satellite cells) 38, it is well established that adult satellite cells lose their proliferative and regenerative potential during ageing due to increased entrance into senescence 14, and our results demonstrate that ex vivo treatment of satellite cells derived from geriatric mice with 3DA rescued these functional defects in vivo by alleviating senescence, resulting in a quantitative and qualitative improved formation of new myofibers derived from geriatric satellite cels in response to muscle injury.
Allogeneic transplantation of umbilical cord blood (UCB) is commonly used to treat many blood disorders. However, the efficiency of UCB-based therapies is affected by the low number of available stem cells. Therefore, different strategies have been devised to increase cord blood engraftment. Unbiased screens have identified compounds able to stimulate the expansion ex vivo of human cord blood cells 39,40. More recently, it has been shown that incubation with the matricellular regulator Nov increases the frequency of serially transplantable hematopoietic stem cells derived from UCB 41. We reasoned that alleviation of senescence could have similar effects. Therefore, treatment with 3DA could help increase the replicative potential and engrafting ability of UCB cells. Indeed, we observed that treatment with 3DA during the ex vivo expansion phase, increased the clonogenic potential of UCB cells and the number of stem cells present. Consequently, transplantation of these 3DA-treated cells resulted in increased engraftment in peripheral blood. As these effects are achieved after a short ex vivo treatment, this therapy does not present the risks associated with inhibiting senescence in vivo, ranging from negating positive acute senescence responses, to increased cancer risk due to inhibition of OIS. Our analysis did not unveil any evidence of increased oncogenic risk, but this needs to be evaluated more carefully. Since 3DA has the potential to cause epigenetic modifications, a long-term safety assessment would be needed before this study can be translated to the clinic. While our results suggest the translational potential of using 3DA to alleviate senescence and promote the efficiency of cell therapies, we have to highlight that this study took advantage of mouse models and further work is needed to establish the potential clinical relevance and feasibility.
In summary, we have identified 3DA as a compound alleviating senescence. 3DA inhibits AHCY and indirectly results in reduced H3K36me3, preventing the expression of components of the senescence program. Thus, our results suggest that 3DA is a candidate drug that could improve the efficiency of cellular therapies, in part, by inhibiting senescence.
Methods
Ethics
This research complied with all relevant ethical regulations, overseen by five ethics review boards: the ethics committee of the Barcelona Biomedical Research Park (PRBB) and the Catalan government (Spain) for the experiments involving mouse stem cells; the A*STAR BRC (Biological Resource Centre) IACUC Committee, IACUC protocol # 191452 (title of project: Identification of liver disease intervention points and enhancing liver regeneration) for the mouse liver regeneration experiment; the Medisch Ethisch Toetsings Commissie (METC) of Isala Hospital Zwolle (The Netherlands) for the acquisition of human cord blood samples, and the Institutional Animal Care and Use Committee of the University of Groningen (IACUC-RUG), with protocol number AVD1050020209624, for the xenotransplantation studies.
Drugs
The LOPAC 1,280 library was acquired from Sigma-Aldrich (LO1280). InhibitorSelect™ 96-well Protein Kinase Inhibitor Library I (539744), Library II (539745) and Library III (539746) were purchased from Merck. The following compounds were used in this study: Doxycycline hydrate (Sigma-Aldrich, D9891), 4-Hydroxytamoxifen (Sigma-Aldrich, H7904), 3-Deazaadenosine (Sigma-Aldrich, D8296), InSolution™ EZH2 inhibitor, DZNep (Merck, 506069), EZSolution™ GSK126 (BioVision, 2366-1), BRD4770 (Cayman Chemical, 11787), EPZ004777 (Selleckchem S7353), TGF-β RI kinase inhibitor II (Millipore, 616452), Rapamycin (LC Laboratories).
Antibodies
The following primary antibodies were used in this study: rat monoclonal anti-BrdU (BU1/75(ICR1); Abcam, ab6326) 1:2000, mouse monoclonal anti-p16INK4a (JC-8; from CRUK) 1:1000, rabbit polyclonal anti-p21 (M-19; Santa Cruz, sc-471) 1:200, mouse monoclonal anti-SAHH (A-11; Santa Cruz, sc-271389) 1:100, rabbit anti-phospho-histone H2A.X (Ser139) (Cell Signaling Technology, 2577) 1:50, mouse monoclonal anti-phosphohistone H2A.X (Ser139) (3F2; Thermo Fischer Scientific, MA1-2022) 1:250, rabbit polyclonal anti-Ki67 (Abcam, ab15580) 1:200, rabbit polyclonal anti-53BP1 (Novus Biologicals, NB100-304) 1:1000, rabbit monoclonal anti-Mono-Methyl-Histone H3 (Lys36) (D9J1D, Cell Signaling Technology, 14111) 1:1000, rabbit monoclonal anti-Tri-Methyl-Histone H3 (Lys36) (D5A7, Cell Signaling Technology, 4909) 1:1000, rabbit monoclonal anti-Tri-Methyl-Histone H3 (Lys4) (C42D8; Cell Signaling Technology, 9751) 1:1000, rabbit monoclonal anti-Tri-Methyl-Histone H3 (Lys9) (D4W1U; Cell Signaling Technology, 13969) 1:1000, rabbit monoclonal anti-Tri-Methyl-Histone H3 (Lys27) (C36B11; Cell Signaling Technology, 9733) 1:1000, rabbit polyclonal anti-Tri-Methyl-Histone H3 (Lys79) (Cell Signaling Technology, 4260) 1:1000, rabbit polyclonal anti-H3 (Abcam, ab1791) 1:5000, and rabbit polyclonal anti-GFP (Invitrogen, A6455) 1:400. We used the following secondary antibodies: goat antimouse IgG (H+L) AlexaFluor□594 conjugated (Thermo Fischer Scientific, A11032) 1:500, goat anti-rat IgG (H+L) AlexaFluor□488 conjugated (Thermo Fischer Scientific, A11006) 1:500, goat anti-rabbit IgG-HRP (Santa Cruz, sc-2004) 1:5000, and biotinylated goat antirat antibody (712-066-150 Jackson Immunoresearch) 1:250.
Cell lines
IMR-90 (ATCC® CCL-186™) cells were obtained from ATCC. IMR90 ER:RAS cells were generated by retroviral infection of IMR90 cells and have been described elsewhere 15. IMR90 tet-TRF2DBDM cells were generated by infecting IMR90 cells with equal amounts of lentivirus containing rtTA3 and the iCMV-tight vector expressing TRF2DBDM as previously described 20. IMR90 were cultured in DMEM (Gibco) supplemented with 10% fetal bovine serum (Sigma; tetracycline free in the case of tet-inducible vectors) and 1% antibiotic-antimycotic solution (Gibco). To induce replicative senescence, IMR90 tet-TRF2DBDM were treated with 50 ng/ml doxycycline reconstituted in distilled water for 3 days. To induce OIS, IMR90 ER:RAS were treated with 100 nM 4-Hydroxytamoxifen (4OHT) reconstituted in DMSO for 4 days.
Vector construction
pGIPZ-based shRNA targeting AHCY (V3LHS_406061, V3LHS_343433), NSD2 (V3LHS_409073, V3LHS_390121), NSD3 (V3LHS_354139, V3LHS_343583), and SMYD2 (V3LHS_381114, V3LHS_381113) were obtained from MRC LMS Genomics core facility. To generate IMR90 ER:RAS expressing shRNAs, lentiviral infections were carried out as described before 15. Briefly, HEK293T cells were transfected with the lentiviral and packaging vectors using PEI (PEI 2500, Polysciences). Two days after transfection, HEK293T viral supernatants were collected, filtered (0.45 μM), diluted 1/4, supplemented with 4 μg/ml polybrene and added to IMR90 ER:RAS cells plated the day before at a density of 1 million cells per 10 cm dish. Four hours later, lentivirus-containing media was replaced with fresh media. Three days after infection, cells were passaged and cultured for three days in the presence of 1μg/ml puromycin (InvivoGen) to select for infected cells. To generate IMR90 cells expressing reprogramming factors (OSKM), HEK293T cells were transfected with retroviral MSCV-neo vectors expressing a polycistronic cassette encoding Oct4, Sox2, Klf4, and c-Myc 42 as previously described 43.
Growth assays
For BrdU incorporation assays, cells were incubated with 10 μM BrdU for 16-18 hours and then fixed with 4% PFA (w/v). BrdU incorporation was assessed by IF and High Content Analysis microscopy. For crystal violet staining, the cells were seeded at low density on 6-well dishes and fixed at the end of the treatment with 0.5% glutaraldehyde (w/v). The plates were then stained with 0.2% crystal violet (w/v).
IF staining of cells
Cells were grown in 96-well plates, fixed with 4% PFA (w/v), permeabilised in 0.2% Triton® X-100 (v/v) diluted in PBS for 10 min, and blocked with 1% BSA (w/v) and 0.4% fish gelatin (v/v) (Sigma) for 30 min. Cells were then incubated with a primary antibody for 45 min, followed by the corresponding fluorescence-labelled secondary antibody (Alexa Fluor®) for 30 min and 1 μg/ml DAPI for 15 min. Antibodies were diluted in blocking solution. After every step, cells were washed with PBS three times.
Cytochemical SA-β-Galactosidase assay
Cells were grown in 6-well plates, fixed with 0.5% glutaraldehyde (w/v) (Sigma) in PBS for 10-15 min, washed with 1mM MgCl2/PBS (pH 6.0) and then incubated with X-Gal staining solution (1 mg/ml X-Gal, Thermo Scientific, 5 mM K3[Fe(CN)6] and 5 mM K4[Fe(CN)6] for 8 hr at 37°C. Brightfield images of cells were taken using the DP20 digital camera attached to the Olympus CKX41 inverted light microscope. The percentage of SA-β-Gal positive cells was estimated by counting at least 100 cells per replicate sample facilitated by the “point picker” tool of ImageJ software (NIH) 44.
High Content Analysis (HCA)
IF imaging was carried out using the automated high-throughput fluorescent microscope IN Cell Analyzer 2000 (GE Healthcare) with a 20x objective except for DNA damage foci analysis which required a 40x objective. Fluorescent images were acquired for each of the fluorophores using built-in wavelength settings (‘DAPI’ for DAPI, ‘FITC’ for AlexaFluor® 488 FITC, ‘Texas Red’ for AlexaFluor® 594). Multiple fields within a well were acquired to include a minimum of 1,000 cells per sample-well. HCA of the images were processed using the INCell Investigator 2.7.3 software. Briefly, DAPI served as a nuclear mask hence allowed for segmentation of cells with a Top-Hat method. To detect cytoplasmic staining in cultured cells, a collar of 7-9 μm around DAPI was applied.
Gene expression analysis
Total RNA was extracted using Trizol reagent (Invitrogen) and the RNeasy isolation kit (Qiagen). cDNA was generated using random hexamers and SuperScript II reverse transcriptase (Invitrogen). Quantitative real-time PCR was performed using SYBR Green PCR master mix (Applied Biosystems) in a CFX96 real-time PCR detection system (Bio-Rad). RPS14 expression was used for normalization.
Human primer pairs are:
AHCY: ATTCCGGTGTATGCCTGGAAG, GAGATGCCTCGGATGCCTG. p16INK4a: CGGTCGGAGGCCGATCCAG, GCGCCGTGGAGCAGCAGCAGCT. p15INKB: GAATGCGCGAGGAGAACAAG, CCATCATCATGACCTGGATCG.
IL8: GAGTGGACCACACTGCGCCA, TCCACAACCCTCTGCACCCAGT IL1a: AGTGCTGCTGAAGGAGATGCCTGA, CCCCTGCCAAGCACACCCAGTA.
NSD2: ACCGCGAGTGTTCTGTGTTC, GTCGTGGCCGTTAAACTTCTG. NSD3: AACTCATTGACTCCGCCAACA, CTGAAAGCCTTGCTGCAAAGT.
SMYD2: TACTGCAATGTGGAGTGTCAGA, ACAGTCTCCGAGGGATTCCAG. RPS14: CTGCGAGTGCTGTCAGAGG, TCACCGCCCTACACATCAAACT.
Immunoblot
Histones were isolated using EpiQuikÔ Total Histone Extraction Kit (Epigentek, OP-0006) according to manufacturer’s instructions. Immunobloting was carried out using standard techniques as described before 15. Uncropped blots are shown as source data for their corresponding figures.
Ex vivo culture of mouse satellite cells
C57Bl/6 (WT) mice were bred and aged at the animal facility of the Barcelona Biomedical Research Park (PRBB), housed in standard cages under 12-hour light-dark cycles and fed ad libitum with a standard chow diet. Isolation of mouse stem cells for ex vivo culture was approved by the ethics committee of the PRBB and by the Catalan Government following applicable legislation. Both male and female mice were used in each experiment unless stated otherwise. Live colonies were maintained and genotyped as per Jackson Laboratories’ guidelines and protocols. Mice were housed together, health was monitored daily for sickness symptoms (not age-related weight loss, etc), and euthanized immediately at the clinical endpoint when recommended by veterinary and biological services staff members. The mice determined by the animal facility veterinary team as healthy were used in the experiments. Mice determined as not healthy were excluded. No statistical methods were used to predetermine the sample size, but our sample sizes are like those reported in previous publications 14,27. The experiments were not randomized. Satellite from skeletal muscle from young (2-3 months-old) or geriatric (28-31 months-old) mice were isolated by FACS (based on alpha7-integrin and CD34, and negative selection) and cultured in growth medium (Ham’s F10 supplemented with 20% FBS and bFGF (0.025 μg ml-1) for seven days. Proliferation assays (BrdU incorporation and staining), and senescent cell analysis (SA-β-gal assay, determination of RNA expression of p16INK4a, Cdkn1a, Myog, and Myh3; and gH2AX immunostaining), were performed after treatments of satellite cells with either vehicle (DMSO), rapamycin (100 ng ml-1) for 48 hours or 3DA (10 μM) during 6 days. All ex vivo experiments derived from animal tissue were approved by the Catalan government (Spain).
For BrdU incorporation assays, cultured satellite cells were labelled with BrdU (1.5 μg ml-1; Sigma) for 1 h and fixed with formaldehyde 3,7%. BrdU-labelled cells were detected by immunostaining using rat anti-BrdU antibody (1:500) and a specific secondary biotinylated goat anti-rat antibody (712-066-150 Jackson Immunoresearch; 1:250). Antibody binding was visualized using Vectastain Elite ABC reagent (Vector Laboratories) and DAB. BrdU-positive cells were quantified as percentage of the total number of cells analyzed.
SA-β-galactosidase activity was detected in satellite cells using the Senescence β-Galactosidase Staining kit (Cell signaling), according to the manufacturer’s instructions. SA-β-gal+ cells were quantified as percentage of the total number of cells analyzed.
For gene expression analysis, total RNA was isolated from cultured satellite cells of mouse muscle tissue, using RNeasy Micro kit (Qiagen), and analyzed by RT– qPCR. Real-time PCR reactions were performed on a Light Cycler 480 System using Light Cycler 480 SYBR Green I Master reaction mix (Roche Diagnostic Corporation) and specific primers. Thermocycling conditions were as follows: initial step of 10 min at 95 °C, then 50 cycles of 15 s denaturation at 94 °C, 10 s annealing at 60 °C and 15 s extension at 72 °C. Reactions were run in triplicate, and automatically detected threshold cycle values were compared between samples. Transcript of the ribosomal protein L7 housekeeping gene was used as endogenous control, with each unknown sample normalized to L7 content.
Mouse primer pairs are:
L7 (housekeeping): GAAGCTCATCTATGAGAAGGC, AAGACGAAGGAGCTGCAGAAC. p16INK4a: CATCTGGAGCAGCATGGAGTC, GGGTACGACCGAAAGAGTTCG
Cdkn1a: CCAGGCCAAGATGGTGTCTT, TGAGAAAGGATCAGCCATTGC. Myog: GGTGTGTAAGAGGAAGTCTGTG, TAGGCGCTCAATGTACTGGAT.
Myh3: AACAGAAACGCAATGCTGAGG, CAGCTCTCTGATCCGTGTCTC.
To assess DNA damage, cultured satellite cells were immunostained using a phosphohistone H2A.X (Ser139) antibody (1:50; Cell Signaling, #2577S). Digital images were acquired using Leica SP5 confocal laser-scanning microscope with HCX PL Fluotar ×40/0.75.
Muscle regeneration
Mice were anaesthetized with ketamine-xylazine (80 and 10 mg/kg respectively; i.p.). Regeneration of skeletal muscle was induced by intramuscular injection of cardiotoxin (CTX, Latoxan, #L8102; 10 μM) as described in 45. At the indicated days postinjury, mice were euthanized and muscles were dissected, frozen in liquid-nitrogen-cooled isopentane, and stored at -80 °C until analysis 27.
Satellite cells transplantation
Transplantation of satellite cells was performed as in 14 following an adapted protocol 46. Satellite cells from young or geriatric mice (treated with the indicated compounds or vehicle ex vivo) were re-suspended in 20% FBS HAMF10 medium, labelled with Vybrant Dil Cell Labelling solution (Dil) (Invitrogen, #V22889) according to manufacturer instructions and injected into tibialis anterior muscles of recipient immunodeficient mice previously injured with freeze crush 47 one day before. For better comparison of untreated versus 3DA-treated geriatric satellite cells, engraftment of both conditions was performed within the same host mice, using one tibialis anterior muscle for untreated cells and the contralateral one for 3DA-treated satellite cells. Each muscle was engrafted with 10.000 cells. Investigators were not blinded to allocation and outcome assessment for the satellite cell transplantation experiment, as engraftment of both conditions were performed within the same host mice. Muscles were collected and processed for muscle histology 5 days after cells’ transplantation. For GFP labelling experiments, freshly isolated satellite cells from young or geriatric mice were treated with vehicle or 3DA for 4 days, transduced with a GFP lentivirus (pCCLsin.PPT.hPGK.GFPpre, 5.6x10⁸ T.U./m), and engrafted into tibialis anterior muscles of recipient immunodeficient mice previously injured with freeze crush 47 one day before. Muscles were collected 6 days post engraftment and GFP+ fibers were analyzed.
Muscle histology
Muscles were embedded in OCT solution (TissueTek, #4583), frozen in isopentane cooled with liquid nitrogen and stored at −80°C until analysis. 10 μm muscle cryosections were collected and stained for SA-β-gal (AppliChem, #A1007,0001). The number of SA-βGal+ cells was quantified using Image J software. For GFP immunostaining, the muscle was prefixed 2 h in PFA 2% at 4°C, embedded in sucrose 30% O/N at 4°C, and then frozen in liquid nitrogen cooled-isopentane. 8-10 μm sections were collected from muscles and double immunostaining was performed as followed. Sections were air-dried, washed on PBS, and incubated with primary antibody according to the manufacturer’s instructions after blocking for 1 h at room temperature in a high protein-containing solution (goat serum) on PBS. Subsequently, the slides were washed on PBS and incubated with a secondary antibody and labeling dye and nuclei were stained with DAPI (Invitrogen). After washing, tissue sections were mounted with Fluoromount G (SouthernBiotech, 0100-01). Digital images were acquired using a Zeiss Cell Observer HS with 20x Air objective and a Zeiss AxioCam MrX camera. The acquisition was performed using Zeiss LSM software Zen.
Two-third hepatectomy
6-month-old female C57BL/6JInv mice were purchased from InVivos and further kept until 2-year-old. Mice were housed in BRC in SPF conditions under a 12 hour light / dark cycle with lights turn off at 7 pm and resume at 7 am. The animals were housed in individually ventilated cages with their temperature and humidity maintained at ~21°C and 60-65%rH. Two-thirds (partial) hepatectomy (2/3 PH) was performed on 2-year-old C57Bl6/J wild type mice as described before 48. No statistical methods were used to predetermine sample sizes, but our sample sizes are similar to those reported in a previous publication 49. All animals were randomly allocated into carrier (n = 4) or treatment (n = 4) group but, for each experimental condition, one mouse did not survive the operation. Therefore the ‘day 2’ Ki67 analysis was carried out with three mice per group (n = 3). The histopathology analysis was performed at day 0 on paraffin sections and includes (n=4) per group. The γH2AX IF was performed at day 0 on frozen sections. There were issues with the integrity of the frozen sections of one of the 3DA-treated mice, so for the γH2AX IF, carrier was (n = 4) and treatment (n = 3). The median, right, and caudate liver lobes were surgically removed (day 0 time point) while mice were under general isoflurane anesthesia. At 48 hours later, the remaining liver was collected and further analyzed. Microscopic analyses were performed using Observer Z1 microscope (Zeiss). Five high power fields were counted on two liver sections (from OCT embedded cryo-frozen tissue) from each mouse liver (20X, >200 counted cells per field). Histopathological evaluation of murine livers was performed on hematoxylin and eosin (H&E) stained paraffin sections by board-certified pathologists (Advanced Molecular Pathology Laboratory (AMPL) IMCB, & Biological Resource Centre (BRC) A*STAR, Singapore). The severity of changes, where applicable, was graded as follow: NAD – no abnormalities detected; Grade 1 – minimal; Grade 2 – mild; Grade 3 – moderate; Grade 4 – marked; Grade 5 – severe. Staining and counting were done in a blinded fashion, the investigator was not aware to which group the animal belonged.
Isolation of cord blood-derived hematopoietic stem- and progenitor cells (HSPCs)
To obtain CD34+ HSPCs, human male and female cord blood samples were acquired from healthy full-term pregnancies (Obstetrics Department at the Isala Hospital in Zwolle, the Netherlands) after informed consent, in accordance with the Declaration of Helsinki. CD34+ HSPCs were isolated as previously described 50. Briefly, CD34+ HSPCs cord blood was diluted 1:1 with PBS + 2mM EDTA + 0.5% v/v BSA (PBS/EDTA/BSA) and layered on Lymphoprep™ (Stem Cell Technologies, Cambridge, UK). After centrifugation for 20 minutes at 800g, without brakes, the middle layer containing mononuclear cells was harvested. These cells were resuspended in PBS/EDTA/BSA and then centrifuged for 5 minutes at 800g. Cell pellets were collected, washed with PBS/EDTA/BSA and centrifuged for 10 minutes at 200g. Immunomagnetic labeling and separation were performed according to the manufacturer’s manual of the CD34 MicroBead Kit, human (Miltenyi Biotec, Bergisch Gladbach, Germany).
Long-term culture initiating cell assay
CD34+ cells were sorted at limiting dilution directly into 96-well plates on a feeder layer of MS5 cells (DSMZ, ACC441) in Myelocult™ H5100 (Stem Cell Technologies) supplemented with 10-6 M hydrocortisone (Stem Cell Technologies) and 1% v/v penicillin-streptomycin-glutamine (100X) (Gibco). Cells were cultured for 5 weeks with 10 μM 3DA or vehicle (DMSO), half-medium changes were performed weekly. After 5 weeks medium was replaced by Methocult H4335 (Stem Cell Technologies) and incubated for two further weeks at 37°C/5% CO2. Colony formation was assessed by phase-contrast microscopy after seven weeks. The LTC-IC frequency of each experiment was calculated with ELDA software 51.
Culture of cord blood-derived HSPCs
Cord blood-derived HSPCs were cultured in Stemspan (Stem Cell Technologies) supplemented with 1% v/v penicillin-streptomycin-glutamine (100X) (Gibco) and the cytokines FLT3L, TPO and SCF (R&D Systems), all at a concentration of 100ng/mL. The cells were seeded at a starting density of 250.000 cells/mL and treated with 10 μM 3DA or vehicle (DMSO) at days 1, 4, and 7. Cells were cultured in a humidified atmosphere of 5% CO2 at 37°C. Cells were harvested and counted manually with a hemocytometer and trypan blue at day 9. These cells were analyzed by FACS and used for RNA-seq and xenotransplantation. The percentage of CD34+CD38+ cells was determined after blocking with Fc block (BD) for 10 minutes at room temperature and incubation with CD34+PE-Cy7 (BD, 348811) and CD38+FITC (BD, 555459) for 20-25 minutes at 4°C in the dark. Afterward, cells were washed and resuspended with PBS+BSA 0.2% containing a viability dye (PI). Samples were analyzed on a FACSCanto II (BD).
RNA-seq of human umbilical cord-blood cells
CD34+38-cells were obtained from cord blood cells (from 4 different donors: 338, 522, 535, 545) that have been treated for 9 days with DMSO (DMSO) or 10 μM 3DA, sorted using FACS, and subjected to RNAseq. The sequencing was conducted on an Ilumina NextSeq 500 system with 41 base pair paired-end reads. Base calling was performed during the sequencing run by Real Time Analysis (RTA) v2.11.3 running under NextSeq 500 Control Software v4.0.2. CASAVA-2.17 was used for secondary analysis.
Xenotransplantation
Mouse experiments were performed in line with international and national guidelines. All experiments were approved by the Institutional Animal Care and Use Committee of the University of Groningen (IACUC-RUG). Mice were kept in sterile conditions in individually ventilated filter-top cages at 20°C under 12 hours dark/light cycles. For all xenotransplantation studies we performed single cord transplantations of freshly isolated CD34+ cord blood cells into 2-3 mice per condition. Recipient mice were randomly assigned to an experimental group. Cord blood samples were selected that contained sufficient numbers of CD34+ cells to carry out the experiments. No statistical methods were used to pre-determine sample sizes but our sample sizes are similar to those reported previously 50. Female 10-25 weeks old NOD.Cg-Prkdcscid Il2rgtm1Wjl/SzJ mice were radiated three hours before transplantation with 1.8 Gy. In each experiment age of mice was balanced between the experimental and control group with a maximum difference of nine days. In total equivalents of 1.5x10⁶ cells pre-treated for nine days with 3DA or the vehicle (DMSO) were transplanted per mouse via retro-orbital injection under general anesthesia. No animals were excluded from the analysis. Data collection and analysis were not performed blind to the conditions of the experiments.
Bleeding and bone marrow analysis of xenotransplanted NSG mice
Beginning 6-weeks after transplantation chimerism in peripheral blood was determined in 4-week intervals. Blood samples were taken under general anesthesia via retro-orbital bleeding. Mice were sacrificed between week 18 and 31 and dissected under general anesthesia after the end of the experiment or reaching the human endpoint of the experiment. Bones (femur, tibia, fibula, and pelvis) were collected and cleaned. Bones were crushed in the presence of PBS+0.2% PBS with a mortar and pestle. The obtained cell suspension was filtered through a 40 μm filter. Remaining erythrocytes were lysed with ammonium chloride. Cells were then washed two times with PBS+BSA 0.2%, pelleted by centrifugation, and resuspended in BV stain buffer (BD). Samples were incubated with Human Fc block (BD) and CD16/ CD32 Mouse Fc block (BD) to prevent unspecific binding. After incubation for 10 minutes at room temperature antibody master mix was added and samples were incubated for 20-25 minutes at 4°C in the dark. The antibody mix contained CD3-APC-Cy7 (Biolegend, 344818), CD19-PE (BD, 561741), CD33-BV421 (BD, 562854), CD45-APC (BD, 555485) for the bleedings, and for bone marrow analysis also CD38-FITC (BD, 555459), CD34-PE-Cy7 (BD, 348811) and CD90-BV605 (BD, 562685) (or CD38-BV605 (BD, 562665) and no CD90 for exp A and D). Afterwards, cells were washed and resuspended with PBS+BSA 0.2% containing a viability dye (PI). Samples were analyzed on an LSR II (BD) or FACSCanto II (BD).
Flow cytometry analysis
All flow cytometry measurements were analyzed using FlowJo (version 7). Dead cells were excluded from the analysis by gating out lower forward scatter and high DAPI or propidium iodide-retaining cells. All statistical analyses were performed using Graphpad Prism Version 6 (GraphPad Software, La Jolla California USA,) or R (R Foundation for Statistical Computing, Vienna, Austria). Gating strategies are shown in Extended Data Fig 10 g-h.
RNA-seq analysis
RNA-Seq libraries were prepared from 30 ng of total RNA using the Nextera XT DNA sample preparation and dual indexing kits (Illumina) according to the manufacturer’s protocol with a few modifications as previously described 43,52. Library quality was checked on a Bioanalyser HS DNA chip and concentrations were estimated by Qubit measurement. Libraries were pooled in equimolar quantities and sequenced on a Hiseq2500 using single end 50 bp reads. At least 20 million reads passing filter were achieved per sample. Sequencing reads from the RNA-Seq experiments were aligned to hg19 genome using Tophat v2.0.11 53 using parameters “--library-type fr-firststrand --b2-very-sensitive --b2-L 25” and using known transcripts annotation from ensembl gene v72. Number of reads counts on exons were summarised using HTSeq v0.5.3p9 with “-- stranded=reverse” option and differentially expressed genes were identified using DESeq2 54. Genes were ranked by fold change and Gene Set Enrichment Analysis was performed using GSEA v2.07 (Broad Institute) pre-ranked module.
H3K36me3 histone modification ChIP-seq
A total of 1 × 10⁷ cells were fixed in 1% formaldehyde for 15 min, quenched in 2 M glycine for an additional 5 min and pelleted by centrifugation at 425 x g, 4°C for 4 min 55. For H3K36me3 histone modification ChIP-seq, nuclei were extracted in extraction buffer 2 (0.25 M sucrose, 10 mM Tris-HCl pH 8.0, 10 mM MgCl2, 1% Triton X-100 and proteinase inhibitor cocktail) on ice for 10 min followed by centrifugation at 3,000 × g at 4°C for 10 min. The supernatant was removed and nuclei were resuspended in nuclei lysis buffer (50 mM Tris-HCl pH 8.0, 10 mM EDTA, 1% SDS and proteinase inhibitor cocktail). Sonication was performed using a Diagenode Picoruptor until the desired average fragment size (100–500 bp) was obtained. Soluble chromatin was obtained by centrifugation at 14,046 x g for 10 min at 4°C, and chromatin was diluted tenfold. Immunoprecipitation was performed overnight at 4°C with rotation using 1–2 × 10⁶ cell equivalents per immunoprecipitation using 5 μg antibody against H3K36me3 (D5A7, Cell Signaling Technology, 4909). Subsequently, 30 μl of Ultralink Resin (Thermo Fisher Scientific) was added and allowed to tumble for 4 h at 4°C. The resin was pelleted by centrifugation and washed three times in low-salt buffer (150 mM NaCl, 0.1% SDS, 1% Triton X-100, 20 mM EDTA, 20 mM Tris-HCl pH 8.0), one time in high-salt buffer (500 mM NaCl, 0.1% SDS, 1% Triton X-100, 20 mM EDTA, 20 mM Tris-HCl pH 8.0), two times in lithium chloride buffer (250 mM LiCl, 1% IGEPAL CA-630, 15 sodium deoxycholate, 1 mM EDTA, 10 mM Tris-HCl pH 8.0) and two times in TE buffer (10 mM Tris-HCl, 1 mM EDTA).
DNA was recovered by mixing the decrosslinked supernatant with 2.2×SPRI beads followed by 4 min of incubation at room temperature. SPRI beads were washed twice in 80% ethanol, allowed to dry, and DNA was eluted in 35 μl of 10 mM Tris-Cl pH 8.0. Libraries were constructed using the Accel-NGS 2S Plus DNA Library Kit (#21024) according to the manufacturer!s instructions. Libraries were amplified for 12 cycles. Libraries were then resuspended in 20 μl of low EDTA–TE buffer and quality controlled in an Agilent Technologies 4200 Tapestation (G2991-90001) and quantified using an Invitrogen Qubit DS DNA HS Assay kit (Q32854). Libraries were sequenced using an Illumina High-Seq 2500. Typically, 30–50 million reads were required for downstream analyses.
ChIP-seq analysis
Reads were cleaned and trimmed using fastq-mcf from the ea-utils suite v1.1.2 to remove adapters, low quality bases and reads, and discard reads shorter than 25 bp after filtering. Reads were then aligned to the human reference genome (hg19) with bowtie v1.1.1 using best matches parameters (bowtie -v 2 -m 1 --best --strata). Alignment files were further processed with samtools v1.2 and PicardTools v1.130 to flag PCR and optical duplicates and remove alignments located in Encode blacklisted regions. Fragment size was estimated in silico for each library using spp v1.10.1. Genome-wide consistency between replicates was checked using custom R scripts. Enriched regions were identified for each replicate independently with MACS v2.1.0 with non-IPed genomic DNA as a control (macs2 callpeak --nomodel --shiftsize --shift-control --gsize hs -p 1e-1). These relaxed peak lists were then processed through the irreproducible discovery rate (IDR) pipeline to generate an optimal and reproducible set of peaks for each histone modification and each time point. After assessing library saturation using preseqR, alignment and peak data were imported and pre-processed in R using the DiffBind package. We counted the number of reads mapping inside the global set of IDR reproducible peaks for each condition and for each replicate. The raw count matrix was then normalized for sequencing depth using a non-linear full quantile normalization as implemented in the EDASeq package. To remove sources of unwanted variation and consider batch effects, data were finally corrected with the RUVSeq package. Differential analyses for count data were performed using edgeR considering condition and batch in the design matrix, by fitting a negative binomial generalized log-linear model to the read counts for each peak. Peaks were finally annotated using ChIPpeakAnno considering annotations provided by Ensembl v86. For combined ChIP-seq/RNA-seq analysis, RNA-seq reads were assigned to genes using featureCounts from Rsubread package. The count matrix was processed as previously described for the ChiP-seq data. Statistical analyses was also performed as described for ChIP-seq data.
Statistical analysis
GraphPad Prism 8 was used for statistical analysis. Data distribution was assumed to be normal but this was not formally tested. Two-tailed, unpaired, Student’s t-tests were used to estimate statistically significant differences between two groups. Twoway analysis of variance (ANOVA) with Tukey’s post-hoc comparison was used for multiple comparisons. Values are presented as mean ± s.d. unless otherwise indicated.
For the cord blood in vivo studies, mice were stratified to treatment groups based on age and cage. All four experiments in the present study represent separate cord blood samples from which cells from each condition were transplanted into 2-3 mice, all replicates indicate individual mice. Mice with engraftment <1% were not included in further analysis.
Extended Data
Extended Data Figure 1. Cellular models of senescence induced by oncogene activation and telomere uncapping.
a, IMR90 ER:RAS as a model of OIS. Quantification of immunofluorescence staining for BrdU (left) and p16INK4a (right) of IMR90 ER:RAS cells 4 days after treatment with 4OHT or vehicle (DMSO) (n = 3). b, IMR90 tet-TRF2ΔBΔM as a model of telomere uncapping-induced senescence. c, Left, quantification of immunofluorescence staining for 53BP1 of IMR90 tet-TRF2ΔBΔM cells after treatment with doxycycline or vehicle (DMSO) (n = 3). Right, representative immunofluorescence images. Scale bar, 20 μm. d, Left, quantification of immunofluorescence staining for p21CIP1 (n = 3). Right, representative immunofluorescence images. Scale bar, 50 μm. e, Left, quantification of immunofluorescence staining for p16INK4a (day 7, n = 2). Right, representative immunofluorescence images. Scale bar, 100 μm. f, Left, quantification of immunofluorescence staining for BrdU (day 3, n = 3). Right, representative immunofluorescence images. Scale bar, 50 μm. All statistical significances were calculated using unpaired two-tailed t-tests. All error bars represent mean ± s.d; n represents independent experiments.
Extended Data Figure 2. Treatment with 3DA alleviates oncogene-induced senescence.
a, Representative immunofluorescence images of p16INK4a (red) in IMR90 ER:RAS cells cells 4 days after treatment with 4OHT and 10 μM 3DA or vehicle (DMSO). Scale bar, 100 μm. b, Quantification (n = 3). The statistical significance was calculated using unpaired two-tailed t-test. c, p21CIP1 protein expression in IMR90 ER:RAS cells treated with DMSO or 4OHT to induce senescence or 4OHT and 10 μM 3DA. Normalized nuclear intensity values and mean values on day 3 (left), day 6 (middle), and day 9 (right panel) are shown (n = 200 cells per condition). The statistical significance was calculated using unpaired two-tailed t-tests. d, Timeline of the experiment (left) and crystal violet staining (right). IMR90 ER:RAS cells were treated with 4OHT continuously to induce senescence. On day 6, DMSO or 10 μM 3DA were added (change of media every 3 days). Cells were fixed on day 14. e, Timeline of the experiment (left) and quantification of immunofluorescence staining for p16INK4a (middle) and BrdU (right). IMR90 ER:RAS cells were treated with DMSO for 4 weeks, or 10 μM 3DA for 2 weeks followed by DMSO for 2 weeks, or 10 μM 3DA for 4 weeks. Media was changed every three days. Treatment was started when cells were at passage 14 and ended when cells were at passage 20. At the end of the experiment, p16INK4a protein expression and BrdU-positive cells were quantified. For p16INK4a, normalized nuclear single-cell intensity values and mean of 200 cells are shown. To assess proliferation, percentage of BrdU-positive cells was measured (n = 3). Statistical significances were calculated using one-way ANOVA. All error bars represent mean ± s.d; n represents independent experiments unless otherwise stated.
Extended Data Figure 3. Genetic or chemical inhibition of AHCY alleviates oncogene-induced senescence.
a, Left, representative images of immunofluorescence staining for AHCY (red). Scale bar, 50 μm. Right, single-cell intensities for AHCY (n = 1000 cells per condition). The statistical significance was calculated using unpaired two-tailed t-test. b, Left, representative images of immunofluorescence staining for γH2AX (red). Right, quantification of immunofluorescence staining for γH2AX (n = 4). c, Quantification of immunofluorescence staining for BrdU of IMR90 ER:RAS cells four days after treatment with 4OHT or vehicle (DMSO) and 2.5 μM DZNep, 10 μM D-eritadenine, and 4 μM TGF-β RI kinase inhibitor II as positive control. d, Expression levels of AHCY (n = 4). e, Expression levels of INK4a (encoding for p16INK4a, n = 4). f, Principal component analysis (PCA) for the experiment described in Fig 3f. g-h, GSEA signatures from the same experiment. All statistical significances were calculated using one-way ANOVA. All error bars represent mean ± s.d; n represents independent experiments unless otherwise stated.
Extended Data Figure 4. Contribution of histone methyltransferases and H3K36 methylation to senescence induction.
a, Quantification of immunofluorescence staining for BrdU of IMR90 ER:RAS cells 4 days after treatment with 4OHT or vehicle (DMSO) and increasing concentrations of GSK126 (an inhibitor of the H3 K27 methylase EZH2), BRD4770 (an inhibitor of the H3 K9 methylase EHMT2) or EPZ004777 (an inhibitor of the H3 K79 methylase DOT1L). T, 4 μM TGF-β RI kinase inhibitor II as positive control (n = 3). All error bars represent mean ± s.d; n represents independent experiments. b, Immunoblot of protein extracts of IMR90 ER:RAS cells after 4OHT induction and treatment with 10 μM 3DA or vehicle (DMSO). Immunoblot of Histone H3 is included as a sample processing control. Immunoblots are a representative experiment out of three. c, Single-cell nuclear intensity values for H3K36me3 in a representative experiment out of 5 (n= 1000 cells per condition). The threshold used to quantify the cells stained for H3K36me3 cells in Fig 4b, is shown as a red dashed line. d, Left, representative immunofluorescence images of histone H3 staining (red) 4 days after 4OHT induction and treatment with 10 μM 3DA or vehicle (DMSO). Scale bar, 100 μm. Right, single-cell nuclear intensity values for histone H3 in a representative experiment out of 3 (n= 1000 cells). e, Left, representative immunofluorescence images of H3K36me3 staining (red) 6 days after treatment with 4OHT and 10 μM 3DA or vehicle (DMSO). Scale bar, 100 μm. Right, quantification (n = 4 independent experiments). All statistical significances were calculated using one-way ANOVA. All error bars represent mean ± s.d.
Extended Data Figure 5. Transcriptional profiling after chemical or genetic inhibition of AHCY.
a, Principal component analysis (PCA) for the RNASeq experiment described in Fig 4c. b, Principal component analysis (PCA) including data from the experiments in figure 3f and figure 4c. c, GSEA of RNA-Seq data using signatures for oncogene-induced senescence and SASP. d, GSEA of RNA-Seq data using a signature for Hallmark E2F targets. e, GSEA of H3K36me3 ChIP-Seq data using a signature for SASP. f-g, Representative genome browser snapshots showing H3K36me3 normalized signal at IL12RB2 (module 2, f) and CENPF (module 4, g) gene loci for DMSO (orange), DMSO + 4OHT (green) and 3DA + 4OHT (violet) conditions. Data are expressed as normalized counts per million reads (CPM) in 200bp non-overlapping windows.
Extended Data Figure 6. H3K36 methylation is needed for establishing oncogene-induced senescence.
a, Expression levels of NSD2 (n = 4). b, Expression levels of NSD3 (n = 3). c, Expression levels of SMYD2 (n = 4). d, Single-cell nuclear intensity values for H3K36me3 staining 7 days after treatment with 4OHT or vehicle (DMSO) of IMR90 ER:RAS cells infected with different pGIPZ shRNAs against NSD2, NSD3, SMYD2, AHCY or the parental pGIPZ vector (n = 1000 cells per condition for a representative experiment out of 3). The threshold used to quantify the cells stained for H3K36me3 cells in Fig 5b, is shown as a red dashed line. All statistical significances were calculated using one-way ANOVA. All error bars represent mean ± s.d.
Extended Data Figure 7. 3-deaazadenosine inhibits reprogramming-induced senescence.
a, Senescence induced in IMR90 cells upon expression of reprogramming factors (OSKM). b, crystal violet stained, IMR90 cells transduced with either and empty vector or OSKM (a vector expressing reprogramming factors OCT4, SOX2, KLF4, cMYC) were treated with 1 μM 3DA or vehicle (DMSO). Images are a representative experiment out of three.
Extended Data Figure 8. 3DA rejuvenates geriatric satellite cells.
a-f, Analysis of the experiment described in Fig 6a. a, Expression levels for mouse Cdkn1a mRNA (encoding for p21) in young (2-3 months, n = 7) versus geriatric satellite cells (28-31 months, n = 8). b, Quantification of γH2Ax intensity (arbitrary units: a.u.; n = 75-91 cells). c, Representative images of γH2Ax. d, Quantification of BrdU staining of young (2-3 months, n = 5) versus geriatric satellite cells (28-31 months, n = 7). e-f, Expression levels for mouse Myog (e) and Myh3 mRNA (f) in young (2-3 months, n = 6) versus geriatric (28-31 months, n = 5) satellite cells after the indicated treatments. g, Experimental design. Tibialis anterior muscles were injected with cardiotoxin to induce damage and regeneration. Mice were treated with vehicle or 3DA daily (10 mg/kg, i.p.) and sacrificed at 4 days post muscle injury to assess SA-β-gal activity. h, Left, quantification of SA- β -gal+ cells in the damaged area (n = 4 mice per group). Right, representative images of SA- β -gal staining in cryosections of tibialis anterior muscle. Scale bars 10 μm in c and 50 μm in h. All error bars represent mean ± s.d; n represents number of mice unless otherwise stated. Statistical significances were calculated using two-tailed unpaired t test. This figure was partly generated using Servier Medical Art, provided by Servier, licensed under a Creative Commons Attribution 3.0 unported license.
Extended Data Figure 9. 3DA treatment improves liver regeneration in aged mice.
a, Schematic representation of the experiment. Two-year old mice were treated 3 and 1 days before partial hepatectomy (PH) with 3DA or vehicle. The resected liver material was used for γH2AX staining and histopathology. 48h post PH, the rest of the liver was harvested and proliferation level was determined by Ki67 staining. b, Right side shows representative photographs of IF staining with antibody against ƴH2AX and fluorescent DNA stain (DAPI). The inlay shows a magnification of positive nuclei from the respective main photograph. Left side shows the quantification. A significantly higher amount (p<0.05) of γH2AX positive hepatocytes was detected in the control group (vehicle, n = 4) compared to experiment (3DA, n = 3), indicating a reduction in senescent cells. c, Right side shows representative photographs of IF staining with antibody against Ki67 and fluorescent DNA stain (DAPI). Left side shows the quantification. A significantly higher amount (p<0.05) of Ki67 positive hepatocytes were detected in experimental group (3DA, n = 3) compared to control (vehicle, n = 3), indicating that a reduction in senescent hepatocytes is associated with improved proliferation. Statistical significance was calculated using the unpaired two-tailed Student's t test. Error bars are represented as mean ± SEM; n represents number of mice. d-g, Pathological score (quantified blindly in a scale from 0-5) for the indicated parameters were assigned to H&E-stained liver sections from the experimental group (3DA, n = 4) and control group (vehicle, n = 4). Statistical significance was calculated using the unpaired two-tailed Student's t test. Error bars are represented as mean ± SEM; n represents number of mice. This figure was partly generated using Servier Medical Art, provided by Servier, licensed under a Creative Commons Attribution 3.0 unported license.
Extended Data Figure 10. 3DA improves the engraftment of umbilical cord blood cells.
a-d, GSEA signatures for the cord blood RNA-seq experiment. e, Cord blood derived human hematopoietic stem and progenitor (CD34+) cells were treated at day 1, 4 and 7 with 10 μM 3DA or DMSO and analysed before xenotransplantation at day nine. Absolute cell numbers were determined by manual cell counting. Data are represented as mean ± SD, n = 4 independent experiments. Statistical significance was calculated using one-tailed Student's t test. f, 1.5x10⁶ Cells from the experiment described in a were transplanted into NSG mice. The engraftment of human (CD45+) cells and the percentage of primitive cells (CD34+CD38-) in the bone marrow was analysed by flow cytometry. For e and f, each shape (open cicle, closed circle, star, square or triangle) represents a different cord blood sample. Each shape is the average of 2-3 transplanted mice with that cord blood sample (n = 4 independent cord blood samples). Statistical significance was calculated using one-tailed Student's t test. g, Gating strategy for the experiment shown in Fig. 7f. h, Gating strategy for the experiment shown in Fig. 7g.
Supplementary Material
Reporting summary.
Further information on research design is available in the Nature Research Reporting Summary linked to this article.
Footnotes
Author Contributions
A.G., designed, performed and analysed the cell culture experiments and wrote the first draft of the manuscript. A.J.I, V.W., M.A., N.M. designed, performed and analysed experiments. L.R. performed the ChIPSeq experiments. P.-F. R. analysed the ChIPSeq and RNASeq data. O.B. designed, and analysed the ChIPSeq experiments, secured funding and wrote the manuscript. S.C.B., J.J. and A.A. designed, performed and analysed the UCB experiments. G. dH. designed, analysed the UCB experiments, secured funding and wrote the manuscript. L.O. and V.M. designed, performed and analysed the muscle stem cell experiments. E.P. and P M.-C. designed, analysed and wrote the muscle stem cell experiments and secured funding. A.P. designed, performed and analysed the liver regeneration experiments. T.W. designed, analysed and wrote the liver regeneration experiments and secured funding. J.G. conceived and designed the project, secured funding and wrote the manuscript, with all authors providing feedback.
Competing Interests
J.G. has acted as a consultant for Unity Biotechnology, Geras Bio, Myricx Pharma and Merck KGaA. Pfizer and Unity Biotechnology have funded research in J.G.’s lab (unrelated to the work presented here). J.G. owns equity in Geras Bio. J.G. and A.G. are named inventors in an MRC patent and J.G. is a named inventor in another Imperial College patents, both related to senolytic therapies (the patents are no related to the work presented here). T.W. is scientific co-founder of and holds stakes in Cargene Therapeutics, which develops nucleic-acid therapeutics for liver diseases (unrelated to the work presented here). The remaining authors declare no competing interests.
Acknowledgements
We are grateful to members of J. Gil’s laboratory for reagents, comments and other contributions to this project. We thank members of the Genomics LMS facility (L. Game, K. Rekopoulou and A. Ivan) and the Bioinformatics LMS facility (G. Dharmalingam, M. Karimi and H. Pallikonda) for help with RNASeq and data processing. We thank Dr Ong Chee Bing, (BRC, A*STAR) for the histopathology scoring of liver sections. For the purpose of open access, the author has applied a Creative Commons Attribution (CC BY) licence. Core support from MRC (MC_U120085810), a Development Gap Fund grant from LifeArc and CRUK (C15075/A28647) funded this research in J. Gil’s laboratory. PM-C acknowledges funding from RTI2018-096068-B-I00, ERC-2016-AdG-741966, La Caixa HR17-00040, UPGRADE-H2020-825825, MWRF, Fundació La Marató-TV3, AFM, MDA and DPP-E. This work was supported by grants from the Deutsche Krebshilfe (to JJ), the Dutch Cancer Society (to GdH) and the Tekke Huizinga Fund (SB and GdH). L.R. was supported by the Pasteur - Paris University (PPU) International PhD Program and by the Fondation pour la Recherche Médicale (FRM). O.B was supported by Fondation ARC pour la recherche sur le Cancer, INSERM-AGEMED, and ANR S-ENCODE - 19-CE13-0017-01. O.B. is a CNRS Research Director DR2. T.W. was funded by NMRC through NMRC/OFLCG/003b/2018 and A*STAR through CRF-ATR.
Data Availability
Source data is included with this paper. The RNA-seq and ChIP-seq data generated in the present study have been deposited in the Gene Expression Omnibus database under accession numbers GSE155906 and GSE175770.
Code Availability
All software and packages used are listed in the Reporting Summary and are publicly available. The code relevant to the ChIPSeq analysis is hosted on Zenodo (https://zenodo.org, DOI: 10.5281/zenodo.6865749).
References
- 1.Gorgoulis V, et al. Cellular Senescence: Defining a Path Forward. Cell. 2019;179:813–827. doi: 10.1016/j.cell.2019.10.005. [DOI] [PubMed] [Google Scholar]
- 2.Salama R, Sadaie M, Hoare M, Narita M. Cellular senescence and its effector programs. Genes Dev. 2014;28:99–114. doi: 10.1101/gad.235184.113. [DOI] [PMC free article] [PubMed] [Google Scholar]
- 3.Collado M, et al. Tumour biology: senescence in premalignant tumours. Nature. 2005;436:642. doi: 10.1038/436642a. [DOI] [PubMed] [Google Scholar]
- 4.Krizhanovsky V, et al. Senescence of activated stellate cells limits liver fibrosis. Cell. 2008;134:657–667. doi: 10.1016/j.cell.2008.06.049. [DOI] [PMC free article] [PubMed] [Google Scholar]
- 5.Munoz-Espin D, Serrano M. Cellular senescence: from physiology to pathology. Nat Rev Mol Cell Biol. 2014;15:482–496. doi: 10.1038/nrm3823. [DOI] [PubMed] [Google Scholar]
- 6.Baker DJ, et al. Naturally occurring p16(Ink4a)-positive cells shorten healthy lifespan. Nature. 2016;530:184–189. doi: 10.1038/nature16932. [DOI] [PMC free article] [PubMed] [Google Scholar]
- 7.Ovadya Y, Krizhanovsky V. Strategies targeting cellular senescence. J Clin Invest. 2018;128:1247–1254. doi: 10.1172/JCI95149. [DOI] [PMC free article] [PubMed] [Google Scholar]
- 8.Lapasset L, et al. Rejuvenating senescent and centenarian human cells by reprogramming through the pluripotent state. Genes Dev. 2011;25:2248–2253. doi: 10.1101/gad.173922.111. [DOI] [PMC free article] [PubMed] [Google Scholar]
- 9.Latorre E, et al. Small molecule modulation of splicing factor expression is associated with rescue from cellular senescence. BMC Cell Biol. 2017;18:31. doi: 10.1186/s12860-017-0147-7. [DOI] [PMC free article] [PubMed] [Google Scholar]
- 10.Georgilis A, et al. PTBP1-Mediated Alternative Splicing Regulates the Inflammatory Secretome and the Pro-tumorigenic Effects of Senescent Cells. Cancer Cell. 2018;34:85–102.:e109. doi: 10.1016/j.ccell.2018.06.007. [DOI] [PMC free article] [PubMed] [Google Scholar]
- 11.Xu M, et al. JAK inhibition alleviates the cellular senescence-associated secretory phenotype and frailty in old age. Proc Natl Acad Sci U S A. 2015;112:E6301–6310. doi: 10.1073/pnas.1515386112. [DOI] [PMC free article] [PubMed] [Google Scholar]
- 12.Krishnamurthy J, et al. p16INK4a induces an age-dependent decline in islet regenerative potential. Nature. 2006;443:453–457. doi: 10.1038/nature05092. [DOI] [PubMed] [Google Scholar]
- 13.Molofsky AV, et al. Increasing p16INK4a expression decreases forebrain progenitors and neurogenesis during ageing. Nature. 2006;443:448–452. doi: 10.1038/nature05091. [DOI] [PMC free article] [PubMed] [Google Scholar]
- 14.Sousa-Victor P, et al. Geriatric muscle stem cells switch reversible quiescence into senescence. Nature. 2014;506:316–321. doi: 10.1038/nature13013. [DOI] [PubMed] [Google Scholar]
- 15.Guerrero A, et al. Cardiac glycosides are broad-spectrum senolytics. Nat Metab. 2019;1:1074–1088. doi: 10.1038/s42255-019-0122-z. [DOI] [PMC free article] [PubMed] [Google Scholar]
- 16.Chiang PK. Biological effects of inhibitors of S-adenosylhomocysteine hydrolase. Pharmacol Ther. 1998;77:115–134. doi: 10.1016/s0163-7258(97)00089-2. [DOI] [PubMed] [Google Scholar]
- 17.De La Haba G, Cantoni GL. The enzymatic synthesis of S-adenosyl-L-homocysteine from adenosine and homocysteine. J Biol Chem. 1959;234:603–608. [PubMed] [Google Scholar]
- 18.Acosta JC, et al. A complex secretory program orchestrated by the inflammasome controls paracrine senescence. Nat Cell Biol. 2013;15:978–990. doi: 10.1038/ncb2784. [DOI] [PMC free article] [PubMed] [Google Scholar]
- 19.Jacobs JJ, de Lange T. Significant role for p16INK4a in p53-independent telomere-directed senescence. Curr Biol. 2004;14:2302–2308. doi: 10.1016/j.cub.2004.12.025. [DOI] [PubMed] [Google Scholar]
- 20.Innes AJ, et al. XPO7 is a tumor suppressor regulating p21(CIP1)-dependent senescence. Genes Dev. 2021;35:379–391. doi: 10.1101/gad.343269.120. [DOI] [PMC free article] [PubMed] [Google Scholar]
- 21.d’Adda di Fagagna F, et al. A DNA damage checkpoint response in telomere-initiated senescence. Nature. 2003;426:194–198. doi: 10.1038/nature02118. [DOI] [PubMed] [Google Scholar]
- 22.Chiang PK, Cantoni GL. Perturbation of biochemical transmethylations by 3-deazaadenosine in vivo. Biochem Pharmacol. 1979;28:1897–1902. doi: 10.1016/0006-2952(79)90642-7. [DOI] [PubMed] [Google Scholar]
- 23.Tan J, et al. Pharmacologic disruption of Polycomb-repressive complex 2-mediated gene repression selectively induces apoptosis in cancer cells. Genes Dev. 2007;21:1050–1063. doi: 10.1101/gad.1524107. [DOI] [PMC free article] [PubMed] [Google Scholar]
- 24.Wagner EJ, Carpenter PB. Understanding the language of Lys36 methylation at histone H3. Nat Rev Mol Cell Biol. 2012;13:115–126. doi: 10.1038/nrm3274. [DOI] [PMC free article] [PubMed] [Google Scholar]
- 25.Hou P, et al. Pluripotent stem cells induced from mouse somatic cells by small-molecule compounds. Science. 2013;341:651–654. doi: 10.1126/science.1239278. [DOI] [PubMed] [Google Scholar]
- 26.Banito A, et al. Senescence impairs successful reprogramming to pluripotent stem cells. Genes Dev. 2009;23:2134–2139. doi: 10.1101/gad.1811609. [DOI] [PMC free article] [PubMed] [Google Scholar]
- 27.Garcia-Prat L, et al. Autophagy maintains stemness by preventing senescence. Nature. 2016;529:37–42. doi: 10.1038/nature16187. [DOI] [PubMed] [Google Scholar]
- 28.Scarpa S, et al. Differentiation of myoblast cell lines and biological methylation: 3-deazaadenosine stimulates formation of multinucleated myofibers. Proc Natl Acad Sci U S A. 1984;81:3064–3068. doi: 10.1073/pnas.81.10.3064. [DOI] [PMC free article] [PubMed] [Google Scholar]
- 29.Sousa-Victor P, Garcia-Prat L, Munoz-Canoves P. Control of satellite cell function in muscle regeneration and its disruption in ageing. Nat Rev Mol Cell Biol. 2022;23:204–226. doi: 10.1038/s41580-021-00421-2. [DOI] [PubMed] [Google Scholar]
- 30.Kwon SM, Hong SM, Lee YK, Min S, Yoon G. Metabolic features and regulation in cell senescence. BMB Rep. 2019;52:5–12. doi: 10.5483/BMBRep.2019.52.1.291. [DOI] [PMC free article] [PubMed] [Google Scholar]
- 31.Yang S, et al. Oval cells compensate for damage and replicative senescence of mature hepatocytes in mice with fatty liver disease. Hepatology. 2004;39:403–411. doi: 10.1002/hep.20082. [DOI] [PubMed] [Google Scholar]
- 32.Fausto N, Campbell JS. The role of hepatocytes and oval cells in liver regeneration and repopulation. Mech Dev. 2003;120:117–130. doi: 10.1016/s0925-4773(02)00338-6. [DOI] [PubMed] [Google Scholar]
- 33.Broxmeyer HE. Enhancing the efficacy of engraftment of cord blood for hematopoietic cell transplantation. Transfus Apher Sci. 2016;54:364–372. doi: 10.1016/j.transci.2016.05.013. [DOI] [PMC free article] [PubMed] [Google Scholar]
- 34.Brunstein CG, Wagner JE. Cord blood transplantation for adults. Vox Sang. 2006;91:195–205. doi: 10.1111/j.1423-0410.2006.00823.x. [DOI] [PubMed] [Google Scholar]
- 35.Baker DJ, et al. Clearance of p16Ink4a-positive senescent cells delays ageing-associated disorders. Nature. 2011;479:232–236. doi: 10.1038/nature10600. [DOI] [PMC free article] [PubMed] [Google Scholar]
- 36.Tanaka H, et al. The NSD2/WHSC1/MMSET methyltransferase prevents cellular senescence-associated epigenomic remodeling. Aging Cell. 2020;19:e13173. doi: 10.1111/acel.13173. [DOI] [PMC free article] [PubMed] [Google Scholar]
- 37.Mosteiro L, et al. Tissue damage and senescence provide critical signals for cellular reprogramming in vivo. Science. 2016;354 doi: 10.1126/science.aaf4445. [DOI] [PubMed] [Google Scholar]
- 38.Chiche A, et al. Injury-Induced Senescence Enables In Vivo Reprogramming in Skeletal Muscle. Cell Stem Cell. 2017;20:407–414.:e404. doi: 10.1016/j.stem.2016.11.020. [DOI] [PubMed] [Google Scholar]
- 39.Boitano AE, et al. Aryl hydrocarbon receptor antagonists promote the expansion of human hematopoietic stem cells. Science. 2010;329:1345–1348. doi: 10.1126/science.1191536. [DOI] [PMC free article] [PubMed] [Google Scholar]
- 40.Fares I, et al. Cord blood expansion. Pyrimidoindole derivatives are agonists of human hematopoietic stem cell self-renewal. Science. 2014;345:1509–1512. doi: 10.1126/science.1256337. [DOI] [PMC free article] [PubMed] [Google Scholar]
- 41.Gupta R, et al. Nov/CCN3 Enhances Cord Blood Engraftment by Rapidly Recruiting Latent Human Stem Cell Activity. Cell Stem Cell. 2020;26:527–541.:e528. doi: 10.1016/j.stem.2020.02.012. [DOI] [PMC free article] [PubMed] [Google Scholar]
- 42.Carey BW, et al. Reprogramming of murine and human somatic cells using a single polycistronic vector. Proc Natl Acad Sci U S A. 2009;106:157–162. doi: 10.1073/pnas.0811426106. [DOI] [PMC free article] [PubMed] [Google Scholar]
- 43.Aarts M, et al. Coupling shRNA screens with single-cell RNA-seq identifies a dual role for mTOR in reprogramming-induced senescence. Genes Dev. 2017;31:2085–2098. doi: 10.1101/gad.297796.117. [DOI] [PMC free article] [PubMed] [Google Scholar]
- 44.Guerrero A, et al. Galactose-modified duocarmycin prodrugs as senolytics. Aging Cell. 2020;19:e13133. doi: 10.1111/acel.13133. [DOI] [PMC free article] [PubMed] [Google Scholar]
- 45.Suelves M, et al. uPA deficiency exacerbates muscular dystrophy in MDX mice. J Cell Biol. 2007;178:1039–1051. doi: 10.1083/jcb.200705127. [DOI] [PMC free article] [PubMed] [Google Scholar]
- 46.Sacco A, et al. Short telomeres and stem cell exhaustion model Duchenne muscular dystrophy in mdx/mTR mice. Cell. 2010;143:1059–1071. doi: 10.1016/j.cell.2010.11.039. [DOI] [PMC free article] [PubMed] [Google Scholar]
- 47.Le G, Lowe DA, Kyba M. Freeze Injury of the Tibialis Anterior Muscle. Methods Mol Biol. 2016;1460:33–41. doi: 10.1007/978-1-4939-3810-0_3. [DOI] [PMC free article] [PubMed] [Google Scholar]
- 48.Mitchell C, Willenbring H. A reproducible and well-tolerated method for 2/3 partial hepatectomy in mice. Nat Protoc. 2008;3:1167–1170. doi: 10.1038/nprot.2008.80. [DOI] [PubMed] [Google Scholar]
- 49.Loforese G, et al. Impaired liver regeneration in aged mice can be rescued by silencing Hippo core kinases MST1 and MST2. EMBO Mol Med. 2017;9:46–60. doi: 10.15252/emmm.201506089. [DOI] [PMC free article] [PubMed] [Google Scholar]
- 50.Jung J, et al. CBX7 Induces Self-Renewal of Human Normal and Malignant Hematopoietic Stem and Progenitor Cells by Canonical and Non-canonical Interactions. Cell Rep. 2019;26:1906–1918.:e1908. doi: 10.1016/j.celrep.2019.01.050. [DOI] [PubMed] [Google Scholar]
- 51.Hu Y, Smyth GK. ELDA: extreme limiting dilution analysis for comparing depleted and enriched populations in stem cell and other assays. J Immunol Methods. 2009;347:70–78. doi: 10.1016/j.jim.2009.06.008. [DOI] [PubMed] [Google Scholar]
- 52.Picelli S, et al. Full-length RNA-seq from single cells using Smart-seq2. Nat Protoc. 2014;9:171–181. doi: 10.1038/nprot.2014.006. [DOI] [PubMed] [Google Scholar]
- 53.Trapnell C, Pachter L, Salzberg SL. TopHat: discovering splice junctions with RNA-Seq. Bioinformatics. 2009;25:1105–1111. doi: 10.1093/bioinformatics/btp120. [DOI] [PMC free article] [PubMed] [Google Scholar]
- 54.Love MI, Huber W, Anders S. Moderated estimation of fold change and dispersion for RNA-seq data with DESeq2. Genome Biol. 2014;15:550. doi: 10.1186/s13059-014-0550-8. [DOI] [PMC free article] [PubMed] [Google Scholar]
- 55.Martinez-Zamudio RI, et al. AP-1 imprints a reversible transcriptional programme of senescent cells. Nat Cell Biol. 2020;22:842–855. doi: 10.1038/s41556-020-0529-5. [DOI] [PMC free article] [PubMed] [Google Scholar]
Associated Data
This section collects any data citations, data availability statements, or supplementary materials included in this article.
Supplementary Materials
Data Availability Statement
Source data is included with this paper. The RNA-seq and ChIP-seq data generated in the present study have been deposited in the Gene Expression Omnibus database under accession numbers GSE155906 and GSE175770.
All software and packages used are listed in the Reporting Summary and are publicly available. The code relevant to the ChIPSeq analysis is hosted on Zenodo (https://zenodo.org, DOI: 10.5281/zenodo.6865749).


