Abstract
Characterization of genetic regulatory variants acting on the livestock gene expression is essential for interpreting the molecular mechanisms underlying traits of economic value and for increasing the rate of genetic gain through artificial selection. Here we build a Cattle Genotype-Tissue Expression atlas (CattleGTEx) as part of the pilot phase of Farm animal GTEx (FarmGTEx) project for the research community based on publicly available 7,180 RNA-Seq samples. We describe the transcriptomic landscape of over 100 tissues/cell types and report hundreds of thousands of genetic associations with gene expression and alternative splicing for 23 distinct tissues. We evaluate the tissue-sharing patterns of these genetic regulatory effects, and functionally annotate them using multi-omics data. Finally, we link gene expression in different tissues to 43 economically important traits using both transcriptome-wide association and colocalization analyses to decipher the molecular regulatory mechanisms underpinning such agronomic traits in cattle.
Keywords: Cattle, expression QTLs, GWAS, RNA-Seq, TWAS
Introduction
Genome-wide association studies (GWAS) have identified thousands of genetic variants associated with complex traits in human and livestock populations1,2. As the majority of these variants are non-coding, the characterization of molecular mechanisms by which such variants affect complex traits has been extremely challenging. Indeed, in human genetics, projects such as the Genotype-Tissue Expression (GTEx) project that have characterized genetic effects on the human transcriptome and paved the way to understanding the molecular mechanisms of human variation3.
However, livestock genomic resources lag behind human genomic resources, and to date, no study has systematically explored the regulatory variants of transcriptome across a wide range of tissues. GWAS signals of agronomic traits are significantly enriched in regulatory regions of genes expressed in trait-relevant tissues in cattle4-6, but studies of genetic variation in gene expression have generally been small, both in terms of the number of individuals and tissues. For instance, previous studies have explored the expression/splicing quantitative trait loci (e/sQTL) in blood7, milk cells7, muscle8 and mammary gland in cattle9.
There has been a recent exponential growth in the number of RNA-Seq samples made publicly available in cattle (Extended Data Figure 1a), but these data have never been uniformly processed and jointly analyzed before. Here, we present a pipeline to uniformly integrate 7,180 public RNA-Seq samples, representing over 100 different tissues and cell types, and identify eQTLs and sQTLs for 23 distinct cattle tissues with sufficient sample sizes (n > 40). The latter is facilitated by calling variants directly from the RNA-Seq reads and imputing to sequence level using a large multi-breed reference panel10, in a similar process to that used with human data11. Next, we conducted in silico analyses to annotate eQTLs and sQTLs with a variety of omics data in cattle, including DNA methylation, chromatin states, and chromatin conformation characteristics. Finally, we integrated gene expression with a large GWAS of 27,214 dairy bulls and 43 cattle traits via both transcriptome-wide association study (TWAS) and colocalization analyses to detect genes and variants associated with these economically important traits. We make the results freely and easily accessible to the research community through a web portal (http://cgtex.roslin.ed.ac.uk/). This Cattle Genotype-Tissue Expression (CattleGTEx) atlas as part of the Farm animal GTEx (FarmGTEx) project will serve as a primary reference for cattle genomics, breeding, adaptive evolution, veterinary medicine, and comparative genomics.
Results
Data summary
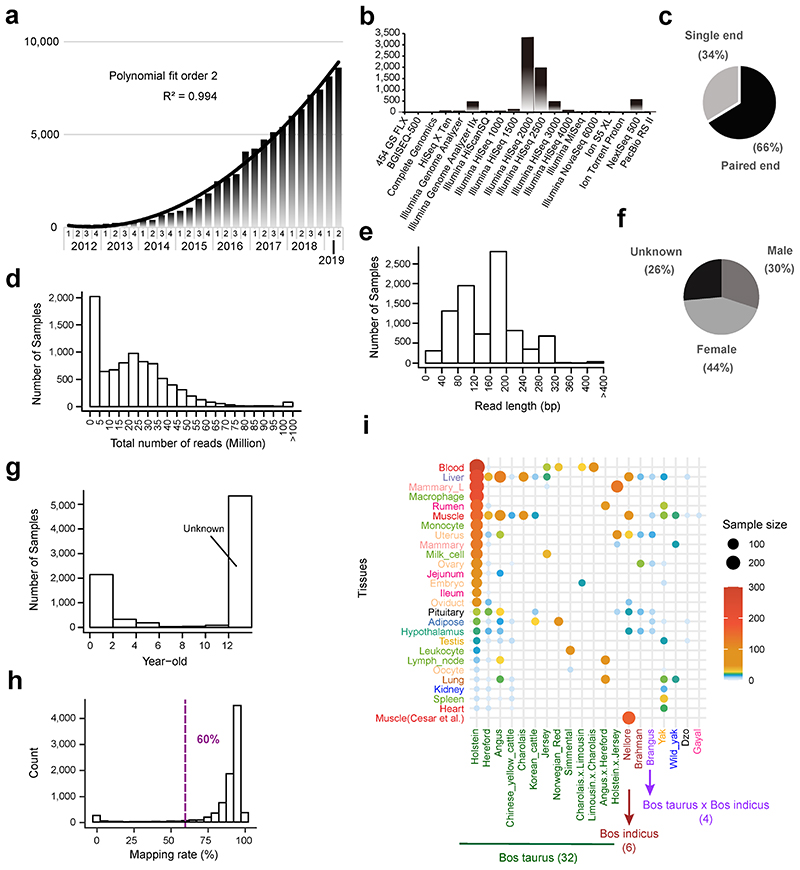
We analyzed 8,653 public RNA-Seq samples, yielding ~200 billion clean reads. The details of data summary are shown in Extended Data Figure 1b-i and Supplementary Table 1. We kept 7,180 samples with sufficient quality (see Methods) for subsequent analyses, representing 114 tissues from 46 breeds and breed combinations. Holstein was the most represented breed (35.5% of all samples), reflecting its global economic value. A total of 1,831 samples (21%) had no breed records, but that information could be inferred from the genotypes called from RNA-Seq data. We grouped the 114 tissues into 13 categories based on known biology and the 46 breeds into six ancestry groups, with Bos taurus representing 87% of all samples (Supplementary Table 1). To investigate the tissue-specificity of DNA methylation for functionally annotating QTLs, we also uniformly analyzed 144 whole-genome bisulfite sequence (WGBS) samples from 21 cattle tissues, producing ~73 billion clean reads with an average mapping rate of 71% (Supplementary Table 2).
General characteristics of transcriptome across samples
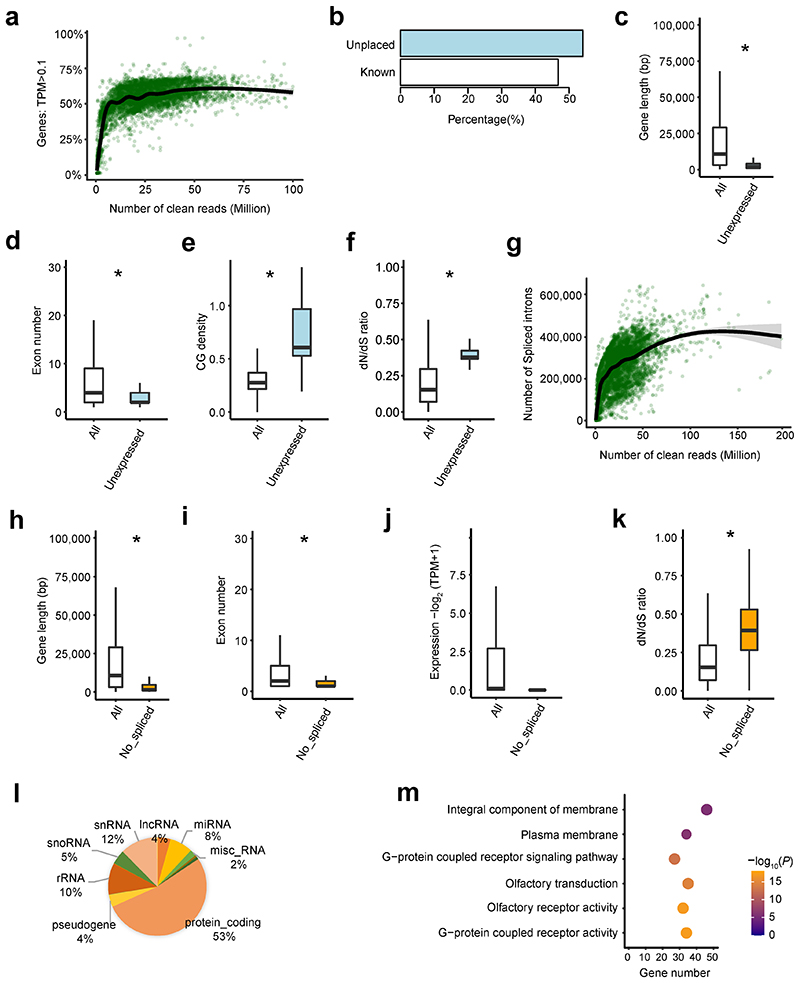
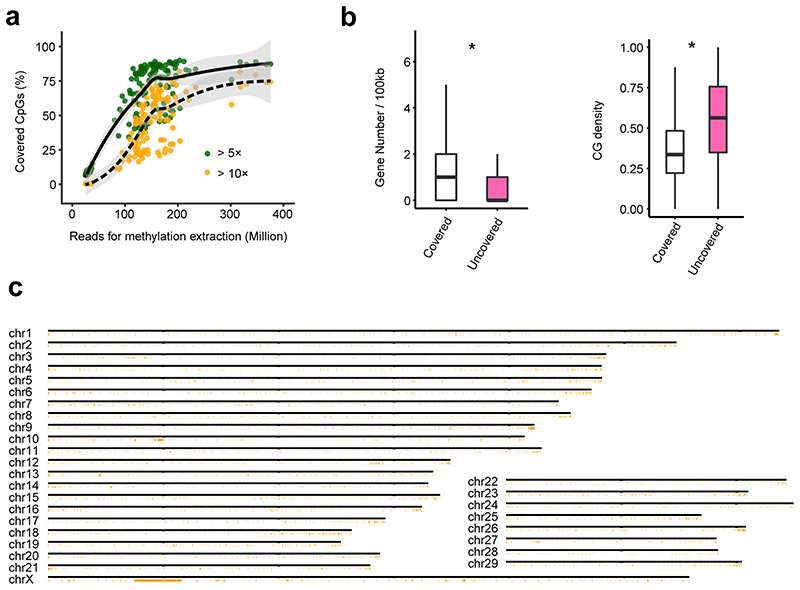
As expected, the number of expressed genes (Transcripts per Million, TPM > 0.1) increased with the number of clean reads across samples. However, we observed a plateau at 50 million clean reads (Extended Data Figure 2a) where we only detected ~60% of 27,607 Ensembl annotated genes. Only 61 genes were not expressed in any of the samples, and 33 of them (54.10%) were located in unplaced scaffolds, with significantly shorter gene length, fewer exons, higher CG density, and lower sequence constraints than expressed genes (Extended Data Figure 2b-f). Similarly, we detected more alternative splicing events with increasing numbers of clean reads across samples (Extended Data Figure 2g). However, we did not detect splicing events for 874 genes in any sample, which also exhibited significantly shorter gene length, fewer exons, lower expression, and lower sequence constraints than spliced genes (Extended Data Figure 2h-k). Furthermore, 27% of them were snRNAs, snoRNAs and rRNAs that play important roles in RNA splicing12 (Extended Data Figure 2l). Genes without splicing events were significantly enriched in the integral component of membrane and G-protein coupled receptor signaling pathways (Extended Data Figure 2m). We found that ~25% of CpG sites in the entire genome were not covered at 5× in any of the WGBS samples, even if these had more than 300 million clean reads, partially due to bisulfite treatment and PCR amplification bias (Extended Data Figure 3a). These CpG sites were enriched in gene deserts (e.g., telomeres) with significantly higher CG density than the CpG sites captured by the WGBS (Extended Data Figure 3b-c).
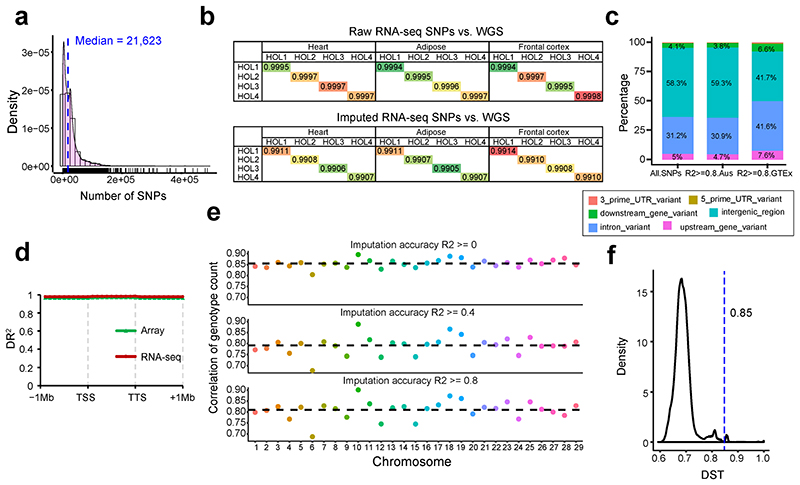
We called a median of 21,623 SNPs from all RNA-Seq samples (Extended Data Figure 4a), and then imputed each sample up to 3,824,444 SNPs using a multi-breed reference population of 3,310 animals10. We validated the imputation accuracy by comparing SNPs derived from RNA-Seq with those called from whole-genome sequence (WGS) in the same individuals, including Holstein, Limousin and Angus breeds, and the concordance rates were over 99% (Extended Data Figure 4b, and Supplementary Table 3). We also compared the imputed genotypes from RNA-Seq data with those imputed using 50K SNP array genotypes in 109 Holstein animals. Although there was a depletion of high-quality (DR2 > 0.80) imputed intergenic variants amongst SNPs imputed from RNA-Seq only (Extended Data Figure 4c), the imputation accuracy of SNPs from RNA-Seq were similar to those from SNP-array along 1Mb up-/down- stream of gene body (Extended Data Figure 4d). In addition, the correlation of genotype counts between imputed SNPs from RNA-Seq data and those from SNP array was around 0.80 (Extended Data Figure 4e). For the subsequent cis-QTL mapping, we focused on 23 distinct tissues with greater than 40 individuals after removing duplicated samples within each tissue (Extended Data Figure 4f), and this encompassed 4,889 samples.
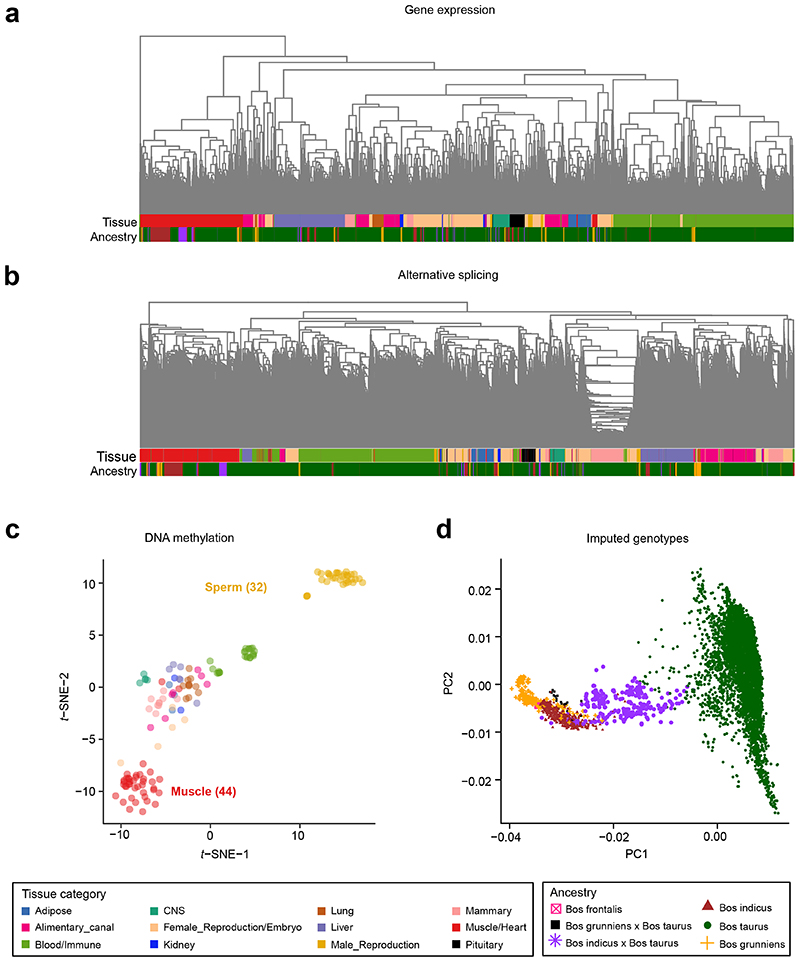
We found that clusters of samples derived from both gene expression and alternative splicing could accurately recapitulated tissue types (Figure 1a, b), reinforcing the quality and therefore their utility for our follow-up analysis. For instance, all the muscle samples from over 40 projects clustered together. Similar to expression and splicing, DNA methylation profiles also recapitulated tissue types (Figure 1c). When clustering based on imputed genotypes, as expected, samples clustered by ancestry (Figure 1d).
Figure 1. Hierarchical clustering and principal component analysis of samples.
(a) Sample (n = 7,180) hierarchical clustering based on expression levels of all transcribed genes (Transcripts Per Million, TPM > 0.1). (b) Sample (n = 7,180) hierarchical clustering based on alternative splicing value (Percent Spliced-In, PSI) of spliced introns. (c) Sample (n = 144) clustering using t-distributed SNE coordinates based on DNA methylation levels of CpG sites (coverage ≥ 5×). (d) Principal component analysis of samples (n = 7,180) based on imputed genotypes.
Tissue specificity of transcriptome and methylome
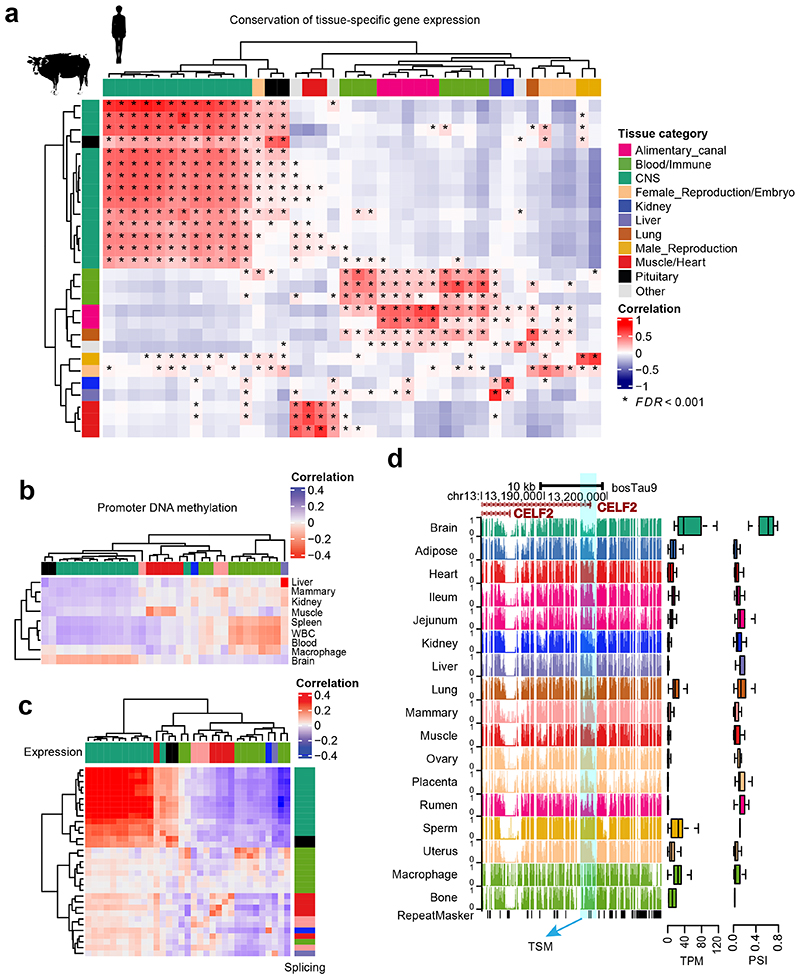
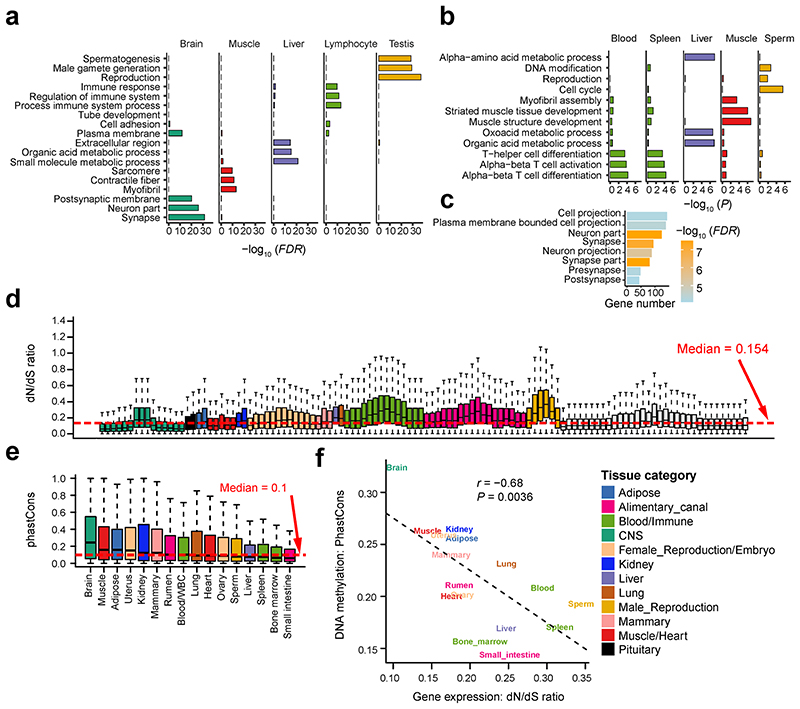
Tissue-specificity of gene expression was significantly conserved between cattle and humans (Figure 2a), and the function of genes with tissue-specific expression accurately reflected the known biology of tissues. For instance, brain-specific genes were significantly enriched for synapse and neuron function, and testis-specific genes for spermatogenesis and reproduction (Extended Data Figure 5a). We also calculated tissue-specificity of promoter DNA methylation and gene alternative splicing. Similarly, the function of genes with tissue-specific promoter hypomethylation and splicing reflected the known biology of tissues (Extended Data Figure 5b-c). We found that, based on tissue-specificity, the gene expression level was significantly and negatively correlated with DNA methylation level in promoters (Figure 2b), and positively correlated with splicing ratios of introns (Figure 2c). For example, CELF2, a brain-related gene, had a significantly higher expression, lower promoter DNA methylation, and higher splicing ratio of first intron in brain than in other tissues considered (Figure 2d). Tissue-specific genes exhibited distinct patterns of sequence constraints (Extended Data Figure 5d), supporting the hypothesis of tissue-driven genome evolution4. We found that while brain-specific genes evolve slowly, blood or testis-specific ones evolve rapidly. This trend was also observed within tissue-specific hypomethylated regions (Extended Data Figure 5e-f).
Figure 2. Tissue-specificity of gene expression, alternative splicing and DNA methylation.
(a) Pearson correlation of tissue-specificity (measured as t-statistics) of 22,752 orthologous genes between cattle and human tissues (GTEx v8)3. The multiple testing is corrected for using Benjamini-Hochberg method (i.e., FDR). * denotes FDR < 0.001. (b) Pearson correlation of tissue-specificity between gene expression (x-axis) and promoter DNA methylation levels (y-axis). WBC is for white blood cells. The color code of tissues in x-axis is the same as that in (a). (c) Pearson correlation of tissue-specificity between gene expression (Transcripts per Million, TPM, x-axis) and alternative splicing (Percent Spliced-In, PSI, y-axis). The color code of tissues is the same as that in (a). (d) CELF2 shows lower DNA methylation levels in splice sites (right), higher gene expression (middle), and higher PSI value of spliced introns (left) in brain tissue (n = 15) compared to the rest of tissues. TSM is for tissue-specific methylation.
Discovery of expression and splicing QTLs
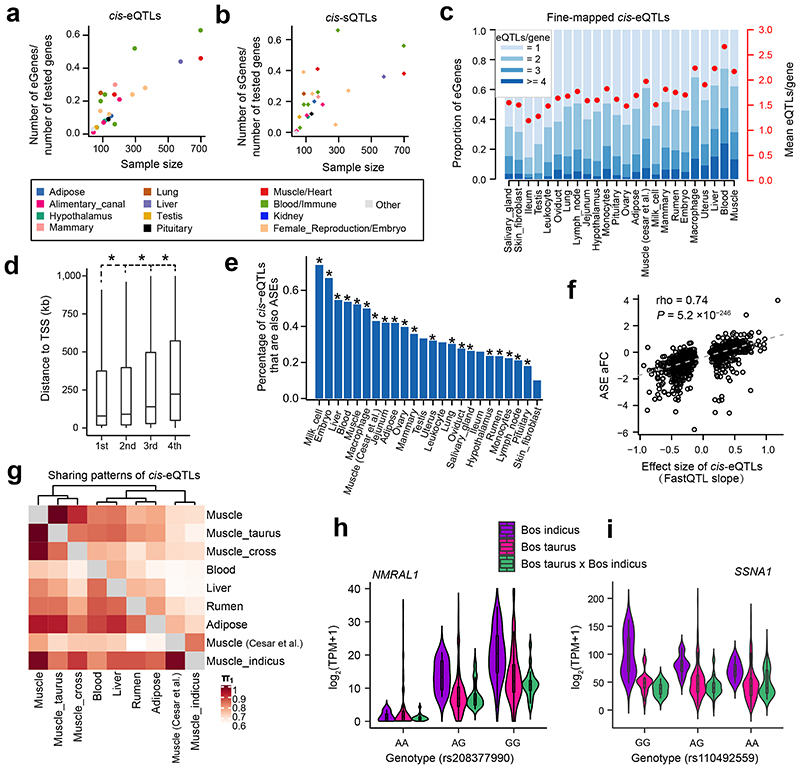
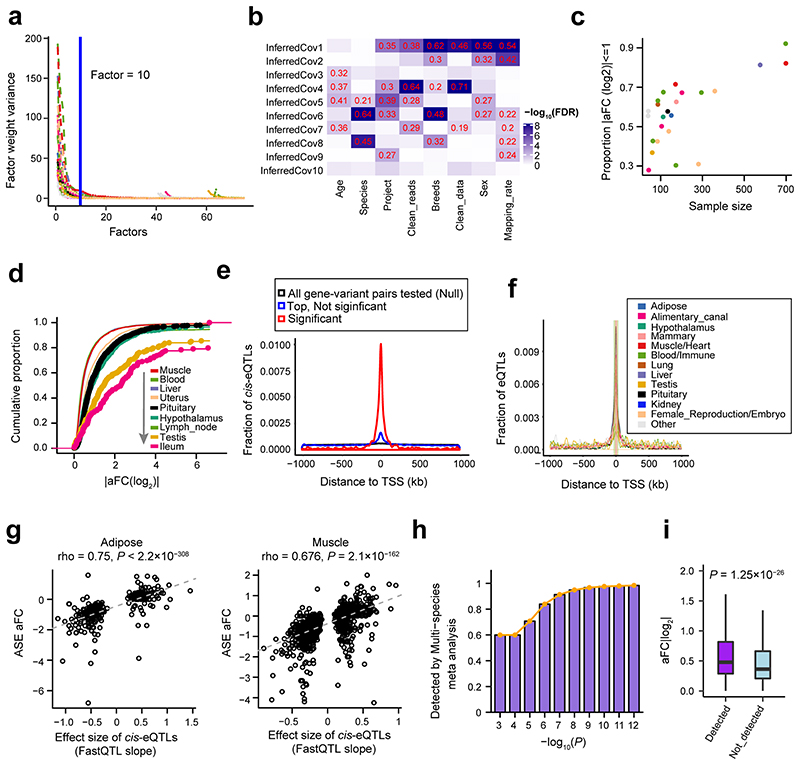
We identified cis-e/sQTLs for 23 distinct tissues with 40 or more individuals, while accounting for relevant confounding factors and multiple testing (Extended Data Figure 6a-b). The number of eGenes (genes with significant cis-eQTLs) discovered ranged from 172 in ileum to 10,157 in blood, with 19,559 (83% of all 23,523 tested genes) classed as eGenes in at least one tissue (Supplementary Table 4). The number of sGenes (genes with significant cis-sQTLs) discovered ranged from four in the salivary gland to 7,913 in macrophages, with 15,376 (70.8%) classed as sGenes in at least one tissue. Genes with no cis-eQTLs or -sQTLs in any of the tissues were significantly enriched in hormone activity, regulation of receptor activity, neuropeptide signaling pathway, and reproduction (Supplementary Table 5-7). In general, the larger the number of samples for the tissue, the larger the number of cis-e/sGenes detected (Figure 3a-b). As expected, with a larger sample size, we had more power to detect cis-eQTLs with smaller effect sizes (Extended Data Figure 6c-d). Consistent with findings in humans13, significant variants (eVariants) centered around transcript start sites (TSS) of measured genes (Extended Data Figure 6e-f). Across 23 distinct tissues, an average of 46% (range 25.5 - 76.6%) of eVariants were found within 100 kb around TSS of target genes. In non-eGenes, there was also an enrichment of SNPs with the smallest P-values (but not statistically significant at FDR of 0.05) around TSS, suggesting a lack of power to detect such associations for those genes (Extended Data Figure 6e). Furthermore, we fine-mapped eGenes to assess whether the identified signals could be attributed to one or more causal SNPs. We found that an average of 46% (range 14.5 - 73.9%) of eGenes across 23 tissues had more than one independent cis-eQTLs (Figure 3c), indicating the complex genetic control of gene expression. SNPs with larger effects within a locus tended to be closer to the TSS (Figure 3d). To complement and validate the cis-eQTL analysis within individuals, we conducted an allele-specific expression (ASE) analysis, and found that cis-eQTLs were significantly overrepresented in loci with significant (FDR < 0.05) ASE (Figure 3e), and effect sizes of cis-eQTLs was significantly correlated with those of ASEs (Figure 3f, Extended Data Figure 6g).
Figure 3. Discovery and characterization of cis-eQTLs and cis-sQTLs.
(a) Relationship between the percentages of eGenes over all tested genes and sample size (Pearson r = 0.85; the two-sided Student’s t-test: P = 1.30×10⁻⁷) across 23 distinct tissues. (b) Relationship between the percentage of sGenes over all tested genes and sample size (Pearson r = 0.63; the two-sided Student’s t-test: P = 1.06×10⁻³) across 23 distinct tissues. Tissues are colored according to their tissue categories. (c) Distribution and average number of conditionally independent eQTLs per gene across tissues. Tissues are ordered by sample size. (d) The distance to Transcription Start Site (TSS) increases from the 1st to 4th independent eQTLs. Only 7276 gene-tissue pairs with at least 4 independent eQTLs were chosen. Significant differences (denoted as *) were observed between 1st vs. 2nd (P = 2.4×10⁻³), 2nd vs. 3rd (P = 3.0 ×10⁻²⁶) and 3rd vs. 4th (P = 1.9×10⁻²⁷) independent eQTLs based on the two-sided paired sample t-test. (e) cis-eQTLs are significantly (P < 1.0×10⁻¹⁴, denoted as *, Fisher Exact test) overrepresented in the loci with allelic specific expression (ASE). The y-axis indicates the percentage of cis-eQTLs that are also ASEs over all tested SNPs in the ASE analysis. (f) Correlation of effect sizes (FastQTL slope) of cis-eQTLs and allelic fold change (aFC) of ASEs (Spearman’s rho = 0.74, the two-sided Student’s t-test: P = 5.2×10-246) in liver. (g) Pairwise cis-eQTL sharing patterns (π1 value) of muscle tissue across three breeds (Bos indicus, Bos taurus and their crosses) and other tissues. Rows are discovery tissues, and columns are validation tissues. Muscle (Cesar et al.) is for 160 skeletal muscle samples of Bos indicus downloaded from Cesar et al. 20188. (h) A cis-eQTL (rs208377990) of NMRAL1 in muscle is shared across Bos indicus (n = 51), Bos taurus (n = 505) and their crosses (n = 108). (i) A cis-eQTL (rs110492559) of SSNA1 in muscle is specific in Bos indicus (MAF = 0.25 and 0.37 in Bos taurus and Bos indicus, respectively), and has a significant (the two-sided t-test, P = 5.61×10⁻³) genotype × breed interaction. The samples are the same as in (h).
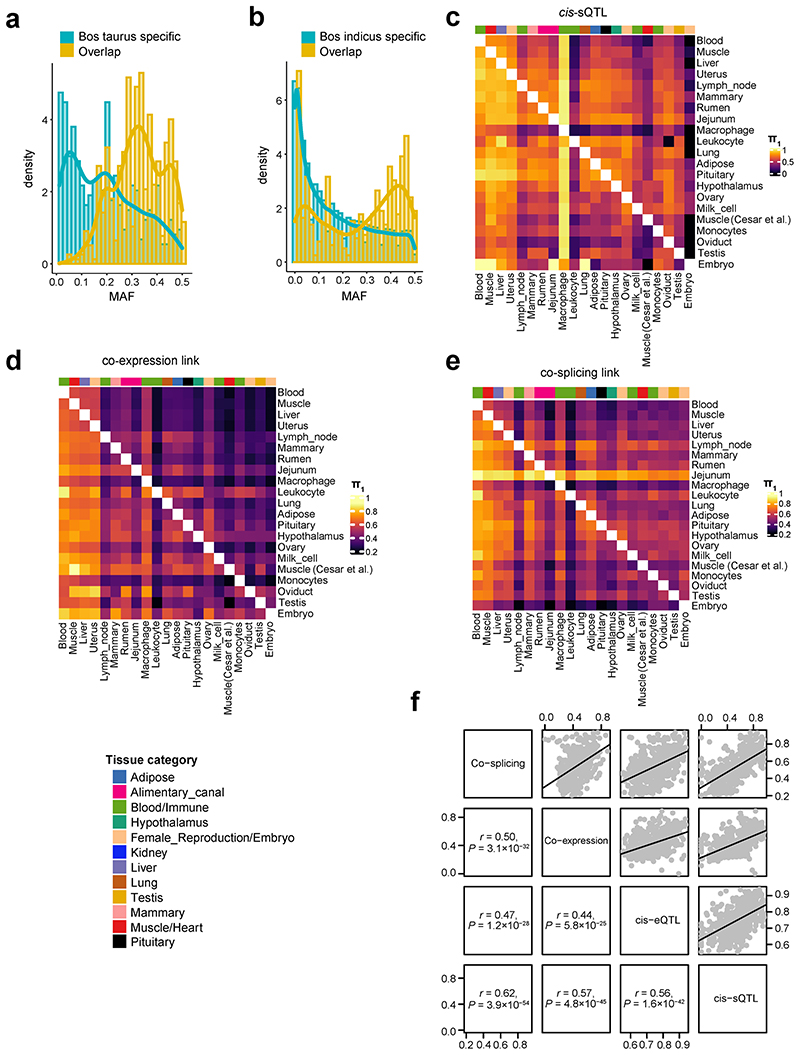
To investigate whether cis-eQTLs are conserved among breeds, we conducted cis-eQTL mapping for muscle samples from Bos indicus, Bos taurus, and their hybrids separately, yielding 86, 2,766, and 800 eGenes, respectively. We observed that cis-eQTLs were more conserved across breeds than across tissues (Figure 3g). For example, the expression of NMRAL1 in muscle was consistently and significantly regulated by a cis-eQTL (rs208377990) among Bos indicus, Bos taurus, and their hybrids (Figure 3h). Combining the summary statistics of each breed in a meta-analysis showed that eGene-eVariant associations identified in one breed are potentially transferable to other breeds, particularly for SNPs with larger effect size (Extended Data Figure 6h-i). Combining samples from different breeds will increase statistical power for detecting shared eQTLs, and enable more accurate mapping of the causal variants via reducing the linkage disequilibrium (LD) patterns. In total, 131 out of 437 eGene-eVariant pairs that were specifically discovered in Bos indicus showed significant (FDR < 0.05) genotype × breed interactions (Supplementary Table 8). For instance, the expression of an immune-related gene, SSNA1, was regulated by a cis-eQTL (rs110492559) in Bos indicus but not in Bos taurus or the hybrids, showing a significant genotype × breed interaction (Figure 3i). In addition, we found that breed-specific cis-eQTLs had lower minor allele frequency (MAF) than breed-common cis-eQTLs, consistent in both Bos indicus and Bos taurus (Extended Data Figure 7a-b). This may indicate that the difference in cis-eQTLs between breeds could be partially due to their difference in the frequency of segregating variants, provided that there are no epistatic/environmental/developmental effects.
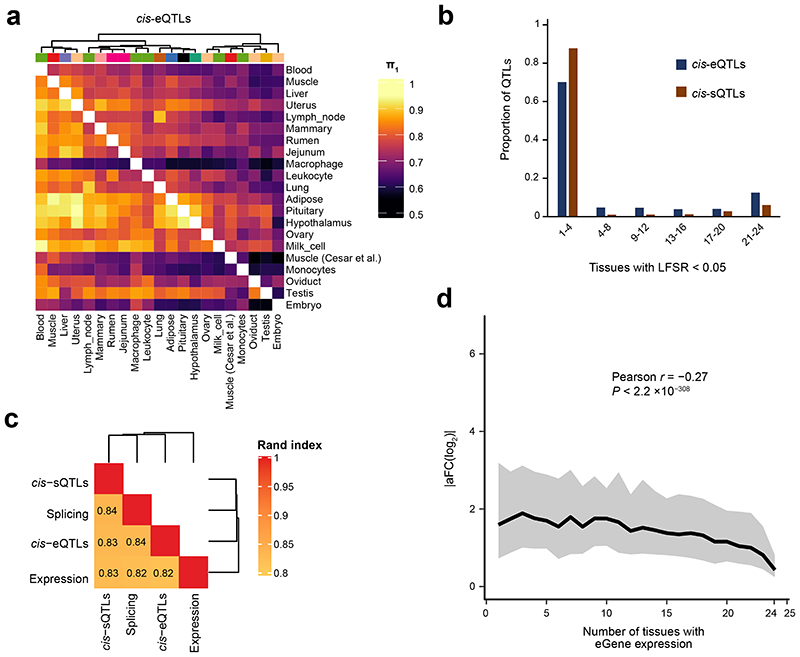
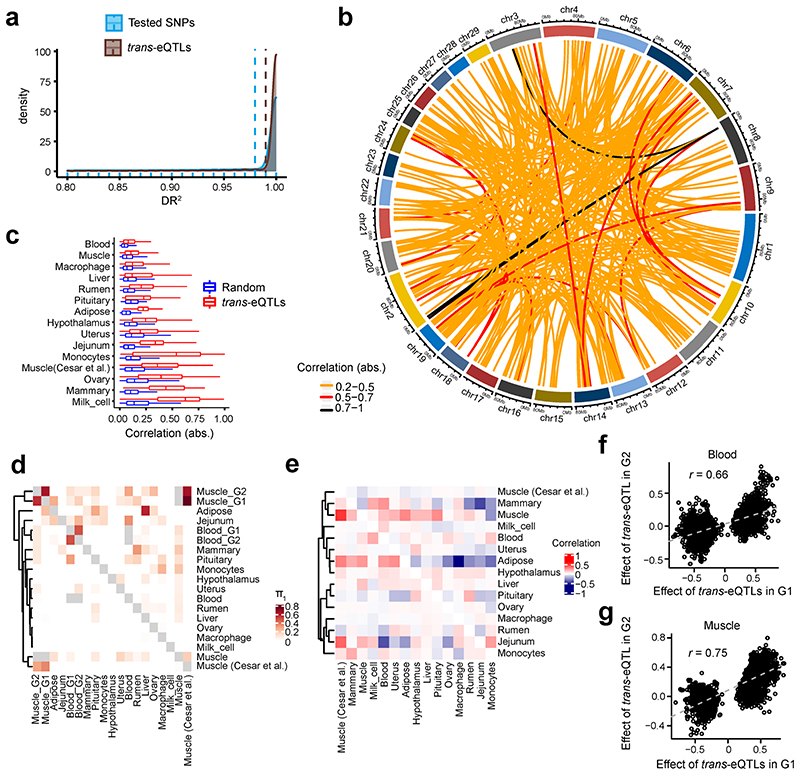
The tissue-sharing patterns of cis-QTLs could provide novel insights into molecular regulatory mechanisms underlying complex phenotypes3. We applied the π1 statistics to measure the sharing patterns of cis-e/sQTLs between tissues (Figure 4a and Extended Data Figure 7c). In general, we observed that both cis-eQTLs and cis-sQTLs tended to be tissue-specific or ubiquitous across tissues (Figure 4b). We also calculated the tissue-sharing patterns of gene expression and alternative splicing (Extended Data Figure 7d-e), and found that the tissue-sharing patterns of the four core data types (i.e., gene expression, alternative splicing and cis-e/sQTLs) were similar (Figure 4c and Extended Data Figure 7f). This result suggests that tissues with similar transcriptional profiles shared the genetic regulatory mechanisms of transcription. Further analysis on the expression of eGenes across tissues revealed that effect sizes of eVariants decreased with the increasing number of tissues where target eGenes were expressed, indicating that, on average, tissue-specific genes might be regulated by SNPs with larger genetic regulatory effects than widely-expressed genes (Figure 4d). Due to limitations and challenges of trans-eQTLs analysis in this study, which include: insufficient statistical power, the relatively lower imputation accuracy of distant intergenic SNPs, and complex inter-chromosomal LD in cattle (which could lead to increased type I error rates)14, we only conducted an exploratory trans-e/sQTL mapping for 15 tissues with over 100 individuals. We detected an average of 1,058 and 84 trans-eGenes and trans-sGenes (FDR < 0.05) across tissues, respectively (Supplementary Table 9). We summarized the details of trans-eQTL mapping, including LD patterns of trans-eQTLs and cis-eQTLs, tissue-sharing patterns of trans-eQTLs and their validations, in Extended Data Figure 8.
Figure 4. Tissue-sharing patterns of cis-QTLs.
(a) Pairwise cis-eQTL sharing patterns (π1 value) across 23 distinct tissues. (b) Tissue activity of cis-eQTLs and cis-sQTLs, where a cis-QTL is considered active in a tissue if it has a mashr local false sign rate (LFSR, equivalent to FDR) of < 5%. (c) The similarity of tissue clustering across four data types (cis-eQTL, cis-sQTL, gene expression and splicing) based on the π1 values3,13. The k-means clustering is performed based on 2-22 clusters with 100,000 iterations. For each pairwise data types, we report the median Pairwise Rand index across all clusters. (d) Median (line) and 95% confidence interval (shading) of cis-eQTL effect size (y-axis, measured as the absolute log2 transformed allele Fold Change, |aFC(log2)|), as a function of the number of tissues in which the eGene is expressed (x-axis; TPM > 0.1). Pearson correlation between |aFC(log2)| and number of tissues with eGene expression is -0.27 (the two-sided Student’s t-test: df = 43,721; P < 2.2×10-308).
Functional annotation of QTLs
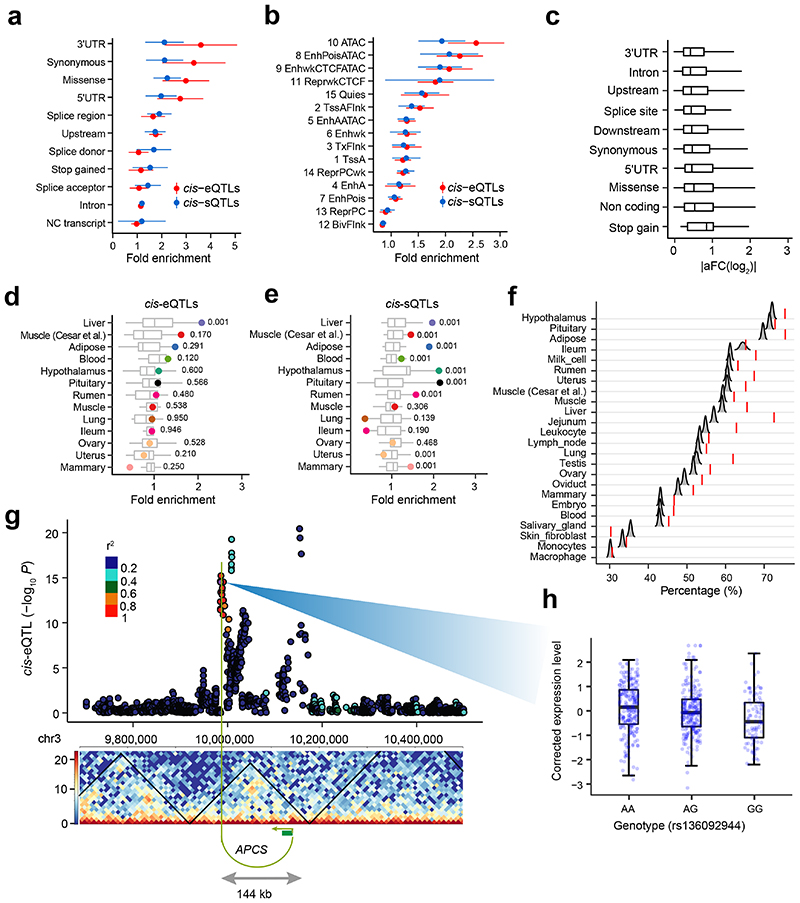
We employed multiple layers of biological data to better define the molecular mechanisms of genetic regulatory effects. As expected, cis-e/sQTLs were significantly (P < 0.05, the 1,000 times permutation test) enriched in functional elements, such as 3’UTR and open chromatin regions by ATAC-Seq data in cattle rumen epithelial primary cells15 (Figure 5a-b). The cis-sQTLs had a higher enrichment in splice donors/acceptors than cis-eQTLs. The cis-eQTLs associated with stop gains had larger effect sizes than other cis-eQTLs (Figure 5c). The cis-e/sQTLs were enriched in hypomethylated regions of the matching tissues across 13 tissues (Figure 5d-e). For instance, the liver exhibited the highest enrichment of cis-e/sQTL in liver-specific hypomethylated regions. Consistent with the brain having distinct abundance of alternative splicing, related to the development of the nervous system13, cis-sQTLs in the hypothalamus and pituitary had the highest enrichments in their specific hypomethylated regions (Figure 5e).
Figure 5. Functional annotation of cis-QTLs.
(a) Enrichment (fold change, the two-sided permutation test with 1,000 times) of cis-eQTLs and cis-sQTLs of 23 distinct tissues in sequence ontology. The data are presented as Mean ± SD. (b) Enrichment (fold change, the two-sided permutation test with 1,000 times) of cis-eQTLs and cis-sQTLs of 23 distinct tissues in 15 chromatin states predicted from cattle rumen epithelial primary cells in Holstein animals15. The data are presented as Mean ± SD. (c) Effect sizes (measured as |aFC(log2|) of cis-eQTLs of 23 distinct tissues across sequence ontology. (d) and (e) Enrichment of cis-eQTLs and cis-sQTLs of 13 tissues in tissue-specific hypomethylated regions, respectively. These 13 tissues have both DNA methylation and cis-QTL data. The numbers are P-values for enrichments of matched tissues (highlighted dots) based on the permutation test (the two sided, 1,000 times). (f) Percentages of eGene-eVariant pairs that are located within topologically associating domains (TADs) are significantly (FDR < 0.01, one-sided) higher than those of random eGene-SNP pairs with matched distances, except for ileum, macrophage and skin fibroblast. The null distributions of percentages of eGene-SNP pairs within TADs are obtained by doing 5,000 bootstraps. The TADs are obtained from the lung Hi-C data. (g) An eGene (APCS) and its eVariant (rs136092944) are located within a TAD, and linked by a significant Hi-C contact (10kb bins, position 9985,000 is linked to 10,135,000 in chr3 with Benjamini-Hochberg corrected P = 1.4×10⁻⁶. The P-value is obtained based on the binominal distribution model. The Manhattan plot shows the P-values of all tested SNPs in the cis-eQTL mapping analysis of APCS. The linkage disequilibrium (LD, r2) values between eVariant (rs136092944) and surrounding SNPs are shown in colors. (h) The boxplot shows the PEER-corrected expression levels of APCS across the three genotypes of eVariant (rs136092944), i.e., AA (n = 237), AG (n = 245), and GG (n = 94), respectively.
Topologically associated domains (TADs) enable chromatin interactions between distant regulatory regions and target promoters16. By examining Hi-C data of lung tissue in cattle17, we obtained TADs and significant Hi-C contacts, which were likely to be conserved across tissues16. By comparing with random eGene-SNP pairs with matched distances, we observed significantly (FDR < 0.01, 5,000 bootstrapping test) higher percentages of eGene-eVariant pairs within TADs across the majority of tissues, except for ileum and skin fibroblast (Figure 5f). For instance, APCS and its cis-eQTL peak (144kb upstream of its TSS) were encompassed by a TAD and linked by a significant Hi-C contact, which allowed the regulation of its expression by a distant eVariant (rs136092944) (Figure 5g-h).
cis-QTLs and complex trait associations
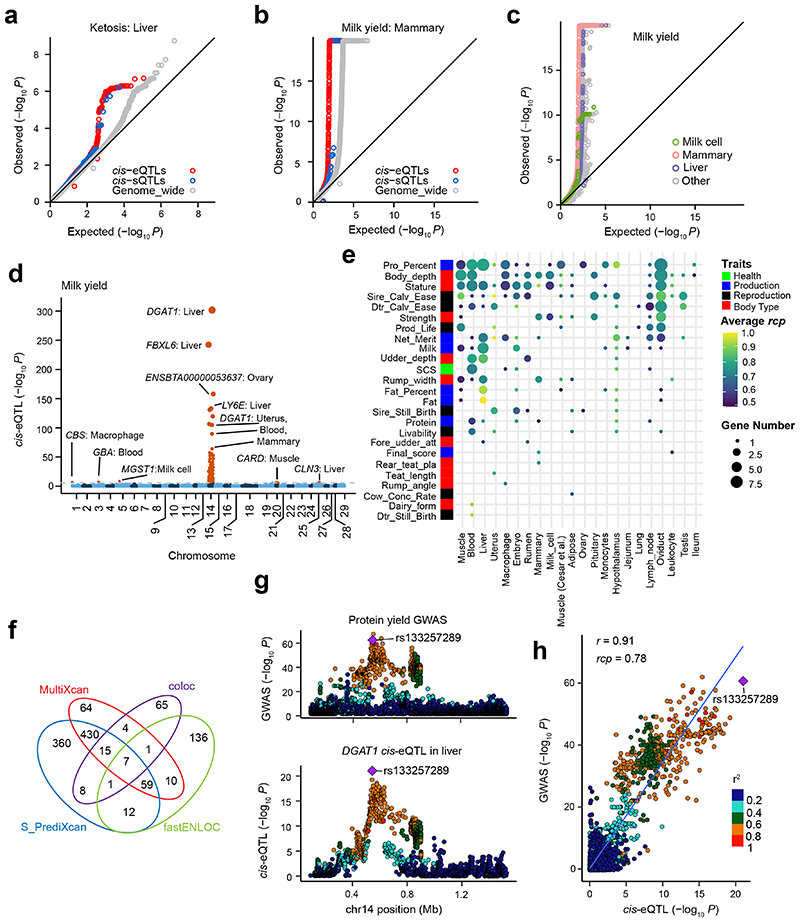
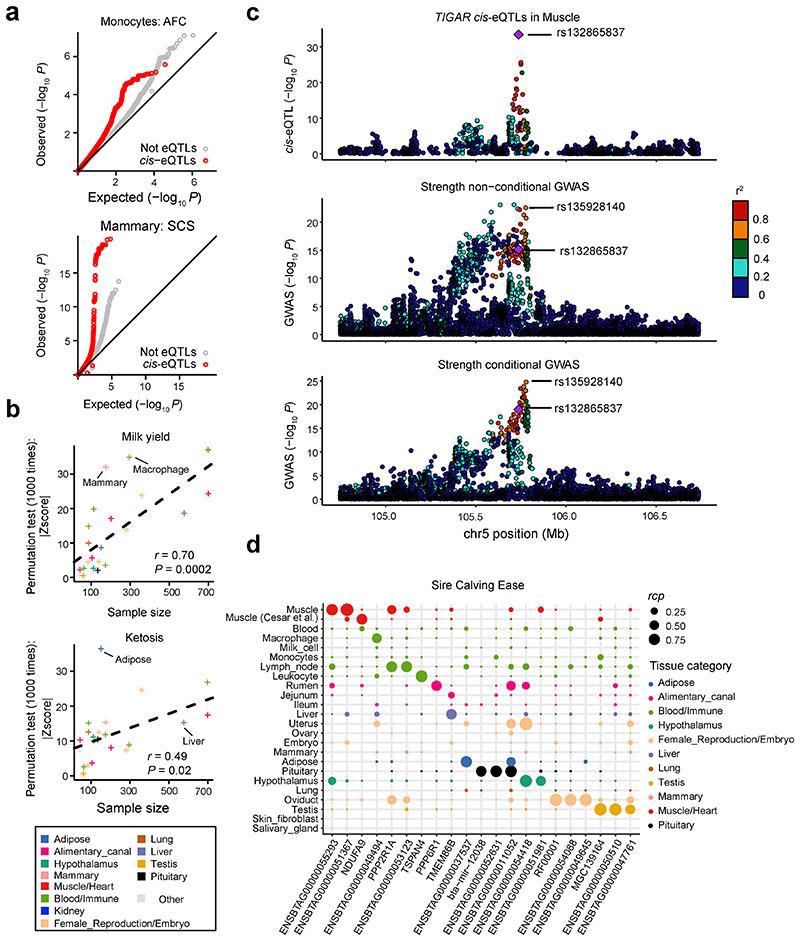
The primary goal of this study is to provide a resource for elucidating the genetic and biological mechanisms involved in cattle complex traits. We thus evaluated cis-e/sQTLs detected in each tissue for associations with four distinct agronomic traits as examples, i.e., ketosis, milk yield, age at first calving (AFC) and somatic cell score (SCS). The top SNPs associated with ketosis from GWAS were significantly (P < 0.05, the 1,000 times permutation test) enriched for liver cis-e/sQTLs (Figure 6a). Similarly, milk yield associated SNPs were significantly overrepresented in cis-e/sQTLs from mammary gland (Figure 6b). Compared to other tissues, mammary gland, milk cells and liver were the tissues with highest enrichment of milk yield associated SNPs amongst cis-eQTLs (Figure 6c). Additionally, SNPs associated with AFC were significantly enriched for monocytes cis-eQTLs, and SCS for mammary gland (Extended Data Figure 9a). We observed that a larger sample size of a cis-eQTL tissue resulted in a higher enrichment of GWAS loci and cis-eQTLs, potentially explaining the associations of complex traits with non-matching tissues (Extended Data Figure 9b).
Figure 6. Relationship between complex traits and cis-QTLs.
(a) cis-eQTLs (P = 0.001) and cis-sQTLs (P = 0.02) in liver show significantly higher enrichments for top SNPs associated with ketosis compared to genome-wide SNPs (shown in grey). (b) cis-eQTLs (P = 0.001) and cis-sQTLs (P = 0.03) in mammary gland show higher enrichments for top SNPs associated with milk yield compared to genome-wide SNPs (shown in grey). All the P values above are obtained by the two-sided permutation test with 1,000 times. (c) Enrichment of cis-eQTLs for genetic associations with milk yield is tissue-dependent. The cis-eQTLs in mammary gland, milk cells and liver exhibit higher enrichments for genetic associations with milk yield compared to those in other tissues. (d) Manhattan plots of transcriptome-wide association study (TWAS) for milk yield across all 23 distinct tissues. (e) The number of genes that were colocalized (regional colocalization probability, rcp > 0.5 in fastENLOC) between GWAS significant loci of complex traits and cis-eQTLs across tissues. The size of point indicates the number of genes, while the color of point indicates the average rcp of each trait-tissue pair. The abbreviations of GWAS traits are explained in Supplementary Table 10. (f) The overlaps of significant gene-trait pairs from TWAS with S-PrediXcan (Bonferroni corrected P < 0.05) and S-MultiXcan (Bonferroni corrected P < 0.05) and colocalization with fastENLOC (rcp > 0.5) and Coloc (posterior probability of the shared single causal variant hypothesis H4 (PP.H4) > 0.8). (g) An example of a colocalization (rcp = 0.78) of cis-eQTLs of DGAT1 gene in liver and GWAS loci of protein yield in cattle on chromosome 14. The top colocalized SNP (rs133257289) is the top cis-eQTL of DGAT1 and the second top GWAS signal of protein yield. (h) A high Pearson correlation (r = 0.91, the two-sided Student’s t-test: df = 2,933; P < 2.2×10-308) between P-values from cis-eQTLs of DGAT1 in liver and GWAS of protein yield.
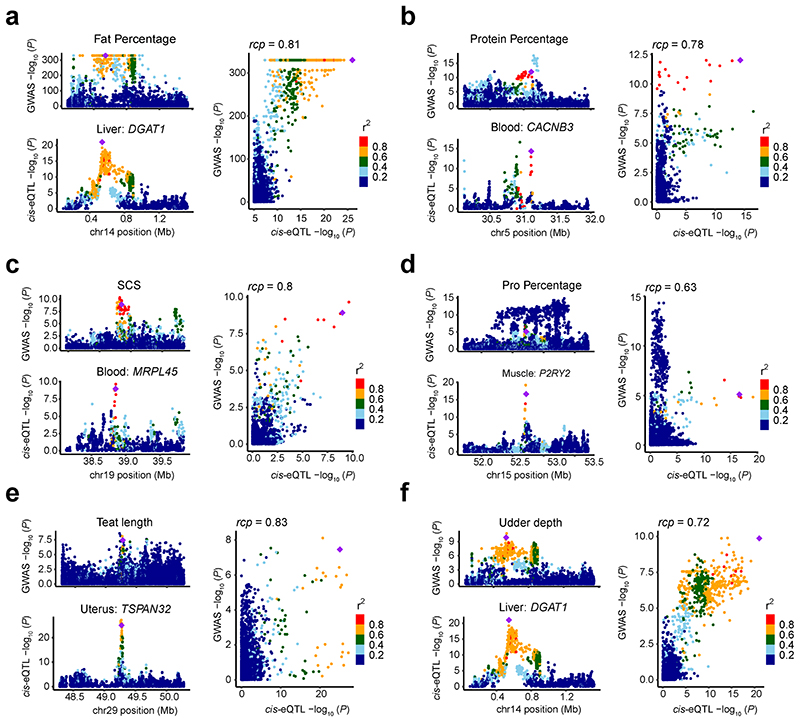
We detected 854 significant gene-trait pairs for 43 agronomic traits (Supplementary Table 10) in cattle via single-tissue TWAS (S-PrediXcan), representing 337 unique genes (Supplementary Table 11). Out of 319 fine-mapped genes18,19, we validated 54, including linking expression of DGAT1 in liver and mammary gland, and expression of MGST1 in milk cells, as well as expression of CLN3 in liver to milk yield (Figure 6d). The expression of ZNF613 in hypothalamus was the most significant association for many reproduction and body conformation traits, including daughter-still-birth and stature (Supplementary Table 11), supporting our previous finding that ZNF613 is significantly associated with gestation length possibly through its influence on embryonic development20. Furthermore, we conducted a colocalization analysis of cis-eQTLs and GWAS loci, and detected 115 unique eGenes that were colocalized (regional colocalization probability, rcp > 0.5) with 260 GWAS loci associated to 25 out of the 43 complex traits analyzed. These represented 235 significant gene-trait pairs (Figure 6e; Supplementary Table 12). For instance, TIGAR, a muscle cis-eGene, playing roles in the phosphatase activity, energy storage and consuming, was colocalized (rcp = 0.529) with one of independent GWAS signals of strength on chromosome 5 (Extended Data Figure 9c). GWAS loci of milk yield were colocalized with ARHGAP39 in hypothalamus, TEF in embryo, SYT11 in blood, CCDC166 in oviduct and ASPHD1 in jejunum (Supplementary Table 12). We also took sire calving ease, which GWAS loci were colocalized with 21 eGenes in at least one tissue, as an example in Extended Data Figure 9d. In addition, we further employed Coloc and S-MultiXcan to conduct the colocalization and multi-tissue TWAS analysis, and detected 110 and 590 significant gene-trait pairs, respectively (Supplementary Table 13-14). By comparing results from TWAS and colocalization, we found an overlap of seven gene-trait pairs (Figure 6f, Extended Data Figure 10). For instance, we found that cis-eQTLs of DGAT1 in liver were colocalized (rcp = 0.78) with GWAS signals of protein yield, and the p-values from GWAS were highly (r = 0.91) correlated with those from cis-eQTL (Figure 6g-h).
Discussion
The CattleGTEx atlas represents one of the most comprehensive reference resources of the cattle transcriptome to date. It provides a detailed characterization of genetic control of gene expression and splicing across 23 distinct tissues in cattle. This study demonstrates that it is possible to discover gene expression regulatory variants by deriving and imputing genetic variants from livestock RNA-Seq data alone. We established a in silico protocol to generate a livestock GTEx atlas in a timely manner and show the value of reanalyzing published data to find novel biology, avoiding the significant costs of data generation. Although we have provided a comprehensive view of the genetic regulatory variants in cattle, we are also mindful that this resource can be further improved with the inclusion of more individuals/breeds and further data types. The imputation accuracy for breeds that are very under-represented in the reference panel might be relatively low. Additionally, generating SNP genotypes or WGS for individuals with RNA-Seq data can provide additional information for distal intergenic variants as compared to RNA-Seq data only. The FarmGTEx consortium is currently extending the bioinformatics pipeline developed here to other livestock species (e.g., pig, sheep, goat and chicken).
The CattleGTEx also provides a resource to explore tissue-sharing patterns of the transcriptome and its genetic regulation in cattle. In contrast to the human GTEx3, where RNA-Seq samples across tissues were collected from the same individuals, the CattleGTEx used public data, where individuals or even breeds were different from tissue to tissue. This might explain why there is a lower proportion of cis-e/sQTLs shared across tissues compared to the human GTEx. In addition, the difference in the cell-type composition of tissues can also affect the tissue-sharing patterns of cis-QTLs3. When single-cell RNA-Seq data is available for multiple tissues in the near future21, it will be of interest to computationally estimate the cell-type proportions in the bulk-tissue samples to uncover the cellular specificity of genetic regulatory effects22.
This CattleGTEx atlas provides an important tool for studying the mechanisms underlying complex traits through systematically linking SNPs, genes, tissues, and complex traits. The e/sQTLs detected here provide a rich set of functional variants for agronomic traits in cattle, as we found that top GWAS associations of traits were significantly enriched for regulatory QTLs in their relevant tissues. Our TWAS and colocalization analyses further provide a list of promising candidate genes/variants for functional follow-ups. We noted the relatively small overlap of results from TWAS and colocalization. This might be because these methods assume the genetic architecture of both the trait of interest and the tissue gene expression differently. In addition, we observed the discrepancy between high rcp values and lack of correlation of raw P-values of GWAS and eQTL in the entire region of each colocalized locus. This may be due to 1) the allelic heterogeneity and complex LD in each locus; 2) the imperfect LD match between GWAS (only Holstein population) and eQTLs populations (multiple breeds); 3) the currently commonly used colocalization methods based on GWAS summary statistics might not work well in highly related individuals in livestock. We therefore suggest focusing analyses on loci where colocalization and TWAS methods agree.
Further integration of these QTLs with functional annotations from the Functional Annotation of Animal Genomes (FAANG) project will provide opportunities to understand transcriptional/post-transcriptional regulatory mechanisms underpinning GWAS hits for agronomic traits23. The multi-tissue e/sQTLs generated here will also enable the exploration of molecular mechanisms underlying the extensive pleiotropic effects identified in livestock24. This information will allow the understanding of mechanisms of response to intended selection as well as disentangling negative correlated responses to this same selection (e.g. increasing mastitis or deteriorating fertility when selection for increased milk production). Furthermore, this resource will assist in the development of genomic selection methods and tools to improve animal health and wellbeing. For instance, a better understanding of the genetic architecture underpinning agronomic traits will benefit genetic improvement programs by incorporating biological knowledge into genomic prediction models, which has been shown to improve prediction accuracy across populations and breeds10,24.
Online Methods
Ethics
The ethical approval for this project was obtained from the US Department of Agriculture, Agricultural Research Service, Beltsville Agricultural Research Center’s Institutional Animal Care and Use Committee (Protocol 16-016).
Quantification of gene expression
We downloaded 11,642 RNA-Seq datasets (by June 24th, 2019) from SRA (n = 11,513, https://www.ncbi.nlm.nih.gov/sra/) and BIGD databases (n = 129, https://bigd.big.ac.cn/bioproject/) by searching the ‘Organism’ for ‘Cattle’ and the ‘Strategy’ for ‘RNA seq’. We merged multiple datasets from single samples, yielding 8,536 unique RNA-Seq samples. We applied a stringent and uniform pipeline to filter and analyze all the data. Briefly, we first removed adaptors and low quality reads using Trimmomatic (v0.39)25 with parameters: adapters/TruSeq3-SE.fa:2:30:10 LEADING:3 TRAILING:3 SLIDINGWINDOW:4:15 MINLEN:36. We filtered out samples with clean read counts ≤ 500K, resulting in 7,680 samples, and mapped clean reads to the ARS-UCD1.2 cattle reference genome17 using single or paired mapping modules of STAR (v2.7.0) with parameters of outFilterMismatchNmax 3, outFilterMultimapNmax 10 and outFilterScoreMinOverLread 0.66. We kept 7,264 samples with uniquely mapping rates ≥ 60% (mean, 91.07%; range, 60.44%-100%; mapping details in Supplementary Table 1). We then obtained normalized expression (TPM) of 27,608 Ensembl (v96) annotated genes using Stringtie (v2.1.1)26, and extracted raw read counts of them with featureCounts (v1.5.2)27. We finally clustered 7,264 samples based on log2(TPM +1) using a hierarchical clustering method, implemented in R (v3.4.1) package dendextend, with distance = (1-r), where r is the Pearson correlation coefficient.
Quantification of alternative splicing
We used Leafcutter (v0.2.9)28 to identify and quantify variable alternative splicing events of genes by leveraging information of junction reads (i.e., reads spanning introns) that were obtained from the STAR alignment. The Leafcutter enables the identification of splicing events without relying on existing annotations that are typically incomplete, especially in the setting of large genes or individual- and/or population-specific isoforms28. We first converted bam files from STAR alignment into junction files using the script “bam2junc.sh”, and then performed intron clustering using the script “leafcutter_cluster.py” with default settings of 50 reads per cluster and a maximum intron length of 500 kb. We employed the “prepare_genotype_table.py” script in Leafcutter to calculate intron excision ratios and to remove introns used in less than 40% of individuals or with no variation. Ultimately, we standardized and quantile normalized intron excision ratios as Percent Spliced-In (PSI) values across samples. We clustered 7,180 samples based on PSI using the same method as used in gene expression.
Genotyping and imputation
We called genotypes of known genomic variants in the 1000 Bull Genomes Projects10 for 7,180 high-quality RNA-Seq samples individually, following the recommended best practices pipeline in Genome Analysis Toolkit, (GATK) (v4.0.8.1)29 with default settings. We filtered out low quality SNPs using --filter-expression “FS > 30.0 & QD < 2.0”. We then imputed the filtered SNPs on autosomes to sequence level using Beagle (v5.1)30 based on a multiple-breed reference population consisted of 3,103 individuals from run7 of the 1000 Bull Genomes Project10 and 207 public individuals from Bos taurus (n = 101), Bos indicus (zebu, n = 20), and Bos grunniens (yak, n = 86) (Supplementary Table 15). Finally, we obtained 6,123 samples that were genotyped and imputed successfully. We filtered out variants with MAF < 0.05 and dosage R-squared (DR2) < 0.8, resulting in 3,824,444 SNPs used for QTL mapping. To evaluate the accuracy of imputation, we called genotypes (~6 M SNPs) from WGS (average read depth > 10×) of Holstein (n = 4), Limousin (n = 3) and Angus (n = 5) animals, which had RNA-Seq data as well. We then measured the genotype concordance rates between WGS-SNPs and RNA-Seq/imputed SNPs. We extracted 153,913 LD-independent SNPs using plink (v1.90)31 (--indep-pairwise 1000 5 0.2), and conducted PCA analysis for all 6,123 samples using these SNPs in EIGENSOFT (v7.2.1)32. We calculated the identity-by-state (IBS) distance among samples by using these independent SNPs to remove duplicate individuals. IBS distance = (IBS2 + 0.5*IBS1) / (IBS0 + IBS1 + IBS2), where IBS0 is the number of IBS 0 non-missing variants, IBS1 is the number of IBS 1 non-missing variants and IBS2 is the number of IBS 2 non-missing variants. We set an IBS distance cutoff of 0.85 to deem two samples as duplicates and kept one of them. When conducting QTL mapping, we removed an average of 43 duplicate samples within each tested tissue (ranging from one in salivary gland and leukocyte to 132 in muscle), resulting in 4,889 samples.
Allele specific expression (ASE)
We conducted ASE analysis using the GATK ASEReadCounter tool (v4.0.8.1) with the following settings: --U ALLOW_N_CIGAR_READS -minDepth 10 -minMappingQuality 255 --minBaseQuality 10. SNPs for ASE detection fulfilled the following criteria: heterozygous in at least five samples, at least 10 reads per allele, and at least 2% of all reads supporting the minor allele. We then calculated a binominal P-value by comparing to the expected ratio under the null hypothesis, followed by multiple-test correction with the Benjamini-Hochberg approach (FDR). SNPs with FDR < 0.05 were considered as significant ASE. We estimated the effect size (allele fold change, aFC) of regulatory variants at ASE loci using a haplotype-based approach implemented in phASER (v1.1.1)33.
Bioinformatics analysis of WGBS data
For WGBS data analysis, we first used FastQC (v0.11.2) and Trim Galore v0.4.0 (-- max_n 15 --quality 20 --length 20 -e 0.1) to determine read quality and to filter reads with low quality, respectively. We then mapped clean reads to the same reference genome (ARS-UCD1.2) using Bismark software (v0.14.5)34 with default parameters. After deduplication of reads, we extracted methylation levels of cytosines using the bismark_methylation_extractor (--ignore_r2 6) function. The coverages of all WGBS data were calculated using clean reads with an average of 27.6-fold coverage (range: 5-47 ×). Ultimately, we kept CpG sites that were represented by at least five reads for subsequent analyses. We visualized sample clusters based on DNA methylation levels of shared CpGs using t-SNE approaches.
Identification of TAD and significant Hi-C contacts
To find potential chromatin interactions between distant eVariants and target eGenes, we identified TADs and Hi-C contacts from Hi-C data from lung tissue in cattle that was retrieved from NCBI Sequence Read Archive (SRA) under accessions: SRR5753600, SRR5753603, and SRR5753606. We used Trim Galore (v0.4.0) to trim adapter sequences and low-quality reads (--max_n 15 --quality 20 --length 20 -e 0.1), resulting in ~820 million clean reads. We then mapped clean reads to the reference genome (ARS-UCD1.2) using BWA(v0.7.17)35. We applied HiCExplorer v3.4.136 to build a Hi-C contact matrix with 10kb resolution and identified TAD with hicFindTAD. We kept TADs with FDR less than 0.01 to link eQTLs to eGenes. We further employed HiC-Pro (v2.11.4)37 to call Hi-C contacts with 10 kb resolution from Hi-C data. Briefly, HiC-Pro aligned clean reads to the reference genome with Bowtie2 (v2.3.5)35,38. After building a contact matrix, HiC-Pro generated intra- and inter-chromosomal maps and normalized them using the ICE normalization algorithm. We converted Hi-C contact matrix in HiC-Pro format to FitHiC format using HiCPro2FitHiC.py in FitHiC (v2.0.7) and applied statistical confidence estimates to determine the significant intra-chromosome contacts (Benjamini-Hochberg corrected P < 0.05).
Tissue-specificity analysis of gene expression, alternative splicing and DNA methylation
To quantify tissue-specific expression of genes, we computed a t-statistics for each gene in each of the 114 tissues. We grouped 114 tissues into 13 categories (Supplementary Table 1). We scaled the log2-transformed expression (i.e., log2TPM) of genes to have a mean of zero and variance of one within each tissue. We then fitted a linear model as described in15 for each gene in each tissue using the least squares method. When constructing the matrix of dummy variables (i.e., design matrix) for tissues, we denoted samples of the target tissue/cell type (e.g., CD4 cells) as ‘1’, while samples outside the target category (e.g., non-blood/immune tissues) as ‘-1’. We excluded samples within the same category (e.g., CD8 cells and lymphocytes) to detect genes with specific expression in each particular category, even if they were not specific to the target tissue within this category. We obtained t-statistics for each gene to measure its expression specificity in a given tissue. We considered the top 5% of genes ranked by largest t-statistics as genes with high tissue-specific expression. In order to explore the conservation of tissue-specific expression between cattle and humans, we employed the same method to quantify the tissue-specific expression of all orthologous genes in each of 55 human tissues using GTEx (v8) data3.
To detect tissue-specific alternative splicing, we used leafcutter to analyze the differential intron excision by comparing the samples from the target tissue to the remaining tissues28, while excluding samples from tissues of the same category as the target tissue. We used the Benjamini-Hochberg method (FDR) to control multiple testing.
For DNA methylation, we focused on gene promoters (from upstream 1500bp to downstream 500bp of TSS based on the ARS-UCD1.2 from Ensembl v99), the methylation levels of which were calculated with a weighted methylation method using the roimethstat function in MethPipe (v3.4.3)39. We computed a t-statistic for the promoter of each gene using the same method as in tissue-specific expression analysis. We considered the bottom 5% of genes ranked by t-statistics as genes with tissue-specific promoter hypomethylation. We also detected tissue-specific methylation regions in a genome-wide mode using SMART2 (v2.2.8)40 with parameters of -t DeNovoDMR -MR 0.5 -AG 1.0 -MS 0.5 -ED 0.2 -SM 0.6 - CD 500 -CN 5 -SL 20 -PD 0.05 -PM 0.05.
Covariate analysis for QTL discovery
To account for hidden batch effects and other technical/biological sources of transcriptome-wide variation in gene expression, we estimated latent covariates in each tissue using the Probabilistic Estimation of Expression Residuals (PEER v1.3) method41. In each tissue, we estimated 75 PEER factors first. The posterior variances of factor weights dramatically decreased and reached or nearly reached plains when 10 PEER factors were included (Extended Data Figure 6a). Therefore, we used 10 PEER covariates to account for the effects of confounding variables on gene expression in all following QTL analyses. For instance, the variance of gene expression among samples in adipose captured by 9 out of 10 PEER factors were significantly (FDR < 0.05) correlated with known technical and biological covariates like clean data size, mapping rate, project, breeds, sub-species, sex and age (Extended Data Figure 6b). To further control the effect of population structure on the discovery of QTLs, we included genotype PCs based on sample size bins: three PCs for tissues with < 150 samples, five PCs for tissues with ≥ 150 and < 250 samples, and ten PCs for tissues with ≥ 250 samples.
cis-eQTL mapping
We conducted cis-eQTL mapping for 23 distinct tissues with at least 40 individuals each, while adjusting for corresponding PEER factors and genotype PCs. Detailed information about these 23 distinct tissues is in Supplementary Table 4. As the majority of cis-eQTLs are shared across sub-species/breeds (Figure 3g), we combined, adjusting for species/breed, all of the datasets from the same tissue to perform cis-eQTL mapping in order to increase the statistical power. We kept genes with TPM > 0.1 in ≥ 20% samples in each tissue. Gene expression values of all samples in a given tissue were quantile normalized to the average empirical distribution and expression values for each gene then inverse normal transformed (INT) across samples. The cis-eQTL mapping was done using a linear regression model, implemented in FastQTL (v2.184)42, to test associations of the normalized expression level of genes with genetic variants in 1Mb of TSS of target genes. We only considered imputed variants with MAF > 0.05 and at least four minor alleles across samples within the target tissue. We first conducted cis-eQTL mapping in a permutation mode with the setting --permute 1000 10000, to identify genes with at least one significant cis-eQTL (eGene). We considered FDR ≤ 0.05 as significant, which was calculated with the Benjamini-Hochberg method based on the beta distribution-extrapolated empirical P-values from FastQTL. To identify a list of significant eGene-eVariant pairs, we applied the nominal mode in FastQTL. A genome-wide empirical P-value threshold pt was defined as the empirical P-value of the gene closest to the 0.05 FDR threshold3. We then calculated the nominal threshold as F-1(pt), where F-1 is the binominal inverse cumulative distribution, of which parameters for genes were obtained from the above permutation mode of FastQTL analysis. We considered variants with nominal P-values below the nominal threshold as significant, and included them into the list of eGene-eVariant pairs. We calculated the aFC, defined as the ratio of the expression level of the haplotype carrying the alternative allele over the one carrying the reference allele, to measure effect sizes of cis-eQTLs using the aFC (v0.3) tools43. We further applied the statistical fine-mapping method, dap-g (v1.0.0)44, to infer multiple independent casual cis-eQTLs of a gene in a tissue. The dap-g approach employed a Bayesian variable selection model, using a signal-level posterior inclusion probability (SPIP) to measure the strength of each association signal (SNPs in LD). We set a cutoff of 0.1 (i.e., SPIP > 0.9) as the inclusion threshold to detect representative/independent eQTLs for the target eGene. To analyze pairwise tissue similarity in QTLs, we calculated π1 statistics, defined as the proportion of true positive QTLs identified in first tissue (Discovery tissue) amongst all tested gene-variant pairs in second tissue (Validation tissue), using the Storey and Tibshirani qvalue approach, as described in13.
Meta-analysis of cis-eQTLs of muscle samples from three sub-species
Data from muscle samples were available from three sub-species: Bos indicus (n = 51), Bos taurus (n = 505), and their crosses (n = 108). To explore the similarity and variability of cis-eQTLs among sub-species, we conducted cis-eQTL mapping using muscle samples from each of the sub-species separately. We then conducted a meta-analysis to integrate cis-eQTL results from three sub-species using the METAL (v2020-05-05) tool45. We obtained Z-scores (the sum of weighted effect sizes) of SNPs from the meta-analysis. Weights were proportional to the square-root of the number of individuals in each sub-species45. We employed plink (v1.90)31 to test the SNP × breed interaction in muscle samples, and adjusted the p-values to FDR using Benjamini-Hochberg procedure. We took FDR < 0.05 as the significant threshold.
cis-sQTL mapping and tissue-sharing patterns
In each of the 23 distinct tissues, we applied a linear regression model, implemented in FastQTL42, to test for associations of genotypes within 1 Mb up- and down-stream of target intron clusters and their corresponding intron excision ratios. We used the first five genotype PCs to account for the effect of ancestry, and 10 PEER factors to adjust for the effect of unknown confounding variables. We applied the permutation pass mode (--permute 1000 10000) in FastQTL42 to obtain beta approximated permutation P values, followed by multiple test correction with the FDR method. We considered sQTL-intron pairs with FDR < 0.05 as significant, and defined sGene as genes containing a significant sQTL in any introns. We employed MashR (v0.2.57)46 to analyze tissue-sharing patterns of QTLs3, and considered the local false sign rate (LFSR) < 0.05 as significant.
trans-QTL mapping
We conducted trans-eQTLs for 15 tissues with at least 100 samples each. We filtered genomic variants using a more stringent threshold than cis-eQTL mapping to partially account for the reduction in statistical power. We obtained mappability of variants based on k-mer lengths of 36 and 75 following the procedure described in https://wiki.bits.vib.be/index.php/Create_a_mappability_track. Briefly, we calculated the mappability of variants with 36 and 75 k-mer based on ARS-UCD1.2 using a fast mapping based algorithm47, allowing for 2 mismatches. For each gene, we averaged the mappability across exons with 72 k-mer length and UTRs with 36 K-mer length. We excluded any variants within repeats (Repeatmasker and simple repeats), and further removed variants with mappability < 1, based on k-mer length of 75. After filtering, we kept SNPs with MAF > 0.05 and at least 10 minor alleles within each tissue for association testing.
We applied two methods to detect trans-eQTLs for protein-coding genes with an average mappability ≥ 0.8. Firstly, we associated the normalized expression of target genes with genotypes on other autosomal chromosomes using a linear regression model in MatrixQTL (v2.3)48, while adjusting for the same covariates as in cis-eQTL analysis. We further removed trans-eQTL-gene pairs that were cross-mappable to reduce false positives49. Secondly, we employed a linear mixed model (by fitting a polygenic effect with the genetic relationship matrix to further account for the complex relatedness among individuals) in the GCTA (v1.93.3beta)50 for trans-eQTL and trans-sQTL mapping. For both methods, we adjusted P-values for multiple testing using the Benjamini-Hochberg method to obtain FDR. We considered gene-variant pairs with FDR < 0.05 as significant. To conduct an internal validation of trans-eQTL mapping, we randomly and evenly divided blood and muscle samples into two groups. We conducted trans-eQTL mapping in the first group using the linear mixed model to detect significant trans-eQTL-gene pairs, and then repeated in the second group.
TWAS and Colocalization of cis-eQTLs and GWAS loci
To associate gene expression in a tissue with complex traits, we conducted a single-tissue TWAS analysis using S-PrediXcan (v0.6.1)51 by prioritizing GWAS summary statistics for 43 agronomic traits of economic importance in cattle (Supplementary Table 10), including reproduction (n = 11), production (milk-relevant; n = 6), body type (n = 17), and health (immune/metabolic-relevant; n = 9). For body conformation (type), reproduction, and production traits, we conducted a single-marker GWAS by fitting a linear mixed model in 27,214 U.S. Holstein bulls18. For health traits, we conducted GWAS using the same method in a subset (ranging from 11,880 for hypocalcemia to 24,699 for livability) of the 27,214 available bulls19. We constructed a Nested Cross Validated Elastic Net prediction model using genotype and expression data. We included sub-species, 10 PEER factors and corresponding genotype PCs in the model to adjust for unknown confounding variables and underlying population structure. For each trait, we conducted TWAS in each of the same 23 distinct tissues as in cis-eQTL mapping. We considered genes with Bonferroni-corrected P < 0.05 as significant. We visualized the Manhattan plots of P-values of all tested genes using ggplot2 (v3.3.2) in R (v3.4.1). In addition, we further employed S-MultiXcan (v0.6.1)52 to conduct multi-tissue TWAS analysis, and considered gene-trait pairs with Bonferroni threshold P < 4×10⁻⁶ (0.05/13,024) significant.
To detect the shared causal variants of gene expression and complex traits, we conducted a colocalization analysis of cis-eQTLs from 23 distinct tissues and GWAS loci of 43 agronomic traits using fastENLOC (v1.0)53. Briefly, we split the imputed GWAS summary statistics into approximately LD-independent regions, and each region was considered as a GWAS locus. The LD-independent regions were generated from genotypes of 886 Holstein animals from run7 of 1000 bull Genomes project, as the GWAS summary statistics were from the U.S. Holstein population. In each GWAS locus of a trait with suggestive significant SNPs (P < 10-5), we considered a gene with regional colocalization probability (rcp) > 0.5 as significant. We further conducted the colocalization analysis using Coloc (v5.1.0)54 with the function coloc.abf. We obtained posterior probability values for H4 case (PP.H4), i.e., both traits (GWAS trait and eQTLs) are associated and share a single causal variant. We kept the tissue-trait-gene triples with PP.H4 > 0.8 for downstream analysis.
Other downstream bioinformatics analysis
We used Genomic Association Tester (GATv1.3.4)55 1,000 permutations to estimate the functional enrichment of QTLs in particular genomic regions, e.g., chromatin states and methylation elements. We considered enrichments with FDR < 0.05 as significant. We used the R package, ClusterProfiler (v3.0.4)56, to annotate the function of genes based on the Gene Ontology database from Bioconductor (org.Bt.eg.db v3.11.4). We considered GO terms with FDR < 0.05 as significant.
Statistics & Reproducibility
No statistical method was used to predetermine sample size. We used all data passing standard quality controls, resulting in 7180 samples. For RNA-seq samples, we filtered out samples with clean read counts ≤ 500K or uniquely mapping rates < 60%, resulting in 7,180 samples. For genotypes, we filtered out SNPs with MAF < 0.05 or imputation dosage R-squared (DR2) < 0.8, resulting in 3,824,444 SNPs used for QTL mapping. For the QTL mapping in each tissue, we set an identity-by-state (IBS) distance cutoff of 0.85 to deem two samples as duplicates and kept one of them for analysis. The details of data exclusions are available in the Methods section. For all the boxplots, horizontal lines inside the boxes show the medians. Box bounds show the lower quartile (Q1, the 25th percentile) and the upper quartile (Q3, the 75th percentile). Whiskers are minima (Q1 - 1.5 × IQR) and maxima (Q3 + 1.5 × IQR), where IQR is the interquartile range (Q3-Q1). Outliers were not shown in the boxplots. The experiments were not randomized, as all the datasets are publicly available and from observational studies. The Investigators were not blinded to allocation during experiments and outcome assessment, as the data are not from controlled randomized studies.
Extended Data
Acknowledgements
This work was supported in part by AFRI grant numbers 2016-67015-24886, 2019-67015-29321, and 2021-67015-33409 from the USDA National Institute of Food and Agriculture (NIFA) Animal Genome and Reproduction Programs and BARD grant number US-4997-17 from the US-Israel Binational Agricultural Research and Development (BARD) Fund. L. Fang. was partially funded through HDR-UK award HDR-9004 and the Marie Skłodowska-Curie grant agreement No [801215]. A. Tenesa acknowledged funding from the BBSRC through programme grants BBS/E/D/10002070 and BBS/E/D/30002275, MRC research grant MR/P015514/1, and HDR-UK award HDR-9004. O. Canela-Xandri was supported by MR/R025851/1. R.X. was supported by Australian Research Council’s Discovery Projects (DP200100499). Y. Yu. was supported by the NSFC-PSF Joint Project (31961143009). L.M. was supported in part by AFRI grant numbers 2020-67015-31398 and 2021-67015-33409 from the USDA National Institute of Food and Agriculture (NIFA). G.E.L., B.D.R., and C.P.V.T. were supported by appropriated project 8042-31000-001-00-D, “Enhancing Genetic Merit of Ruminants Through Improved Genome Assembly, Annotation, and Selection” of the Agricultural Research Service (ARS) of the United States Department of Agriculture (USDA). C.-J.L. was supported by appropriated project 8042-31310-078-00-D, “Improving Feed Efficiency and Environmental Sustainability of Dairy Cattle through Genomics and Novel Technologies” of ARS-USDA. J.B.C. was supported by appropriated project 8042-31000-002-00-D, “Improving Dairy Animals by Increasing Accuracy of Genomic Prediction, Evaluating New Traits, and Redefining Selection Goals” of ARS-USDA. This research used resources provided by the SCINet project of the USDA ARS project number 0500-00093-001-00-D. Mention of trade names or commercial products in this article is solely for the purpose of providing specific information and does not imply recommendation or endorsement by the USDA. The USDA is an equal opportunity provider and employer. All the funders had no role in study design, data collection and analysis, decision to publish or preparation of the manuscript.
We thank US dairy producers for providing phenotypic, genomic, and pedigree data through the Council on Dairy Cattle Breeding under ARS-USDA Material Transfer Research Agreement 58-8042-8-007. Access to 1000 Bull Genomes Project data was provided under ARS-USDA Data Transfer Agreement 15443. International genetic evaluations were calculated by the International Bull Evaluation Service (Interbull; Uppsala, Sweden).
Footnotes
Author Contributions Statement
L.F., A.T. and G.E.L. conceived and designed the project. S.L., Y.G., O.C.-X., S.W., L.F., R.X., W.C., B.L., C.X., Y.Yao, Z.Y. and X.L., performed bioinformatic analyses. O.C.-X., L.F., Y.Yu, E.P.-C., K. D., K.R., C.L., A.J.C., P. N., D.R., B.D.R., C.P.V.T., P.M.V., S.Z., L.M., J.B.C., G.E.L. and A.T. contributed to the resource generation. S.L., L.F., Y.G., G.E.L. and A.T. wrote the manuscript. All authors read, edited and approved the final manuscript.
Competing Interests Statement
The authors declare no competing interests.
Contributor Information
Shuli Liu, Email: shuliliu1991@gmail.com, liushuli@westlake.edu.cn.
Yahui Gao, Email: gyhalvin@gmail.com.
Oriol Canela-Xandri, Email: Oriol.canela-xandri@igmm.ed.ac.uk.
Sheng Wang, Email: wangsheng@mail.kiz.ac.cn.
Ying Yu, Email: yuying@,cau.edu.cn.
Wentao Cai, Email: caiwentao@caas.cn.
Bingjie Li, Email: Bingjie.Li@sruc.ac.uk.
Ruidong Xiang, Email: ruidong.xiang@,unimelb.edu.au.
Amanda J. Chamberlain, Email: Amanda.Chamberlain@agriculture.vic.gov.au.
Erola Pairo-Castineira, Email: erola.pairo-castineira@igmm.ed.ac.uk.
Kenton D’Mellow, Email: Kenton.D’Mellow@,ed.ac.uk.
Konrad Rawlik, Email: Konrad.Rawlik@roslin.ed.ac.uk.
Charley Xia, Email: Xiachi.Xin@ed.ac.uk.
Yuelin Yao, Email: Y.Yao-38@sms.ed.ac.uk.
Pau Navarro, Email: Pau.Navarro@ed.ac.uk.
Dominique Rocha, Email: dominique.rocha@inrae.fr.
Xiujin Li, Email: lixiujin996@126.com.
Ze Yan, Email: zeyan.ms@gmail.com.
Congjun Li, Email: Congjun.Li@usda.gov.
Benjamin D. Rosen, Email: Ben.Rosen@usda.gov.
Curtis P. Van Tassell, Email: Curt.VanTassell@usda.gov.
Paul M. Vanraden, Email: Paul.Vanraden@usda.gov.
Li Ma, Email: lima@umd.edu.
John B. Cole, Email: john.b.cole@gmail.com.
George E. Liu, Email: George.Liu@usda.gov.
Albert Tenesa, Email: Albert.Tenesa@ed.ac.uk.
Lingzhao Fang, Email: Lingzhao.fang@igmm.ed.ac.uk.
Data Availability
All raw data analyzed in this study are publicly available for download without restrictions from SRA (https://www.ncbi.nlm.nih.gov/sra/) and BIGD (https://bigd.big.ac.cn/bioproject/) databases. Details of RNA-Seq, WGBS and WGS can be found in Supplementary Table 1, 2 and 15, respectively. All processed data, the full summary statistics of QTL mapping are available at https://cgtex.roslin.ed.ac.uk/.
Code Availability
All the computational scripts and codes for RNA-seq and DNA methylation data quantification, quality control, gene expression normalization, genotype imputation, QTL mapping, functional enrichment, TWAS and colocalization are available at both the web portal of CattleGTEx (https://cgtex.roslin.ed.ac.uk/) and the_github website (https://github.com/shuliliu/cattleGTEx. DOI: 10.5281/zenodo.6510550)57
References
- 1.Buniello A, et al. The NHGRI-EBI GWAS Catalog of published genome-wide association studies, targeted arrays and summary statistics 2019. Nucleic Acids Research. 2019;47:D1005–D1012. doi: 10.1093/nar/gky1120. [DOI] [PMC free article] [PubMed] [Google Scholar]
- 2.Hu ZL, Park CA, Reecy JM. Building a livestock genetic and genomic information knowledgebase through integrative developments of Animal QTLdb and CorrDB. Nucleic Acids Research. 2019;47:D701–D710. doi: 10.1093/nar/gky1084. [DOI] [PMC free article] [PubMed] [Google Scholar]
- 3.Consortium, G. T. The GTEx Consortium atlas of genetic regulatory effects across human tissues. Science. 2020;369:1318–1330. doi: 10.1126/science.aaz1776. [DOI] [PMC free article] [PubMed] [Google Scholar]
- 4.Fang L, et al. Comprehensive analyses of 723 transcriptomes enhance genetic and biological interpretations for complex traits in cattle. Genome Res. 2020;30:790–801. doi: 10.1101/gr.250704.119. [DOI] [PMC free article] [PubMed] [Google Scholar]
- 5.Xiang R, et al. Quantifying the contribution of sequence variants with regulatory and evolutionary significance to 34 bovine complex traits. Proc Natl Acad Sci U S A. 2019;116:19398–19408. doi: 10.1073/pnas.1904159116. [DOI] [PMC free article] [PubMed] [Google Scholar]
- 6.Prowse-Wilkins CP, et al. Putative Causal Variants Are Enriched in Annotated Functional Regions From Six Bovine Tissues. Front Genet. 2021;12:664379. doi: 10.3389/fgene.2021.664379. [DOI] [PMC free article] [PubMed] [Google Scholar]
- 7.Xiang R, et al. Genome variants associated with RNA splicing variations in bovine are extensively shared between tissues. BMC Genomics. 2018;19:521. doi: 10.1186/s12864-018-4902-8. [DOI] [PMC free article] [PubMed] [Google Scholar]
- 8.Cesar ASM, et al. Identification of putative regulatory regions and transcription factors associated with intramuscular fat content traits. BMC Genomics. 2018;19:499. doi: 10.1186/s12864-018-4871-y. [DOI] [PMC free article] [PubMed] [Google Scholar]
- 9.Littlejohn MD, et al. Sequence-based Association Analysis Reveals an MGST1 eQTL with Pleiotropic Effects on Bovine Milk Composition. Sci Rep. 2016;6:25376. doi: 10.1038/srep25376. [DOI] [PMC free article] [PubMed] [Google Scholar]
- 10.Hayes BJ, Daetwyler HD. 1000 Bull Genomes Project to Map Simple and Complex Genetic Traits in Cattle: Applications and Outcomes. Annu Rev Anim Biosci. 2019;7:89–102. doi: 10.1146/annurev-animal-020518-115024. [DOI] [PubMed] [Google Scholar]
- 11.Deelen P, et al. Calling genotypes from public RNA-sequencing data enables identification of genetic variants that affect gene-expression levels. Genome Med. 2015;7:30. doi: 10.1186/s13073-015-0152-4. [DOI] [PMC free article] [PubMed] [Google Scholar]
- 12.Hombach S, Kretz M. Non-coding RNAs: Classification, Biology and Functioning. Adv Exp Med Biol. 2016;937:3–17. doi: 10.1007/978-3-319-42059-2_1. [DOI] [PubMed] [Google Scholar]
- 13.Consortium, G.T. Human genomics. The Genotype-Tissue Expression (GTEx) pilot analysis: multitissue gene regulation in humans. Science. 2015;348:648–60. doi: 10.1126/science.1262110. [DOI] [PMC free article] [PubMed] [Google Scholar]
- 14.Tenesa A, et al. Estimation of linkage disequilibrium in a sample of the United Kingdom dairy cattle population using unphased genotypes. J Anim Sci. 2003;81:617–23. doi: 10.2527/2003.813617x. [DOI] [PubMed] [Google Scholar]
- 15.Fang L, et al. Functional annotation of the cattle genome through systematic discovery and characterization of chromatin states and butyrate-induced variations. BMC Biol. 2019;17:68. doi: 10.1186/s12915-019-0687-8. [DOI] [PMC free article] [PubMed] [Google Scholar]
- 16.Dixon JR, et al. Topological domains in mammalian genomes identified by analysis of chromatin interactions. Nature. 2012;485:376–80. doi: 10.1038/nature11082. [DOI] [PMC free article] [PubMed] [Google Scholar]
- 17.Rosen BD, et al. De novo assembly of the cattle reference genome with single-molecule sequencing. Gigascience. 2020;9 doi: 10.1093/gigascience/giaa021. [DOI] [PMC free article] [PubMed] [Google Scholar]
- 18.Jiang J, et al. Functional annotation and Bayesian fine-mapping reveals candidate genes for important agronomic traits in Holstein bulls. Commun Biol. 2019;2:212. doi: 10.1038/s42003-019-0454-y. [DOI] [PMC free article] [PubMed] [Google Scholar]
- 19.Freebern E, et al. GWAS and fine-mapping of livability and six disease traits in Holstein cattle. BMC Genomics. 2020;21:41. doi: 10.1186/s12864-020-6461-z. [DOI] [PMC free article] [PubMed] [Google Scholar]
- 20.Fang L, et al. Genetic and epigenetic architecture of paternal origin contribute to gestation length in cattle. Commun Biol. 2019;2:100. doi: 10.1038/s42003-019-0341-6. [DOI] [PMC free article] [PubMed] [Google Scholar]
- 21.Gao Y, et al. Single-cell transcriptomic analyses of dairy cattle ruminal epithelial cells during weaning. Genomics. 2021;113:2045–2055. doi: 10.1016/j.ygeno.2021.04.039. [DOI] [PubMed] [Google Scholar]
- 22.Kim-Hellmuth S, et al. Cell type-specific genetic regulation of gene expression across human tissues. Science. 2020;369 doi: 10.1126/science.aaz8528. [DOI] [PMC free article] [PubMed] [Google Scholar]
- 23.Clark EL, et al. From FAANG to fork: application of highly annotated genomes to improve farmed animal production. Genome Biology. 2020;21 doi: 10.1186/s13059-020-02197-8. [DOI] [PMC free article] [PubMed] [Google Scholar]
- 24.Xiang RD, et al. Genome-wide fine-mapping identifies pleiotropic and functional variants that predict many traits across global cattle populations. Nature Communications. 2021;12 doi: 10.1038/s41467-021-21001-0. [DOI] [PMC free article] [PubMed] [Google Scholar]
- 25.Bolger AM, Lohse M, Usadel B. Trimmomatic: a flexible trimmer for Illumina sequence data. Bioinformatics. 2014;30:2114–20. doi: 10.1093/bioinformatics/btu170. [DOI] [PMC free article] [PubMed] [Google Scholar]
- 26.Pertea M, Kim D, Pertea GM, Leek JT, Salzberg SL. Transcript-level expression analysis of RNA-seq experiments with HISAT, StringTie and Ballgown. Nat Protoc. 2016;11:1650–67. doi: 10.1038/nprot.2016.095. [DOI] [PMC free article] [PubMed] [Google Scholar]
- 27.Liao Y, Smyth GK, Shi W. featureCounts: an efficient general purpose program for assigning sequence reads to genomic features. Bioinformatics. 2014;30:923–30. doi: 10.1093/bioinformatics/btt656. [DOI] [PubMed] [Google Scholar]
- 28.Li YI, et al. Annotation-free quantification of RNA splicing using LeafCutter. Nat Genet. 2018;50:151–158. doi: 10.1038/s41588-017-0004-9. [DOI] [PMC free article] [PubMed] [Google Scholar]
- 29.Van der Auwera GA, et al. From FastQ data to high confidence variant calls: the Genome Analysis Toolkit best practices pipeline. Curr Protoc Bioinformatics. 2013;43:11 10 1-11 10 33. doi: 10.1002/0471250953.bi1110s43. [DOI] [PMC free article] [PubMed] [Google Scholar]
- 30.Browning BL, Zhou Y, Browning SR. A One-Penny Imputed Genome from Next-Generation Reference Panels. Am J Hum Genet. 2018;103:338–348. doi: 10.1016/j.ajhg.2018.07.015. [DOI] [PMC free article] [PubMed] [Google Scholar]
- 31.Chang CC, et al. Second-generation PLINK: rising to the challenge of larger and richer datasets. Gigascience. 2015;4:7. doi: 10.1186/s13742-015-0047-8. [DOI] [PMC free article] [PubMed] [Google Scholar]
- 32.Patterson N, Price AL, Reich D. Population structure and eigenanalysis. PLoS Genet. 2006;2:e190. doi: 10.1371/journal.pgen.0020190. [DOI] [PMC free article] [PubMed] [Google Scholar]
- 33.Castel SE, Mohammadi P, Chung WK, Shen Y, Lappalainen T. Rare variant phasing and haplotypic expression from RNA sequencing with phASER. Nat Commun. 2016;7:12817. doi: 10.1038/ncomms12817. [DOI] [PMC free article] [PubMed] [Google Scholar]
- 34.Krueger F, Andrews SR. Bismark: a flexible aligner and methylation caller for Bisulfite-Seq applications. Bioinformatics. 2011;27:1571–2. doi: 10.1093/bioinformatics/btr167. [DOI] [PMC free article] [PubMed] [Google Scholar]
- 35.Li H, Durbin R. Fast and accurate short read alignment with Burrows-Wheeler transform. Bioinformatics. 2009;25:1754–1760. doi: 10.1093/bioinformatics/btp324. [DOI] [PMC free article] [PubMed] [Google Scholar]
- 36.Ramirez F, et al. High-resolution TADs reveal DNA sequences underlying genome organization in flies. Nat Commun. 2018;9:189. doi: 10.1038/s41467-017-02525-w. [DOI] [PMC free article] [PubMed] [Google Scholar]
- 37.Servant N, et al. HiC-Pro: an optimized and flexible pipeline for Hi-C data processing. Genome Biol. 2015;16:259. doi: 10.1186/s13059-015-0831-x. [DOI] [PMC free article] [PubMed] [Google Scholar]
- 38.Langmead B, Salzberg SL. Fast gapped-read alignment with Bowtie 2. Nat Methods. 2012;9:357–9. doi: 10.1038/nmeth.1923. [DOI] [PMC free article] [PubMed] [Google Scholar]
- 39.Song Q, et al. A reference methylome database and analysis pipeline to facilitate integrative and comparative epigenomics. PLoS One. 2013;8:e81148. doi: 10.1371/journal.pone.0081148. [DOI] [PMC free article] [PubMed] [Google Scholar]
- 40.Liu H, et al. Systematic identification and annotation of human methylation marks based on bisulfite sequencing methylomes reveals distinct roles of cell type-specific hypomethylation in the regulation of cell identity genes. Nucleic Acids Res. 2016;44:75–94. doi: 10.1093/nar/gkv1332. [DOI] [PMC free article] [PubMed] [Google Scholar]
- 41.Stegle O, Parts L, Piipari M, Winn J, Durbin R. Using probabilistic estimation of expression residuals (PEER) to obtain increased power and interpretability of gene expression analyses. Nat Protoc. 2012;7:500–7. doi: 10.1038/nprot.2011.457. [DOI] [PMC free article] [PubMed] [Google Scholar]
- 42.Ongen H, Buil A, Brown AA, Dermitzakis ET, Delaneau O. Fast and efficient QTL mapper for thousands of molecular phenotypes. Bioinformatics. 2016;32:1479–85. doi: 10.1093/bioinformatics/btv722. [DOI] [PMC free article] [PubMed] [Google Scholar]
- 43.Mohammadi P, Castel SE, Brown AA, Lappalainen T. Quantifying the regulatory effect size of cis-acting genetic variation using allelic fold change. Genome Res. 2017;27:1872–1884. doi: 10.1101/gr.216747.116. [DOI] [PMC free article] [PubMed] [Google Scholar]
- 44.Wen X, Lee Y, Luca F, Pique-Regi R. Efficient Integrative Multi-SNP Association Analysis via Deterministic Approximation of Posteriors. Am J Hum Genet. 2016;98:1114–1129. doi: 10.1016/j.ajhg.2016.03.029. [DOI] [PMC free article] [PubMed] [Google Scholar]
- 45.Willer CJ, Li Y, Abecasis GR. METAL: fast and efficient meta-analysis of genomewide association scans. Bioinformatics. 2010;26:2190–1. doi: 10.1093/bioinformatics/btq340. [DOI] [PMC free article] [PubMed] [Google Scholar]
- 46.Urbut SM, Wang G, Carbonetto P, Stephens M. Flexible statistical methods for estimating and testing effects in genomic studies with multiple conditions. Nat Genet. 2019;51:187–195. doi: 10.1038/s41588-018-0268-8. [DOI] [PMC free article] [PubMed] [Google Scholar]
- 47.Derrien T, et al. Fast computation and applications of genome mappability. PLoS One. 2012;7:e30377. doi: 10.1371/journal.pone.0030377. [DOI] [PMC free article] [PubMed] [Google Scholar]
- 48.Shabalin AA. Matrix eQTL: ultra fast eQTL analysis via large matrix operations. Bioinformatics. 2012;28:1353–8. doi: 10.1093/bioinformatics/bts163. [DOI] [PMC free article] [PubMed] [Google Scholar]
- 49.Saha A, Battle A. False positives in trans-eQTL and co-expression analyses arising from RNA-sequencing alignment errors. F1000Res. 2018;7:1860. doi: 10.12688/f1000research.17145.1. [DOI] [PMC free article] [PubMed] [Google Scholar]
- 50.Yang J, Zaitlen NA, Goddard ME, Visscher PM, Price AL. Advantages and pitfalls in the application of mixed-model association methods. Nat Genet. 2014;46:100–6. doi: 10.1038/ng.2876. [DOI] [PMC free article] [PubMed] [Google Scholar]
- 51.Barbeira AN, et al. Exploring the phenotypic consequences of tissue specific gene expression variation inferred from GWAS summary statistics. Nat Commun. 2018;9:1825. doi: 10.1038/s41467-018-03621-1. [DOI] [PMC free article] [PubMed] [Google Scholar]
- 52.Barbeira AN, et al. Integrating predicted transcriptome from multiple tissues improves association detection. PLoS Genet. 2019;15:e1007889. doi: 10.1371/journal.pgen.1007889. [DOI] [PMC free article] [PubMed] [Google Scholar]
- 53.Wen X, Pique-Regi R, Luca F. Integrating molecular QTL data into genome-wide genetic association analysis: Probabilistic assessment of enrichment and colocalization. PLoS Genet. 2017;13:e1006646. doi: 10.1371/journal.pgen.1006646. [DOI] [PMC free article] [PubMed] [Google Scholar]
- 54.Giambartolomei C, et al. Bayesian test for colocalisation between pairs of genetic association studies using summary statistics. PLoS Genet. 2014;10:e1004383. doi: 10.1371/journal.pgen.1004383. [DOI] [PMC free article] [PubMed] [Google Scholar]
- 55.Heger A, Webber C, Goodson M, Ponting CP, Lunter G. GAT: a simulation framework for testing the association of genomic intervals. Bioinformatics. 2013;29:2046–8. doi: 10.1093/bioinformatics/btt343. [DOI] [PMC free article] [PubMed] [Google Scholar]
- 56.Yu G, Wang LG, Han Y, He QY. clusterProfiler: an R package for comparing biological themes among gene clusters. OMICS. 2012;16:284–7. doi: 10.1089/omi.2011.0118. [DOI] [PMC free article] [PubMed] [Google Scholar]
- 57.Liu S, et al. A multi-tissue atlas of regulatory variants in cattle. doi: 10.5281/zenodo.6510550. Code resource at github website. https://github.com/shuliliu/cattleGTEx https://zenodo.org/record/6510550#.Ym-j8NrMKUk. [DOI] [PMC free article] [PubMed] [Google Scholar]
Associated Data
This section collects any data citations, data availability statements, or supplementary materials included in this article.
Data Availability Statement
All raw data analyzed in this study are publicly available for download without restrictions from SRA (https://www.ncbi.nlm.nih.gov/sra/) and BIGD (https://bigd.big.ac.cn/bioproject/) databases. Details of RNA-Seq, WGBS and WGS can be found in Supplementary Table 1, 2 and 15, respectively. All processed data, the full summary statistics of QTL mapping are available at https://cgtex.roslin.ed.ac.uk/.
All the computational scripts and codes for RNA-seq and DNA methylation data quantification, quality control, gene expression normalization, genotype imputation, QTL mapping, functional enrichment, TWAS and colocalization are available at both the web portal of CattleGTEx (https://cgtex.roslin.ed.ac.uk/) and the_github website (https://github.com/shuliliu/cattleGTEx. DOI: 10.5281/zenodo.6510550)57


