Abstract
Purpose
The use of electromagnetic (EM) modeling is critical for specific absorption rate (SAR) characterization in parallel transmission MRI. Radiofrequency arrays that include decoupling networks can be difficult to characterize accurately in simulation. A practical method of simplifying modeling is to exclude the decoupling networks and model each transmit element in isolation. Results from this type of model can be related to a real device by applying “active decoupling” to the real device to suppress residual coupling when in use. Here, we compare this approach with a full model that includes decoupling networks.
Methods
EM simulations for a variety of adult male voxel models placed within an eight-channel transverse electromagnetic (TEM) array tuned for 3 Tesla operation were run with and without decoupling networks included. The resulting EM fields and SAR estimates were compared using basic normalization, and simulated active decoupling.
Results
Modeling the transmit elements independently leads to variations which have significantly different SAR estimates of ~20% on average compared with the full model if not normalized appropriately. After “active decoupling,” SAR was still generally seen to be overestimated by ~7% with independent channel modeling; despite having similar B1+ field distributions.
Conclusion
Modeling transmission elements independently may lead to substantially incorrect SAR estimates if the corresponding MRI system is not run in an analogous manner. Magn Reson Med 74:1423-1434, 2015. © 2014 Wiley Periodicals, Inc.
Keywords: SAR, modeling, parallel transmission
Introduction
Parallel transmission MRI, in which there are multiple independently driven transmit elements that together generate radiofrequency (RF) electromagnetic (EM) fields, provides new degrees of freedom to both tailor the RF to the subject and to create fields that can be both spatially and temporally varying during a sequence or during individual pulses (1–3). As for any RF transmit system to be used for MRI, the correct characterization of specific absorption rate (SAR) is paramount to ensuring appropriate safety margins are maintained (4,5). In this regard, parallel transmission is both a cause for concern and an opportunity–the user has spatial control over RF electric fields, and this can lead to elevated SAR–but careful optimization can also lead to configurations in which whole body and in particular maximum local SAR are reduced (1,6). Prior knowledge of the E-field is however required to achieve this, and direct in vivo measurement is not currently possible using MRI. Some groups have made progress on inferring electric fields and SAR (7,8) from measurements of the RF magnetic field (B1) but these methods are not yet efficient or accurate enough for practical use. Instead the most common approach is to simulate the RF coil and subject–in the form of a voxelized digital model–using EM field solver software. Effective modeling of a system can enable accurate characterization of SAR for a given configuration.
Small inaccuracies in the simulation (particularly material properties) mean that if the coil model is constructed using lumped components whose impedance values are taken directly from those in the physical device, the simulated and physical behaviors generally do not match. As a result, lumped element impedances in the model must be altered, typically by adjusting them iteratively. This process is time consuming if full EM field simulations are required at each iteration and is especially troublesome if the simulated coil includes decoupling networks because these contain multiple components to adjust, whose properties affect the responses of multiple transmit elements. A practical solution is to model the individual transmit elements independently without including any decoupling networks (9–11), leading to a system model with “idealized decoupling” in which all elements but one are detuned by removing their lumped capacitors. This is relatively simple to implement because each transmission element can then be tuned and matched independently; however, the coupling present in the real system is not represented. To use these simulations in practice, the model and real device must be reconciled. This can be achieved by estimating the coupling present and applying it to the idealized model, or by adapting the device itself to approximate the idealized situation as closely as possible. The latter is referred to as “active decoupling” (12–14) and can be achieved by measuring residual coupling, and then driving linear combinations of transmit channels so as to produce a response emulating the behavior of the coil if no coupling was present between elements. Pickup coils have been used for measurement of residual coupling (13), but the method is not limited to this exclusively.
Iterative tuning of EM models can be made much more efficient by using circuit co-simulation (15). In this approach, the behavior of the system is first calculated at each lumped element location from multiple full EM simulations. Once characterized in this way, the system behavior for any arbitrary set of component impedances can be calculated without having to run any further simulations. This approach enables complex models to be tuned using numerical optimization, with computation time per iteration on the order of milliseconds rather than days. In this way, a coil with extensive decoupling networks can still be modeled in full, obviating the need for taking an “idealized” approach. A previous study performed by another group used circuit simulation to investigate the effects of tuning condition, head size and position on SAR of a 9.4T array (16). In this work, we consider the specific example of an 8-channel body coil at 3T, and compare SAR predictions in several different voxel models (9) from “Full Coil Model” simulations generated using circuit co-simulation with “Idealized Coil Model” simulations for the same models generated by excluding decoupling networks and treating each coil element in isolation. To make a direct comparison, the role of active decoupling was also simulated using two different approaches to model how this process may occur in the real world–directly fitting the B1+ fields in the isocenter of the models and simulating pickup coils near each transmit element.
Methods
The system modeled was a 3 Tesla (T) Philips Achieva MRI scanner fitted with an eight-channel body transmit coil as described in Vernickel et al (12). Simulations were performed using the time domain Finite Integration Technique of CST Microwave Studio (CST AG, Darmstadt, Germany) with a 47 ns Gaussian pulse used for excitation and –50 dB energy decay used for the convergence criterion of the 3D EM simulation (17–19). Simulations were run in a frequency range from 50 to 200 MHz. All other calculations were performed in MATLAB (MathWorks, Natick, MA). All conductive elements were modeled as lossy Copper metal with a conductivity of 5.8 × 10⁷ Sm−1.
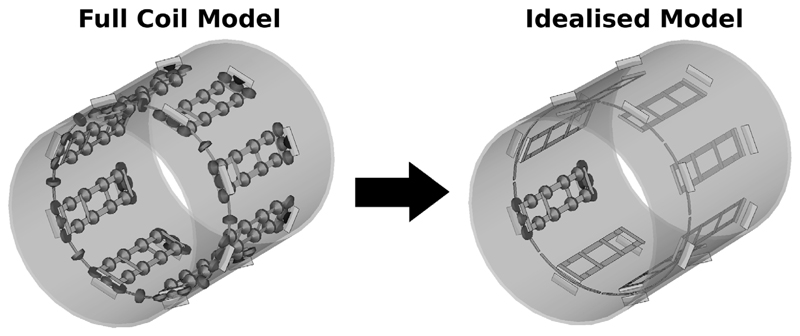
The simulation was run with all lumped elements modeled as 50 Ω S-parameter ports as shown on the left side of Figure 1. By using circuit co-simulation (15) (as detailed below), the results of this simulation could be used to model the behavior of the coil for any lumped element impedance values, including removing them by setting a very large impedance. The full coil model has 128 ports of which 120 represent lumped capacitors, with 13 per channel and 16 in the “decoupling ring” structure (see Figure 1). Replacing all lumped elements with ports was also found to speed up the simulations in practice by making the coil non resonant, and, therefore, converge to a steady state for each port excitation far more quickly within the simulation (18).
FIG. 1.
Schematic of the eight-channel TEM transmit coil. The ring structure at the closer end of the device is used for improving decoupling. The Full Coil Model (left) and Idealized Coil Model (right) differ in that the former includes all lumped capacitors and the latter excludes all those from channels other than the one under consideration. In practice these capacitors can be removed using circuit co-simulation by setting their associated ports in the Full Coil Model to be open circuit (i.e., by assigning a vanishingly small capacitance) (27).
Circuit Co-Simulation
Circuit co-simulation has been covered by Kozlov and Turner (15) and others (20,21) and is available in commercial software packages. The method can also be implemented directly in a straightforward manner; in this work it was implemented in MATLAB so that it could be combined with MATLAB’s optimization procedures, a description of the steps used is provided here for clarity.
The full 3D EM simulation yields fields and S-parameters (22) for all 128 ports in the coil model: to perform the circuit calculation we must relate these S-parameters–and eventually the measured fields–to those expected for the ports that are actually driven, when a set of defined impedances are placed across the ports corresponding to lumped elements. Starting with the standard definition of a matrix S operating on an incident wave a (22) producing a reflected wave b,
| [1] |
we may subdivide this relationship into terms that correspond to the actual physical ports of the system and those that correspond to lumped elements (in our case, all capacitors) (20):
| [2] |
where there are np driven ports and nl lumped element ports (for our model, np=8, nl=120). The vectors are arbitrarily ordered such that the physical ports occupy indices 1 to np (compactly referred to by means of subscript “ports”) and the lumped element ports occupy indices (np+1) to (np+nl) (referred to by means of subscript “lumped”). A further relation for the lumped element ports is obtained:
| [3] |
Σ is another scattering matrix, but the definitions of incident and scattered waves are reversed here because the reflected wave from each port becomes the incident wave on the lumped element with which the port is terminated (21). Unlike S, Σ is not obtained from calculations made in the original EM simulation, but instead is produced by transformation of the Z-matrix (22) of the lumped elements that are to replace the relevant ports:
| [4] |
where I is a size nl × nl identity matrix and y is the characteristic admittance 1/Z0 of each port where Z0 is 50 Ω in our case.
By assuming that the lumped elements are completely isolated from one another, entries of Z in a system in which all lumped elements are capacitors (as in our case) are defined as:
| [5] |
where Cn is the value of the nth capacitor with arbitrary numerical index n and R is a small (i.e., < 1 Ω) series resistance added to reflect both losses within the capacitors themselves and losses in the conductors. This approach has been used by others (23,24) in recognition of the fact that skin effects and other losses are not accurately captured by discretized EM solvers. The value of R was set empirically by comparing simulation with experimental measurements.
These relations can now be combined to give the np x np physical S-matrix Sphys that would be measured in reality at the driven ports:
| [6] |
The relations above (Eqs. [1–6]) are written for a single frequency; as we used a broadband simulation, they were applied to all frequencies in the original range. With this framework it was possible to perform a numerical optimization to find ideal lumped element values to tune, match and decouple the system.
Tuning and Matching
Tuning and matching were performed with the NORMAN male voxel model (25) placed inside the coil in a heart-centered configuration. The physical S-matrix was constructed using the relation detailed in Eq. [6] and appropriate capacitor values were obtained by minimizing:
| [7] |
where superscript ω0 indicates that the optimization only considered the desired resonant frequency ω0 (128 MHz at 3T). The indices of the np × np matrix Sphys, i and j, relate to the individual transmit channels. Parameter λ was used to adjust the relative weighting of coil matching (Sphysi=j) and worst case coupling between transmission elements (max(Sphysi≠j)). The cost function has many local minima; to adequately search the solution space, we used the global optimization algorithm SOMA (26) (Self-Organizing Migrating Algorithm) run with bounds on the capacitor values based on those indicated in (12). Once a suitable local minimum was identified, results were refined using an unconstrained nonlinear optimization (MATLAB’s fminsearch function). λ was manually adjusted in both optimization steps until a suitable solution was found–this was defined as having all elements tuned to 128 MHz, with matching and decoupling of all elements better than –15 dB. Measured S-parameters of the physical coil can be found in ref. [12). The final model with these optimized capacitor values is known as the Full Coil Model (FCM).
Once suitable capacitor values were determined, the relevant fields were generated by first inferring the power waves present at each lumped element port when each driven port is excited:
| [8] |
Here aports is a vector of length np with unit amplitude for the driving port under consideration and zeros elsewhere. Once the full vector a was constructed it was then used to calculate the combined E and B fields from the fields generated by every port excitation (Bk and Ek for port with index k):
| [9] |
Idealized Coil Model
Starting from the results of the same EM simulation, the fields produced by a single “ideally decoupled” transmit element were modeled (Fig. 1) by setting all capacitors in other transmit elements to values of ~10−50 F (27) (effectively making them open circuit). Each transmit element was then tuned independently using a combined optimization over several voxel models to find relevant capacitor values–this was done to ensure that the matching for any given model was not overly ideal and hence unrealistic. The results are equivalent to running a full simulation with those capacitors simply deleted from the model as in (9) to produce the “Idealized Coil Model” (ICM) (Figure 1, right hand side).
Voxel Model Simulations
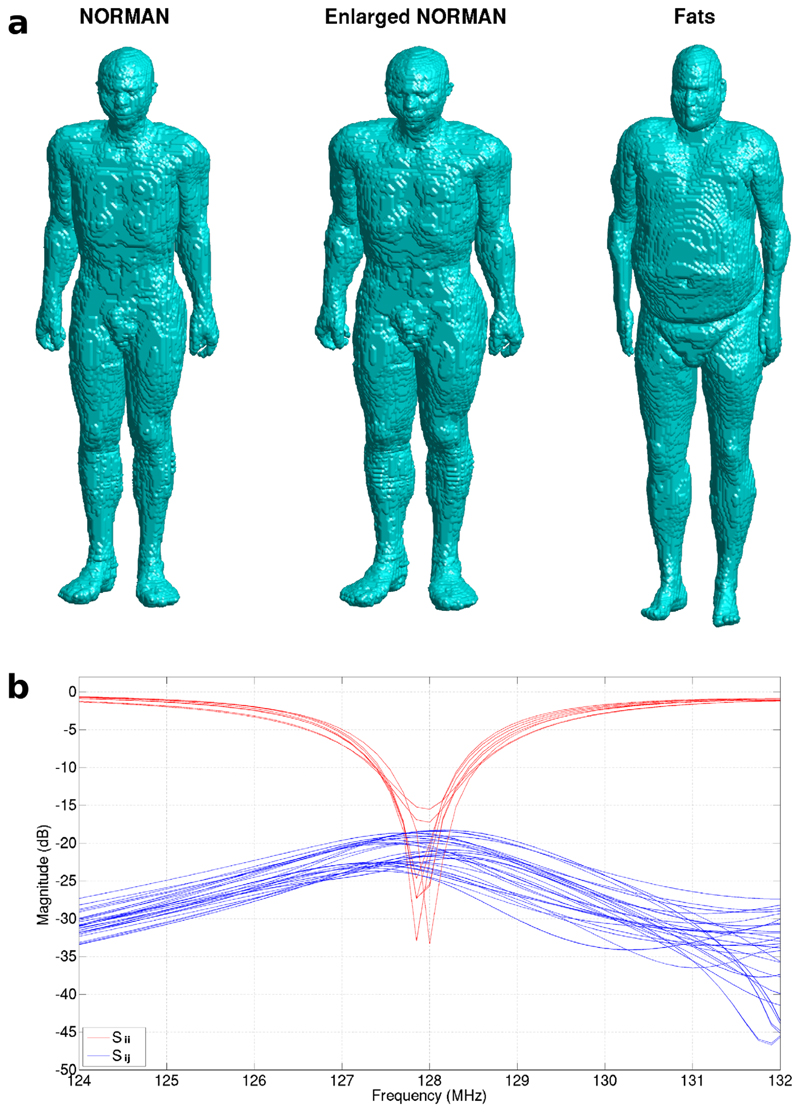
Simulations using both decoupling regimes were run using an enlarged version of the NORMAN voxel model (28), the virtual population Fats (29) male voxel model and the conventional NORMAN model as shown in Figure 2a. All models were positioned heart-centered within the coil; an additional simulation was run with the NORMAN model in a head-centered configuration.
FIG. 2.
a: Voxel models used in simulation shown on same scale with BMI of 23.5 for NORMAN, 34.0 for Enlarged NORMAN and 36.1 for Fats. b: S-parameters for the Full Coil Model when loaded with the NORMAN voxel model, heart centered. Plot shows matching and decoupling equivalent to the physical coil (Sii < – 15 dB and Sij < – 18 dB at 128 MHz).
The fields were extracted from the simulation software on the calculation mesh (an irregular grid with ~5 mm resolution on average–ranging between 0.5 and 5.2 mm with a very fine grid in regions including electrical components and coarser grid in regions with homogenous materials) and the field distributions recovered using Eqs. [8 and 9]. All SAR calculations were performed on the same grid with local 10 g averaged Q-matrices (13) calculated for both sets of electric fields–the idealized and full coil model–for each voxel model. The 10 g averaging was performing using an in-house algorithm which conforms to the IEEE C95.3 standard (30). The averaged Q-matrices were then condensed down into a much smaller set of Virtual Observation Points (31) (VOPs) with a 1% overestimate bound for SAR comparison. An average compression factor of 2700 was achieved across all the simulations. Using these VOPs, maximum local SAR estimates were calculated for a set of 10,000 random, complex drive settings all with a unit norm.
Field Normalization & Active Decoupling
All simulations (both ICM and FCM; all voxel models) were first normalized such that the RF transmit field (B1+) when each transmit channel is driven independently had mean amplitude 1 μT and mean phase of 0° in a central region of interest (5 cm2) on a slice at isocenter. This is referred to as “quadrature” normalization because the contributions from each coil were in-phase at the center of the subject.
As mentioned in the introduction, if an ideally decoupled simulation has been performed then one way of relating this to a real scenario is to use “active decoupling” (12,13) on the physical system, in which the physical channels are combined so as to further suppress the effects of the channels which are not being driven. To allow rigorous comparison of the modeling approaches, the full coil model was subjected to active decoupling; in this way the FCM with active decoupling acts as a surrogate for a physical system with which the ICM can be compared. The efficacy of active decoupling depends on the decoupling matrix used, so in this work two methods were tested. The first was to fit the B1+ fields from the FCM in the central transverse slice of each voxel model (excluding regions outside the body) to their ICM counterparts using a least squares fit. This method allows a close as possible match for one set of simulation results to the other but is not feasible for a practical active decoupling implementation.
In practice pickup coils located near each transmit coil can be used to measure residual coupling (12–14). The coil being modeled is made up of transverse electromagnetic (TEM) elements (12) which generate primarily azi-muthally orientated magnetic fields between each element and the shield; local pickup coil measurements were simulated by sampling the azimuthal B-field, Bφ = Bxsin(φ) + Bycos(φ) in these regions. The simulated pickup coil measurements were collected into matrices of the form:
| [10] |
containing the mean of Bφi produced by the ith coil in a region of interest Rj near the jth coil. Matrices MICM and MFCM were produced for the idealized and full coil models respectively. The pickup coil actively decoupled FCM was created by applying decoupling matrix diag{MICM}MFCM−1 to the FCM. The term diag{MICM} renormalizes the actively decoupled fields to give the same “pickup coil readings” as those from the ICM, making the closest possible match.
In Table 1, we list abbreviations used in this work when referring to the different voxel models and normalization methods in figures contained in the study.
Table 1. Abbreviations Used for Different Voxel Models and Different Simu-lation Methods.
| Name | Abbreviation | |
|---|---|---|
| Voxel model | NORMAN Head-Centered | NHeC |
| NORMAN Heart-Centered | NHC | |
| Enlarged NORMAN Heart-Centered | LNHC | |
| Fats Heart-Centered | FHC | |
| Simulation method | Idealised Coil Model | ICM |
| Full Coil Model | FCM | |
| Full Coil Model actively decoupled by fitting | FCM:AD/f | |
| Full Coil Model actively decoupled by pickup coils | FCM:AD/puc |
Results
Decoupling of < – 18 dB and matching of < – 15 dB were achieved in the Full Coil Model, as can be seen in Figure 2b for the heart centered NORMAN model. The two coils with poorer matching are those closest to the arms of the voxel model leading to stronger loading. Better matching could be achieved but this does not reflect the behavior of the true coil and would lead to an overly idealized situation in which the coil is perfectly tuned for just one scenario but does not behave correctly with different loads. These S-parameters are similar to those measured in the physical coil when loaded (see Figure 5 in Ver-nickel et al) (12).
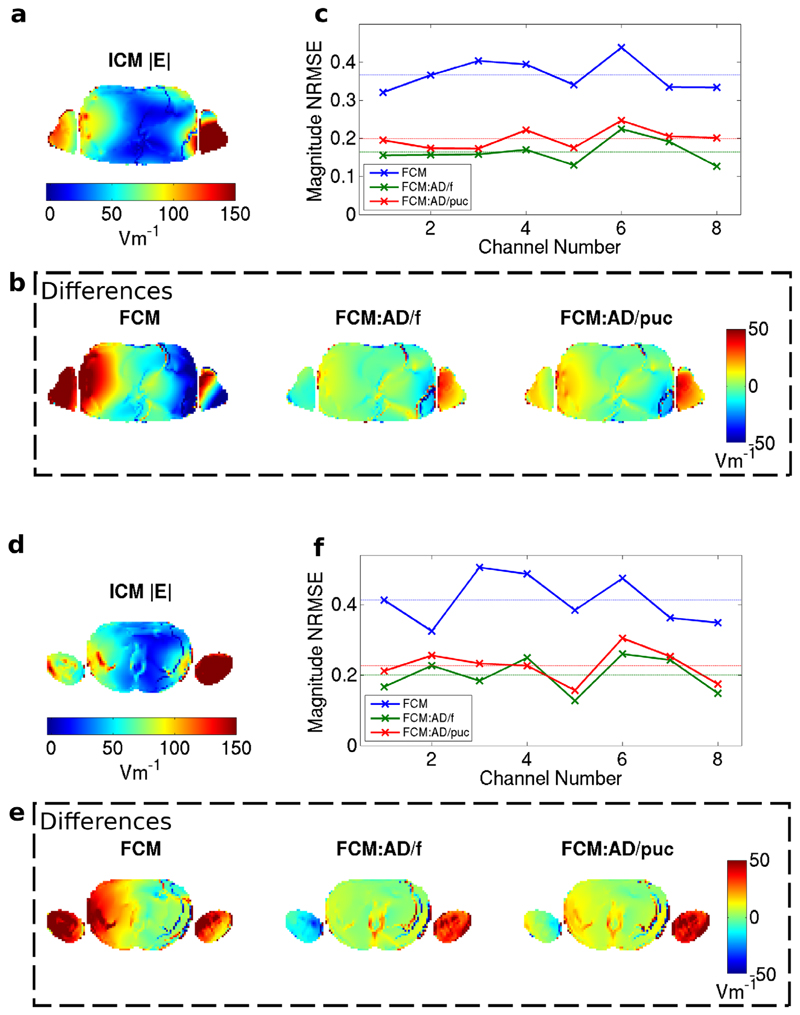
FIG. 5.
Magnitude of E-field in the body of the NORMAN heart centered model for channel 2 shown in an axial slice through the cardiac region for the Idealized Coil Model (a). b: Differences from ICM when using FCM with quadrature normalization, active decoupling by fitting and active decoupling by pickup coils. c: Normalized RMS difference in |E| between FCM and ICM for the eight channels; the dashed lines correspond to averages over all channels. Stronger deviations are seen here compared with the B1+ fields for the same slice. d–f: As parts (a–c) but for a different axial slice in the NORMAN heart centered model–a slice that was not used to calculation the normalization matrices. Larger differences between the Idealized Coil Model and the Full Coil Model exist in this slice.
Figures 3 and 4 show B1+ fields for the heart-centered NORMAN model when just one of the transmit coils (marked in red) is driven in the case of the full and idealized models and with active decoupling to try to match the former to the latter. The full coil model without active decoupling has residual coupling between channels, particularly nearest neighbors (Fig. 3a), which is not present at all in the idealized coil model (Fig. 3b); as expected the other elements are not even visible in the simulated fields from the ICM. If active decoupling is applied then agreement improves, particularly when using simulated pickup coils, in which case B1+ fields from all but the nearest neighbors of the active coil are suppressed (Fig. 3d). Fitting of B1+ within the voxel model results in some residual coupling to more distant elements (Fig. 3c).
FIG. 3.
a–d: B1+ field magnitudes over the entire coil region for the NORMAN heart centered model in an axial slice through the cardiac region. Relative location of coils is shown outside region with active coil highlighted in red; the outline of the voxel model is plotted in white. The fields from the Full Coil Model are shown alongside those from the Idealized Model and the Full Coil Model with the two different active decoupling methods (by fitting and by simulated coils). Active Decoupling with pickup coils offers the best suppression of alternate transmit channels.
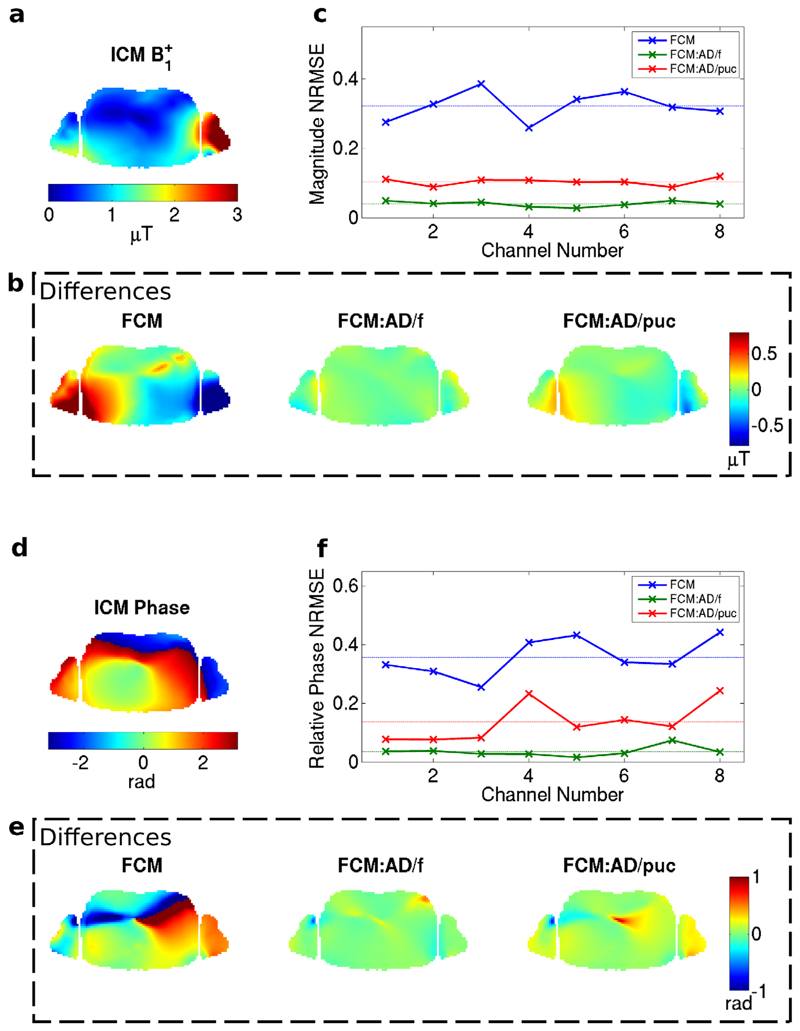
FIG. 4.
B1+ magnitude in axial slice through the cardiac region of the NORMAN heart centered model (channel 2 shown). a: Idealized Coil Model. b: Differences from ICM when using FCM with quadrature normalization, active decoupling by fitting and active decoupling by pickup coils. c: Normalized RMS difference in B1+ between FCM and ICM for the eight channels; the dashed lines correspond to averages over all channels. d–f: As parts (a–c) for phase of B1+.
Figure 4 shows the B1+ field for the same coil element as shown in Figure 3, masked within the voxel model only, along with the differences between the ICM and various versions of the FCM for an axial slice through the cardiac region in the NORMAN heart-centered model. Significant differences in magnitude and phase are apparent when comparing the FCM with the ICM directly. Active decoupling leads to closer agreement with the idealized model; as expected, agreement within the subject is best when fitting B1+ directly in which case errors are <5%. Active decoupling with pickup coils shows better agreement than quadrature normalization but does not perform as well as active decoupling by fitting.
The corresponding comparisons for the electric fields show greater differences between the three FCM versions (Figs. 5a–c). Although most of the differences in fields from the fitted model are still relatively small, fairly strong variations can be seen in the voxel models’ arms where the transmit elements are loaded more strongly, and this leads to greater errors in general. These deviations in the electric field will lead to differences in SAR estimates between the two simulation methods. Furthermore, the electric fields in a different slice show stronger differences (Figs. 5d–f). This is important because SAR must be evaluated throughout the body, not just within the targeted imaging slice(s), in this case one slice at isocenter.
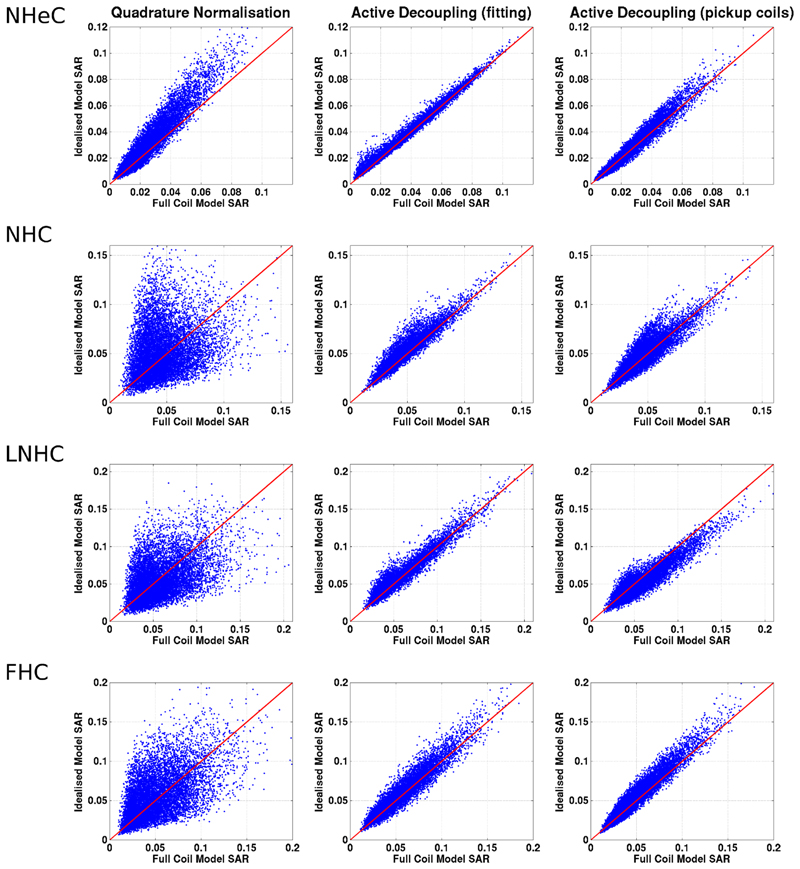
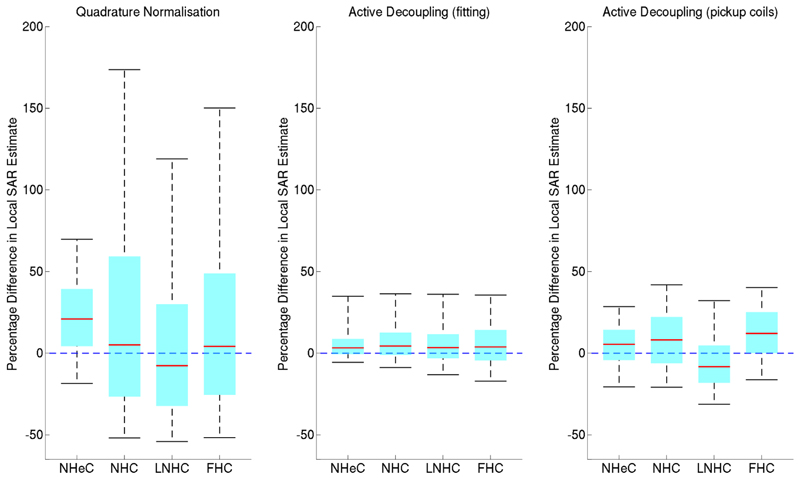
The local SAR estimates from ICM and FCM (calculated from VOP compressed versions of the models) are plotted against each other in Figure 6; in this context the SAR values from the FCM are regarded as being true. The ICM leads to errors of varying degrees depending on the decoupling scheme applied. These differences are summarized by boxplots in Figure 7. It is clear that the plain “quadrature” normalized FCM leads to the largest discrepancies between the different simulations. Active decoupling by fitting B1+ yields the lowest difference although there are still some significant variations, generally with an overestimate for the ICM. Using pickup coils for active decoupling performs in a similar way to active decoupling by fitting. Again there is a tendency for the idealized coil model SAR estimates to be larger.
FIG. 6.
Maximum local 10 g SAR predictions from the Idealized Coil Model plotted against the predictions from the Full Coil Model. Each blue dot corresponds to a single random RF shim; the red line indicates equality. The rows correspond to different voxel models, while the columns correspond to different decoupling settings applied to the FCM (abbreviations listed in Table 1).
FIG. 7.
Boxplots of SAR estimate differences (ICM – FCM) for all three normalization techniques indicating the 5th and 95th percentile as the upper and lower bounds and the interquartile range. Positive values indicate overestimation of SAR when using the ICM.
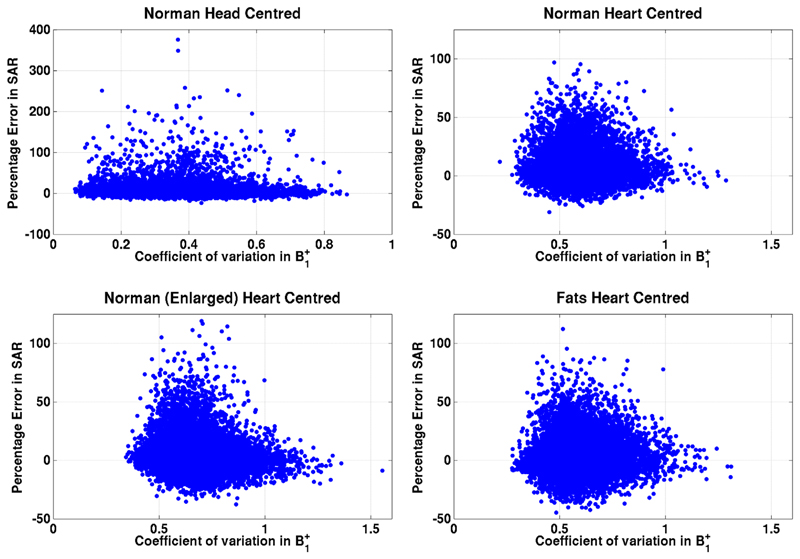
To test whether shim settings resulting in large SAR errors are associated with particular B1+ patterns, Figure 8 shows B1+ inhomogeneity (coefficient of variation) in the idealized coil model plotted against SAR error (ICM-FCM:AD/f). The two appear to be uncorrelated.
FIG. 8.
Coefficient of variation in B1+ (high coefficient = poor spatial homogeneity) in the idealized coil model plotted against error in SAR estimate for all voxel models. Each blue dot corresponds to a single random RF shim. There is no clear relation between the two variables.
Discussion and Conclusion
This work compares EM simulations of a parallel transmit MRI body coil using a Full Coil Model consisting of all coil elements plus decoupling circuits with an Idealized Coil Model in which coil elements are treated in isolation. The work focused on a single RF coil model operating at 128 MHz but included three separate anatomical voxel models, one of which was simulated in two different positions. The B1+ fields predicted by the idealized and full coil models when both are treated with nominal “quadrature” normalization agree qualitatively but there are large discrepancies in predicted SAR.
In practice, an idealized coil model would only be used for comparison with a physical system if some extra step were taken to account for residual coupling– one strategy is to adapt the physical system to emulate the ideally decoupled scenario–this is known as active decoupling (12,13). Active decoupling requires measured estimates of the residual coil coupling; we simulated this measurement by using either (simulated) pickup coils, or by directly fitting the B1+ fields. Figure 3 shows that the pickup coil method leads to better suppression of other coil elements than fitting of B1+ fields within the body, perhaps because in the latter case the EM fields produced very close to each individual coil element are ignored. As might be expected, directly fitting B1+ leads to highly similar B1+ in the slice used for fitting (Fig. 4), although errors are not precisely zero. Of course this good agreement is true by construction because we directly fit B1+; actually the fact that perfect agreement cannot be obtained demonstrates that the ICM and FCM are not simply linear combinations of one another. Active decoupling by fitting also leads to lower median error in simulated SAR predictions (Figs. 6 & 7) than the pickup coils method. This may seem counterintuitive because the fitting is only considering the NMR active B1+ component of the magnetic field whereas pickup coils were simulated by considering the B-field produced by currents on the coil elements–as evidenced by the better performance of pickup coils in suppressing fields produced by each element (Fig. 3). Fitting focused on the fields within the body, which are relevant for SAR characterization–this may explain the better performance. Another possibility is that ensuring similar current distributions on each element for the two decoupling regimes does not necessarily guarantee similar fields within the subjects, hence direct fitting of fields yields better results. In practice, both methods of active decoupling would be achievable–pickup coils already exist, while fitting could proceed by using in vivo acquired B1+ maps. In reality fitting would be subject to a large degree of uncertainty because of spatial mismatch between the voxel model and acquired B1+ data, and so pickup coils will likely remain the preferred method for active decoupling. However, it should be noted that, for other types of transmit arrays, pickup coils may not be appropriate, for example, surface coils at 7T and above.
Ultimately, it is accuracy of SAR prediction that is the priority for these models. As indicated by the values in Table 2, the most common error if using an ICM for SAR quantification in conjunction with active decoupling by means of fitting, is to overestimate SAR with the largest overestimate in the heart centered models (99th centile of differences) being 61%. The head centered model shows larger percentage differences but these are for relatively very low SAR values so are less of a concern. The data show a general trend toward overestimation that is likely due to greater power dissipation in the subject in the ICM, because there are no other active coil elements for the power to dissipate into elsewhere. From the point of view of safety, this makes the models more likely to be conservative, so less of a risk, however, they would lead to suboptimal operating conditions. Underestimates are more cause for concern. The underestimates were generally of a smaller degree than the overestimates; however, the extreme values were still quite large: the maximum underestimate from the ICMs compared with active decoupling by fitting (1st centile of differences) was 27%. Median errors in SAR estimation when considering decoupling by pickup coil were slightly larger than for active decoupling by means of fitting and the peak SAR underestimate in this case was 39%, now for a different voxel model. The implication is that fitting would be a preferred method for active decoupling. However, their performance is similar and as was mentioned earlier, although fitting is easy to do in a simulation study like this one, it would be much more error prone if used in reality, and this might introduce an additional source for uncertainty. In general, the worst case underestimates and discrepancies between models are of the order of 20–40%, and so margins for error when using such models for safety assessment must be made sufficiently large.
Table 2. 1st, 5th, 95th, and 99th Centile of Differences Along with the Mean Difference for All Voxel Models and Normalizations.
| Voxel model | Quadrature normalization | Active decoupling (fitting) | Active decoupling (pickup coils) | ||||||||||||
|---|---|---|---|---|---|---|---|---|---|---|---|---|---|---|---|
| 1st Centile | 5th Centile | Median | 95th Centile | 99th Centile | 1st Centile | 5th Centile | Median | 95th Centile | 99th Centile | 1st Centile | 5th Centile | Median | 95th Centile | 99th Centile | |
| NHeC | –30.5% | –18.4% | 21.1% | 69.8% | 96.2% | –9.7% | –5.5% | 3.4% | 35.0% | 100.3% | –30.0% | –20.6% | 5.5% | 28.6% | 42.6% |
| NHC | –63.1% | –51.9% | 5.1% | 173.7% | 268.6% | –15.2% | –8.7% | 4.5% | 36.5% | 57.0% | –27.9% | –20.8% | 8.2% | 41.9% | 56.1% |
| LNHC | –64.5% | –54.0% | –7.6% | 119.0% | 202.8% | –20.5% | –13.1% | 3.5% | 36.2% | 61.3% | –39.3% | –31.1% | –8.2% | 32.2% | 50.7% |
| FHC | –62.7% | –51.7% | 4.2% | 150.2% | 248.0% | –27.4% | –17.1% | 3.9% | 35.7% | 55.2% | –24.7% | –16.2% | 12.2% | 40.3% | 53.6% |
Idealized modeling has been used as a simulation methodology in the past (9,10) primarily due to simplicity of implementation; the models have fewer variables than a full approach and optimization is more stable due to the lack of coupling. This simulation study has shown that such an approach when combined with active decoupling can lead to SAR predictions which are reasonably accurate; however, there are a small number of cases in which larger errors do occur and it is not clear under which conditions we might expect this. To explore this, Figure 8 plots the relationship between B1+ inhomogeneity and error in SAR estimate; however, there does not appear to be a correlation in any model.
The presented results are for one particular case study of an RF coil model, an eight-channel TEM device operating at 128 MHz, with findings relatively consistent across several anatomical voxel models. It is not immediately clear how these results would generalize to different coils or other frequencies, but a comparison similar to the one made in this work could be applied to different coil geometries and voxel models. Circuit co-simulation can be implemented with commercial software, or using an inhouse implementation as outlined here; to assist with this the authors would be happy to supply example MATLAB code to interested parties by means of email. In any case, the simplicity of circuit co-simulation makes it straightforward to model complex devices, perhaps obviating the need for idealized models altogether.
Acknowledgments
The authors wish to acknowledge helpful correspondence with Peter Vernickel, Jens Hoffmann, and Jürgen Nistler. The authors also acknowledge financial support from the Department of Health by means of the National Institute for Health Research (NIHR) comprehensive Biomedical Research Centre award to Guy’s & St Thomas’ NHS Foundation Trust in partnership with King’s College London and King’s College Hospital NHS Foundation Trust.
Footnotes
Grant sponsor: the Wellcome Trust/EPSRC Centre of Excellence in Medical Engineering (MEC) at King’s College London; Grant number: 088641/Z/09/Z; Grant sponsor: EPSRC; Grant numbers: EP/H046410/1, EP/L00531X/1; Grant sponsor: the Medical Research Council; Grant number: MR/ K006355/1; Grant sponsor: the European Metrology Research Programme; Grant number: EMRP-HLT06.
References
- 1.Zhu Y. Parallel excitation with an array of transmit coils. Magn Reson Med. 2004;51:775–784. doi: 10.1002/mrm.20011. [DOI] [PubMed] [Google Scholar]
- 2.Katscher U, Börnert P, Leussler C, van den Brink JS. Transmit SENSE. Magn Reson Med. 2003;49:144–150. doi: 10.1002/mrm.10353. [DOI] [PubMed] [Google Scholar]
- 3.Grissom W, Yip C, Zhang Z, Stenger VA, Fessler JA, Noll DC. Spatial domain method for the design of RF pulses in multicoil parallel excitation. Magn Reson Med. 2006;56:620–629. doi: 10.1002/mrm.20978. [DOI] [PubMed] [Google Scholar]
- 4.International Electrotechnical Commission. Particular requirements for the basic safety and essential performance of magnetic resonance equipment for medical diagnosis. Geneva: International Electrotechnical Commission; 2010. IEC 60601-2-33 ed3.0. [Google Scholar]
- 5.U.S. Food and Drug Administration. Criteria for significant risk investigations of magnetic resonance diagnostic devices - guidance for industry and food and drug administration staff. Silver Spring, MD: FDA; 2014. pp. 2–3. [Google Scholar]
- 6.Brunner DO, Pruessmann KP. Optimal design of multiple-channel RF pulses under strict power and SAR constraints. Magn Reson Med. 2010;63:1280–1291. doi: 10.1002/mrm.22330. [DOI] [PubMed] [Google Scholar]
- 7.Sodickson D, Alon L, Deniz C, Brown R. Maxwell tomography using transmit-receive coil arrays for contact-free mapping of tissue electrical properties and determination of absolute RF phase. Proceedings of the 20th Annual Meeting of ISMRM; Melbourne, Australia. 2012. p. 387. [Google Scholar]
- 8.Katscher U, Voigt T, Findeklee C, Vernickel P, Nehrke K, Dössel O. Determination of electric conductivity and local SAR via B1 mapping. IEEE Trans Med Imaging. 2009;28:1365–1374. doi: 10.1109/TMI.2009.2015757. [DOI] [PubMed] [Google Scholar]
- 9.Homann H, Graesslin I, Eggers H, Nehrke K, Vernickel P, Katscher U, Dössel O, Börnert P. Local SAR management by RF shimming: a simulation study with multiple human body models. MAGMA. 2012;25:193–204. doi: 10.1007/s10334-011-0281-8. [DOI] [PubMed] [Google Scholar]
- 10.Mao W, Wang Z, Smith MB, Collins CM. Calculation of SAR for transmit coil arrays. Concepts Magn Reson Part B Magn Reson Eng. 2007;31B:127–131. doi: 10.1002/cmr.b.20085. [DOI] [PMC free article] [PubMed] [Google Scholar]
- 11.Graesslin I, Krueger S, Vernickel P, Achtzehn J, Nehrke K, Weiss S. Detection of RF unsafe devices using a parallel transmission MR system. Magn Reson Med. 2013;70:1440–1449. doi: 10.1002/mrm.24558. [DOI] [PubMed] [Google Scholar]
- 12.Vernickel P, Röschmann P, Findeklee C, Lüdeke K-M, Leussler C, Overweg J, Katscher U, Grässlin I, Schünemann K. Eight-channel transmit/receive body MRI coil at 3T. Magn Reson Med. 2007;58:381–389. doi: 10.1002/mrm.21294. [DOI] [PubMed] [Google Scholar]
- 13.Graesslin I, Homann H, Biederer S, Börnert P, Nehrke K, Vernickel P, Mens G, Harvey P, Katscher U. A specific absorption rate prediction concept for parallel transmission MR. Magn Reson Med. 2012;68:1–11. doi: 10.1002/mrm.24138. [DOI] [PubMed] [Google Scholar]
- 14.Vernickel P, Findeklee C. Active digital decoupling for multi-channel transmit MRI Systems. Proceedings of the 16th Annual Meeting of ISMRM; Berlin, Germany. 2007. p. 19. [Google Scholar]
- 15.Kozlov M, Turner R. Fast MRI coil analysis based on 3-D electromagnetic and RF circuit co-simulation. J Magn Reson. 2009;200:147–152. doi: 10.1016/j.jmr.2009.06.005. [DOI] [PubMed] [Google Scholar]
- 16.Kozlov M, Turner R. Effects of tuning condition, head size and position on the SAR of a 9.4T dual row array. PIERS Proceedings; Taipei, Taiwan. 2013. pp. 422–426. [Google Scholar]
- 17.Weiland T, Timm M, Munteanu I. A practical guide to 3-D simulation. IEEE Microwave Magazine. 2008;9:62–75. [Google Scholar]
- 18.Kozlov M, Turner R. A comparison of Ansoft HFSS and CST microwave studio simulation software for multi-channel coil design and SAR estimation at 7T MRI. PIERS Online. 2010;6:395–399. [Google Scholar]
- 19.Kozlov M, Turner R. Simulation-driven design and optimization of RF coil arrays for MRI. Microwave workshop series on RF and and wireless technologies for biomedical and healthcare applications (IMWS-BIO) 2013:0–2. [Google Scholar]
- 20.Zhang R, Xing Y, Nistler J, Wang J. Field and S-parameter simulation of arbitrary antenna structure with variable lumped elements. Proceedings of the 17th Annual Meeting of ISMRM; Stockholm, Sweden. 2009. 3040. [Google Scholar]
- 21.Lemdiasov RA, Obi AO, Ludwig R. A numerical postprocessing procedure for analyzing radio frequency MRI coils. Concepts Magn Reson Part A. 2011;38A:133–137. [Google Scholar]
- 22.Pozar DM. Microwave engineering. 4th. New York: John Wiley & Sons; 2012. [Google Scholar]
- 23.Beggs JH, Member S, Luebbers RJ, Member S, Yee KS, Kunz KS. Implementation of surface conditions. IEEE Trans Antennas Propag. 1992;40:49–56. [Google Scholar]
- 24.Kuehne A, Waiczies H, Moser E. Skin effect estimation accuracy in FDTD coil simulations. Proceedings of the 22nd Annual Meeting of ISMRM; Milan, Italy. 2014. 1363. [Google Scholar]
- 25.Dimbylow PJ. FDTD calculations of the whole-body averaged SAR in an anatomically realistic voxel model of the human body from 1 MHz to 1 GHz. Phys Med Biol. 1997;42:479–490. doi: 10.1088/0031-9155/42/3/003. [DOI] [PubMed] [Google Scholar]
- 26.Zelinka I. New optimization techniques in engineering SE - 7 Studies in fuzzi-ness and soft computing. Vol. 141. Heidelberg: Springer; 2004. SOMA – Self-organizing migrating algorithm; pp. 167–217. [Google Scholar]
- 27.Guérin B, Gebhardt M, Serano P, Adalsteinsson E, Hamm M, Pfeuffer J, Nistler J, Wald LL. Comparison of simulated parallel transmit body arrays at 3 T using excitation uniformity, global SAR, local SAR, and power efficiency metrics. Magn Reson Med. 2015;73:1137–1150. doi: 10.1002/mrm.25243. [DOI] [PMC free article] [PubMed] [Google Scholar]
- 28.Jin J, Liu F, Weber E, Crozier S. Improving SAR estimations in MRI using subject-specific models. Phys Med Biol. 2012;57:8153–8171. doi: 10.1088/0031-9155/57/24/8153. [DOI] [PubMed] [Google Scholar]
- 29.Christ A, Kainz W, Hahn EG, et al. The virtual family–development of surface-based anatomical models of two adults and two children for dosimetric simulations. Phys Med Biol. 2010;55:N23–N38. doi: 10.1088/0031-9155/55/2/N01. [DOI] [PubMed] [Google Scholar]
- 30.IEEE. C95.3–2002 - IEEE recommended practice for measurements and computations of radio frequency electromagnetic fields with respect to human exposure to such fields, 100 kHz-300 GHz. IEEE; 2002. p. 126. [Google Scholar]
- 31.Eichfelder G, Gebhardt M. Local specific absorption rate control for parallel transmission by virtual observation points. Magn Reson Med. 2011;66:1468–1476. doi: 10.1002/mrm.22927. [DOI] [PubMed] [Google Scholar]


