Abstract
Epithelia act as a barrier against environmental stress and abrasion and in vivo they are continuously exposed to environments of various mechanical properties. The impact of this environment on epithelial integrity remains elusive. By culturing epithelial cells on 2D hydrogels, we observe a loss of epithelial monolayer integrity through spontaneous hole formation when grown on soft substrates. Substrate stiffness triggers an unanticipated mechanical switch of epithelial monolayers from tensile on soft to compressive on stiff substrates. Through active nematic modelling, we find that spontaneous half-integer defect formation underpinning large isotropic stress fluctuations initiate hole opening events. Our data show that monolayer rupture due to high tensile stress is promoted by the weakening of cell-cell junctions that could be induced by cell division events or local cellular stretching. Our results show that substrate stiffness provides feedback on monolayer mechanical state and that topological defects can trigger stochastic mechanical failure, with potential application towards a mechanistic understanding of compromised epithelial integrity during immune response and morphogenesis.
Keywords: rigidity, epithelium, MDCK cells, hole formation, polyacrylamide gels, tissue stress and tension
The plasticity of epithelial tissue is crucial during animal ontogenesis, and wound healing1–4. Epithelia are cell sheets that act as a covering for most of the internal and external surfaces of the body, playing an important role as protective barriers. As such, epithelial cells are constantly challenged by the environment assaults. In response to these challenging environments, epithelia are subject to constant cell renewal and cell extrusions, whose balance is key for epithelia homeostasis while modifying their shape5. These morphological changes include the formation of holes between cells which are crucial for tissue development6,7 but also in macrophage infiltration8 or diseases such as diabetes9, asthma10 and cancer 11.
Epithelial integrity is maintained under the guidance of long range and coordinated mechanical forces1. These force patterns give rise to tissue scale stresses that assist in the maintenance of tissue homeostasis by controlling cell division2, cell intercalation3, cell extrusion12 and cell migration13. While local compression contributes to cell extrusion14, cell division2 and migration13 occur in a tension dependent manner. In vitro, migrating epithelial cells display a tensile stress gradient that increases as one moves from the front to the middle of the migrating sheet13,15 mediated through E-cadherin based adhesions16. However, excess stress buildup can result in tissue fracture. In vitro studies have shown that tension build up results in tearing of suspended proliferative epithelial monolayers indicating that tensile stresses can contribute to hole formation in a growing epithelia17,18. In vivo studies across various organisms such as Drosophila melanogaster, Trichoplax adhaerens and Hydra19–22 have shown hole formation to be an important developmental feature necessary for growth. This occurs through a build-up of force and stress within the developing epithelia leading to subsequent loss of cell-substrate adhesions21. This rupture is either initiated through tension build-up at cell-cell contacts as in chick lung epithelia23, or tissue level tension as in peripodial epithelium of the Drosophila leg18. In other studies, the loss of cell-cell junctions in Drosophila24 or reduction of junctional contractility in Tribolium castaneum25 leads to temporary hole formation and loss of epithelial integrity. All these results across various model organisms show that hole formation possibly occurs in a tension dependent manner and can be related to the strength of cell-cell and cell-substrate adhesions.
However, the impact of cellular and tissular mechanical forces and stresses on epithelial integrity remains unclear. These mechanical stresses can be modulated by parameters such as substrate geometry, adhesiveness and rigidity26–28. Rigidity is known to impact a variety of biological processes including cell adhesion, migration and differentiation27,29–34 and stiffness mechanosensing relies on the cross-talk between cell-cell and cell-substrate adhesion35–37. Here, we used polyacrylamide gels of various stiffnesses, as substrates, on which we cultured epithelial cells as a tool to modulate tissue mechanics. We revealed that gel stiffness induced a switch from a tensile state on soft to compressive on stiff gels. Furthermore, this tensile state observed on softer gel favors the formation of spontaneous holes within epithelial monolayers at nematic topological defects where cell-cell junctions are weakened due to cell division or cell stretching. This was further confirmed by our modeling approaches combining cell-based simulations and continuum hydrodynamic theory.
Hole formation in epithelial monolayers is rigidity-dependent
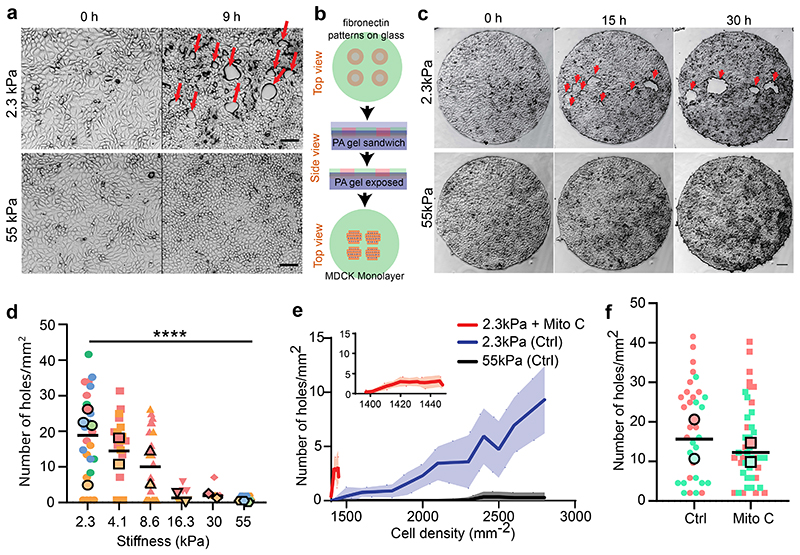
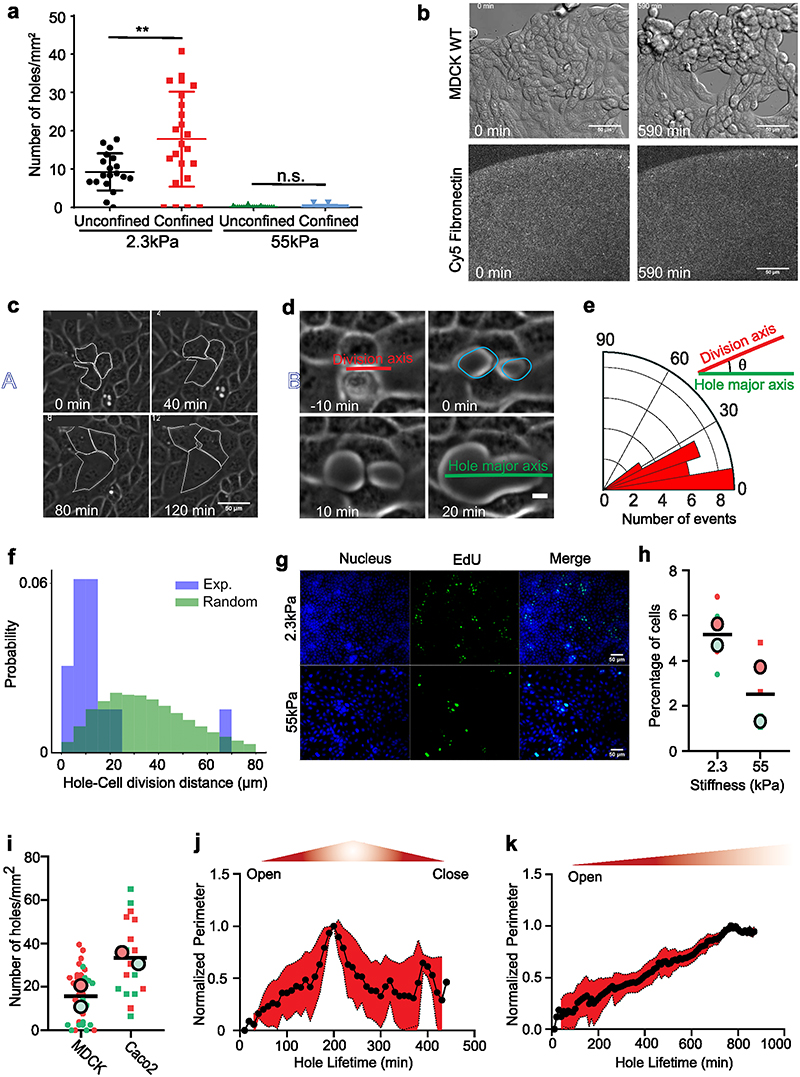
We first cultured MDCK epithelial cells on polyacrylamide (PA) gels of distinct stiffnesses, 2.3 and 55kPa (hereafter referred to as unconfined condition). Surprisingly, we observed the spontaneous formation of holes within intact monolayers on 2.3kPa gels (Fig. 1a, Supplementary Video S1) during their expansion but not on 55kPa (Fig. 1a, Supplementary Video S1). To better control culture conditions, we thus used PA gels with circular micropatterns (1mm diameter) using deep UV patterning (hereafter referred to as confined condition) (Fig. 1b), in combination with live cell imaging to study the response of cell monolayers to substrate stiffness (Fig. 1c, Supplementary Video S2). We noted a significant increase in the density of holes on 2.3kPa gels to ~18±9 holes/mm2 upon confining the monolayers (Extended Data Fig. 1a). On 2.3kPa gels holes formed at a rate of 3.4±1.5 holes/mm2/h (n = 15 circles from 2 independent experiments). Similar to the unconfined conditions, MDCK monolayers formed holes in a rigidity-dependent manner and the prevalence of holes monotonically decreased with an increase in gel stiffness (Fig. 1d, Supplementary Video S2). Hence the most stable holes were observed on gels of stiffness 2.3kPa (Fig. 1c, d) and thus, we continued to study hole growth and dynamics on 2.3kPa gels. Using live imaging of Cy5-tagged fibronectin coated gels, we verified that hole initiation was not associated to any pre-existing inhomogeneity nor progressive loss of fibronectin coating over the time scale of our experiments (Extended Data Fig. 1b, Supplementary Video S3).
Fig. 1. Rigidity based hole formation within MDCK monolayers.
(a) Time course of hole formation in an unconfined MDCK monolayer on 2.3kPa and 55kPa PA gels. Red arrows show the holes formed within the monolayer (Scale: 50μm) (b) Schematic of the process of fibronectin patterning on PA gels; top: fibronectin coating on coverslips patterned through deep UV; middle: PA gel is placed between patterned and silanized coverslips; bottom: MDCK cells are seeded on patterned PA gel. (c) Time based montage of MDCK cells forming holes on 2.3kPa PA gels (top panel) and intact monolayers on 55kPa gels (bottom panel). Red arrows show the holes formed in the monolayer (Scale: 100μm). (d) Likeliness of hole formation as a function of PA gel stiffness (n2.3 = 23, n4.ikPa = 23, n8.6 kPa = 24, n16.3 kPa = 8, n30 kPa = 7 and n55 kPa = 15 different circles; ***p < 0.001, ****p < 0.0001) (e) The number of holes formed as a function of cell density on untreated and mitomycin C treated monolayers on soft (2.3kPa) gels and monolayers on stiff (55kPa) gels averaged over n= 22 circles and n = 10 circles for untreated and mitomycin treated samples on 2.3kPa and n=14 circles for 55kPa. (f) The number of holes formed within untreated and mitomycin-c treated circles on soft (2.3kPa) gels. (nctrl = 33, nmito = 44, *p < 0.05). All results were obtained from 2 independent experiments and solid bars represent mean and error bars standard deviation.
A closer examination revealed two types of cellular events prior to hole initiation: ~10±3.2% of holes (n=30 holes, 2 independent experiments) were associated to breakage of junctions following stretching of a cell (Extended Data Fig. 1c, Supplementary Video S1 and S4) while ~90±4.1% (n=30 holes, 2 independent experiments) were formed at cell division sites during cytokinesis (or abscission of the intercellular bridge38) (Extended Data Fig. 1d, Supplementary Video S4), with major axis of the hole aligned with the division axis, (Extended Data Fig. 1d,e). Examining the relation between cell division events and hole formation 50 mins prior to hole initiation revealed cell division to occur within a distance of 14±4μm from the site of hole formation, while this distance was 36μm when cell division events were randomly distributed (Extended Data Fig. 1f and Supplementary Video S4).
In very few instances we observed the formation of holes on stiff gels and only at higher densities. Similarly, the prevalence of hole formation on 2.3kPa (soft) gels increased as a function of cell density (Fig. 1e) and these holes continue to grow as the density increases (Supplementary Video S2). As suggested above, hole formation may be induced through two different mechanisms associated to cell stretching and cell division, respectively. Interestingly, when comparing cell proliferation on soft and stiff, we found a significant decrease in cell proliferation on stiff gels (Extended Data Fig. 1g, h).
Thus, to delineate the role of cell division we blocked DNA synthesis by mitomycin C treatment. Upon mitomycin C treatment on 2.3kPa gels we obtained a significant reduction in the number of holes formed per unit area (Fig. 1f), indicating that when cell division is blocked, hole formation is largely blocked as well, but cell stretching events can still lead to hole formation.
We generalize our findings by performing complementary experiments on the colorectal adenocarcinoma epithelial cell line Caco2, which displayed a similar behavior as MDCK cells leading to hole formation on soft (2.3kPa) gels (Extended Data Fig. 1i, Supplementary Video S5). Altogether, these observations point towards hole formation in epithelial monolayers due to altered cell-substrate interactions mediated by substrate stiffness.
Dynamics of hole initiation and growth
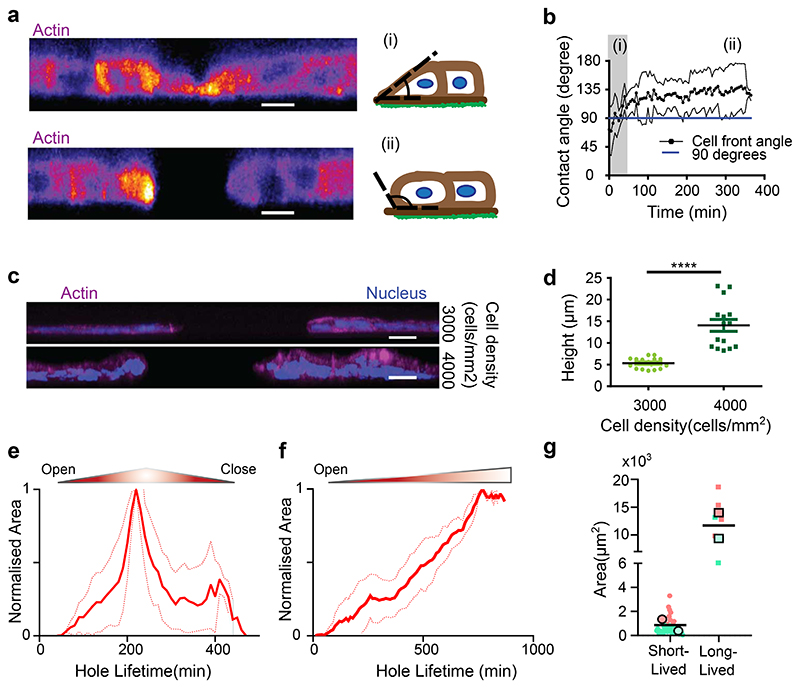
Tracking the dynamics of hole opening through a side view angle and imaging MDCK monolayers tagged with actin-GFP showed differences in the curvature formed by the cell edge at the hole periphery during and after hole opening. At early stages of hole initiation, cells spread on the substrate and the cell front formed a contact angle with the substrate lower than 90°, suggesting that rupture first occurs on the apical side (Fig. 2a(i), b). During hole opening, the local curvature of the cell front changes, evidenced by an increase in contact angle between the cell front and substrate (greater than 90°) (Fig. 2a(ii), b). The change in curvature of the cell front and the radial speed of hole growth are reminiscent of an active dewetting process, previously described during cell spreading39,40 as a result of low interactions with the underlying surface or increased tension within the monolayer. In addition, at high cell density, a side-view of nuclei-labelled monolayers revealed a preference to form multilayered epithelia at the hole boundary (Fig. 2c, d). This shows that cells at high densities prefer to pile up around the hole instead of closing it, pointing towards reduced substrate adhesion as a main cause of hole growth.
Fig. 2. Hole characteristics.
(a) Cross-sectional view of actin-GFP MDCK cells before (top panel) and after (bottom panel) hole formation on soft (2.3kPa) gels (Scale: 10 μm) (b) Change of contact angle over time (t0 = initiation of hole) as the hole grows. Blue line represents 90° on the y-axis. (n = 6 different circles) where (i) and (ii) illustrate the regions (i) and (ii) in panel a (c) Illustration of cell density change around the hole periphery on soft (2.3kPa) gels (d) Post-hole formation, increase in cell density does not contribute to hole closure (n3000 = 16 different circles and n4000 = 15 different circles; ****p <0.0001). (Scale: 20 μm) (e, f) Time dependent change in hole area normalized over maximum area of the hole for experiment and simulation of (e) short-lived holes (<5hr) (n = 36 different circles) and (f) long-lived hole (>5hr) (n = 9 different circles in experiment) on soft (2.3kPa) gels from 2 independent experiments. (g) Maximal hole opening area for short-lived (n = 42 different circles) and long-lived holes (n = 7 different circles) from 2 independent experiments (****p < 0.0001)). Solid lines represent mean and error bars represent standard deviation.
Along this line, tracking the dynamics of holes revealed two distinct lifetimes: short-lived holes that tend to close in less than 5 hours (Fig. 2e, Extended Data Fig. 1j, Supplementary Video S6) and long-lived holes that stayed open for a longer duration (at least during the time course of our experiments) (Fig. 2f, Extended Data Fig. 1k, Supplementary Video S6). Computing the area of these short- and long-lived holes, revealed a threshold area, around 4000μm2 (corresponding to approx. 36μm in radius) beyond which the holes tended to be long-lived (Fig. 2g). These long-term holes occasionally grew through the fusion of two holes forming a larger one while in other cases, fission of large holes results in the formation of two small holes (Supplementary Video S2).
Role of cell-substrate adhesion in hole formation
Previous studies have shown that substrate stiffness has a strong impact on focal adhesion (FA) mechanosensing at single and collective cell levels41–45 while its role in regulating cell-cell adhesion remains less clear37,46. We first looked at the role of substrate adhesions during hole formation.
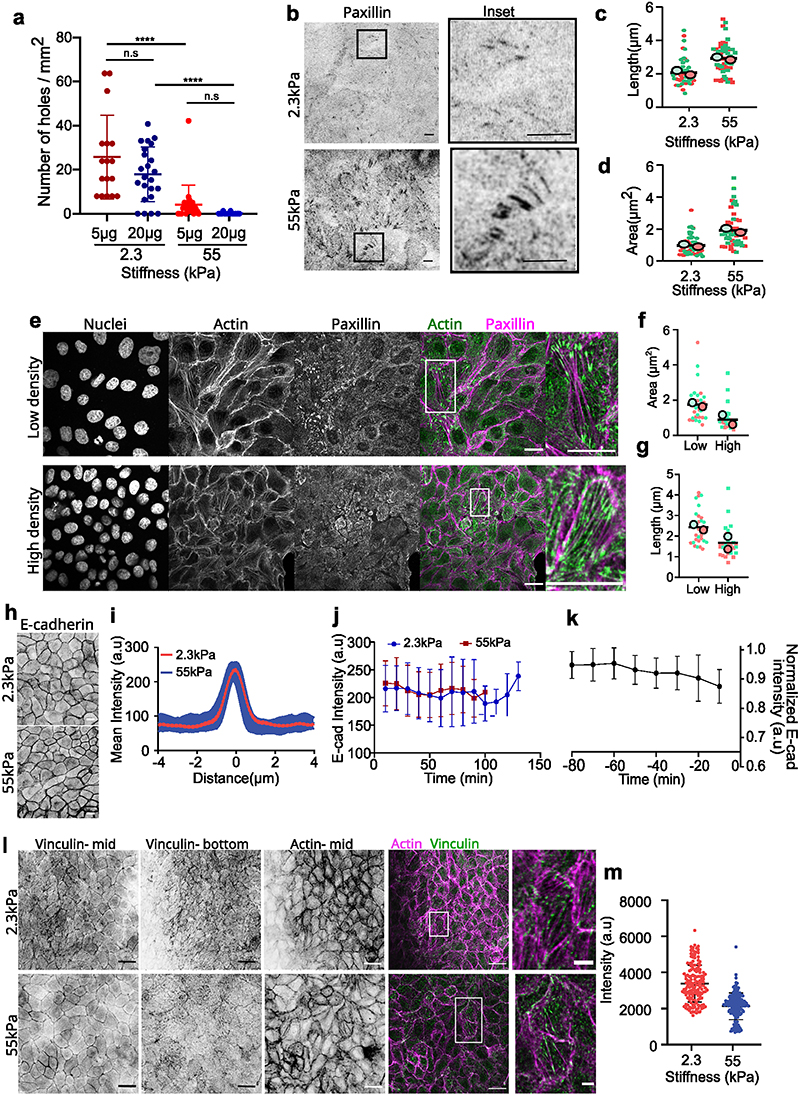
To this end, we decreased the fibronectin concentration from 20 μg/ml to 5 μg/ml (see Methods). On 2.3kPa gels varying fibronectin concentration did not significantly affect hole formation. On stiff (55kPa) gels as well the number of holes formed did not vary upon reducing fibronectin concentration (Extended Data Fig. 2a). However, when soft (2.3kPa) gels were patterned with different amounts of fibronectin on the same sample (see Methods), holes preferentially formed on regions of low fibronectin coating (50μg/ml) (Fig. 3a, Supplementary Video S7), with 60% probability of hole formation on regions of low fibronectin concentration. While, no holes were formed in the regions of high fibronectin concentration (200μg/ml) (n= 10 samples in 2 independent experiments). Staining for cell-substrate adhesion marker (paxillin) revealed a marked increase in the length and area of focal adhesions on 55kPa gels in comparison to 2.3kPa gels (Extended Data Fig. 2b-d). In agreement with previous studies45, we show that the number and length of focal adhesions reduced as cell density increases (Extended Data Fig. 2e-g) which may explain the higher propensity of holes to remain open at high density (Supplementary Video S2). Altogether, these results point toward a major contribution of stiffness sensing over purely substrate adhesion as a driver for hole formation.
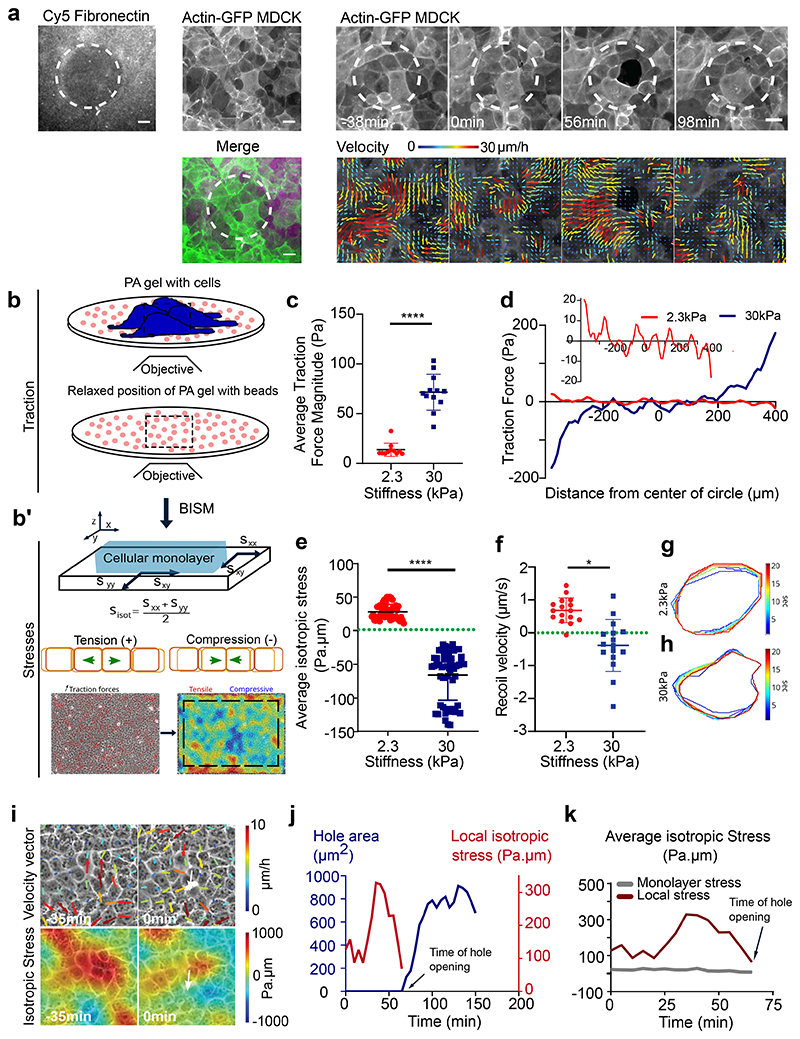
Fig. 3. Gel stiffness modulates tissue stress within MDCK monolayers.
(a) Actin GFP monolayer on a soft (2.3kPa) gel with differential coating of fibronectin with 100 μm circular islands of 50μg/ml and surroundings with 200μg/ml allows holes formation in regions of low fibronectin coating. Velocity maps show movement of cells towards the high fibronectin coated spaces. (scale: 20μm) (b) Schematic showing the method of measurement of traction forces and inferred stress (c) Average traction force magnitude increases in MDCK monolayer on soft (2.3kPa) and stiff (30kPa) gels (n = 114 time averaged for n2.3kPa = 11 different circles, 3 independent experiments & n = 183 time averaged for n30kPa = 12 different circles, 2 independent experiments; ****p <0.0001) (d) Representative graph of a confined monolayer shows that traction forces are oppositely directed on soft (2.3kPa) and stiff (30kPa) gels along the diameter of the circle (e) Average isotropic stress for no-hole regions of confined monolayers on 2.3kPa and 30kPa gels. Green dashed line represents 0 Pa.μm on the y-axis (n = 50 time averaged for n2.3kPa = 10 different circles, 3 independent experiments & n = 52 time averaged for n30kPa = 8 different circles, 2 independent experiments; ****p < 0.0001, ****p < 0.0001) (f) Recoil velocity after laser ablation of the MDCK monolayers grown on gels of different stiffnesses. Green dashed line indicates 0 μm/sec (n2.3kPa = 18 & n55kPa = 18 different movies from 2 independent experiments; *p < 0.05) (g, h) Time evolution of ROI contours for soft (2.3kPa) (g) and stiff (30kPa) (h) gels upon laser ablation. Heat map shows the evolution of time in seconds from one representative experiment. Error bars represent standard deviation. (i) Velocity vectors (top) and isotropic stress (bottom) before and during hole formation in a local region obtained from experiments on 2.3kPa PA gels. Color bar represents the respective scale bar for the values of the particular measurement and white arrow indicates the location of hole formation. (j) Change in isotropic stress (red) in a local region near a hole and the change in area of a hole (blue) as a function of time (additional trajectories are provided in Extended Figure 3). (k) Isotropic stress of the entire monolayer (grey) and isotropic stress in a local region (red) containing the hole as a function of time until the hole is formed on soft (2.3kPa gels). Solid lines indicate mean values and error bars the standard deviation.
Mechanical failure of monolayers grown on soft substrates is unlikely to be explained by a lower strength of cell-cell adhesion as no difference in junctional E-cadherin intensity was observed within MDCK monolayers grown on 2.3kPa or 55kPa gels at random locations (Extended Data Fig. 2h-i) and after a cell division event (Extended Data Fig. 2j). Following the change in E-cadherin intensity over time showed a slight decrease in E-cadherin intensity prior to hole formation on 2.3kPa gels (Extended Data Fig. 2k). Yet, we observed an increase in the junctional intensity of vinculin on soft gels, in comparison to stiff ones (Extended Data Fig. 2l, m). This increase in junctional vinculin, a mechanosensitive protein - known to shuttle between cell-cell contacts and cell-substrate adhesions in a force dependent manner47,48, accompanied by reduced substrate adhesion point towards a build-up in junctional stresses leading to hole formation on soft (2.3kPa) gels.
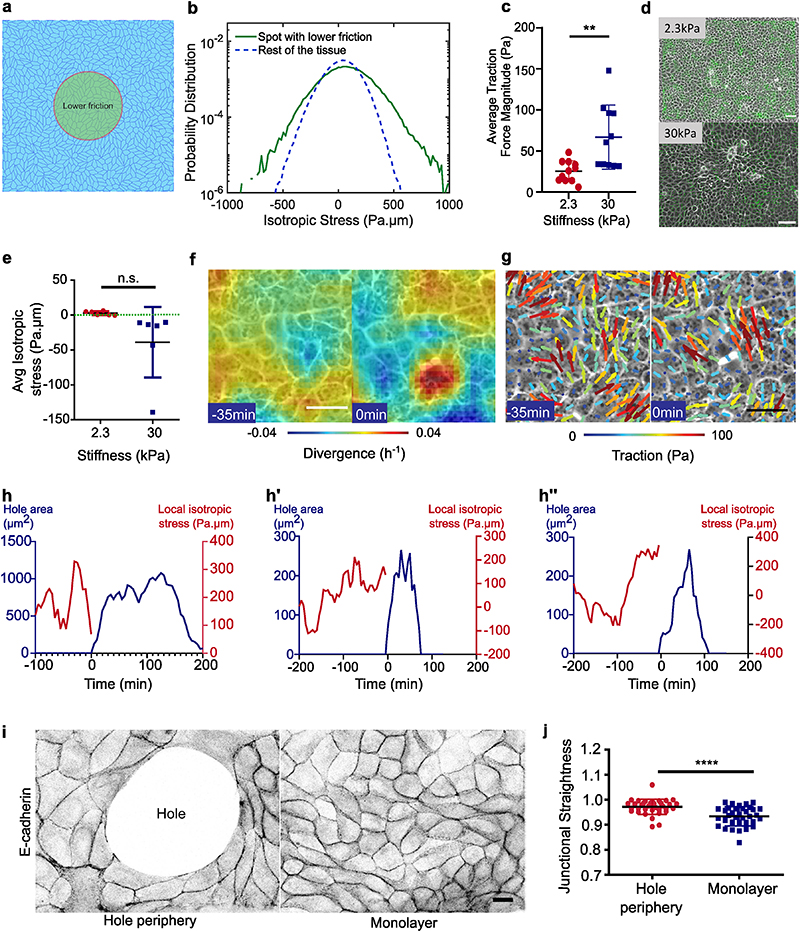
We tested this interpretation through an in silico vertex model of epithelial tissues (see Methods)49. In such a framework, the dynamic contacts between cell-cell junctions (vertices) results from a balance of drag friction to the substrate and internal stresses generated within cells while constant tissue flows were achieved through an active stress mechanism (see Supplementary Information (SI)). Modulating surface friction in our simulations resulted in higher cellular stresses within regions of low substrate friction (Extended Data Fig. 3a, b), in agreement with our experimental observation of hole formation within regions of low fibronectin concentration (Fig. 3a).
Importantly, these results can be recapitulated by considering a minimal Kelvin-Voigt rheological model for cells which accounts for the role of cell-substrate friction. In such a model, the stress load imposed by the tissue on each individual cell is shared between the viscous drag on the substrate (damper) and a bulk cell or cell-cell elastic moduli (spring). In regions of reduced adhesion molecule density or low substrate elastic modulus50, a lower viscous drag on the substrate is expected51. In a Kelvin-Voigt model, a weaker damper (low substrate adhesion) results in a higher stress load within cells (spring). Since higher stresses within epithelial monolayers has been attributed to mechanical failure of cell-cell junctions17, our Kelvin-Voigt model explains why hole formation is favored by lower adhesion at the cell-substrate interface in both experiments and simulations.
Monolayer tension on soft gels drives hole formation
Our results thus far, point towards differential mechanical regulation on soft and stiff gels. To assess the contributions of tension during hole formation, we measured traction forces and inferred stress within the monolayer using Traction Force Microscopy (TFM) and Bayesian Inversion Stress Microscopy52 (BISM), respectively (Fig. 3b, b’). In these experiments, we used 30kPa as stiff gels instead of 55kPa due to limitations of TFM at higher stiffnesses. We first confirmed that cells exert higher traction forces on stiff gels both under confined and unconfined conditions (Fig. 3c, Extended Data Fig. 3c). Additionally, in confined MDCK monolayers the direction of traction forces along the diameter of the circle changed from soft to stiff gels, i.e., traction forces pointed inward on soft and outward on stiff gels (Fig. 3d, Extended Data Fig. 3d), revealing a potential change in stress patterns within the monolayer. Computing monolayer stresses, we observed a change in the sign of averaged monolayer isotropic stress from positive values (~ 50 Pa.μm, i.e., negative pressure) on soft gels to a negative values (~ -60 Pa.μm, i.e., positive pressure) on stiff gels under both confined and unconfined conditions (Fig. 3e, Extended Data Fig. 3e). Our results are in agreement with previous studies that described cellular monolayers to be tensile on soft gels13,52, but unveiled an unanticipated switch from a tensile to a compressive state upon increase in substrate stiffness (Fig. 3e). We further confirmed our stress inference results using laser ablation on cellular monolayers on 2.3kPa and 30kPa gels (Supplementary Video S8). The recoil velocity of monolayers on 30kPa gels was negative (-0.38μm/s) while around 2.5μm/s on 2.3kPa gels (Fig. 3f-h) confirming the tensile nature of the epithelial monolayers on soft gels and compressive on stiff gels. To understand the origin of this difference in tissue stresses with substrate stiffness, we turned to our vertex model where cell-adhesion energy can be modulated. Beyond the individual cell shape energy function (SI, Section IA), we expect substrate interactions to modify the cell-substrate adhesion energy53 through a contribution δU = —γb A, where A is the cell area. This results in a modulated spreading area = A0 + γb/KA, where KA is the standard area elasticity (SI, Section IB). Thus, having constant cell divisions with a constant spreading area of each daughter cell leads to a simulated tissue under compression (Fig. S5). However, a reduced spreading area of daughter cells upon cell division gives rise to a simulated tensile tissue (Fig. S5). Such interpretation is consistent with our experimental observations of tensile monolayers on soft substrates with reduced size of focal adhesions.
We then focused on soft gels and investigated the local changes in cell movement and monolayer tension in the vicinity of the hole over time. About 30-50 mins prior to hole initiation in a region of about 5 cell radii, cells showed outward movement in combination with outward pointing high velocity vectors and positive divergence (Fig. 3i top, Extended Data Fig. 3f). Traction force vectors demonstrated a similar pattern, where cells exerted outward forces before hole initiation (Extended Data Fig. 3g). The isotropic stress exhibited a local buildup of tensile stress which relaxed prior to hole initiation (Fig. 3i bottom, j, Extended Data Fig. 3h). This decrease in tensile stress prior to hole formation might be related to the timescale of focal adhesion formation shown to be in a range of 15-30 mins54. This local spike in stress prior to hole formation was in striking contrast to the overall monolayer stress that remained unchanged (Fig. 3k). We quantified the straightness of E-cadherin junctions, a direct indicator of the local stress in the tissue55 and found an increase in straightness around the hole in comparison to the regions far away from the hole (Extended Data Fig. 3i, j) confirming the role of local tensile stresses in hole initiation.
Nematic ordering of cells initiates hole opening
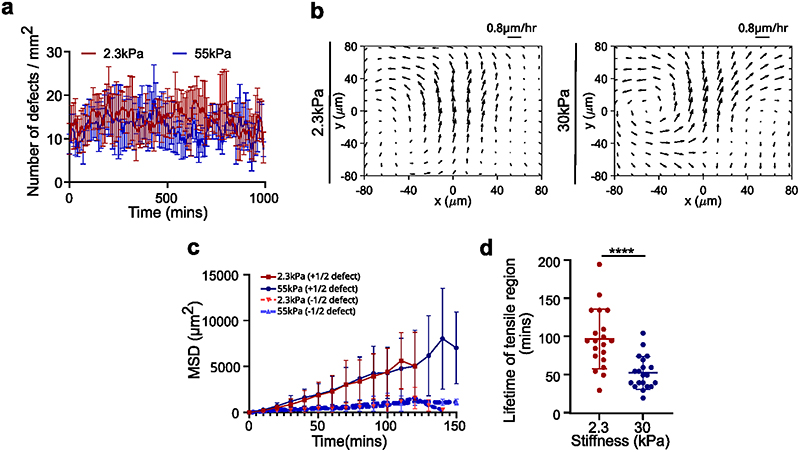
To understand the origin of this increase in local stress, we analyzed topological defects (trefoils or comet shapes, corresponding to -1/2 and +1/2 topological defects) which have been described as mechanotransducive hotspots (Fig. 4a, Supplementary Video S9)56,57. We first sought to compare the spatial distribution and the dynamics of topological defects but we found comparable number of defects formed on soft and stiff gels (Extended Data Fig. 4a) and the tracking of +1/2 (comet) defects revealed forward movements on both soft and stiff gels and thus, extensile behavior of cell monolayers (Extended Data Fig. 4b) in agreement with our previous work14,59. We then examined the lifetime of +1/2 defects which lasted longer on soft gels (129±49 mins) than on stiff gels (92±90 mins) (Extended Data Fig. 4c). By comparing these results to tensile hotspots in a region of 25x25μm at random locations, we found a longer persistence of these hotspots on soft (97.5±39 min) compared to stiff gels (53±21 min) (Extended Data Fig. 4d) with a mean lifetime of tensile regions on soft gels comparable to the one of +1/2 defects.
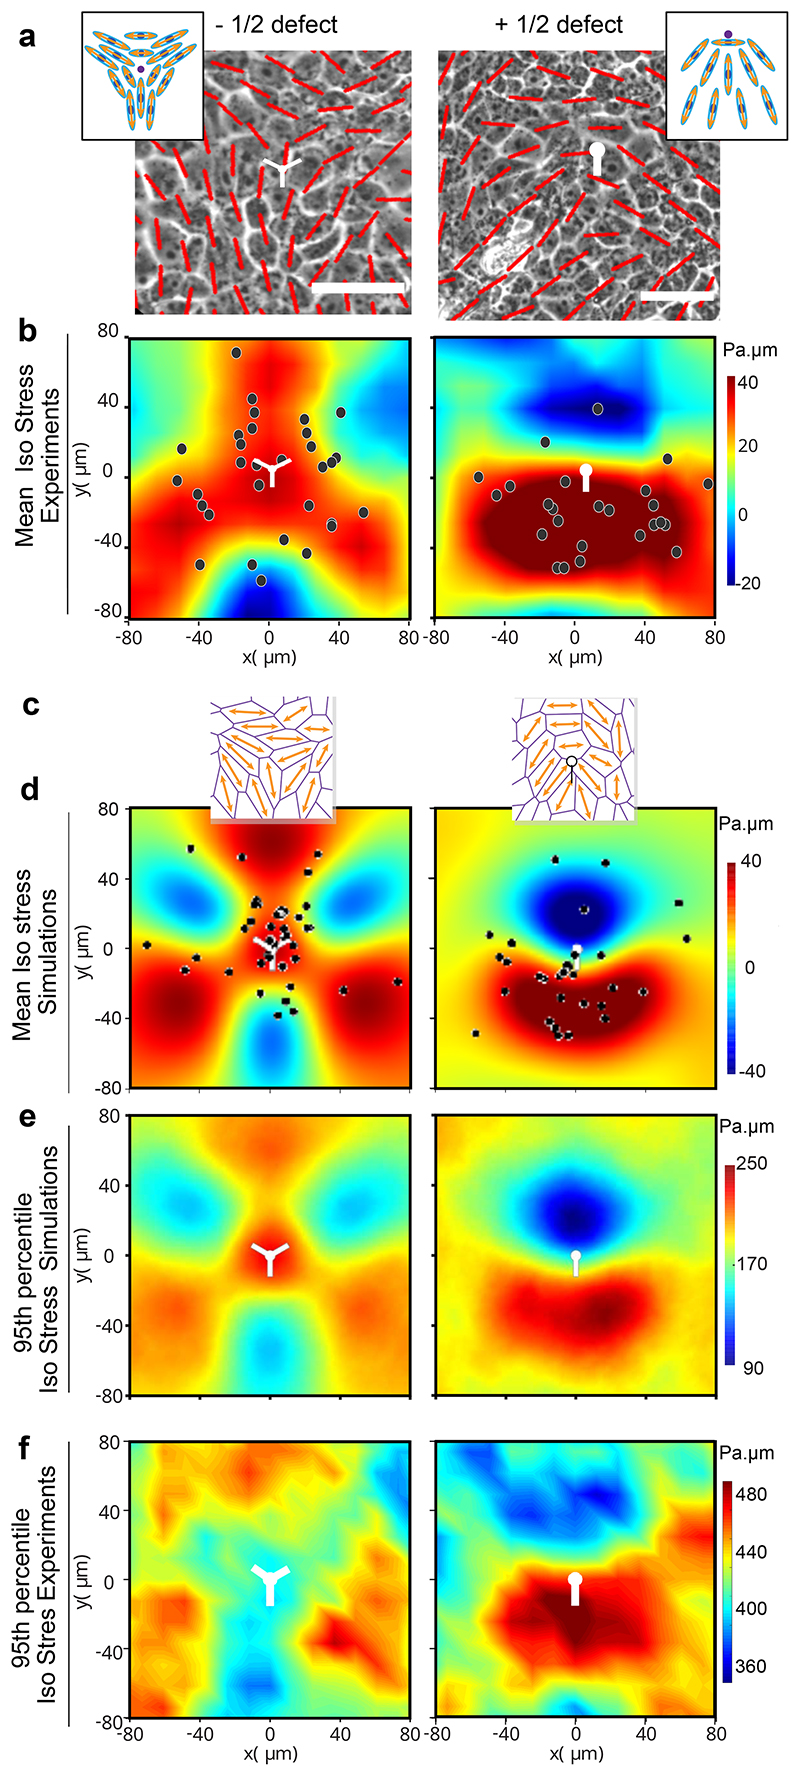
Fig. 4. Hole formation is triggered by tensile stresses around topological defects.
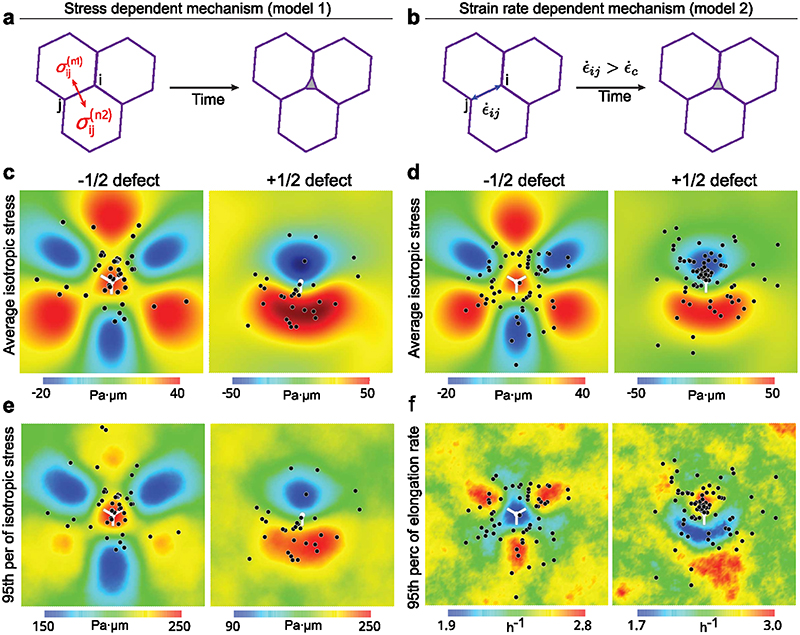
(a) Orientation field overlaid over phase contrast images obtained from experiments on soft (2.3kPa) gels representing -1/2 defect (left column) and +1/2 defect (right column). Scale bar: 50μm (b) Averaged isotropic stress overlaid with the location of holes in the frame of reference of the closest (left) -1/2 defect (n=2810 defects and n=35 holes) or (right) +1/2 defect (n=2924 defects and n=20 holes) obtained from experiments (c-f) Vertex model simulations (d) Averaged isotropic stress overlaid with the location of holes in the frame of reference of the closest (left) -1/2 defect (n=8555 defect and n=55 holes) or a (right) +1/2 defect (n=8553 defects and n=30 holes) (e, f) 95th percentile of isotropic stress around -1/2 defects (left) and +1/2 defects (right) obtained from vertex simulations (e) and experiments (f) The 95% percentile is the value such that 95% of the measured are below and 5% are above. White dots represent the defect core and scale bars represent limits of stress values in Pa.μm
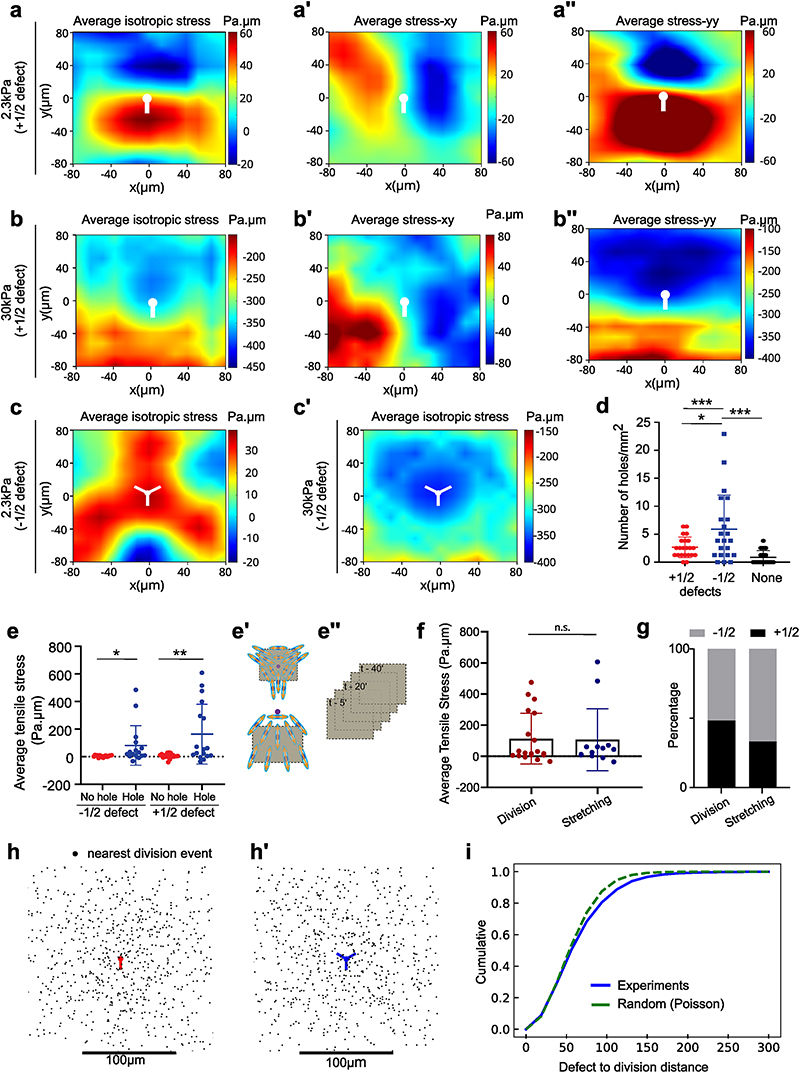
We then analyzed stress patterns around half-integer defects on soft and stiff surfaces. On soft surfaces, isotropic stress exhibited distinct patterns between -1/2 and +1/2 defects as it was tensile around -1/2 defects (Fig. 4b left) and compressive at the head portion and tensile at the tail end of a + 1/2 defect (Fig. 4b right)14. By contrast, stresses on stiff substrates were overall compressive at half-integer defects but less compressive at the tail of +1/2 defects than at its head (Extended Data Fig. 5a-c). Altogether, thus confirmed the distinct mechanical behaviors of epithelial monolayers on soft and stiff surfaces.
Having observed such differences in stress patterns around defects, we investigated the correlation between hole formation and defect location. We found that the holes formed around topological defects on soft gels, with 56±13% of holes initiated at locations within 100μm of a -1/2 nematic defect which were under tensile stress prior to hole initiation (Fig. 4b left, Extended Data Fig. 5d) while 38±19% holes were initiated within the tensile tail region of a +1/2 defect (Fig. 4b right, Extended Data Fig. 5d) and 6±6% of holes were initiated at non defect sites. Holes were significantly more likely to form at the tail of +1/2 defects than at their head, for a random process, the probability to observe as many or few holes within the head half plane is lower than 0.13%. We also observed higher tensile stresses around defects leading to hole formation than around defects not related to holes (Extended Data Fig. 5e) and the increased average tensile stresses showed same preference for cell-division and cell-stretching related holes (Extended Data Fig. 5f). In order to understand if these defects preferentially give rise to either a cell division or stretching based hole-formation we look at the correlation between defect formation and event that initiates hole formation. ~48±34% of division mediated holes were initiated at sites of +1/2 defects, while only ~33±28% of cell stretching mediated holes were initiated at +1/2 defect sites (Extended Data Fig. 5g). However, we found no correlations between the location of the defect core and the location of the nearest subsequent cell division (Extended Data Fig. 5h-I, Supplementary Video 10).
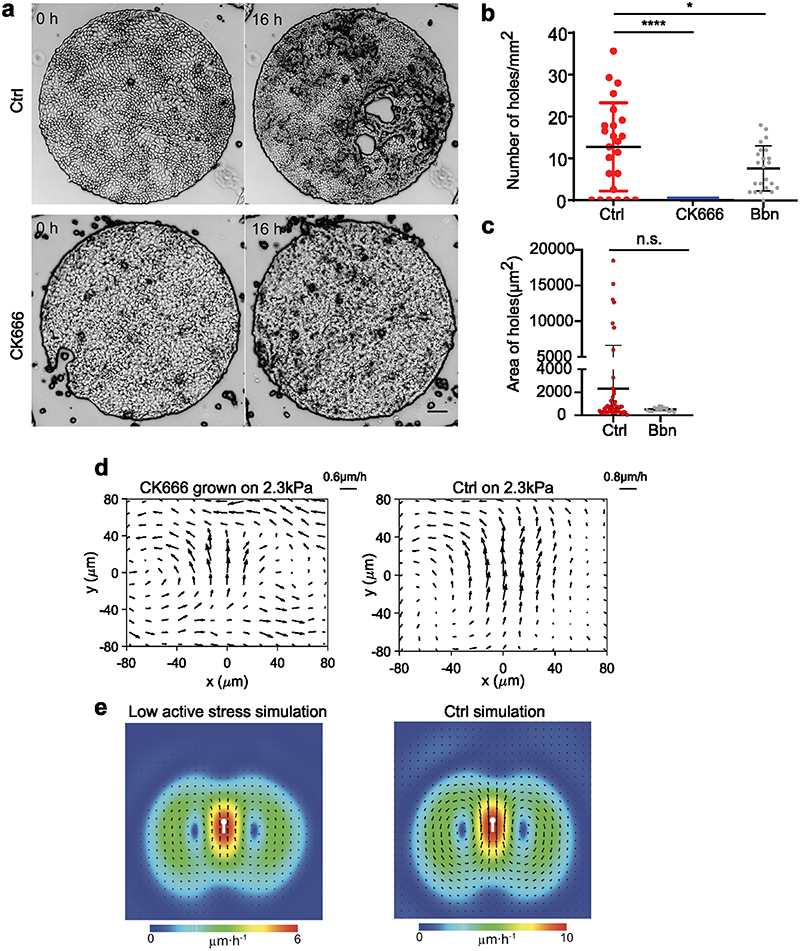
We used our cell-based vertex model to explore whether topological defects could underpin the large stresses needed to trigger hole opening. Indeed, as visible in Fig. 4a, the mean stress around the topological defect is at a maximum of 60 Pa.μm, significantly lower than the range of stresses observed to trigger hole opening (200-500 Pa.μm, Fig. 3j and Extended Data Fig. 5e).We utilized a recent method to generate cell-based nematic stresses61,62 that were oriented by the cell shape59,63,64 (SI I). We show that such cell-based active stresses lead to spontaneous tissue flows (Supplementary Video S11) with spontaneous generation of ±1/2 topological defects with average stress patterns that match those observed in experiments (Fig. 4c, d). We further found that the 95th upper percentile (Methods) of the isotropic stress, is in that range of values of stresses needed to create holes. Importantly, it exhibited the same pattern as mean stress both in simulations (Fig. 4d, e) and experiments (Fig. 4b, f). We, thereby, reduced the level of active stress level which led to a lower amplitude of stress fluctuations thereby suppressing hole formation in our simulations (SI). This is in qualitative agreement with our experiments where 50μM CK666 (inhibitor of actin polymerization) led to abrogation of hole formation (Extended Data Fig. 6a, b) and treatment with 20 μM blebbistatin (Myosin IIA inhibitor) led to reduced number of holes (Extended Data Fig. 6b, c), in spite of both blebbistatin14 and CK666 treatment maintaining extensile activity (Extended Data Fig. 6d, e).
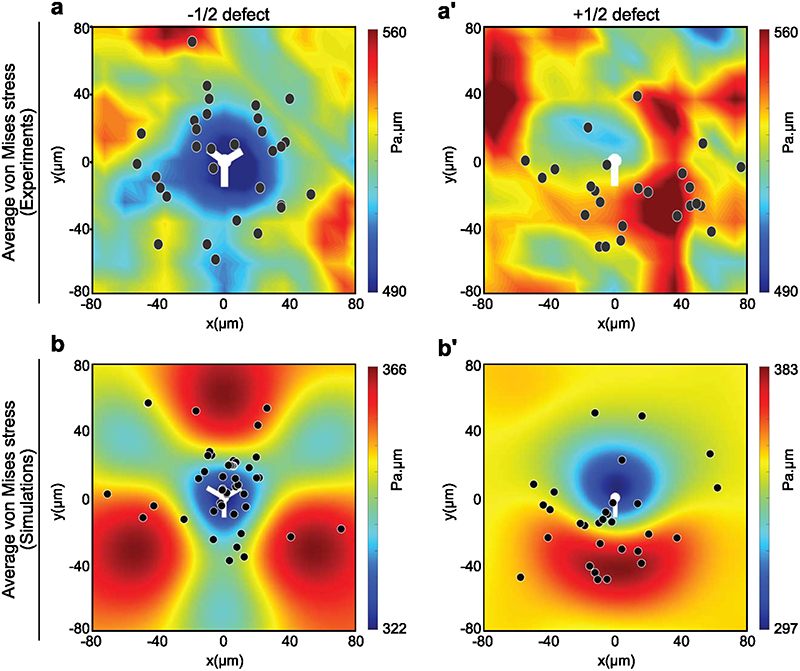
To further identify the mode of stress-mediated hole we validated our model prediction that regions of large shear stresses (as quantified through the Von-Mises criterium, Methods) were either not or anti-correlated to the location of hole opening (Extended Data Fig. 7). Hole opening is therefore a mode I (tension mediated) process according to classical terminology in material science65.
Here, the measured stress maps were obtained through coarse-graining over a few cell sizes. We utilized our cell-based simulation framework to study if stresses at a single cell-cell junction scale can initiate holes. Initiating holes by splitting a vertex into three, we investigated whether cell-cell junction ruptures could either be mediated (i) through normal stresses applied to cell-cell junction or (ii) by the junction elongation rate (Extended Data Fig. 8a, b). We found that only the normal stress hypothesis is consistent with holes forming in regions of extreme isotropic stresses (Extended Data Fig. 8c-f).
Altogether, these results show that the formation of holes is favored on soft surfaces (i) due to the overall tensile nature of the monolayer and (ii) near -1/2 defects or tail region of +1/2 defects due to a local amplification of normal tensile stresses.
Hole dynamics
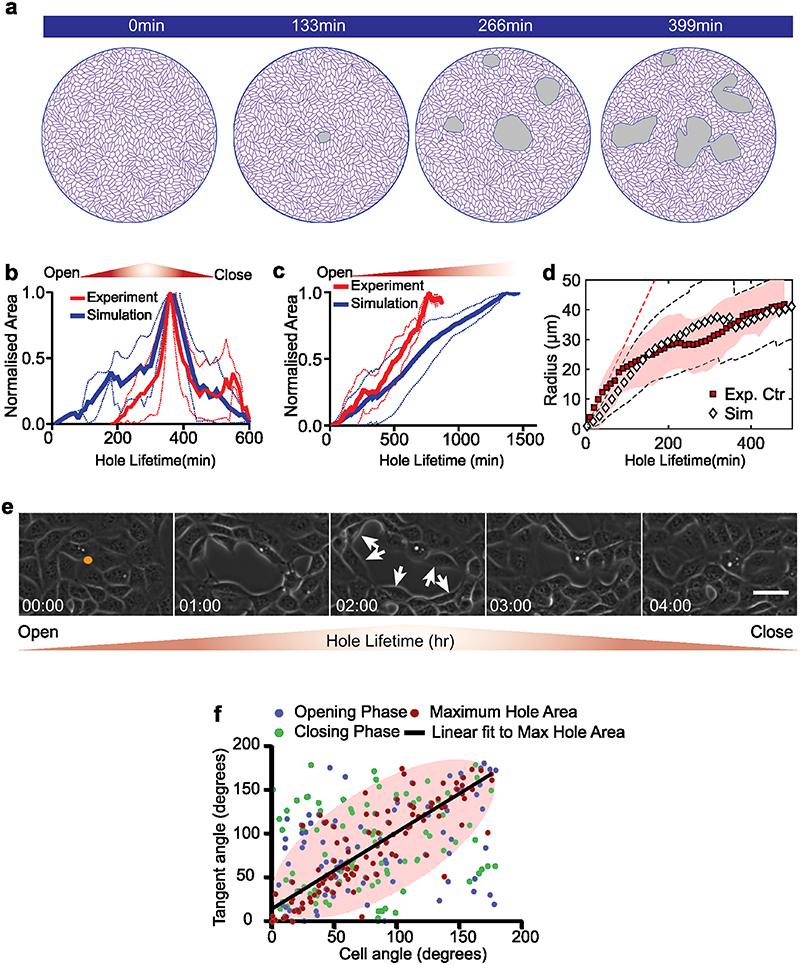
We then evaluated the dynamics of holes in our simulations using the same parameter set in Fig. 4 and Extended Data Fig. 9a. As in experiments, we identified short-lived holes with a lifetime < 5 hours (Fig. 2e, Extended Data Fig. 9a, Supplementary Video S12) and long-lived holes that stayed open for a longer duration (Fig. 2f, Extended Data Fig. 9b, Supplementary Video S12). On short times, hole growth was linear with a radial speed of (6.1 ± 0.1) x 10-3 μm/s (Extended Data Fig. 9c), leading to similar values as those reported by Beaune et al40 for spreading sarcoma cell aggregates (9 ± 0.5) x 10-3 μm/s).
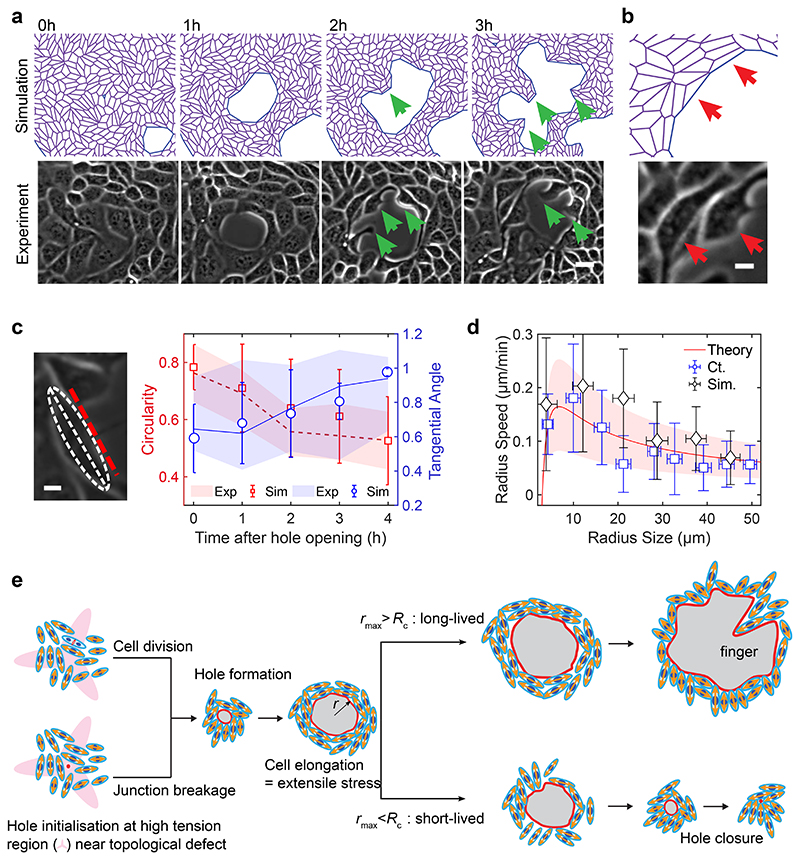
As holes grew and opened, they evolved from a circular to an irregular shape featuring finger-like structures (Fig. 5a, Extended Data Fig. 9a, e and Supplementary Video S12) both in simulations and experiments. Occasionally, such fingers could reach the other side of the hole and drive fission of a large hole into two smaller ones (Extended Data Fig. 9a, e and Supplementary Video S12) both in simulations and experiments. In addition, during the opening phase, cells at the periphery of hole became increasingly elongated and organized themselves tangentially at the margin of the hole both in simulations and experiments (Fig. 5b, c). This tangential organization continued until the hole reached its maximal area (Fig. 5c, Extended Fig. 9f). In contrast, closure of these holes was associated to a loss of tangential organization in both experiments and simulations (Extended Data Fig. 9a, e).
Fig. 5. Characterization of hole dynamics and cells around the hole.
(a) Finger-like projections (green arrows) formed along the hole periphery both in simulations (top) and experiments (bottom) (b) Elongation of cells around the hole obtained from simulations (top) and experiments (bottom) on soft (2.3kPa) gels (c) Morphometrics of cells along the hole periphery: circularity (red, defined as C = 4πA/P2, where A = area and P = perimeter; C = 1 for a circle) and tangential orientation (blue; cosine of the angle between the cell major axis and the tangent direction to the hole; 1 if parallel to the local hole tangent) obtained from experiments (n=14 circles from 2 independent experiments) and simulations (dashed/solid lines for the mean circularity/tangential direction. Shaded areas represent standard deviation, n = 10) (d) Rate of hole opening as a function of the hole size defined as in control experiments on soft 2.3kPa gels (mean: blue square; errorbar: half-variance; nexpt = 10 holes) and simulations (black diamond; errorbar: half-variance; nsim = 10 holes; soft case parameters, see SI) and the analytical expression Eq. (1) (solid red line for ξ = 50 Pa.μm-1.min; shaded red area in between ξ = 30 and ξ = 200 Pa.μm-1.min) (e) Schematic representing the process of hole opening. Orange arrows represent extensile activity of each particle, red spots the location of hole opening and red line represents hole boundary
We propose a simplified coarse-grained model to fit the hole dynamics and the existence of short and long-lived holes (SI, section II). The hole opening rate is determined by a mechanical balance between (i) the local tissue tension around the hole σ, (ii) a resisting line tension, denoted by γ (amount of mechanical work required to create a new free interface within the tissue), along with stresses associated to cell elongation around the hole, denoted by ζΔq where Δq quantifies the local elongation field within a nematic layer of width λ around the hole and (iii) a bulk viscous dynamic within the monolayer hole. Our analytical prediction for hole opening rate (SI, section II) reads
| (Equation 1) |
with ≈ γ — λζΔq a renormalized tension and = 𝜉 ln (2l/r), where l = a hydrodynamic length expressed in terms of the cell-substrate friction and the monolayer viscosity η. Equation (1) leads to a typical nucleation size Rc ≈ /σ; for r < Rc, holes spontaneously close while for a hole of radius r > Rc holes would tend to grow in agreement with the observation of small (resp. large) holes being short-lived (resp. long-lived). Fits of the control experiments based on Eq. (1) are consistent with σ = 500 Pa.μm, ≈ 1.5 kPa.μm2 and = 50 Pa.μm-1.min (with I =1000 μm), Fig. 5d. We also compare our vertex model result with Eq. (1) and find an increase of the hole opening rate with the exerted activity stress, see (SI). We recapitulated the key features of our model in Fig. 5e.
Conclusion
In vivo failure of adherens junctions24,66, polarity67, increased mechanical load23 and post-apoptotic failure in sealing68,69 leads to hole formation in tissues. During morphogenesis, hole formation is not only essential for Drosophila peripodium elongation21 but is also crucial for macrophage invasion during Drosophila development8. In addition loss of epithelial integrity has been reported under pathophysiological conditions70,71, immune cell72 and tumor extravasation73. Since tissue integrity and barrier function74,75 are known to be altered by substrate stiffness, our study shows distinct mechanical states of epithelial tissues are triggered by substrate stiffness which in turn modify tissue integrity. Epithelial monolayers grown on soft substrates exhibit the formation of holes in the bulk of the tissues at locations of high tensile stresses.
The emergence of holes within these monolayers relies on an unanticipated behavior of cellular monolayers, being under tension on soft and weak compression on stiff substrates. We found that tension, rather than shear, drives the loss of epithelial integrity. Tension has been attributed to tissue tear in suspended monolayers17, stretched monolayer76, peripodium elongation21, gaps in monolayer of neural progenitor cells77 and in migrating organisms19. Our results so far show that reduced substrate adhesion in combination with tensile nature of monolayers on soft substrates make them sensitive to local increase in tension, resulting in spontaneous hole formations. These tensile stresses arise from the formation of topological defects and hole formation is initiated within the tensile regions of those defects. Importantly, hole formation through high tensile stresses are favored by cell division events or cell stretching mechanism where the assembly of new junctions or the weakening of cell-cell junctions act as weak points.
Theoretical approaches, corroborated by experiments, predict that hole formation relies on the formation of topological defects where cells experience high tensile normal stresses along cell-cell junctions. We anticipate that our mechanistic in vitro study will bring new perspectives to understand morphological changes of epithelial tissues as well as the maintenance of their integrity during development and morphogenetic events.
Material and Methods
Patterned surfaces on polyacrylamide (PA) gels
Glass coverslips were plasma activated and coated with 0.1mg/ml PLL-g-PEG (SuSoS Technology). Using a quartz mask, circles of 1mm diameter were patterned on the passivated glass coverslips and incubated with 5 or 20μg/ml fibronectin for 30 min. After incubation, glass coverslips were rinsed in 1x PBS to remove excess protein. Simultaneously, silanization of another set of glass coverslips were performed by plasma activation of clean coverslips and then incubated with an ethanol solution containing 2% (v/v) 3-(trimethoxysilyl) propyl methacrylate (Sigma-Aldrich, St Louis, Missouri, USA) and 1% (v/v) acetic acid. The silanised coverslips were then heated at 120°C. Freshly made Polyacrylamide (PA) mix was sandwiched between the patterned glass coverslip and silanized coverslip. Polyacrylamide mix was made as suggested in Plotnikov et al78. After polymerization, the patterned coverslips were peeled off to reveal the patterns of protein on PA gels. Samples were kept hydrated with 1x PBS until cell seeding.
Cell culture and reagents used
MDCK WT (ATCC CCL-34), stably transfected actin GFP and E-cadherin GFP MDCK cells (kind gift from James Nelson’s lab) and Caco2 cells were cultured in 4.5 gl-1 DMEM containing 10% FBS (20% for Caco2) and 1% Penicillin-Streptavidin (Gibco, Thermo Fischer Scientific, Waltham, MA, USA). 100μl cell culture media containing 100,000 cells was seeded on the PA gels for 1 hour. 2 ml fresh media was added into the sample without washing to prevent detachment of loosely attached cells. Samples were imaged the following day once they spread and reached confluency. In some experiments to study the effect of blocking cell division, cells were treated with 10μg/ml of mitomycin-C (Sigma-Aldrich, St Louis, Missouri, USA) for 1 hour and washed prior to imaging. 100μM CK666 (Sigma Aldrich) was added prior to imaging for Arp 2/3 inhibition experiments.
Immunostaining and antibodies used
Samples were fixed with 4% paraformaldehyde (Thermo Fischer Scientific, Waltham, MA, USA) for 10 mins and permeabilized with 0.5% Triton-X for 5 mins. Cells were then blocked with 1% BSA/PBS and incubated with primary antibody overnight. Cells were incubated in secondary antibody for 1 hour and then mounted on another glass coverslip using Mowiol 40-88 (Sigma-Aldrich). For immunostaining, the following primary antibodies were used, E-cadherin (24E10- Cell Signaling Technology; DECMA1- Sigma Aldrich, ECCD2, Takara Bio) (1:100) and paxillin (Abcam, Ab32084) (1:100) vinculin was a gift from Glukhova lab (1:2). Anti-mouse, anti-rat, and anti-rabbit secondary antibodies conjugated with Alexa (488 or 568) (used at 1:200 dilution), phalloidin (1:20) were purchased from Life Technologies and Hoechst (Thermo Fisher, 1:10000). The fixation was slightly altered to stain vinculin at cell–cell junctions and focal adhesions. Cells were fixed with a mix of 4% PFA and 0.5% Triton-X 100 for 90 seconds, followed by fixation with 4% PFA for 10 min.
Traction force microscopy
PA gels were embedded with 200nm fluorescent beads (Life Technologies, Paisley, UK) during polymerization. The samples were imaged on Biostation IM-Q (Nikon) for 24 hours after which 1ml of 10x SDS was added to the sample in order to obtain the resting position of beads.
Differential fibronectin coating on PA gels
Differential coating of fibronectin was performed using Primo® (Alveole). Glass coverslips were passivated with double coating of 0.1% w/v poly-L-Lysine (PLL) for 30 min and 100mg/ml poly (ethylene glycol) succinimidyl valerate (PEG-SVA) for 1 hour. After washing the glass coverslip carefully with water, they were patterned with evenly spaced grey circular patterns (100μm diameter, 500μm apart) using a UV beam with an energy dosage of 600mJ/mm in presence of a photoinitiator, PLPP (Alveole). After patterning, the sample was washed with 1x PBS and incubated with 20μg/ml fibronectin for 10 min. Excess protein was washed away with 1x PBS and the rest of the unpatterned space (while covering the patterned area with black masks) was exposed to UV beam with an energy of 600mJ/mm using a white pattern. Newly exposed surface was incubated with 50μg/ml fibronectin (Sigma Aldrich) and 1μg/ml cy3-conjugated fibronectin for 10 min. PA gel was casted after washing off excess protein. As mentioned previously, patterned glass coverslip was removed from the sandwich to reveal the patterns on PA gels.
Imaging
Phase contrast long-term imaging of samples was performed with 10x objective on Olympus inverted microscope (IX81). Traction force microscopy was performed on Biostation IM-Q (Nikon) with a 10x objective. Imaging was done for 24 hours with frame rate of 0.2frames/min. Fluorescent cells were imaged on Zeiss spinning disk confocal (CSU X1) using 40x water objective. To follow the actin dynamics, Actin-GFP MDCK cells were imaged at a frame rate of 0.5frames/min for 12 hours. Fixed samples were imaged with 63x Oil objective on Zeiss Confocal microscope (LSM 710).
Laser ablation experiments
Wound induction (by ablating a cell) on monolayer tissue of density of about 3000-3500 cells per mm2 was done on a Nikon A1R MP laser scanning confocal microscope with Nikon CFI Apo LWD Lambda S 40XC WI/1.15 water-immersion objective. After about 10 s of imaging at 1 s interval for a total duration of 5 mins, an ultraviolet laser (355 nm, 3-5 ns pulse duration, 1-15 Hz repetition rate, Minilite II, High Energy Nd:YAG, Amplitude Laser) was focused on the center of the monolayer within the region of interest for 1 s at a laser power of 450 nW at the back aperture of the objective. The recoil velocity was measured by manually detecting cell edges over time and plotting the change in perimeter of the ablated region.
Data analysis
Images were prepared using ImageJ and analysis was done with the plugins and home-written macros on ImageJ and MATLAB. Cross-sectional views of the tissue were represented by Imaris. E-cadherin and vinculin intensities were measured by manually drawing a line over the junction and measuring the intensity at cell-cell contacts. Similarly, paxillin size was measured by manual segmenting paxillin molecules obtained from immunostaining and size determination on ImageJ.
Junctional straightness was calculated as a ratio between Euclidean length (measured by drawing a straight line from one end to another) and actual length of cell-cell junctions identified by the E-cadherin staining.
Areal probability was obtained by specifying the position of hole and identifying the number of defects within a given r from this position and dividing the total number of defects by area of the given region.
Cell segmentation
Cell segmentation and division tracking shown in Supplementary Movie 4 was manually corrected using Cellpose79 with an erosion with a 3x3 square pixel kernel applied to each mask; we used btrack80 for the cell tracking. Manual corrections were performed using the Napari software (46 lineage for the soft case, 42 for the stiff case)81. Figure 1f is obtained through a standard method in spatial statistics82: if the nearest division (with the 50min time window prior to the hole initiation date) is located further away from the hole than the boundary of the image, the hole is not considered in the statistics of Fig. 1f. Comparison to the random case if achieved by considering a Poisson process of parameters matching the total number of cell division observed during the movie.
Nematic analysis
In our experiments, nematic detection analysis was done on both untreated and mitomycin-C-treated samples at low density as cells tend to be more isotropic at higher densities and form 3D structures making it hard to identify the cell shape. Orientation field and defect detection was carried out as previously described14. Briefly, the orientation of cells was obtained using the OrientationJ plugin on ImageJ83 where the largest eigenvector of the structure tensor was obtained for each pixel thereby giving us the orientation. The local nematic order parameter tensor Q (averaged over 1-2 cells) (52 μm) was then calculated. The largest eigenvalue of Q was taken to the orientation of 2-3 cells and overlaid over phase contrast images as a red line. Based on this orientation, winding number parameter84,85, was used to identify +1/2 and -1/2 defects. In order to reduce noise, we only identify defects that stable over 60min, we obtain the orientation of 1-2 cells. Defect detection was compared against previous studies60. The MSD and lifetime of defects were obtained by using TrackMate plugin in ImageJ86. In the Supplementary Material, we show the robustness of our topological defect analysis. The 95th percentile is the value below which 95% of scores in the isotropic stress (or the von Mises stress) field frequency distribution falls.
Velocity measurements, strain rate, traction force and stress analysis
Velocities of the monolayer were obtained through Particle Image Velocimetry (PIV) analysis using PIVlab87 on MATLAB. Interrogation window of size 41x41μm (strain rate) and 21x21 μm (monolayer) with an overlap of 50% was used for analysis and the outlier vectors were manually removed. Having identified the location of defects, we obtain the average velocity field around defectsd identified by realigning these defects. The strain rate around these defects was calculated from the gradient of the velocity field as = Δv. By plotting the velocity around +1/2 defect, we can characterize the system as an extensile or contractile system.
For force measurements, firstly the reference bead image was concatenated with the bead images containing cells such that the reference frame precedes the bead image with cells. The images were then stabilized using Image Stabilizer plugin in ImageJ (written by Kang Li, CMU) to correct with xy drift following which the intensity correction was applied on these images. The velocities of bead movement were obtained using PIV analysis. Using the FTTC plugin88, we obtain traction force fields from bead velocities using a regularization parameter of 9 x 10⁻⁹. Using the traction force fields, stress in the monolayer is obtained using Bayesian Inversion Stress Microscopy (BISM)52 where an unconfined boundary condition was used to obtain stresses. The isotropic stress is defined as half of the stress tensor trace ((σxx + σyy)/2). Besides the isotropic stress, we also checked the von Mises stress, which is a scalar invariant value of a stress tensor and defined as . Using the traction force fields, stress in the monolayer is obtained using Bayesian Inversion Stress Microscopy (BISM)52 where an unconfined boundary condition was used to obtain stresses14. As a consequence, we systematically ignored stress values obtained close to the domain boundaries, and considered only stresses in the central part of the domain (previously validated using numerical data14). The heatmaps obtained for strain rate and stress were smoothed through linear interpolation. Tensile hotspots detection was based on the time needed for the stress to change sign over an interrogation window of 26x26 or 51x51 μm as stated in the legends.
Statistical correlation analysis of cell division and topological defects
For each annotated cell division event, we measured the distance to its closest topological defect, ri. Based on these measured hole-defect distance data {ri}, we compute the areal probability where H(·) is the Heaviside step function and r ranges from r = 10 μm to r = 70 μm spaced by Δr = 20 μm. Further, to distinguish the areal probability from random events, a set of random point was generated according to a Poisson spatial process with identical intensity as the detected cell divisions. The random areal probabilities in Extended Figure i was averaged over n = 10 different Poisson process realizations.
Vertex-based active nematic model
Please refer to Supplementary Information I
Statistics
Statistical analysis of all the data sets were performed by the student t-tests.
Extended Data
Extended Data Fig. 1. Hole formation is a dynamic process influenced by cell division.
(a) Number of holes formed on unconfined and confined monolayers on 2.3kPa and 55kPa gels. (For confined, n2.3kPa= 23 and n55kPa =15. For unconfined n2.3kPa= 19 and n55kPa=19, ****p < 0.0001) (b) Hole formation in PA gels (2.3kPa) evenly coated with fibronectin. Fibronectin coating before and after the hole formation does not change. (Scale: 50 μm) (c) Representative image of hole formation due to cell stretching on soft (2.3kPa) gels (Scale: 10 μm) (d) Illustration of hole formation after a cell division event (Scale: 5 μm). Red line represents the division axis, green line, hole major axis and yellow dots the location of hole formation (e) Angle of division axis in degree with respect to the hole major axis (n = 20 holes from 3 independent experiments) on soft (2.3kPa) gels. Green line represents major axis of the hole and red line the division axis (f) Probability distribution as a function of distance from a newly nucleated hole to the nearest cell division within 25mins of hole nucleation on soft (2.3kPa) gels, blue, experiments (n = 14 holes), green, simulation with cell divisions at random locations (identical number of divisions as in experiments) (g) Representative immunostaining images of EdU positive cells on 2.3 kPa and 55 kPa gels (h) Percentage of cells stained positive for EdU (marker of proliferation) on 2.3 kPa and 55kPa gels (n2.3kPa= 4 and n55kPa = 4 on 2 independent experiments, *p < 0.05) (i) Number of holes formed in a circular monolayer of MDCK (n = 33 different circles) and Caco2 (n = 17 different circles, *p < 0.05) on soft (2.3kPa) gels from 2 independent experiments (j, k) Change in perimeter as a function of time for (j) short-lived (n = 35 holes from 3 independent experiments) and (k) long-lived holes (n = 9 holes from 3 independent experiments) on soft (2.3kPa) gels. Solid lines represent mean and error bars the standard deviation.
Extended Data Fig. 2. Rigidity alters focal adhesions but not cell-cell adhesions.
(a) Number of holes formed/mm2 on different concentration of fibronectin coated samples (n2.3kPa-5μg=17, n2.3kPa-20μg=23, n55kPa-5μg=23, n55kPa-20μg=15; ***p < 0.001). (b) Paxillin staining for focal adhesions formed within a MDCK monolayer on 2.3kPa (top) and 55kPa (bottom). Inset shows the zoomed image of the representative focal adhesions. (Scale: 5 μm) (c) Length (n = 69 from 2 independent experiments circles; ***p <0.001) and (d) area (n = 50 from 2 independent experiments; ***p < 0.001) of focal adhesion on 2.3kPa and 55kPa gels. (e, f, g) Immunostaining of actin (green) and paxillin (magenta) on monolayers grown on glass at low (top) and high (bottom) density and the (f, g) quantification of area (f) and length (g) of paxillin at these two different densities for n=30 focal adhesions. Scale: 20μm (h) E-cadherin localization at junctions on 2.3kPa and 55kPa gels. (Scale: 10μm) (i) Mean intensity plot of E-cadherin localization at junctions (n = 30 from 2 independent experiments) (j) Averaged E-cadherin intensity of new junctions formed after a cell division event on soft (2.3kPa) and stiff (55kPa) gels for n=33 division events from 2 independent samples for each condition. (k) Averaged E-cadherin intensity over time just before hole formation on soft (2.3kPa) gels (n=12 junctions from 2 independent experiments). (l) Immunostaining of vinculin (red) and actin (green) of monolayers grown on soft (2.3kPa) and stiff (50kPa) gels. (m) Quantification of vinculin intensity at cell junctions obtained from n2.3kPa=151 and n55kPa=166 junctions from 2 independent experiments. Solid lines represent mean and error bars standard deviation.
Extended Data Fig. 3. Cell-substrate adhesion and tissue stress contributions in hole lifetime.
(a) Vertex-model for the differential fibronectin experiment (as Figure 3a), where a circular spot with a lower friction (green) region (10% of the friction in the rest of the tissue) mimics an area of low fibronectin concentration. (b) Probability distribution of isotropic stress per cell in the low friction region (green) as compared to rest of the tissue region (blue). Value of the isotropic stress in the spot with respect to rest of the tissue: mean = 87 Pa.μm (resp. 37 Pa.μm). 95th percentile value = 397 Pa.μm (resp. 240 Pa.μm) obtained from 10 independent simulations, n = 85,715 cells within the spot and n = 422,347 cells in the rest of the tissue. Simulation parameters are specified in Table 1, SI. (c) Average traction force magnitude in MDCK unconfined monolayers (n = 102 time averaged for n2.3kPa = 11 different circles & n = 112 time averaged for n30kPa= 11 different circles; **p < 0.05 from 2 independent experiments). (d) Traction force quiver overlaid on phase contrast images for soft (2.3kPa, top) and stiff (30kPa, bottom) gels. Scale: 100μm (e) Average isotropic stress for no-hole regions of unconfined monolayer on 2.3kPa and 30kPa PA gels. Green dashed line represents 0 Pa-μm on the y-axis (For unconfined, n2.3 = 12 & n30 = 12 different circles obtained from 2 independent experiments) (f-g) Divergence of the velocity field and traction forces overlaid on phase contrast images on 2.3kPa gel prior to hole formation where white dot indicates location of hole formation. (h) Representative graphs of evolution in the hole area (red) and averaged local isotropic stress (black) around the hole initiation site as a function of the time where t=0 indicates hole initiation on soft (2.3kPa) gels. (i) E-cadherin localization at junctions around the hole and within the monolayer. (Scale: 10 μm) (j) Junctional straightness (ratio between Euclidean and actual lengths) around the holes and within the monolayer (n=35 different circles; ***p < 0.001) on soft (2.3kPa) gels. Error bars represent standard deviation.
Extended Data Fig. 4. Hole formation around defects from experiments.
(a) Averaged number of defects on soft and stiff gels obtained from n2.3kPa = 6 circles for soft (2.3kPa) gels and n55kPa= 5 circles for stiff (55kPa) gels. (b) Average velocity flow field around +1/2 defects demonstrating the extensile nature of MDCK monolayers on soft (2.3kPa) gels (n=2646 defects) and stiff (30kPa) gels (n=2765 defects) obtained from experiments. (c) MSD of +1/2 and -1/2 defects on both soft and stiff gels (n=15 defects for -1/2 defects and +1/2 defects on 55kPa and n=17 defects for +1/2 defects on 2.3kPa gels). (d) Lifetime of random tensile regions on both soft (2.3kPa) and stiff (30kPa) regions obtained from TFM for n=30 regions (****p < 0.0001)
Extended Data Fig. 5. Defect mediated tensile stress and its association with hole formation.
(a, b) Averaged isotropic stress, averaged stress xy (a’, b’) and averaged stress yy (a”, b”) around +1/2 defects on soft (2.3kPa) gels (a, a’, a”) (n = 2924 defects) and stiff (30kPa) gels (b, b’, b”) (n = 3632 defects) from 2 independent experiments. (c, c’) Averaged isotropic stress around -1/2 defects on (c) soft (2.3kPa) gel (n = 2810 defects) and (c’) stiff (30kPa) gels (n = 3716 defects) from 2 independent experiments. White dots indicate the location of the defect core. (d) Number of holes per mm2 that are triggered by each defect type in the preceding frame in comparison to regions where defects do not lead to hole formation (n=20 circles from 4 independent experiments; *p < 0.01, ***p < 0.001). Error bars represent standard deviation. (e) Averaged peak isotropic stress around a region of 25.6x25.6μm obtained from a random defect that does not lead to a hole site and defects that lead to hole formation (n-1/2 random no-hole and hole=16, n+1/2 random and hole=17; *p < 0.01, **p < 0.05) from 3 independent experiments. While a region around the defect centre was averaged for -1/2 defects, for +1/2 defects stresses were averaged in the tail region of the defect. Error bars represent standard deviation. As shown in (e’) a region around the defect centre was averaged for -1/2 defects, for +1/2 defects stresses were averaged in the tail region of the defect. Peak areal averaged stress within a time frame of 20-40 minutes prior to hole formation was obtained as shown in (e”). Error bars represent standard deviation. (f) Average tensile stress around defect that leads to cell division or stretching related hole formation (ncell_div = 19, nstretching = 13) (g) Percentage of +/- 1/2 linked division and stretched cell linked hole formation on 2.3kPa gels from 4 independent experiments. Error bars represent standard deviation. (h-h’) Scatter plot in the location of the nearest cell division (with the cell separation detected in the next frame) to (h) a +1/2 defect and (h’) a +1/2 defect. The spatial pattern displays no bias towards a particular region of space, as in the case of a random distribution of points. (i) cumulative distribution, which highlights the difference between the two distributions; relatively minor differences arise at large distances (100-150 microns).
Extended Data Fig. 6. Activity and tension drives hole formation.
(a) Inhibition of arp2/3 by 100 μM CK666 treatment prevents hole formation on 2.3 kPa gels (Scale: 100 μm) (b) Number of holes/mm2 under control, CK666 and blebbistatin (5μM) treated samples averaged over n=33 for control, n = 24 for CK666 and n=23 for blebbistatin (****p < 0.0001) (c) Area of holes formed under control (n=49) and 5μM blebbistatin treated (n=14) samples (d) Averaged velocity profile around +1/2 defects with CK666 treatment (left) (nCK666=2294) and WT (right) (nWT=2646) monolayers on soft (2.3kPa) gels (e) Simulations with a lower active stress (left; n = 4750 defects) as compared to the control case (right; n = 8553 defects, soft gel set of parameters, Table 1 SI).
Extended Data Fig. 7. Maps of the average von Mises stress near half-integer topological defects.
(a, a’) Experiments: (a) -1/2 defects (n = 2810); (a’) +1/2 defects (n = 2924), from N = 2 independent experiments. (b, b’) Simulations: (b) -1/2 defects (n = 8555); (b’) +1/2 defects (n = 8553, N = 2 independent simulations, soft gel case set of parameters, see Table 1 SI). White dots represent centre of the defects and black dots the sites of hole formation.
Extended Data Fig. 8. Stress maps and hole opening locations near topological defects.
(a, b) Sketches of the two mechanisms of hole initiation: (a) stress dependent mechanism (model 1) and (b) strain rate dependent mechanism (model 2). (c-f) Comparisons of maps of hole opening locations near half-integer topological defects: (c, e) model 1 and (d, f) model 2. The black spots indicate the locations of opening holes. The 95th percentile is the value below 95% of cellular isotropic stress (or the junctional elongation rate) field frequency distribution falls. Domain size = 200μm. These simulations were generated for tension initial conditions (soft gel case, see Table 1 SI).
Extended Data Fig. 9. Lifetime of holes and cell organization around hole periphery.
(a) Time-lapse of a typical tissue-scale vertex model simulation (b,c) Time dependent change in hole area normalized over maximum area of the hole for simulation of (b) short-lived holes (<5hr) (n = 9 different simulations) and (c) long-lived holes (n = 9 different simulations) (d) Evolution in the estimated hole radii in experiments, mean (red squares) ± standard deviation (red shaded area) and simulations, mean (black diamonds) ± standard deviation (black dashed lines); n=14 in experiments and n=10 in simulations. (e) Time-lapse of a typical opening and closing process on soft (2.3kPa) gels. (f) Cell alignment along the tangent of the hole obtained from experiments is highly co-related during the maximum hole area. Scatter plot between cell angle and tangent angle shows the distribution during hole opening phase (blue dots), maximum hole area (red dots) and hole closing phase (green dots). A linear line (black line) fits to the maximum hole area distribution with a Pearson’s co-efficient, r = 0.83 and slope = 0.877. Majority of the maximum hole area data falls inside the pink ellipsoid area showing the small spread of their distribution.
Supplementary Material
Acknowledgements
This work was supported by the European Research Council (Grant No. Adv-101019835 to BL), LABEX Who Am I? (ANR-11-LABX-0071 to BL and RMM), the Ligue Contre le Cancer (Equipe labellisée 2019 to BL and RMM), and the Agence Nationale de la Recherche (“MechanoAdipo” ANR-17-CE13-0012 to BL, “Myofuse” ANR-19-CE13-0016 to BL, ANR-20-CE30-0023 to JFR) and France 2030, the French Government program managed by the French National Research Agency (ANR-16-CONV-0001) and from Excellence Initiative of Aix-Marseille University - A*MIDEX. We acknowledge the ImagoSeine core facility of the IJM, member of IBiSA and France-BioImaging (ANR-10-INBS-04) infrastructures. LB has received funding from the European Union’s Horizon 2020 research and innovation programme (Marie Sklodowska-Curie grant agreement 665850-INSPIRE), La Ligue Contre le Cancer and EMBO Postdoctoral Fellowship. We also thank the members of the “Cell Adhesion and Mechanics” team, Matthieu Piel, Francois Gallet, Delphine Delacour, Marc-Antoine Fardin and Sham Tlili for insightful discussions.
Footnotes
Author Contributions
S.S., L.B., R.M.M. and B.L. designed the research, S.S., L.B., Y.M.Y.I. and C.J. performed experiments, S.Z.L., J.F.R. and J.P. developed the theoretical vertex and analytical model, S.S., L.B. analysed data with help from I.P.J, M. K. helped with segmentation, Y.T. participated in discussions, P.M. provided the BISM code and helped with the analysis, S.S., L.B., S.Z.L., J.F.R., R.M.M. and B.L wrote the paper, J.F.R., R.M.M. and B.L. oversaw the project. All authors read the manuscript and commented on it.
Code Availability Statement
Codes used in this manuscript will be available upon request.
References
- 1.Ladoux B, Mège R-M. Mechanobiology of collective cell behaviours. Nature Reviews Molecular Cell Biology. 2017;18:743–757. doi: 10.1038/nrm.2017.98. [DOI] [PubMed] [Google Scholar]
- 2.Campinho P, et al. Tension-oriented cell divisions limit anisotropic tissue tension in epithelial spreading during zebrafish epiboly. Nat Cell Biol. 2013;15:1405–1414. doi: 10.1038/ncb2869. [DOI] [PubMed] [Google Scholar]
- 3.Heisenberg CP, Bellaïche Y. Forces in tissue morphogenesis and patterning. Cell. 2013;153:948. doi: 10.1016/j.cell.2013.05.008. [DOI] [PubMed] [Google Scholar]
- 4.Yu JC, Fernandez-Gonzalez R. Local mechanical forces promote polarized junctional assembly and axis elongation in Drosophila. eLife. 2016;5:e10757. doi: 10.7554/eLife.10757. [DOI] [PMC free article] [PubMed] [Google Scholar]
- 5.Lecuit T, Lenne P-F. Cell surface mechanics and the control of cell shape, tissue patterns and morphogenesis. Nature Reviews Molecular Cell Biology. 2007;8:633–644. doi: 10.1038/nrm2222. [DOI] [PubMed] [Google Scholar]
- 6.Low IIC, et al. Morphogenesis of neurons and glia within an epithelium. Development. 2019;146 doi: 10.1242/dev.171124. [DOI] [PMC free article] [PubMed] [Google Scholar]
- 7.Dumortier JG, et al. Hydraulic fracturing and active coarsening position the lumen of the mouse blastocyst. Science. 2019;365:465–468. doi: 10.1126/science.aaw7709. [DOI] [PubMed] [Google Scholar]
- 8.Akhmanova M, et al. Cell division in tissues enables macrophage infiltration. biorXiv. 2021;31 doi: 10.1101/2021.04.19.438995. [DOI] [PubMed] [Google Scholar]
- 9.Damms-Machado A, et al. Gut permeability is related to body weight, fatty liver disease, and insulin resistance in obese individuals undergoing weight reduction. Am J Clin Nutr. 2017;105:127–135. doi: 10.3945/ajcn.116.131110. [DOI] [PubMed] [Google Scholar]
- 10.Xiao C, et al. Defective epithelial barrier function in asthma. Journal of Allergy and Clinical Immunology. 2011;128:549–556.:e12. doi: 10.1016/j.jaci.2011.05.038. [DOI] [PubMed] [Google Scholar]
- 11.Soler AP, et al. Increased tight junctional permeability is associated with the development of colon cancer. Carcinogenesis. 1999;20:1425–1432. doi: 10.1093/carcin/20.8.1425. [DOI] [PubMed] [Google Scholar]
- 12.Eisenhoffer GT, et al. Crowding induces live cell extrusion to maintain homeostatic cell numbers in epithelia. Nature. 2012;484:546–549. doi: 10.1038/nature10999. [DOI] [PMC free article] [PubMed] [Google Scholar]
- 13.Trepat X, et al. Physical forces during collective cell migration. Nature Phys. 2009;5:426–430. [Google Scholar]
- 14.Saw TB, et al. Topological defects in epithelia govern cell death and extrusion. Nature. 2017;544:212–216. doi: 10.1038/nature21718. [DOI] [PMC free article] [PubMed] [Google Scholar]
- 15.Serra-Picamal X, et al. Mechanical waves during tissue expansion. Nature Physics. 2012;8:628–634. [Google Scholar]
- 16.Gayrard C, Bernaudin C, Déjardin T, Seiler C, Borghi N. Src-and confinement-dependent FAK activation causes E-cadherin relaxation and β-catenin activity. Journal of Cell Biology. 2018;217:1063–1077. doi: 10.1083/jcb.201706013. [DOI] [PMC free article] [PubMed] [Google Scholar]
- 17.Harris AR, et al. Characterizing the mechanics of cultured cell monolayers. PNAS. 2012;109:16449–16454. doi: 10.1073/pnas.1213301109. [DOI] [PMC free article] [PubMed] [Google Scholar]
- 18.Fouchard J, et al. Curling of epithelial monolayers reveals coupling between active bending and tissue tension. PNAS. 2020;117:9377–9383. doi: 10.1073/pnas.1917838117. [DOI] [PMC free article] [PubMed] [Google Scholar]
- 19.Prakash VN, Bull MS, Prakash M. Motility-induced fracture reveals a ductile-to-brittle crossover in a simple animal’s epithelia. Nat Phys. 2021;17:504–511. [Google Scholar]
- 20.Bull MS, Prakash M. Mobile defects born from an energy cascade shape the locomotive behavior of a headless animal. arXiv:210702940 [physics] 2021 [Google Scholar]
- 21.Proag A, Monier B, Suzanne M. Physical and functional cell-matrix uncoupling in a developing tissue under tension. Development. 2019;146 doi: 10.1242/dev.172577. [DOI] [PMC free article] [PubMed] [Google Scholar]
- 22.Carter JA, Hyland C, Steele RE, Collins E-MS. Dynamics of Mouth Opening in Hydra. Biophys J. 2016;110:1191–1201. doi: 10.1016/j.bpj.2016.01.008. [DOI] [PMC free article] [PubMed] [Google Scholar]
- 23.Maina JN, Jimoh SA. Structural failures of the blood-gas barrier and the epithelial-epithelial cell connections in the different vascular regions of the lung of the domestic fowl, Gallus gallus variant domesticus, at rest and during exercise. Biology Open. 2013;2:267–276. doi: 10.1242/bio.20133608. [DOI] [PMC free article] [PubMed] [Google Scholar]
- 24.Martin AC, Gelbart M, Fernandez-Gonzalez R, Kaschube M, Wieschaus EF. Integration of contractile forces during tissue invagination. Journal of Cell Biology. 2010;188:735–749. doi: 10.1083/jcb.200910099. [DOI] [PMC free article] [PubMed] [Google Scholar]
- 25.Benton MA, et al. Fog signaling has diverse roles in epithelial morphogenesis in insects. eLife. 2019;8:e47346. doi: 10.7554/eLife.47346. [DOI] [PMC free article] [PubMed] [Google Scholar]
- 26.Sunyer R, et al. Collective cell durotaxis emerges from long-range intercellular force transmission. Science. 2016;353:1157–1161. doi: 10.1126/science.aaf7119. [DOI] [PubMed] [Google Scholar]
- 27.Balcioglu HE, et al. A subtle relationship between substrate stiffness and collective migration of cell clusters. Soft Matter. 2020;16:1825–1839. doi: 10.1039/c9sm01893j. [DOI] [PubMed] [Google Scholar]
- 28.Chen T, et al. Large-scale curvature sensing by directional actin flow drives cellular migration mode switching. Nat Phys. 2019;15:393–402. doi: 10.1038/s41567-018-0383-6. [DOI] [PMC free article] [PubMed] [Google Scholar]
- 29.Lo C-M, Wang H-B, Dembo M, Wang Y. Cell Movement Is Guided by the Rigidity of the Substrate. Biophysical Journal. 2000;79:144–152. doi: 10.1016/S0006-3495(00)76279-5. [DOI] [PMC free article] [PubMed] [Google Scholar]
- 30.Nasrollahi S, et al. Past matrix stiffness primes epithelial cells and regulates their future collective migration through a mechanical memory. Biomaterials. 2017;146:146–155. doi: 10.1016/j.biomaterials.2017.09.012. [DOI] [PMC free article] [PubMed] [Google Scholar]
- 31.Barriga EH, Franze K, Charras G, Mayor R. Tissue stiffening coordinates morphogenesis by triggering collective cell migration in vivo. Nature. 2018;554:523–527. doi: 10.1038/nature25742. [DOI] [PMC free article] [PubMed] [Google Scholar]
- 32.Trichet L, et al. Evidence of a large-scale mechanosensing mechanism for cellular adaptation to substrate stiffness. Proceedings of the National Academy of Sciences. 2012;109:6933–6938. doi: 10.1073/pnas.1117810109. [DOI] [PMC free article] [PubMed] [Google Scholar]
- 33.Hadden WJ, et al. Stem cell migration and mechanotransduction on linear stiffness gradient hydrogels. PNAS. 2017;114:5647–5652. doi: 10.1073/pnas.1618239114. [DOI] [PMC free article] [PubMed] [Google Scholar]
- 34.Shellard A, Mayor R. Collective durotaxis along a self-generated stiffness gradient in vivo. Nature. 2021;600:690–694. doi: 10.1038/s41586-021-04210-x. [DOI] [PubMed] [Google Scholar]
- 35.Guo W, Frey MT, Burnham NA, Wang Y. Substrate Rigidity Regulates the Formation and Maintenance of Tissues. Biophysical Journal. 2006;90:2213–2220. doi: 10.1529/biophysj.105.070144. [DOI] [PMC free article] [PubMed] [Google Scholar]
- 36.Matte BF, et al. Matrix stiffness mechanically conditions EMT and migratory behavior of oral squamous cell carcinoma. J Cell Sci. 2019;132 doi: 10.1242/jcs.224360. [DOI] [PMC free article] [PubMed] [Google Scholar]
- 37.Seddiki R, et al. Force-dependent binding of vinculin to α-catenin regulates cell–cell contact stability and collective cell behavior. Molecular Biology of the Cell. 2018;29:380–388. doi: 10.1091/mbc.E17-04-0231. [DOI] [PMC free article] [PubMed] [Google Scholar]
- 38.Lafaurie-Janvore J, et al. ESCRT-III Assembly and Cytokinetic Abscission Are Induced by Tension Release in the Intercellular Bridge. Science. 2013;339:1625–1629. doi: 10.1126/science.1233866. [DOI] [PubMed] [Google Scholar]
- 39.Douezan S, et al. Spreading dynamics and wetting transition of cellular aggregates. Proceedings of the National Academy of Sciences of the United States of America. 2011;108:7315–7320. doi: 10.1073/pnas.1018057108. [DOI] [PMC free article] [PubMed] [Google Scholar]
- 40.Beaune G, et al. How cells flow in the spreading of cellular aggregates. PNAS. 2014;111:8055–8060. doi: 10.1073/pnas.1323788111. [DOI] [PMC free article] [PubMed] [Google Scholar]
- 41.Pelham RJ, Wang Y. Cell locomotion and focal adhesions are regulated by substrate flexibility. PNAS. 1997;94:13661–13665. doi: 10.1073/pnas.94.25.13661. [DOI] [PMC free article] [PubMed] [Google Scholar]
- 42.Saez A, Buguin A, Silberzan P, Ladoux B. Is the Mechanical Activity of Epithelial Cells Controlled by Deformations or Forces? Biophys J. 2005;89:L52–L54. doi: 10.1529/biophysj.105.071217. [DOI] [PMC free article] [PubMed] [Google Scholar]
- 43.de Rooij J, Kerstens A, Danuser G, Schwartz MA, Waterman-Storer CM. Integrin-dependent actomyosin contraction regulates epithelial cell scattering. J Cell Biol. 2005;171:153–164. doi: 10.1083/jcb.200506152. [DOI] [PMC free article] [PubMed] [Google Scholar]
- 44.Plotnikov SV, Pasapera AM, Sabass B, Waterman CM. Force Fluctuations within Focal Adhesions Mediate ECM-Rigidity Sensing to Guide Directed Cell Migration. Cell. 2012;151:1513–1527. doi: 10.1016/j.cell.2012.11.034. [DOI] [PMC free article] [PubMed] [Google Scholar]
- 45.Kocgozlu L, et al. Epithelial cell packing induces distinct modes of cell extrusions. Curr Biol. 2016;26:2942–2950. doi: 10.1016/j.cub.2016.08.057. [DOI] [PMC free article] [PubMed] [Google Scholar]
- 46.Andresen Eguiluz RC, Kaylan KB, Underhill GH, Leckband DE. Substrate stiffness and VE-cadherin mechano-transduction coordinate to regulate endothelial monolayer integrity. Biomaterials. 2017;140:45–57. doi: 10.1016/j.biomaterials.2017.06.010. [DOI] [PMC free article] [PubMed] [Google Scholar]
- 47.Yonemura S, Wada Y, Watanabe T, Nagafuchi A, Shibata M. α-Catenin as a tension transducer that induces adherens junction development. Nat Cell Biol. 2010;12:533–542. doi: 10.1038/ncb2055. [DOI] [PubMed] [Google Scholar]
- 48.Bays JL, DeMali KA. Vinculin in cell–cell and cell–matrix adhesions. Cell Mol Life Sci. 2017;74:2999–3009. doi: 10.1007/s00018-017-2511-3. [DOI] [PMC free article] [PubMed] [Google Scholar]
- 49.Alt S, Ganguly P, Salbreux G. Vertex models: From cell mechanics to tissue morphogenesis. Philosophical Transactions of the Royal Society B: Biological Sciences. 2017;372 doi: 10.1098/rstb.2015.0520. [DOI] [PMC free article] [PubMed] [Google Scholar]
- 50.Walcott S, Sun SX. A mechanical model of actin stress fiber formation and substrate elasticity sensing in adherent cells. PNAS. 2010;107:7757–7762. doi: 10.1073/pnas.0912739107. [DOI] [PMC free article] [PubMed] [Google Scholar]
- 51.Tawada K, Sekimoto K. Protein friction exerted by motor enzymes through a weak-binding interaction. J Theor Biol. 1991;150:193–200. doi: 10.1016/s0022-5193(05)80331-5. [DOI] [PubMed] [Google Scholar]
- 52.Nier V, et al. Inference of Internal Stress in a Cell Monolayer. Biophysical Journal. 2016;110:1625–1635. doi: 10.1016/j.bpj.2016.03.002. [DOI] [PMC free article] [PubMed] [Google Scholar]
- 53.Hannezo E, Prost J, Joanny J-F. Theory of epithelial sheet morphology in three dimensions. Proceedings of the National Academy of Sciences. 2014;111:27–32. doi: 10.1073/pnas.1312076111. [DOI] [PMC free article] [PubMed] [Google Scholar]
- 54.Burnette DT, et al. A role for actin arcs in the leading-edge advance of migrating cells. Nat Cell Biol. 2011;13:371–382. doi: 10.1038/ncb2205. [DOI] [PMC free article] [PubMed] [Google Scholar]
- 55.Hara Y, Shagirov M, Toyama Y. Cell Boundary Elongation by Non-autonomous Contractility in Cell Oscillation. Current Biology. 2016;26:2388–2396. doi: 10.1016/j.cub.2016.07.003. [DOI] [PubMed] [Google Scholar]
- 56.Kawaguchi K, Kageyama R, Sano M. Topological defects control collective dynamics in neural progenitor cell cultures. Nature. 2017;545:327–331. doi: 10.1038/nature22321. [DOI] [PubMed] [Google Scholar]
- 57.Maroudas-Sacks Y, et al. Topological defects in the nematic order of actin fibres as organization centres of Hydra morphogenesis. Nature Physics. 2021;17:251–259. [Google Scholar]
- 58.Blanch-Mercader C, et al. Turbulent Dynamics of Epithelial Cell Cultures. Phys Rev Lett. 2018;120:208101. doi: 10.1103/PhysRevLett.120.208101. [DOI] [PubMed] [Google Scholar]
- 59.Balasubramaniam L, et al. Investigating the nature of active forces in tissues reveals how contractile cells can form extensile monolayers. Nature Materials. 2021;20:1156–1166. doi: 10.1038/s41563-021-00919-2. [DOI] [PMC free article] [PubMed] [Google Scholar]
- 60.Duclos G, Erlenkämper C, Joanny J-F, Silberzan P. Topological defects in confined populations of spindle-shaped cells. Nature Physics. 2017;13:58–62. [Google Scholar]
- 61.Tlili S, et al. Shaping the zebrafish myotome by intertissue friction and active stress. PNAS. 2019;116:25430–25439. doi: 10.1073/pnas.1900819116. [DOI] [PMC free article] [PubMed] [Google Scholar]
- 62.Lin S-Z, Merkel M, Rupprecht J-F. Implementation of cellular bulk stresses in vertex models of biological tissues. Eur Phys J E. 2022;45:4. doi: 10.1140/epje/s10189-021-00154-2. [DOI] [PubMed] [Google Scholar]
- 63.Mueller R, Yeomans JM, Doostmohammadi A. Emergence of Active Nematic Behavior in Monolayers of Isotropic Cells. Phys Rev Lett. 2019;122:048004. doi: 10.1103/PhysRevLett.122.048004. [DOI] [PubMed] [Google Scholar]
- 64.Comelles J, et al. Epithelial colonies in vitro elongate through collective effects. eLife. 2021;10:e57730. doi: 10.7554/eLife.57730. [DOI] [PMC free article] [PubMed] [Google Scholar]
- 65.Anderson TL. Fracture Mechanics: Fundamentals and Applications. CRC Press; 2017. [DOI] [Google Scholar]
- 66.Classen AK, Anderson KI, Marois E, Eaton S. Hexagonal packing of Drosophila wing epithelial cells by the planar cell polarity pathway. Developmental Cell. 2005;9:805–817. doi: 10.1016/j.devcel.2005.10.016. [DOI] [PubMed] [Google Scholar]
- 67.Osswald M, et al. Apical constriction induces tissue rupture in a proliferative epithelium. Biorxiv. 2022:2022.03.02.482459. doi: 10.1101/2022.03.02.482459. [DOI] [Google Scholar]
- 68.Watson AJM, Duckworth CA, Guan Y, Montrose MH. Mechanisms of Epithelial Cell Shedding in the Mammalian Intestine and Maintenance of Barrier Function. Annals of the New York Academy of Sciences. 2009;1165:135–142. doi: 10.1111/j.1749-6632.2009.04027.x. [DOI] [PubMed] [Google Scholar]
- 69.Bullen TF, et al. Characterization of epithelial cell shedding from human small intestine. Laboratory Investigation. 2006;86:1052–1063. doi: 10.1038/labinvest.3700464. [DOI] [PubMed] [Google Scholar]
- 70.Weiss L, Ward PM. Cell detachment and metastasis. Cancer Metast Rev. 1983;2:111–127. doi: 10.1007/BF00048965. [DOI] [PubMed] [Google Scholar]
- 71.Gelman R, Stevenson W, Prospero Ponce C, Agarwal D, Christoforidis JB. Retinal damage induced by internal limiting membrane removal. Journal of Ophthalmology. 2015;2015 doi: 10.1155/2015/939748. [DOI] [PMC free article] [PubMed] [Google Scholar]
- 72.Escribano J, et al. Balance of mechanical forces drives endothelial gap formation and may facilitate cancer and immune-cell extravasation. PLOS Computational Biology. 2019;15:e1006395. doi: 10.1371/journal.pcbi.1006395. [DOI] [PMC free article] [PubMed] [Google Scholar]
- 73.Chen MB, Whisler JA, Jeon JS, Kamm RD. Mechanisms of tumor cell extravasation in an in vitro microvascular network platform. Integr Biol (Camb) 2013;5:1262–1271. doi: 10.1039/c3ib40149a. [DOI] [PMC free article] [PubMed] [Google Scholar]
- 74.Wang W, Lollis EM, Bordeleau F, Reinhart-King CA. Matrix stiffness regulates vascular integrity through focal adhesion kinase activity. The FASEB Journal. 2018;33:1199–1208. doi: 10.1096/fj.201800841R. [DOI] [PMC free article] [PubMed] [Google Scholar]
- 75.Mammoto A, et al. Control of lung vascular permeability and endotoxin-induced pulmonary oedema by changes in extracellular matrix mechanics. Nature Communications. 2013;4:1759. doi: 10.1038/ncomms2774. [DOI] [PubMed] [Google Scholar]
- 76.Casares L, et al. Hydraulic fracture during epithelial stretching. Nature materials. 2015;14:343–351. doi: 10.1038/nmat4206. [DOI] [PMC free article] [PubMed] [Google Scholar]
- 77.Kawaguchi K, Kageyama R, Sano M. Topological defects control collective dynamics in neural progenitor cell cultures. Nature. 2017;545:327–331. doi: 10.1038/nature22321. [DOI] [PubMed] [Google Scholar]
- 78.Plotnikov SV, Sabass B, Schwarz US, Waterman CM. High-Resolution Traction Force Microscopy. Methods in Cell Biology. 2014;123:367–394. doi: 10.1016/B978-0-12-420138-5.00020-3. [DOI] [PMC free article] [PubMed] [Google Scholar]
- 79.Stringer C, Wang T, Michaelos M, Pachitariu M. Cellpose: a generalist algorithm for cellular segmentation. Nat Methods. 2021;18:100–106. doi: 10.1038/s41592-020-01018-x. [DOI] [PubMed] [Google Scholar]
- 80.Bove A, et al. Local cellular neighborhood controls proliferation in cell competition. MBoC. 2017;28:3215–3228. doi: 10.1091/mbc.E17-06-0368. [DOI] [PMC free article] [PubMed] [Google Scholar]
- 81.Sofroniew N, et al. napari/napari: 031rc0. Zenodo; 2020. [DOI] [Google Scholar]
- 82.Baddeley A, Rubak E, Turner R. Spatial Point Patterns: Methodology and Applications with R. Chapman and Hall/CRC; 2015. [DOI] [Google Scholar]
- 83.Püspöki Z, Storath M, Sage D, Unser M. Transforms and Operators for Directional Bioimage Analysis: A Survey. Adv Anat Embryol Cell Biol. 2016;219:69–93. doi: 10.1007/978-3-319-28549-8_3. [DOI] [PubMed] [Google Scholar]
- 84.Vromans AJ, Giomi L. Orientational properties of nematic disclinations. Soft Matter. 2016;12:6490–6495. doi: 10.1039/c6sm01146b. [DOI] [PubMed] [Google Scholar]
- 85.DeCamp SJ, Redner GS, Baskaran A, Hagan MF, Dogic Z. Orientational Order of Motile Defects in Active Nematics. Nat Mater. 2015;14:1110–1115. doi: 10.1038/nmat4387. [DOI] [PMC free article] [PubMed] [Google Scholar]
- 86.Tinevez J-Y, et al. TrackMate: An open and extensible platform for single-particle tracking. Methods. 2017;115:80–90. doi: 10.1016/j.ymeth.2016.09.016. [DOI] [PubMed] [Google Scholar]
- 87.Thielicke W. PIVlab–Towards User-friendly, Affordable and Accurate Digital Particle Image Velocimetry in MATLAB. Journal of Open Research Software. 2014;2:30. [Google Scholar]
- 88.Tseng Q, et al. Spatial organization of the extracellular matrix regulates cell–cell junction positioning. PNAS. 2012;109:1506–1511. doi: 10.1073/pnas.1106377109. [DOI] [PMC free article] [PubMed] [Google Scholar]
Associated Data
This section collects any data citations, data availability statements, or supplementary materials included in this article.
Supplementary Materials
Data Availability Statement
Codes used in this manuscript will be available upon request.


