Abstract
Cancer-associated loss-of-function mutations in genes coding for subunits of the BRG1/BRM associated factor (BAF) chromatin remodeling complexes1–8 often cause drastic chromatin accessibility changes, especially in important regulatory regions9–19. However, it remains unknown how these changes are established over time (e.g. immediate consequences or long-term adaptations), and whether they are causative for intra-complex synthetic lethalities abrogating the formation or activity of BAF complexes9,20–24. Here, we use the dTAG system to induce acute degradation of BAF subunits and show that chromatin alterations are established faster than the duration of one cell cycle. Using a pharmacological inhibitor and a chemical degrader of the BAF complex ATPase subunits25,26, we show that maintaining genome accessibility requires constant ATP-dependent remodeling. Completely abolishing BAF complex function by acute degradation of a synthetic lethal subunit in a paralog-deficient background results in a near-complete loss of chromatin accessibility at BAF-controlled sites, especially at super-enhancers, providing a mechanism for intra-complex synthetic lethalities.
The conserved multiprotein BAF complexes comprise a catalytic ATPase, either SMARCA4 (BRG1) or SMARCA2 (BRM), and auxiliary subunits that are important for the targeting and function of the complexes27–31. These remodelers utilize the energy from ATP hydrolysis to slide or eject nucleosomes thereby altering DNA accessibility32–35. Consequently, they are highly important for genomic processes such as gene expression, where nucleosome position can influence the ability of transcription factors to bind to DNA. BAF complexes are known to be required for the accessibility of active regulatory regions, especially of enhancers and super-enhancers, which control cell type-specific gene expression programs9–19. Despite their relevance, we still lack a comprehensive understanding of the dynamics of BAF complex activities in mammals. Studies in yeast indicate rapid changes in chromatin accessibility and transcription following perturbations of Swi/Snf activity36,37, but cannot delineate cell-cycle dependence. In mammals, inducible targeting and washout strategies to investigate BAF complex dependent alterations at a single locus have also shown fast response38,39, but no genome-wide time-resolved investigation of BAF complex action has been reported. In order to investigate how chromatin accessibility is altered over time and which changes are directly driven by the loss of BAF subunits or after induction of a synthetic lethality, we here implement a system for immediate and target-specific degradation of endogenous BAF subunits in HAP1 wildtype or mutant cells40. Furthermore, we use compounds that inhibit and degrade the BAF ATPases to explore the acute alterations occurring at the induction of SMARCA4-SMARCA2 synthetic lethality. These approaches allow us to investigate BAF chromatin remodeling activity and associated chromatin alterations with high temporal resolution.
Results
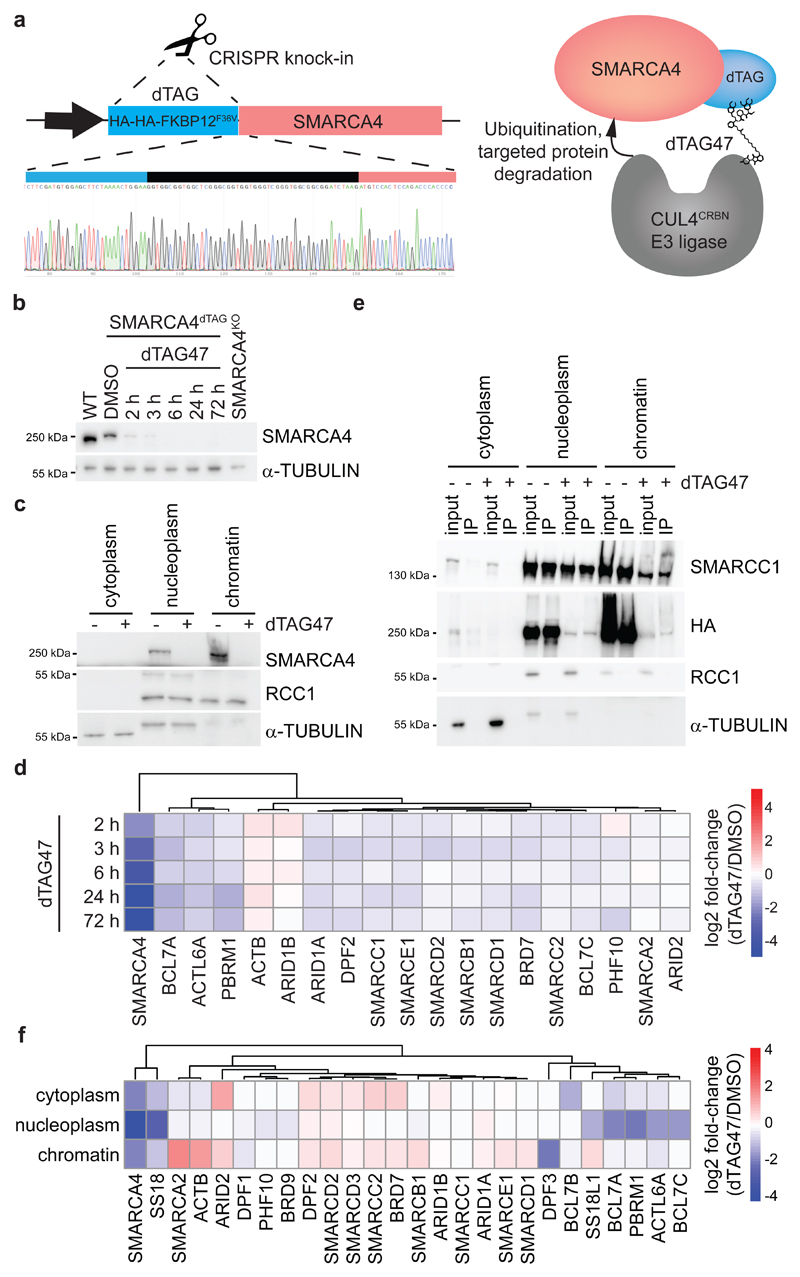
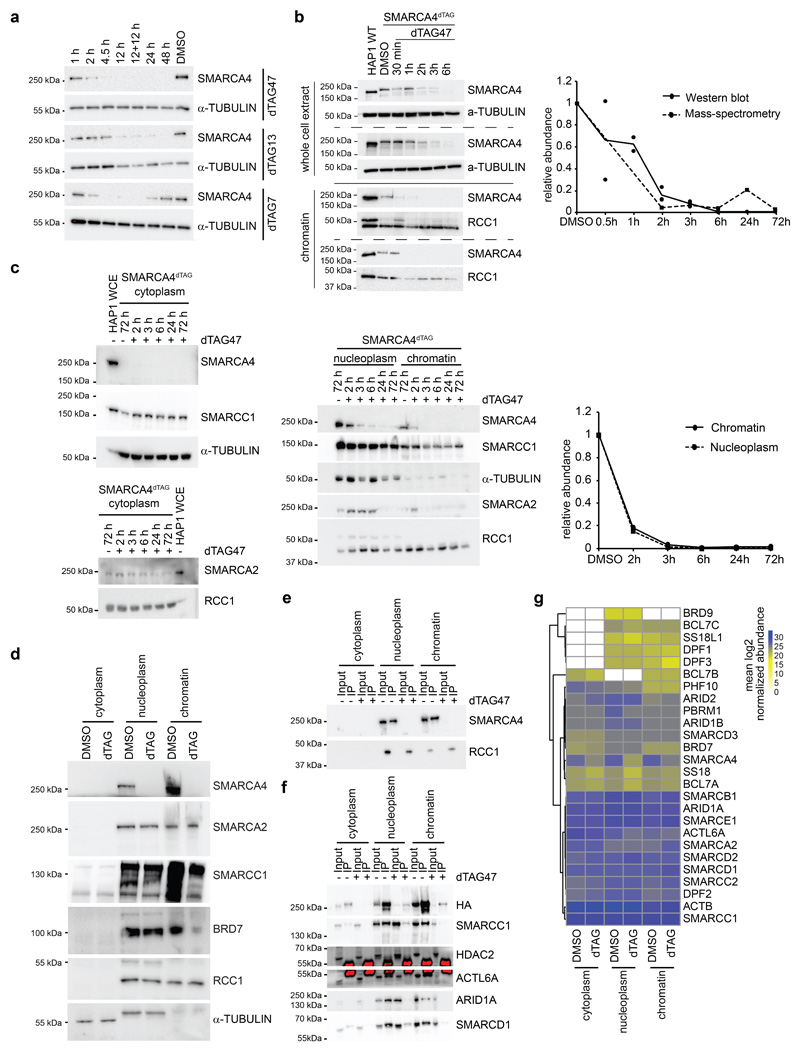
We applied the dTAG system40 to engineer HAP1 cells for targeted degradation of SMARCA4, the BAF subunit for which complete knock-out causes the strongest changes in chromatin accessibility9. To this aim, we knocked-in the dTAG into the endogenous SMARCA4 locus, generating a SMARCA4dTAG cell line that expresses a fusion of HA-HA-FKBP12F36V to the N-terminus of SMARCA4 (Fig. 1a). Compared to wild-type cells the SMARCA4dTAG clone showed decreased SMARCA4 expression (~50%) and some baseline alterations in chromatin accessibility and transcription, but was still responsive to further SMARCA4 perturbation (Supplementary Fig. 1). In the dTag system, the addition of heterobifunctional small molecules that induce proximity between the FKBP12F36V tag and the E3 ligase substrate receptor cereblon (CRBN) recruits the tagged protein for ubiquitination and subsequent degradation. We tested the chemical dimerizers dTAG7, dTAG13 and dTAG47, which differ in the linker between the two functional moieties, and observed compound-dependent SMARCA4 degradation dynamics (Extended Data Fig. 1a). The addition of the compound dTAG47 led to near-complete proteasomal degradation of the tagged subunit within two to three hours (Fig. 1b, Extended Data Fig. 1b), faster than alternative degrons41. The depletion was sustained over several days, and we therefore conducted subsequent kinetic studies following a single dTAG47 treatment. The degradation occurred both in nucleoplasm and on chromatin, where BAF complexes act (Fig. 1c, Extended Data Fig. 1c). Despite the structural proximity to other subunits, degradation was specific and only SMARCA4 was degraded over time, but not other members of the BAF complexes (Fig. 1d, Extended Data Fig. 1c,d). Co-immunoprecipitation confirmed that the dTAG did not interfere with BAF complex assembly as we found the tagged SMARCA4 to be incorporated in the complexes (Fig. 1e, Extended Data Fig. 1e). Tagged SMARCA4 co-precipitated BAF subunits, when performing pulldown with antibodies recognizing the HA tag (Extended Data Fig. 1f). This illustrates that targeting a specific subunit of a multi-protein complex for degradation with the dTAG system is feasible and specific. Fully assembled BAF complexes mostly form in the nucleus (Fig. 1e, Extended Data Fig. 1f), and in this compartment the induction of SMARCA4 degradation for 24 h caused changes in complex composition comparable to those observed in SMARCA4KO cells9. In particular, loss of SMARCA4 reduced BAF incorporation of its direct interaction partners ACTL6, BCL7, SS18 and PBRM1 especially in the nucleoplasm (Fig. 1f, Extended Data Fig. 1g). On chromatin we detected mainly fully assembled BAF complexes, in which SMARCA4 loss was compensated by increased incorporation of SMARCA2 (Fig. 1f).
Fig. 1. A dTAG knock-in HAP1 cell line for acute degradation of SMARCA4.
(a) Model of the dTAG system and validation of successful tagging of the SMARCA4 locus in HAP1 cells. (b) Kinetics of SMARCA4 loss following treatment of HAP1 SMARCA4dTAG cells with 300 nM dTAG47 or control DMSO as investigated by western blot analysis (cropped images). (c) Cropped western blot images confirming degradation of SMARCA4 in HAP1 SMARCA4dTAG cells in various cellular compartments. Cells were treated for 24 h with 300 nM dTAG47 or DMSO as control. (d) Proteomic analysis of nuclear extracts after various dTAG47 treatment times. Log2 fold-change of 300 nM dTAG47 versus DMSO treatment is shown for BAF members. (e) SMARCC1 immunoprecipitation in different cellular compartments with 300 nM dTAG47 or DMSO treatment for 24 h. Western blot analysis for different BAF subunits and the HA tag present on SMARCA4 (cropped images). (f) Proteomic results for BAF complex members after SMARCC1 immunoprecipitation in various cellular compartments 24 h after 300 nM dTAG47 or DMSO treatment. Log2 fold-change of dTAG47 versus DMSO is shown for BAF members. 0 = protein abundance below quantification noise threshold.
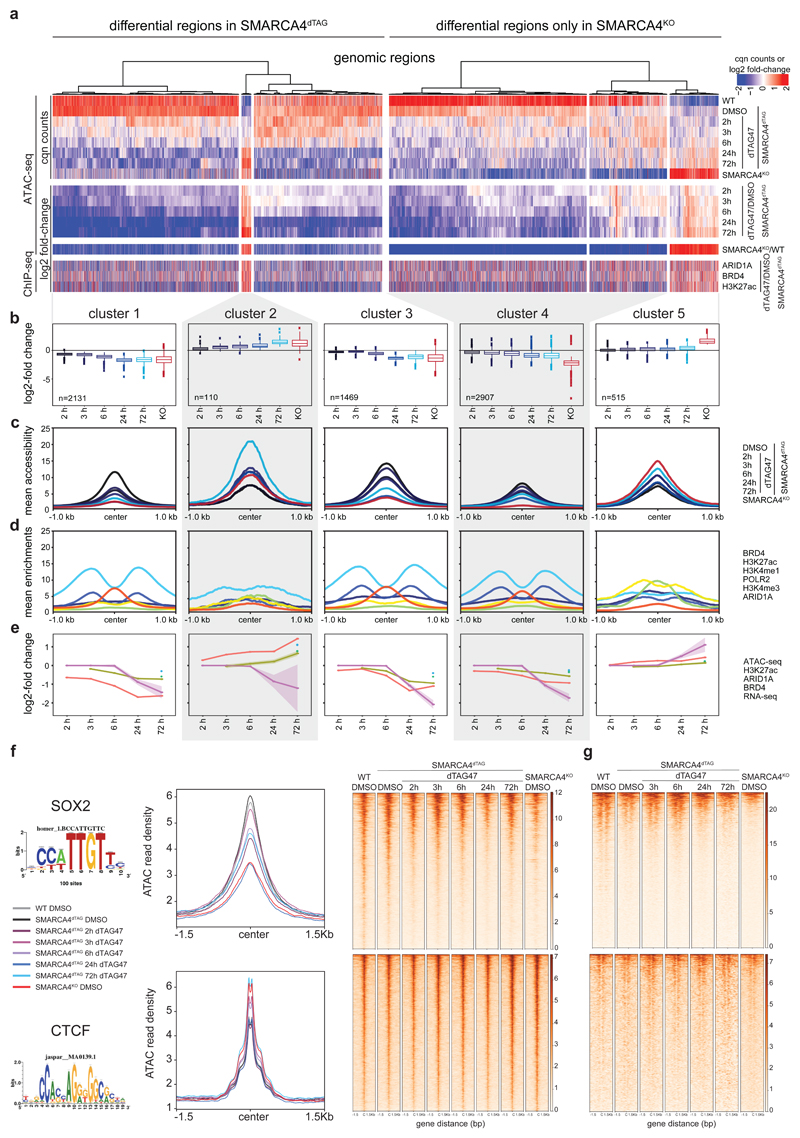
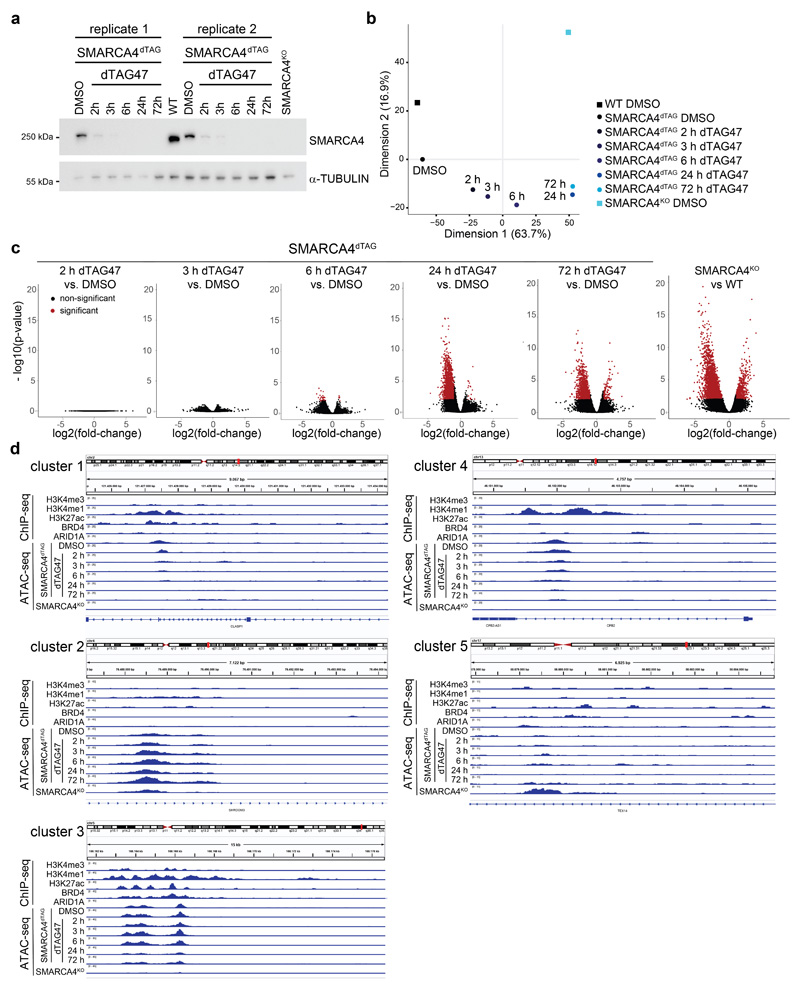
We next explored the chromatin accessibility changes over time following SMARCA4 degradation. To do so, we performed ATAC-seq (Assay for Transposase Accessible Chromatin using sequencing)42 in SMARCA4dTAG cells following dTAG47 treatment for 2, 3, 6, 24 or 72 hours. We then identified significantly changing regions compared to the same clone treated with control DMSO, and to DMSO-treated HAP1 wildtype (WT) and SMARCA4KO cells (Fig. 2a, Extended Data Fig. 2a-c). For most differential regions, we observed reduced chromatin accessibility over time (clusters 1 and 3), while only a few sites gained chromatin accessibility (cluster 2). Regions from cluster 1 lost chromatin accessibility faster than regions from cluster 3 (Fig. 2a-c, Extended Data Fig. 2d). For all three clusters, long-term changes are consistent with those observed in full SMARCA4KO cells. We further identified regions for which accessibility alterations were only significant in SMARCA4KO cells (clusters 4 and 5). While the changes for these regions do not reach significance at any time point of acute SMARCA4 depletion, at later time points a trend towards the state observed in SMARCA4KO cells is detected. These data suggest that the knock-out-specific regions of clusters 4 and 5 might possibly be indirectly controlled and may require SMARCA4 depletion for more than 72 h to reach the state present in SMARCA4KO cells.
Figure 2. SMARCA4 degradation leads to rapid genome-wide accessibility changes.
(a) Heatmap of significantly differential accessibility changes upon SMARCA4 degradation over time (left) and after SMARCA4 knock-out (right) compared to HAP1 wildtype cells. Hierarchical clustering was performed on the rows using Canberra distance and Ward’s hierarchical agglomerative clustering. ChIP signal for ARID1A, BRD4 and H3K27 acetylation after 72 h of SMARCA4 degradation is depicted for all regions (bottom). The color code corresponds to log2 fold-changes and column-wise Z-score of quantile normalized counts. (b) Boxplots of accessibility changes per cluster measured as log2 fold-change over time (n = 2 independent experiments). First and third quartiles are denoted by lower and upper hinges, center is median. The upper/lower whisker extendes to the largest/ smallest value no further than 1.5 × inter-quartile range. Data points beyond are plotted individually. (c) Mean accessibility of the differential regions per condition and cluster. (d) Mean enrichment of various factors and histone modifications at the regions of the different clusters as determined by ChIP-seq in HAP1 cells. (e) Line plots depicting median log2 fold-change and standard error of accessibility (ATAC-seq) and ChIP-signal of all regions per cluster over time. Also gene expression changes (RNA-seq) of associated differential genes are shown. The shaded areas display the standard error. (f) Mean accessibility changes at SOX2 and CTCF motifs in the ATAC consensus regions after SMARCA4 degradation over time. C = center (g) Changes in H3K27ac levels at SOX2 and CTCF motifs in the ATAC consensus regions after SMARCA4 degradation over time. C = center.
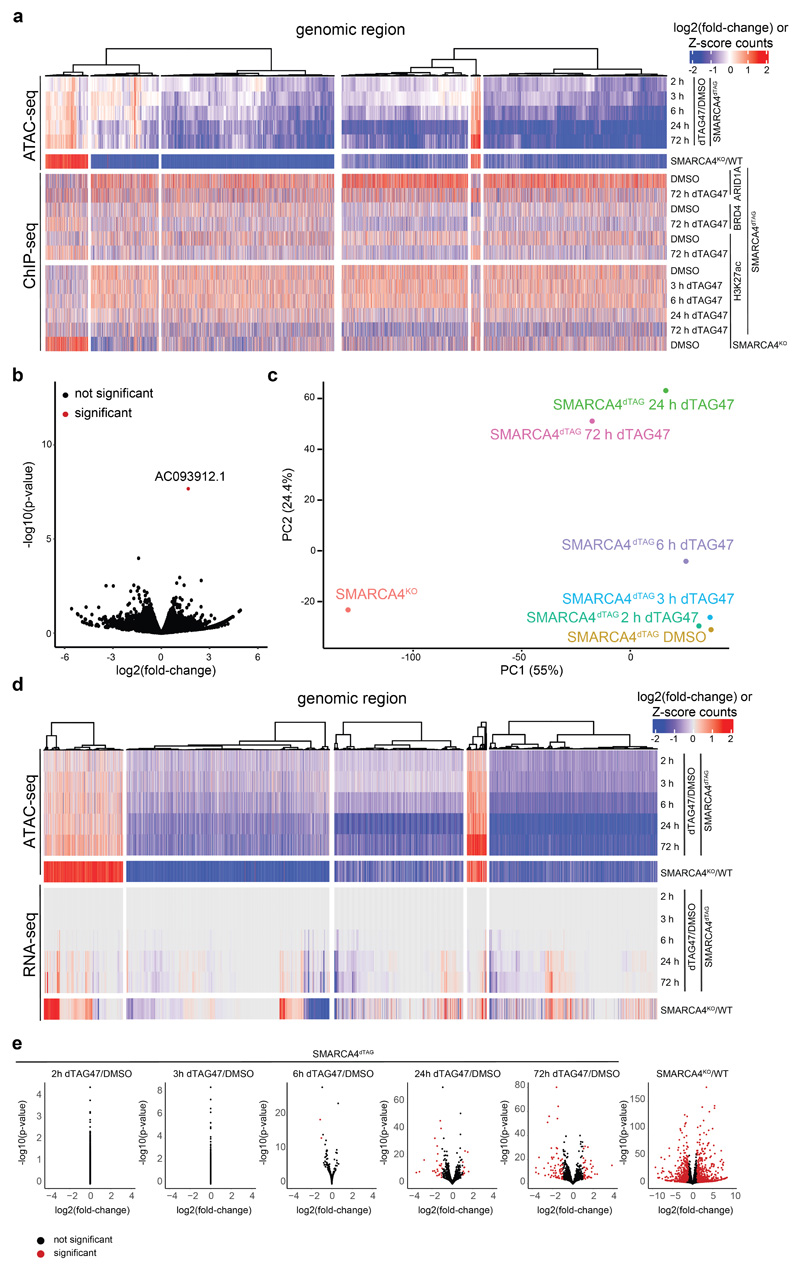
We then analyzed basal chromatin marks in the different clusters (Fig. 2d), and performed ChIP-seq analyses after induction of SMARCA4 degradation to investigate which chromatin alterations accompany the SMARCA4 loss at the differentially accessible sites (Fig. 2e). This revealed that ARID1A, a subunit of canonical BAF complexes representing the most abundant BAF subtype in HAP1 cells9, was less abundant 72 h after SMARCA4 degradation at sites that lost chromatin accessibility (Fig. 2a, Extended Data Fig. 3a). Histone H3 lysine 27 acetylation (H3K27ac), a histone modification found at active chromatin regions, followed the same trend, which was partially mimicked by the transcriptional co-activator BRD4 that is binding to this histone mark. Alterations in H3K27ac and in transcription lagged behind the changes in chromatin accessibility (Fig. 2e). When we measured nascent transcription 3 h after dTAG47 in comparison to DMSO treatment in SMARCA4dTAG cells using precision nuclear run-on sequencing (PRO-seq)43, we observed few changes in this time-frame (Extended Data Fig. 3b). Measuring gene expression by bulk RNA-seq across the whole time-course, we observed increasing numbers of differentially expressed genes at later time points (Extended Data Fig. 3c-e), with expression differences mainly following the accessibility changes (Fig. 2e).
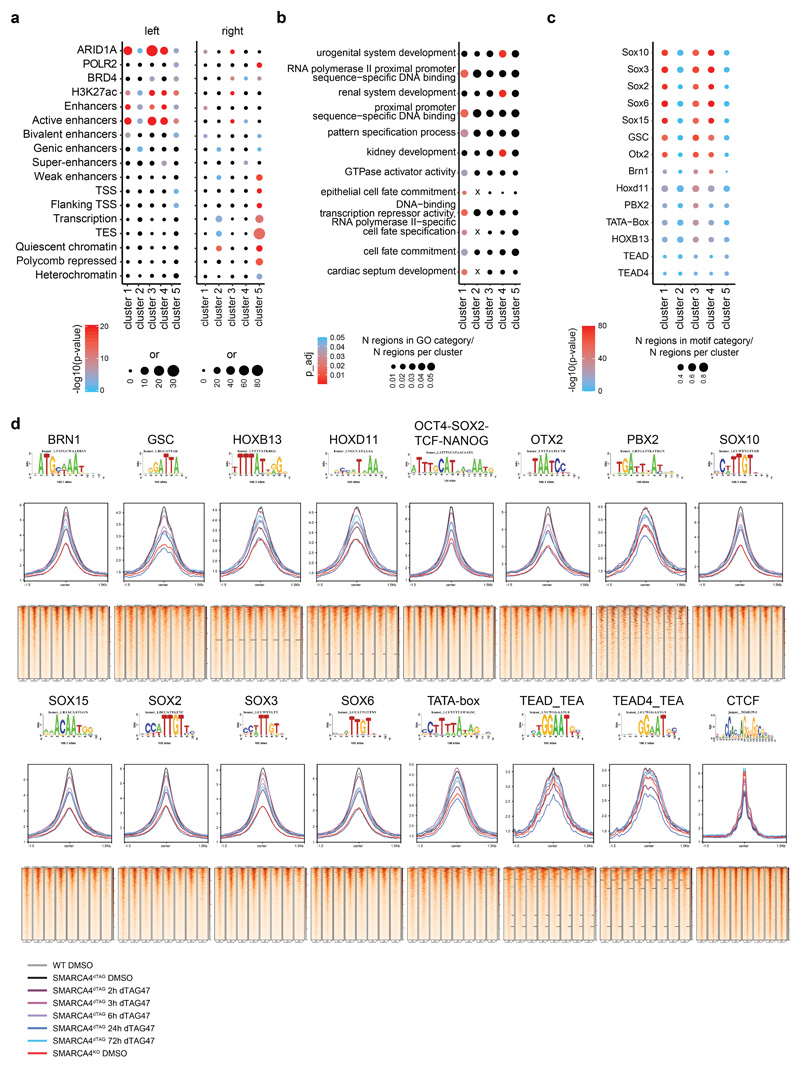
The sites that lost chromatin accessibility (clusters 1, 3 and 4) were primarily BAF-bound active enhancer regions, whereby the basal levels of H3K27ac were lower in the fast-changing cluster 1 (Fig. 2d, Extended Data Fig. 4a, Supplementary Fig. 2) and were enriched for cell fate and development gene ontology terms (Extended Data Fig. 4b). Motif analyses revealed strong enrichment for SOX factor motifs at the sites that last chromatin accessibility after SMARCA4 depletion (Extended Data Fig. 4c). These chromatin regions that contain the SOX2 motif showed a reduction of chromatin accessibility (Fig. 2f, Extended Data Fig. 4d) and H3K27ac (Fig. 2g) over time. In contrast, this was not the case at CTCF-binding sites.
Overall, our data indicate that loss of SMARCA4 leads to rapid chromatin accessibility changes as a direct consequence of losing the ATPase subunit, which then result in further chromatin alterations including epigenetic marks and co-factor binding.
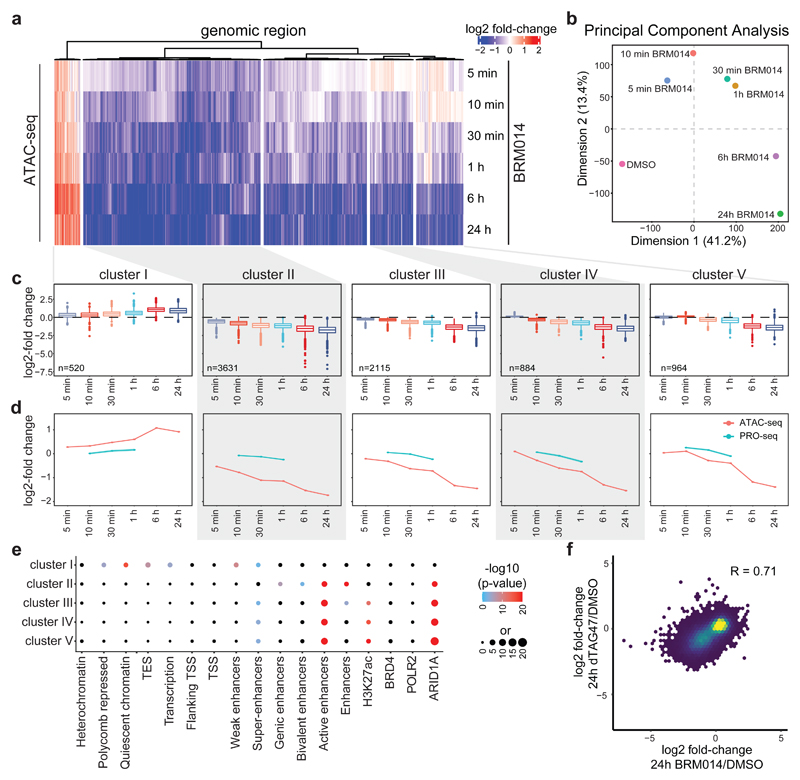
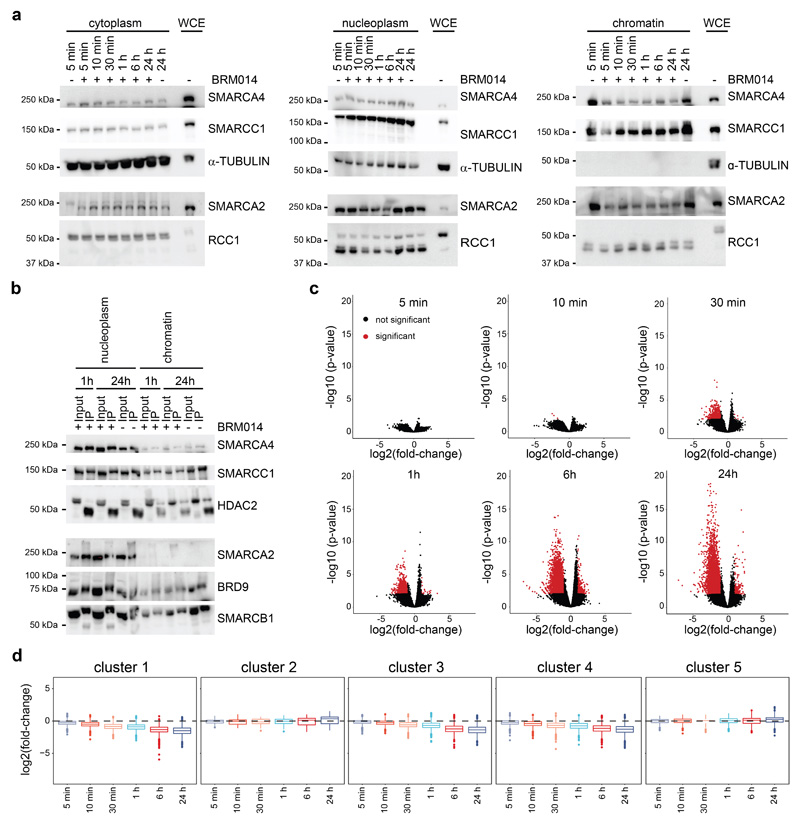
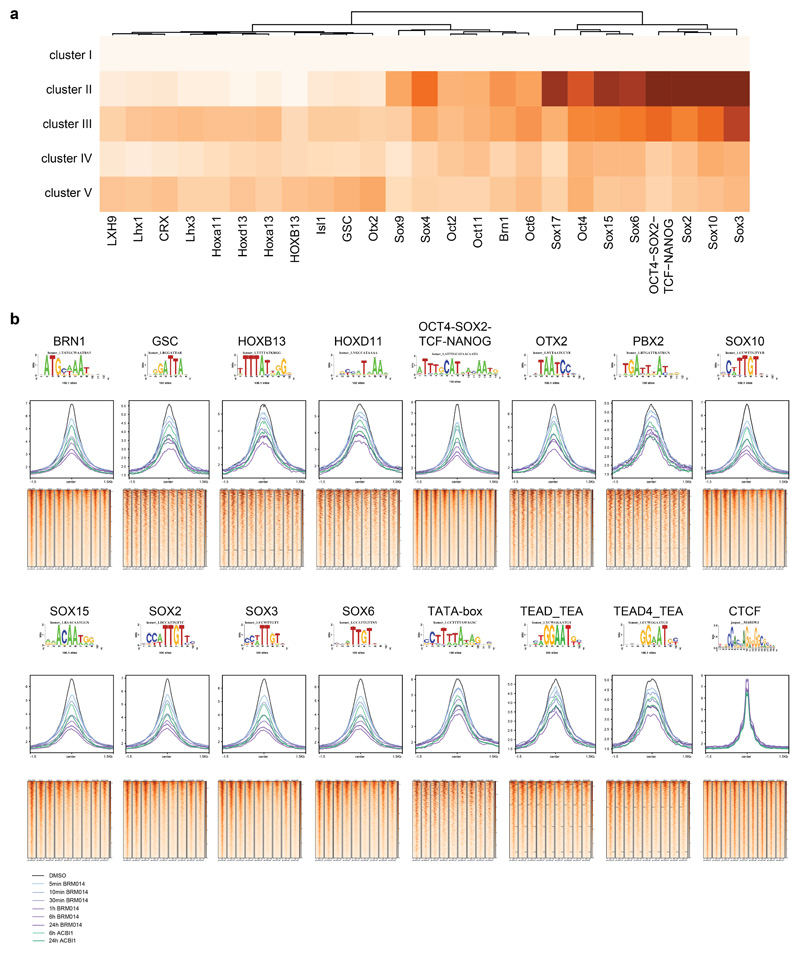
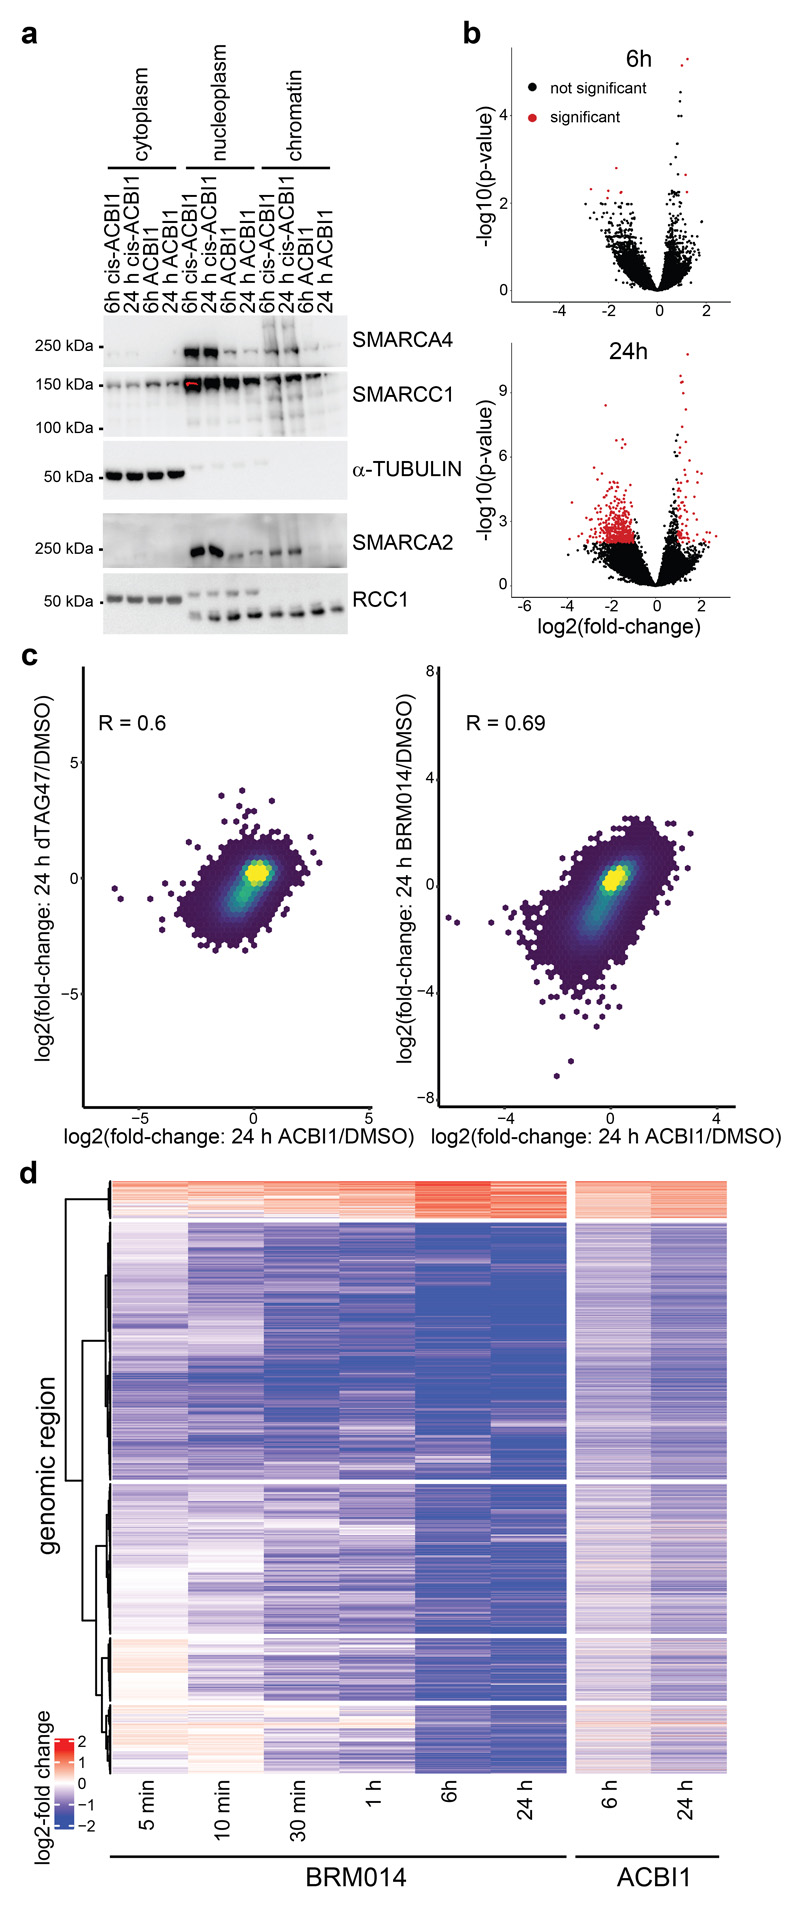
To test if the chromatin accessibility alterations observed after SMARCA4 degradation are dependent on the activity of the BAF complexes, we next used BRM01425, a dual inhibitor of SMARCA4 and SMARCA2 ATPase activity and used it under conditions that are non-toxic for the cells (Supplementary Fig. 3). While this small molecule did not alter complex composition (Extended Data Fig. 5a,b), immunoprecipitation experiments suggested a reduction of chromatin-bound BAF complexes after compound treatment (Extended Data Fig. 5b). Compared to targeted protein degradation, inhibition of the catalytic activity of the BAF complex has the potential to act with faster kinetics. We therefore performed ATAC-seq after even shorter time periods between 5 min and 24 h exposure of HAP1 cells to BRM014 and observed first alterations already within minutes, confirming very fast response times (Fig. 3a-c, Extended Data Fig. 5c). This suggests that constant ATP-dependent nucleosome remodeling by BAF complexes is required to maintain regulatory regions’ accessibility. The chromatin accessibility alterations observed after SMARCA4 degradation and in SMARCA4 knock-out cells were also reflected in the compound treatment time-course (Extended Data Fig. 5d). ATPase inhibition led to significant gain of accessibility at very few regions (N = 520, cluster I) that were sustained for 24 h, while most regions (N = 7,594, cluster II-V) significantly lost accessibility. For the latter regions, four clusters showed different kinetics (Fig. 3a,c,d). Cluster II responded the fastest, while regions in cluster III to V showed gradually slower responses. The fast responding regions were more enriched for non-active enhancers and less for active enhancers compared to cluster III-V. The slower responding regions (cluster III-V) were highly enriched for active enhancers and super-enhancers (Fig. 3e). Motif analyses revealed again enrichment for SOX factor as well as pluripotency factor motifs in the clusters that show a reduction of chromatin accessibility over time (cluster II-V; Extended Data Fig. 6).
Figure 3. BAF complex ATPase inhibition confirms fast DNA accessibility change kinetics and ATPase activity requirements.
(a) Heatmap depicting significant accessibility changes of genomic regions after ATPase inhibition by BRM014 over time. Hierarchical clustering was performed on the columns using Canberra distance and Ward’s hierarchical agglomerative clustering. Color code corresponds to the log2 fold-change. (b) Principal-component analysis on reads per million normalized counts of BRM014-treated samples. (c) Boxplots of accessibility changes per cluster measured as log2 fold-change over time (n = 2 independent experiments). First and third quartiles are denoted by lower and upper hinges, center is median. The upper/lower whisker extendes to the largest/ smallest value no further than 1.5 × inter-quartile range. Data points beyond are plotted individually. (d) Line plots depicting median log2 accessibility fold-changes with standard errors of all genomic regions per cluster after BRM014 treatment in ATAC- and Pro-seq experiments. The shaded areas display the standard error. (e) Enrichment of HAP1-specific features on genomic regions per cluster. Enrichment was calculated against all consensus regions. Color code corresponds to the -log10 P value. Dot size corresponds to the effect size measured as odds ratio. Two-sided Fisher’s exact test was performed. False discovery rate (FDR) correction was performed as implemented in LOLA software. (f) Pearson correlation of log2 fold-changes after 24 h of SMARCA4 degradation (y-axis) and ATPase inhibition using BRM014 compound (x-axis).
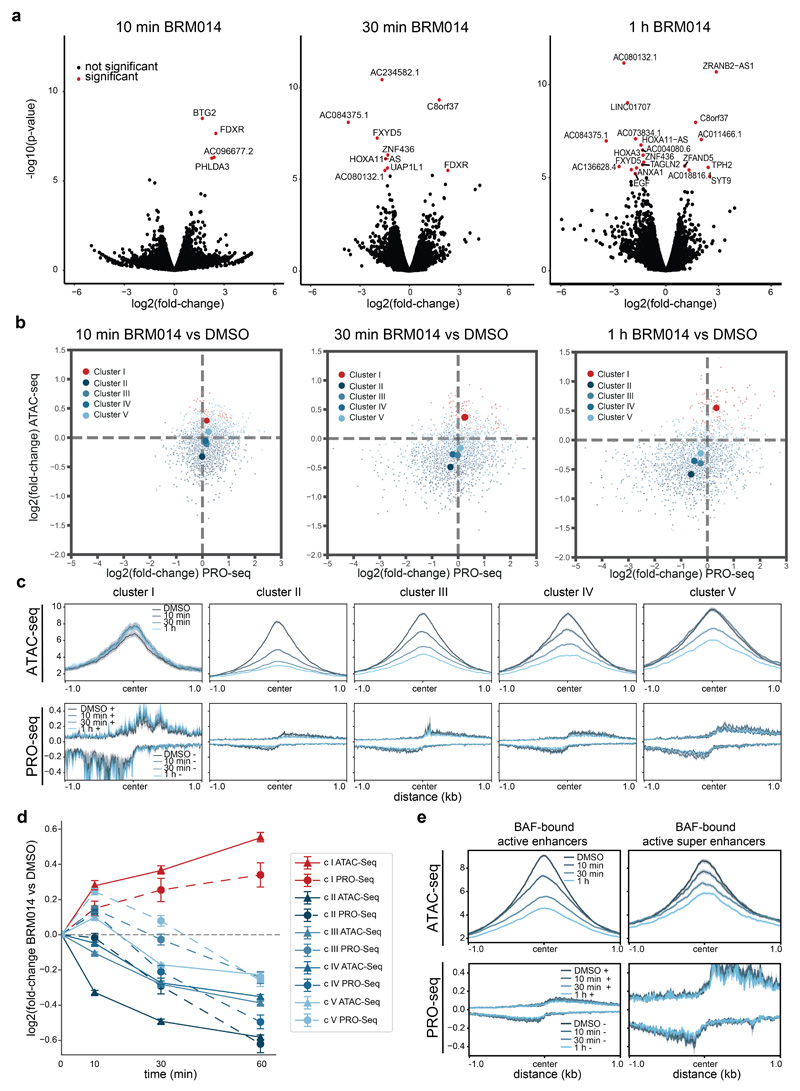
Given the fast responsiveness, treatment with BRM014 provided ideal conditions to investigate if the chromatin alterations led to transcriptional changes. Therefore, we performed PRO-seq after 10 min, 30 min and 1 h of BRM014 treatment. While only few regions were significantly altered in their PRO-seq signal (Extended Data Fig. 7a), the differential regions closely followed the associated accessibility changes (Fig. 3d, Extended Data Fig. 7b-d). Similarly, BAF-bound enhancers and super-enhancers showed a slight reduction in their PRO-seq signal (Extended Data Fig. 7e). Overall, the immediate effects on transcription were not very pronounced, but reflected the chromatin accessibility changes. Possible reasons for the relatively slow transcription changes might include the need to achieve a near-complete depletion/inhibition of this enzymatically active complex or challenges in detecting initial down-regulation events following loss of chromatin accessibility, or the stringent criteria we employ in data analysis requiring robust >2-fold changes.
We confirmed drug-induced chromatin accessibility changes using ACBI126, a proteolysis targeting chimera (PROTAC) that degraded the BAF ATPase subunits SMARCA2 and SMARCA4 within a few hours (Extended Data Fig. 8a). This compound induced similar chromatin accessibility changes as BRM014, however at slower time scales compared to the direct inhibitor due to the slower kinetics of degradation versus direct inhibition (Extended Data Fig. 8b-d).
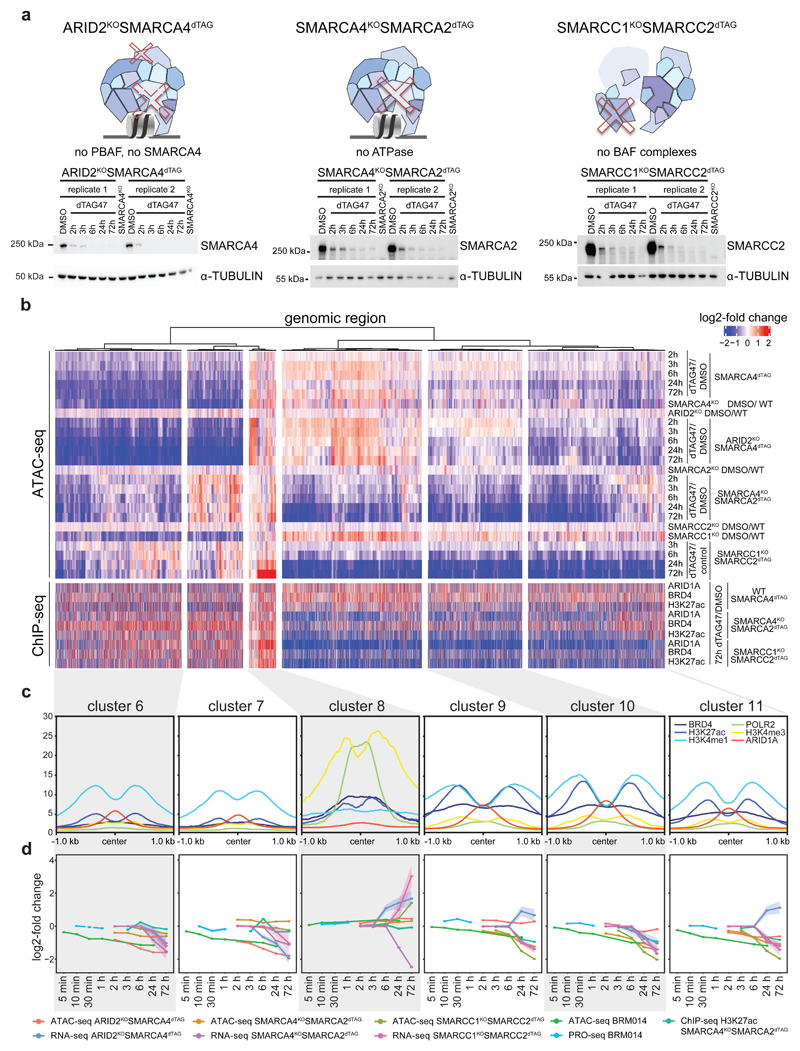
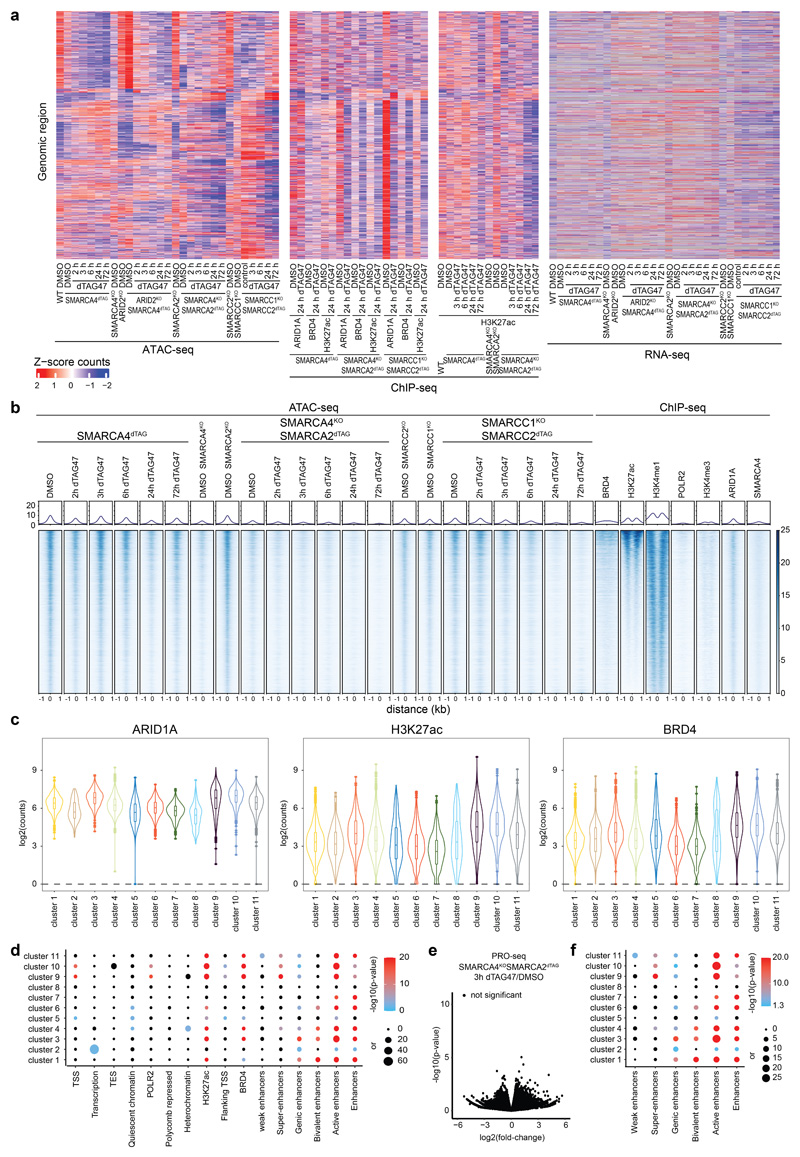
The chromatin accessibility changes after dual ATPase inhibition or degradation correlated well with the alterations observed after SMARCA4 degradation alone (Fig. 3f, Extended Data Fig. 8c), confirming the on-target activity of both approaches and proving that the observed changes upon SMARCA4 degradation in SMARCA4dTAG cells were due to loss of BAF complex activity. However, with BRM014 and ACBI1 we also observed further changes, likely because these compounds in addition to SMARCA4 also target SMARCA2. SMARCA2, which is the less expressed and incorporated BAF complex ATPase in HAP1 cells9, constitutes an intra-complex synthetic lethality with SMARCA4 mutations20–22. As the acute molecular consequences of intra-complex synthetic lethalities are widely unknown so far, we next analyzed chromatin accessibility changes in BAF-mutant cells after depletion of a BAF subunit in three different synthetic lethal pairs: ARID2-SMARCA49, SMARCA4-SMARCA220–22 and SMARCC1-SMARCC29,23 (Fig. 4a, Supplemetary Fig. 4a). We knocked-in the dTAG into the SMARCA4 locus in ARID2KO cells, generating a HAP1 ARID2KOSMARCA4dTAG cell line with perturbed PBAF complexes9 that allows acute depletion of SMARCA4. Addition of dTAG47 to these cells resulted mainly in similar time-dependent accessibility changes as in the ARID2 wildtype SMARCA4dTAG background (Fig. 4b, Extended Data Fig. 9a, Supplementary Fig. 1). This showed that few chromatin alterations after SMARCA4 loss are dependent on PBAF complexes. In addition, we investigated chromatin accessibility alterations upon induction of two very strong intra-complex synthetic lethalities: SMARCA4-SMARCA2 and SMARCC1-SMARCC2. To this aim, we knocked-in the dTAG into the SMARCA2 locus in SMARCA4KO cells, generating HAP1 SMARCA4KOSMARCA2dTAG cells that enable removing both BAF complex ATPases and consequently eliminating the enzymatic activity of the remodelers. Furthermore, we also generated HAP1 SMARCC1KOSMARCC2dTAG cells in which acute SMARCC2 depletion prevents the assembly of BAF complexes9,23,24. Both, the complete elimination of all BAF ATPase activity and the prevention of BAF complex assembly resulted mainly in further loss of chromatin accessibility at regions that were not affected by the loss of a single paralog (Fig. 4b, Supplementary Fig. 4b). Only a few regions that have high levels of RNA polymerase II and H3K4me3 and are associated with transcription start sites gained further accessibility in the synthetic lethal condition (cluster 8) (Fig. 4b-d). Especially regions in the clusters 9, 10 and 11 strongly lost accessibility in these synthetic lethal conditions. Investigation of the chromatin features of these three clusters revealed strong enrichment of H3K27ac, ARID1A and BRD4 in the wildtype condition (Fig. 4c, Extended Data Fig. 9b-d). These data suggest that a subset of BAF-bound active enhancers only becomes less accessible after complete loss of BAF complex activity. Differentially expressed genes associated with these regions showed mostly a corresponding time-delayed transcriptional downregulation (Fig. 4d, Extended Data Fig. 9a,e).
Figure 4. Synthetic lethal conditions cause accessibility loss at additional chromatin sites.
(a) Western blot analyses confirming the dTAG47 responsiveness of HAP1 ARID2KOSMARCA4dTAG, SMARCA4KOSMARCA2dTAG and SMARCC1KOSMARCC2dTAG clones (cropped images). (b) Heatmap of differentially accessible regions in synthetic lethal conditions that were not differential in the SMARCA4dTAG time-course or in SMARCA4KO conditions (regions plotted in Fig. 2a). Hierarchical clustering was performed on the columns using Canberra distance and Ward’s hierarchical agglomerative clustering. ChIP signal for ARID1A, BRD4 and H3K27 acetylation after 72 h of degradation using the dTAG system is depicted for all genomic regions (bottom). The color code corresponds to log2 fold-changes and column-wise Z-score of quantile normalized counts. (c) Mean enrichment of various factors and histone modifications at the regions of the different clusters as determined by ChIP-seq in HAP1 cells. (d) Line plots depicting median log2 fold-change and standard error of accessibility (ATAC-seq), ChIP-signal of all regions per cluster over time in the different synthetic lethal conditions using the dTAG system or BRM014 compound. Also expression changes (RNA-seq, PRO-seq) of associated differential genes are displayed. The shaded areas display the standard error.
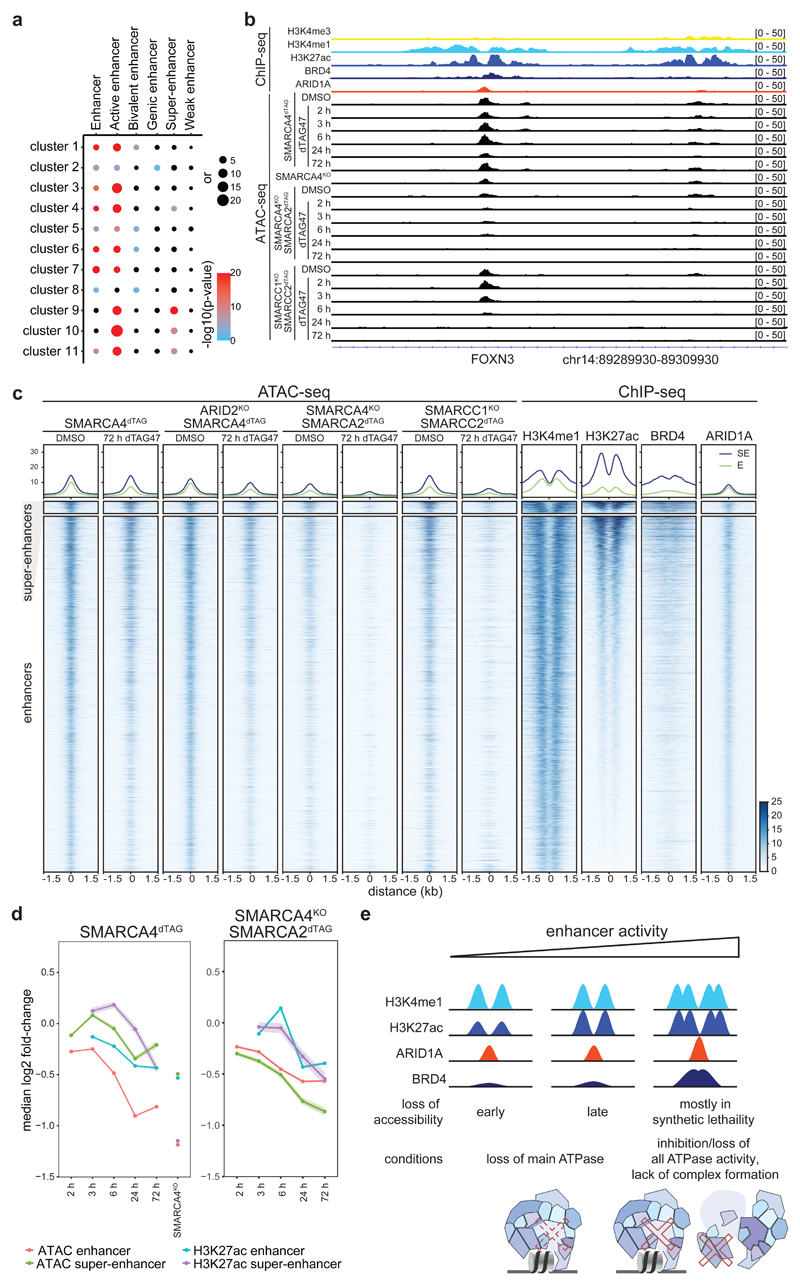
We next wanted to identify features of this synthetic lethal-specific enhancer subset. Therefore, we determined the enrichment of different enhancer subtypes across the eleven accessibility clusters (Fig. 5a, Extended Data Fig. 9f). All clusters that lost accessibility were highly enriched for active enhancers, but only synthetic lethal-specific clusters were further strongly enriched for super-enhancers44–46. Clusters 9, 10 and 11, that specifically lose accessibility in the SMARCA4-SMARCA2 and SMARCC1-SMARCC2 synthetic lethal conditions, contain most super-enhancers, which is consistent with their high levels of H3K27ac and BRD4. To explore how super-enhancers and enhancers across all differential sites behave after SMARCA4 loss alone or in synthetic lethal condition, we assessed chromatin accessibility in relation to H3K27ac levels (Fig. 5b,c, Extended Data Fig. 9b). This revealed that super-enhancers were hardly affected by SMARCA4 degradation in WT background, while their accessibility was lost in the SMARCA4-SMARCA2 and SMARCC1-SMARCC2 synthetic lethal conditions (Extended Data Fig. 10a).
Figure 5. Super-enhancers lose accessibility in BAF synthetic lethal conditions.
(a) Enrichment analyses of different enhancer types per cluster. Enrichment was calculated against all consensus regions. Color code corresponds to the -log10 P value. Dot size corresponds to the effect size measured as odds ratio. (b) Browser track example of a super-enhancer region. (c) Heatmaps representing chromatin accessibility (ATAC-seq) and different protein enrichments (ChIP-seq) for regions falling into super-enhancers (middle) and enhancer (bottom) regions. On top, aggregate coverage plots showing mean enrichment for the different super-enhancer regions (blue, SE) and enhancer regions (green, E). (d) Line plots depicting median log2 fold-change and standard error of accessibility (ATAC-seq) or H3K27 acetylation ChIP-signal for differential enhancer (N = 12,817) and super enhancer (N = 444) regions after dTAG47 treatment of SMARCA4dTAG and SMARCA4KOSMARCA2dTAG cell lines. The shaded areas display the standard error. (e) Model depicting that enhancer activity and BAF enrichments correlates with responsiveness to perturbation of the BAF complexes.
BAF-dependent sites that lost chromatin accessibility in the strong synthetic lethal conditions showed a reduction in the binding of the canonical BAF subunit ARID1A and of the enhancer mark H3K27ac (clusters 9-11) (Fig. 4b). Also, a stronger reduction in BRD4 enrichment was observed, another indication that especially super-enhancer regions were undergoing remodeling in these conditions. In order to investigate the dynamics of H3K27ac changes in relation to the chromatin accessibility after loss of SMARCA4 and after additional loss of SMARCA2 (synthetic lethality), we performed H3K27ac ChIP-seq over the time-course (Extended Data Fig. 10b). This revealed an overall reduction of H3K27ac over time (Fig. 5d). This loss of H3K27ac followed the kinetics of the accessibility changes and was, especially for super-enhancers, time-delayed (Fig. 5d).
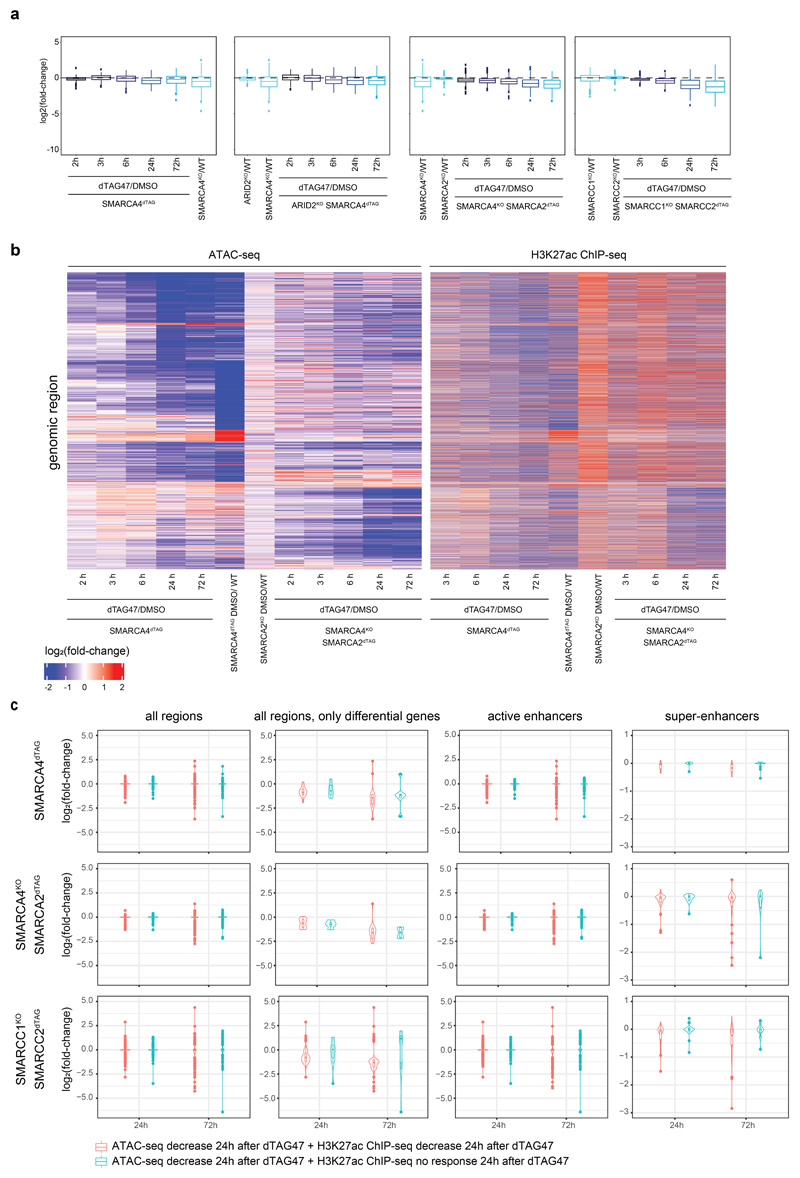
As some regions were not losing H3K27ac, we were wondering if this was reflected in an altered transcriptional response. We therefore compared the effect on gene expression of associated genes in regions that lost both chromatin accessibility and H3K27ac to those that lost chromatin accessibility but not H3K27ac. While the extent of the differences depended on the background, we observed a tendency towards stronger reduction in expression when also H3K27ac was lost (Extended Data Fig. 10c).
In summary, the more complete chromatin accessibility changes we observe following dual perturbation of BAF subunits often targeting super-enhancers, with the consequent transcription changes likely explaining the synthetic lethalities.
Discussion
In this study, we investigated the effects of acute loss of the BAF ATPase SMARCA4 or BAF complex activity genome-wide on chromatin and gene expression leading to several conclusions:
-
(1)
The data indicate that continuous BAF complex activity is necessary to keep BAF complex-controlled enhancers accessible. This argues not only for chromatin remodeling activity being an initial event allowing the binding of further factors to these regions, but also for a constant requirement of energy and ATP-dependent processes to just maintain the status quo.
Further experiments will be required to show if the accessibility changes following BAF complex perturbations result from the activity of competing chromatin remodelers, like observations for yeast promoters suggest37, or if they represent a remodeling-independent alteration of chromatin structure.
-
(2)
Loss of SMARCA4 or BAF complex activity mainly result in a reduction of DNA accessibility with kinetics correlating with levels of H3K27ac at enhancer regions. Higher H3K27ac levels are associated with slower loss of chromatin accessibility upon SMARCA4 perturbation. Regions with particularly high H3K27ac levels, so-called super-enhancers, are mainly preserved under conditions of SMARCA4 loss alone. However, after complete perturbation of BAF complexes in synthetic lethal conditions, also these regions near-completely lose accessibility and subsequently H3K27ac (Fig. 5e), consistent with similar findings on the ARID1A-ARID1B synthetic lethality13. The misregulation of cell identity genes controlled by super-enhancers following these regulatory chromatin changes may ultimately be causative for reduced cell viability in synthetic lethal conditions.
That the more active enhancers respond later could have several reasons. The more active features a region has, the better it may be able to recruit limiting amounts of remaining BAF complexes; or additional chromatin features of these regions may limit the immediate accessibility changes; or the crowded environment of especially the super-enhancers may prevent fast nucleosome position changes; or these regions may be less targeted by non-BAF chromatin remodeling complexes. Likely multiple of these mechanisms contribute in combination.
-
(3)
In line with previous studies that showed global changes in various histone modifications following BAF perturbation10,15,16,24,47, we observe that the acetylation levels of H3K27 are also altered. These H3K27ac changes occur in a time-delayed fashion compared to the chromatin accessibility changes at many of these responsive sites. This suggests that these hallmarks of active regulatory regions are not epigenetic marks with long-term stability, but that rather intrinsic mechanisms controlling the establishment of these chromatin states are mandatory to keep and inherit cellular states.
Our data further indicate that super-enhancers, which are important for cell identity, predominantly lose chromatin accessibility and BRD4 binding after complete disruption of BAF complexes. Our data may therefore provide the mode of action of future drugs exploiting these synthetic lethalities25,26 and suggest further exploration of targeting BRD4 with e.g. BET inhibitors in BAF mutated cancers48. Moreover, combinatorial approaches targeting intra-complex BAF synthetic lethalities and BRD4 may even enhance the effects. Future studies using tumor models are required to address the generality of these findings and to extensively explore the discussed therapeutic approaches for various tumor types.
Methods
Cell culture
HAP1 wildtype (Horizon Discovery C631), knock-out and dTAG cells were grown in Iscove's Modified Dulbecco's Medium (IMDM, Thermo Fisher Scientific, 21980-032 or Sigma I3390) supplemented with 10% fetal bovine serum (FBS, Thermo Fisher Scientific 10500064) and 1% Pen Strep (100 units/ml Penicillin, 100 µg/ml Streptomycin, Thermo Fisher Scientific, 15140-122) at 37 °C and 5% CO2 (Supplementary Table 1). Drosophila S2 cells, a gift from the Stark laboratory (IMP), were grown in Schneider's Drosophila medium (Thermo Fisher Scientific, 21720024) supplemented with 10% FBS and 1% Pen Strep at 28 °C and 5% CO2.
dTAG47 was used at a final concentration of 300 nM, BRM014 (MedChemExpress, HY-119374) was used at a final concentration of 1 µM and SMARCA4/SMARCA2 PROTAC ACBI1 and respective negative control cis-ACBI1 (opnMe) was used at a final concentration of 3 µM.
Generation of dTAG cell lines
pX330A_sgX_sgPITCh cutting plasmid and pCRIS-PITChv2 repair template plasmids (provided by Winter laboratory, partly available via Addgene 91793, 91796) were cloned for each target gene according to Brand et al.49 and transfected into HAP1 cells using TurboFectin 8.0 (OriGene). After puromycin selection, single-cell clones were grown up and validated for proper insertion and function of the tag by PCR, Sanger sequencing and western blot analyses. dTAG7, dTAG13 or dTAG47 were tested for their degradation dynamics and then dTAG47 was used for all experiments to induce the degradation of the tagged proteins40,50,51.
Immunoprecipitation
The salt concentrations of the samples from fractionated HAP1 SMARCA4dTAG cells were brought to 150 mM by adding 5 M NaCl or diluting with HEPES I buffer. One mg of fractionated samples were used for immunoprecipitation and brought to the same volume with the respective buffers. Ten µl of antibodies against SMARCC1 (Cell Signaling #11956) were added and the samples were rotated overnight at 4°C. Washed Dynabeads Protein G (Thermo Fisher Scientific 10004D) were added to the samples, which were then rotated for 3 h at 4°C. The supernatant was removed and the beads were washed 3 times with 1 ml of Buffer I (50 mM HEPES pH 7.9, 150 mM NaCl, 5 mM EDTA, 0.5% NP-40, 50 mM NaF, 1 mM Na3VO4, 1 mM PMSF, protease inhibitors) and 2 times with 1 ml of Buffer II (50 mM HEPES pH 7.9, 150 mM NaCl, 5 mM EDTA). The proteins were eluted from the beads in SDS elution buffer (50 mM HEPES (pH 7.9), 150 mM NaCl, 5 mM EDTA, 2% SDS, 1× protease inhibitors).
For the immunoprecipitation after BRM014 treatment, 350 µg of lysate and 8 µl of SMARCC1 (Cell Signaling #11956) antibody were used.
Mass spectrometry
Samples rested at RT for 20 minutes before heating to 99°C for 5 min. FASP was performed using a 30 kDa molecular weight cutoff filter (VIVACON 500; Sartorius Stedim Biotech GmbH, 37070 Goettingen, Germany) essentially according to the procedure described by Wisniewski et al.52. Fifty µl of each cleared protein extract was mixed with 200 μl of freshly prepared 8 M urea in 100 mM Tris-HCl (pH 8.5) (UA-solution) in the filter unit and centrifuged at 14,000 g for 15 min at 20°C to remove SDS. Any residual SDS was washed out by a second washing step with 200 μl of UA. The proteins were alkylated with 100 μl of 50 mM iodoacetamide in the dark for 30 min at RT. Afterward, three washing steps with 100 μl of UA solution were performed, followed by three washing steps with 100 µl of 50 mM TEAB buffer (Sigma-Aldrich). Proteins were digested with 1.25 µg trypsin overnight at 37 °C. Peptides were recovered using 40 μl of 50 mM TEAB buffer followed by 50 μl of 0.5 M NaCl (Sigma-Aldrich). Peptides were desalted using C18 solid phase extraction spin columns (The Nest Group, Southborough, MA), organic solvent removed in a vacuum concentrator at 45°C and reconstituted in 5% formic acid and stored at -80°C until LC-MS/MS analysis (see Supplementary Methods, also for analyses of mass spectrometry data).
ATAC-seq
Assay for Transposase Accessible Chromatin with high-throughput sequencing (ATAC-seq) was performed in duplicates according to Buenrostro et al. with small adaptations42. In brief, 50,000 cells (1:2 Drosophila S2 cells:HAP1 cells) were resuspended in 25 µl transposase reaction mix (0.02% digitonin (Promega G9441), 1× TD buffer, 0.08% TDE1 (Nextera DNA Library Preparation Kit, Illumina, FC-121-1031)) and incubated for 30 min, 37°C, 300 rpm. Then DNA was purified using MinElute kit (Qiagen, 28004) and eluted in 11 µl elution buffer. 1 µl was used to determine cycle number for PCR using a qPCR approach. The remaining 10 µl were complemented with 1× NEBnext High-Fidelity PCR master mix (New England BioLabs, M0541), 1.25 µM index primer 1 and 1.25 µM index primer containing a barcode (Supplementary Table 1). PCR was performed: 5 min 72°C, 30 sec 98°C, 9 - 12 cycles of 10 sec 98°C + 30 sec 63°C + 1 min 72°C, 1 min 72°C and then cleaned-up using Agencourt AMPure XP beads (Beckman Coulter, A63880). The libraries were checked on a Bioanalyzer instrument using High Sensitivity DNA Chips (Agilent), quantified using Qubit dsDNA HS Assay kit (Thermo Fisher Scientific, Q32854) and pooled. Libraries were sequenced using the Illumina HiSeq 3000/4000 platform with the 75-bp paired-end configuration.
Transposase reaction for the ATAC-seq time-courses after BRM014 and ACBI1 treatment were performed on plate and without Drosophila spike-in.
PRO-seq
Precision nuclear run-on sequencing (PRO-seq) was performed in duplicate drug treatments of two 15 cm cell culture dishes with roughly 2 × 10⁷ HAP1 wildtype, SMARCA4dTAG, or SMARCA4KOSMARCA2dTAG cells each, corresponding to ~70% confluency43. After drug treatments from 1,000× DMSO stocks (final DMSO, 3 h 300 nM dTAG47, or 10/30/60 min 1 µM BRM014), supernatant was decanted before washing the cells with 10 ml cold PBS, harvesting by scraping and collecting in 50-ml tubes by centrifugation at 1,500 rpm and 4°C for 5 min. 3 × 10⁶ live Drosophila melanogaster S2 cells were added to the PBS/cell mix as spike-in to normalize for potential global differences in nascent transcription53. Nuclei were extracted by 5 min incubation in 40 ml dounce buffer (10 mM Tris-HCl pH 7.4, 300 mM sucrose, 3 mM CaCl2, 2 mM MgCl2, 0.1% Triton-X-100, 0.5 mM DTT) and douncing 25 times in a Dounce homogenizer on ice using the loose pestle A. Dounced nuclei were harvested by centrifugation, washed with 2× 5 ml dounce buffer, resuspended in 300 µl nuclei storage buffer (10 mM Tris-HCl pH 8.0, 25% glycerol, 5 mM MgCl2, 0.1 mM EDTA, 5 mM DTT), snap-frozen in liquid nitrogen and stored at -80°C until further processing.
Three parallel run-on reactions were performed per sample using a two-nucleotide strategy (biotin-11-CTP and biotin-11-UTP; Jena Bioscience, Germany), following the published procedure43,53. Briefly, total RNA was extracted after run-on with Trizol reagent followed by ethanol precipitation. RNA pellets from the three parallel run-on reactions were now pooled, base-hydrolyzed and P10 spin-column gel-filtrated before the first streptavidin bead enrichment. VRA3 adapters were ligated to free 3’-OH ends using T4 RNA ligase in a PCR cycler for 4 h at 20°C and subsequent storage at 4°C overnight. After a second streptavidin purification, 5’-caps were enzymatically removed using RppH before phosphorylation with T4 PNK and overnight ligation of VRA5 adapters to the resulting 5’-phosphate ends. Finally, RNA was reverse transcribed using RP1 primer with Superscript III and cDNA subjected to a 4× dilution series test PCR to determine the optimal PCR cycle number for final sequencing library amplification. Full scale amplification with RPI-x indexing primers was then performed in 2× 50 µl reactions per sample for a total of 11-19 cycles. DNA was ethanol precipitated and subjected to 2× 1.1:1 AMPure XP bead left-side size selection according to manufacturer’s instructions. DNA concentration was determined using the Qubit dsDNA HS kit and library size distribution was measured with Bioanalyzer. Libraries were pooled to equal molar ratios and sequenced on a HiSeq 3000/4000 instruments (Illumina, San Diego, CA, USA) in 50-bp single-end mode yielding ~60 million reads per sample.
RNA-seq
RNA from two independent replicates, originating from the same cell pools as the corresponding ATAC-seq samples, was isolated using the RNeasy Mini kit (catalog no. 74106; QIAGEN). The amount of total RNA was quantified using the Qubit 2.0 Fluorometric Quantitation system (Thermo Fisher Scientific, Waltham, MA, USA) and the RNA integrity number (RIN) was determined using the Experion Automated Electrophoresis System (Bio-Rad, Hercules, CA, USA). RNA-seq libraries were prepared with the TruSeq Stranded mRNA LT sample preparation kit (Illumina, San Diego, CA, USA) using Sciclone and Zephyr liquid handling workstations (PerkinElmer, Waltham, MA, USA) for pre- and post-PCR steps, respectively. Library concentrations were quantified with the Qubit 2.0 Fluorometric Quantitation system (Life Technologies, Carlsbad, CA, USA) and the size distribution was assessed using the Experion Automated Electrophoresis System (Bio-Rad, Hercules, CA, USA). Individual samples were diluted and pooled into NGS libraries in equimolar amounts. Expression profiling libraries were sequenced on HiSeq 3000/4000 instruments (Illumina, San Diego, CA, USA) in 50-bp single-end mode.
Chromatin Immunoprecipitation (ChIP)
For ChIP 2.5 × 10⁶ cells were seeded 72 h before harvesting on 150-mm cell culture dishes (Corning, Cat. No. 430599, Lot 03720005). Prior to harvesting, HAP1 SMARCA4dTAG and HAP1 SMARCA4KOSMARCA2dTAG were treated with DMSO (Merck Cat. No.41640-1L-M, Lot STBG9935) or 300 nM dTAG47 for 3, 6, 24 or 72 h. Knock-out cell lines for SMARCA4 and SMARCA2 as well as HAP1 WT were treated with DMSO. Cells were fixed for 10 min at room temperature using formaldehyde (Thermo Fischer Scientific Cat. No. 28908, Lot VB2940201) and consequently quenched with 2.5 M glycine (Sigma Cat. No.50046-50g, Lot SLCC7952) for 5 min at 4°C. Cells were collected into reaction tubes and washed two times with ice-cold PBS (Cat. No. D8537-500ml), followed with 7 min centrifugation at 600 g after each wash. Pellet of each sample was resuspended in 10 ml Buffer L1 (50 mM HEPES KOH, pH 7.5, 140 mM NaCl, 1 mM EDTA pH 8.0, 10% glycerol, 0.5 % NP-40 0.25 % Triton-X 100) and kept 10 min on ice. Buffer was removed after 5 min centrifugation at 1,200 g, 4°C and pellet was resuspended in 10 ml Buffer L2 (200 mM NaCl, 1 mM EDTA pH 8.0, 0.5 mM EGTA pH 8.0, 10 mM Tris pH 8.0) and kept 5 min on ice. Next, pellet was resuspended in Buffer L3 (1 mM EDTA pH 8.0, 0.5 mM EGTA pH 8.0, 10 mM Tris pH 8.0, 100 mM NaCl, 0.1% Na-deoxycholate, 0.17 mM N-Lauroyl sarcosine, 1× protease inhibitor (Roche Cat. No. 04693132001, Lot 27423500) and two times in shearing buffer (10 mM Tris-HCl, pH 7.8, 1 mM EDTA, pH 8.0, 0.1 % SDS), each followed with 3 min centrifugation on 1,200 g, 4°C. After adding harsh shearing buffer (10 mM Tris-HCl, pH 7.8, 2 mM EDTA pH 8, 0.25 % SDS, 1× protease inhibitor) chromatin was sonicated using Covaris S220 (5 duty cycles, 140 peak incident power, 200 cycles per burst for 40 min) or S2x (5 duty cycles, 4 intensity, 200 cycles per burst for 40 min). After sonication, chromatin was centrifuged for 10 min at 14,000 g, 4°C and diluted in equilibration buffer (10 mM Tris-HCl, pH 8.0, 223 mM NaCl, 1.66 % Triton X-100, 0.166 % Na-Deoxycholate, 1 mM EDTA, pH 8, 1× protease inhibitor) in 1:1.5 ratio. DNA concentration was measured using Qubit (Thermo Fischer Scientific Q32854, Lot 2161894) as suggested by manufacturer’s protocol.
For immunoprecipitation samples were diluted in buffer containing 1× harsh lysis buffer and 1.5× equilibration buffer with protease inhibitor. 2.5 µg of H3K27ac antibody (Abcam, Cat number ab4729, lot 3211741-1) was added to each sample followed with 9.5 h rotation at 4°C, 12 rpm. Additionally, 1% of total volume was collected for input samples and kept at -20°C overnight.
Protein G dynabeads (Thermo Fischer Scientific 10004D, Lot 00890705) were added to the immunoprecipitated samples and mix was rotated for 3 h at 4°C at 12 rpm. After incubation, samples containing beads were washed twice with RIPA-LS (10 mM Tris-HCl pH 8.0, 140 mM NaCl, 1 mM EDTA pH8.0, 0.1 % SDS, 0.1 % Na-Deoxycholate, 1 % Triton x-100), two times with RIPA-HS (10 mM Tris-HCl, pH 8.0, 1 mM EDTA pH 8.0, 500 mM NaCl, 1 % Triton x-100, 0.1 % SDS, 0.1 % Na-Deoxycholate) and twice with RIPA-LiCl/Doc (10 mM Tris-HCl, pH 8.0, 1 mM EDTA, pH 8.0, 250 mM LiCl, 0.5 % NP-40, 0.5 % Na-Deoxycholate). To elute the sample, the beads were resuspended in 150 µl elution buffer (1% SDS + 100mM NaHCO3 in H2O) and rotated for 20 min at RT, 12 rpm. Supernatant was transferred to a new 1.5-ml Eppendorf tube and elution procedure was repeated one more time.
Consequently, samples were treated with 10 mg/ml RNase (Sigma Aldrich R4875-100mg) for 30 min, 37°C, 300 rpm. Proteinase K (Sigma Aldrich P2308-25mg) treatment and decrosslinking was performed using 0.5 M EDTA, 1 M Tris pH6.5, 10 mg/ml proteinase K for immunoprecipitated samples and 10% SDS, 5 M NaCl and 10 mg/ml proteinase K for input samples and incubated 2.5 h at 55 °C, 300 rpm followed with overnight incubation at 65°C, 300 rpm.
For DNA extraction samples were mixed with Phenol (Sigma Aldrich, Cat. No. P4556-100ml, Lot MKBZ8850V) and centrifuged for 10 min at 13,000 g at room temperature. Supernatant was transferred to a new tube and mixed with chloroform: isoamyl alcohol 24:1 (Sigma C0549-1PT, Lot MKCH9756) followed by 10 min centrifugation at 13,000 g. Supernatant was transferred to a new tube and mixed with 100% ethanol, 3 M sodium acetate pH 5.2 and glycogen and samples were stored at -20°C overnight.
For the last step, samples were centrifuged for 2.5 h at 4°C full speed and washed with 70% ethanol. After airdrying, the samples were dissolved in elution buffer from Qiagen (5 min at 50°C, 500 rpm) (Cat no.1014608, Lot no. 157045466) and DNA concentration was measured using Qubit as described by manufacturer protocol.
NEBNext Ultra II DNA Library Prep Kit for Illumina (New England Biolabs E7645L, Lot 10059703) was used for the library preparation as described by manufacturer’s protocol.
The quality of the ChIP libraries was confirmed prior to sequencing on a Bioanalyzer (Agilent Cat no. 5067-4626, Lot NOXF11BK50). Samples were sequenced in 3 lanes on a HiSeq 3000/4000 platform using 50-bp single-read configuration.
For the ARID1A, BRD4, H3K27ac and IgG ChIPs, SMARCA4dTAG, SMARCA4KOSMARCA2dTAG and SMARCC1KOSMARCC2dTAG were treated either with 0.03% DMSO or with 300 nM dTAG47 for 72 h and processed as mentioned above. 5 µg of antibodies were used: ARID1A (Abcam, ab182560, Lot GR269670-9), BRD4 (Abcam, ab128874, Lot GR3251918-7), H3K27ac (Abcam, ab4729, Lot GR3211741-1) and IgG (Cell Signaling, 2729S, Lot 9).
Bioinformatic analyses
Details on processing of NGS reads can be found in the Supplementary Methods.
Consensus peak set generation of accessibility sites across samples per ATAC- and ChIP-seq dataset, read count quantification per peak and read count normalization across samples using quantile normalization (qn), quantile normalization with GC correction (cqn) or reads per million normalization (rpm) was performed as implemented in the python package ngs-toolkit (https://doi.org/10.5281/zenodo.4377898).
To compare ATAC-seq and ChIP-seq signal, ChIP-seq signal was quantified for all ATAC-seq consensus regions. To compare signal between the ATAC-seq datasets after dTAG47 or BRM014 treatment, a consensus peak set was defined by overlapping the respective consensus peak sets merging regions overlapping by 1 bp. To compare ATAC-seq and RNA-seq signal, ATAC-seq regions were assigned to their closest gene body.
Annotation of peak regions with chromatin states was based on 12-state ChromHMM genome segmentation on ChIP-seq marks as described in Schick et al. 20199. Annotation of peak regions with BRD4, ARID1A, POLR2 binding sites and H3K27ac marks was based on ChIP-seq peaks from Schick et al. 20199 using a 1-kb window around each peak.
Super-enhancers were called using Rose46 based on active enhancer regions (high H3K27ac and H3K4me1 signal, low H3K4me3 signal and no H3K27me3, H3K9me3 and H3K36me3 signal) as described in Schick et al. 20199. Rose46 models a cutoff based on ranked H3K27ac counts from H3K27ac ChIP-seq data per active enhancer region to distinguish enhancers from super-enhancers. IgG ChIP-seq marks are hereby used as a control. Used ChIP-seq data are published in Schick et al. 20199. Enhancer regions falling into super-enhancers were removed from the enhancer subclasses annotated by ChromHMM in further analyses.
Principal component analysis was performed using the R package factoextra (https://CRAN.R-project.org/package=factoextra).
Differential expression analysis was performed using DESeq254 using raw count data. Differential regions were defined as having an FDR-adjusted P value <0.01 and an absolute log2 fold-change >1.
Hierarchical clustering was performed using Canberra distance measure and Ward’s hierarchical agglomerative clustering as implemented in the R stats package (https://www.R-project.org/).
Aggregate coverage plots and chromatin accessibility heatmaps were generated using plotHeatmap and plotProfile functions implemented in the deepTools package55.
Region set enrichment analysis was performed using LOLA56 with a database harboring HAP1 cell-specific annotation features (chromatin states, BRD4, ARID1A, POLR2 binding sites). Chromatin states were defined by HMM9, while a further distinction of super-enhancers was made based on H3K27ac ChIP-seq level as described above. The effect size is stated as the odds ratio (OR) of the Fisher’s exact test.
Motif analyses on the accessible regions were performed using Homer with the default settings using the known motif database and all consensus regions as the background set57. The effect size is stated as motif ratio (N regions in Motif-category / N regions per cluster).
The RSAT convert-matrix tool (https://doi.org/10.1093/nar/gky317, version 2020-10-28) was used to convert position weight matrices from homer format to cb format and generate logos for the selected TF-binding motifs.
The ATAC-seq consensus peaks were subsequently scored using Cluster-Buster command line tool (version 2018-07-04) (https://doi.org/10.1093/nar/gkg540) for each selected motif, using the following parameters: cbust -c 6 -m 6 -G 0 -f 5 ${motif_name}.cb hg38.fa
Potential TF-binding sites were defined as sites with a motif cluster score larger or equal to 6. Subsequently, the promoter regions (sites closer than 1 kb to TSS) were removed using the BEDTools intersectBed (v.2.26.0) (https://doi.org/10.1093/bioinformatics/btq033). Finally, the top 2,000 motif cluster sites were used in the accessibility changes analyses.
The ATAC-seq and H3K27ac ChIP-seq signal was calculated in 3-kb windows around the selected motif clusters using the computeMatrix from the deepTools (v3.3.0) (https://doi.org/10.1093/nar/gkw257), using the following parameters: computeMatrix reference-point --referencePoint center -a 1500 -b 1500 --skipZeros. Aggregate coverage plots and heatmaps were generated using plotProfile and plotHeatmap tools from the deepTools.
GO enrichment was performed using the enrichGo function as implemented in the R package clusterProfiler58. Herefore, all regions were assigned to their closest genes based on genomic coordinates, which were then used for the analysis. Enrichment was calculated using assigned genes to all consensus regions as a background set. The effect size is stated as gene ratio (N regions in GO-category / N regions per cluster).
Bam files of individual replicates were merged using samtools, bigwig files were generated using the bamCoverage command from the deepTools package and browser tracks were generated using the Integrative Genomics Viewer browser59. P values comparing median fold-changes between samples and time-points were calculated using the two-sided non-parametric Mann-Whitney-U test.
Genes were annotated as cancer drivers according to the Supplementary Table 4 published by Dietlein et al. 202060. Only genes annotated as relevant in lymph/blood cancers were chosen for further analyses. Genes were annotated as essential in HAP1 cells according to Blomen et al. 201561. An overview of regions present in the 11 clusters from the dTAG ATAC-seq experiment annotated with super-enhancer status, BAF-bound status and closest gene including cancer driver and HAP1 essentiality status can be found in Supplementary Table 2.
Statistics are summarized in Supplementary Table 3, used R packages for figure generation in Supplementary Methods.
Nomenclature
We used gene names for genes and proteins for the BAF subunits. Alternative names can be found in the Supplementary table 4.
Extended Data
Extended Data Fig. 1. Effects of SMARCA4 degradation on BAF complex members.
(a) Western blot analysis of HAP1 ARID2KOSMARCA4dTAG cells after treatment for different times with 700 nM dTAG47, dTAG13, dTAG7 or DMSO as control (cropped images). (b) Semi-quantitative analysis of SMARCA4 protein levels based on whole-cell extract Western blot data normalized to tubulin (shown in Fig. 1b) and based on nuclear-extract proteomics data (shown in Fig. 1d). Cropped Western blot images of dTAG47 time-course in SMARCA4dTAG cells. (c) Western blot analysis of HAP1 SMARCA4dTAG cells after treatment for different times with 300 nM dTAG47 or DMSO as control in various cellular fractions. Staining for SMARCA4, SMARCA2 and SMARCC1 as well as α-TUBULIN and RCC1 as control. Cropped images, WCE = whole cell extract. Semi-quantitative analysis of SMARCA4 protein levels based on nucleoplasm and chromatin fraction Western blot data normalized to RCC1. RCC1 run on a separate plot from the same experiment and was processed in parallel. (d) Western blot analyses of BAF subunit members after SMARCA4 degradation (dTAG) induced with 300 nM dTAG47 for 24h compared to control (DMSO) in different cellular compartments of HAP1 SMARCA4dTAG cells (cropped images). (e) SMARCC1 immunoprecipitation in different cellular compartments of HAP1 SMARCA4dTAG cells treated with 300 nM dTAG47 or DMSO for 24 h. Western blot analysis for SMARCA4 (cropped images). (f) HA immunoprecipitation in different cellular compartments of HAP1 ARID2KOSMARCA4dTAG cells treated with 300 nM dTAG47 or DMSO for 24 h. Western blot analysis for various BAF subunits (cropped images). (g) Heatmap showing mean log2 SMARCC1-normalized abundance values of mass spectrometry results of figure 1f.
Extended Data Fig. 2. Chromatin changes after degradation of SMARCA4.
(a) Western blot analyses confirming the degradation of SMARCA4 upon dTAG47 treatment in HAP1 SMARCA4dTAG cells (cropped images). (b) Principal component analysis of the ATAC-seq time-course data. (c) Volcano plots displaying the chromatin accessibility changes after SMARCA4 degradation compared to control for different treatment length. Significant changes (Padj < 0.01 and abs(log2 fold-change) >1) are colored in red. (d) Browser track examples for regions falling into the 5 different clusters.
Extended Data Fig. 3. Transcriptional changes upon dTAG47 treatment.
(a) Heatmap of ATAC and ChIP-seq signal measured as log2 fold-change for genomic regions in the five WT SMARCA4dTAG time-course clusters. (b) Volcano plot of nascent transcriptional changes after 3h dTAG47 treatment in WT SMARCA4dTAG cells (PRO-seq). Significant changes (Padj < 0.01 and abs(log2 fold-change) >1) are colored in red. Two-sided Wald test was performed, False discovery rate (FDR) correction as implemented in DESeq2. (c) PCA plot of variance stabilizing transformation normalized counts from the RNA-seq experiment in WT SMARCA4dTAG cells. (d) Heatmap of ATAC and RNA-seq signal measured as log2 fold-change for genomic regions in the five WT SMARCA4dTAG time-course clusters. (e) Volcano plots of gene expression changes after dTAG treatment in SMARCA4dTAG cells compared to DMSO treatment and in SMARCA4KO cells compared to WT cells as measured by RNA-seq. Significant changes (Padj < 0.01 and abs(log2 fold-change) >1) are colored in red. Two-sided Wald test was performed, False discovery rate (FDR) correction as implemented in DESeq2.
Extended Data Fig. 4. Transcription factor motif analysis in SMARCA4dTAG.
(a)(left) Enrichment of different chromatin features and factor binding in the 5 clusters compared to all consensus regions. (right) Enrichment of HAP1-specific features on genomic regions per cluster. Enrichment was calculated against regions present in the 5 clusters. Color code corresponds to -log10 p-value. Dot size corresponds to the effect size measured as odds ratio. (b) GO term enrichment for the different clusters. Only features reaching a significance threshold of p < 0.05 at a q-value of < 0.2 are depicted. (c) Motif enrichment results measured as -log10 p-value per cluster. Top 3 motifs per cluster are shown. (d) ATAC read density (RPGC normalized) at the different motifs detected in (c) shown in aggregation plots (middle) and in heatmaps (bottom) across the time-course of SMARCA4 degradation and in WT and SMARCA4KO cells. The top 2000 motif sites in the ATAC consensus peaks were analyzed.
Extended Data Fig. 5. ATPase inhibitor BRM014 treatment leads to fast accessibility changes.
(a) Western blot analysis of HAP1 WT cytoplasmic, nucleoplasmic and chromatin fractions after BRM014 treatment. Cropped images, WCE = whole cell extract. (b) SMARCC1 immunoprecipitation experiments in HAP1 cell nucleoplasmic and chromatin fractions after BRM014 treatment. Cropped Western Blot images. (c) Volcano plots displaying the chromatin accessibility changes in HAP1 cells after BRM014 treatment compared to DMSO control for different treatment length. Significant changes (Padj < 0.01 and abs(log2 fold-change) >1) are colored in red. (d) Boxplots of accessibility changes measured as log2 fold-changes after BRM014 treatment in WT cells for the clustered genomic regions in Fig. 2a (n=2 independent experiments). First and third quartiles are denoted by lower and upper hinges, center is median. The upper/lower whisker extendes to the largest/ smallest value no further than 1.5* inter-quartile range. Data points beyond are plotted individually.
Extended Data Fig. 6. Motif analyses of BRM014 and ACBI1 time-course ATAC-seq data.
(a) Motif enrichment results measured as -log10 p-value per cluster. Only -log10 p-values reaching a significance level of 20 in any cluster are shown. (b) ATAC read density (RPGC normalized) at different motifs shown in aggregation plots (middle) and in heatmaps (bottom) across the time-course of BRM014 and ACBI1 treatment in WT cells. The top 2000 motif sites in the ATAC consensus peaks were analyzed.
Extended Data Fig. 7. Nascent transcription is weakly influenced by BRM014 treatment.
(a) Volcano plots displaying the PRO-seq nascent transcription changes in HAP1 cells after BRM014 treatment compared to DMSO control for different treatment length. Significant changes (Padj < 0.01 and abs(log2 fold-change) >1) are colored in red. (b) Scatterplot of log2 fold-changes in ATAC-seq and PRO-seq signal after BRM014 treatment at different time-points compared to DMSO control experiments stratified by the five clusters from Fig. 3a. (c) Aggregate coverage plots of ATAC-seq (top) and PRO-seq (bottom) signal after BRM014 treatment for different time-points in cluster I – V. Signal is centered and averaged (mean +/- s.e.m.) over the genomic regions. Plus and minus strands are shown for PRO-Seq. (d) Line plots of median log2 fold-changes of BRM014 treatment versus DMSO control with standard errors in ATAC-seq and PRO-seq experiments at different time-points for the five clusters from Fig. 3a (n=2 independent experiments). Data is presented as median ± SEM (number of loci: I 102, II 473, III 749, IV 456, V 721). (e) Aggregate coverage plots of ATAC-seq (top) and PRO-seq (bottom) signal after BRM014 treatment at different time-points for BAF-bound active enhancer and super-enhancer regions. Signal is centered and averaged (mean +/- s.e.m.) over the genomic regions. Plus and minus strands are shown for PRO-Seq.
Extended Data Fig. 8. Dual SMARCA2 and SMARCA4 degradation by PROTAC leads to accessibility changes correlating with changes observed after inhibition of both ATPases.
(a) Western blot analysis of HAP1 cell cytoplasmic, nucleoplasmic and chromatin fractions after ACBI1 treatment (cropped images). (b) Volcano plots displaying the chromatin accessibility changes in HAP1 cells after ACBI1 treatment compared to DMSO control for 6h and 72h treatment. Significant changes (Padj < 0.01 and abs(log2 fold-changes) >1) are colored in red. (c, left) Scatter plot of log2 fold accessibility changes after 24h dTAG47 treatment of SMARCA4dTAG versus DMSO control (y-axis) against log2 fold accessibility changes after 24h ACBI1 treatment of WT cells versus DMSO control (x-axis). Pearson correlation coefficient is depicted. (c, right) Scatter plot of log2 fold accessibility changes after 24h BRM014 treatment versus DMSO control (y-axis) and log2 fold accessibility changes after 24h ACBI1 treatment of WT cells versus DMSO control (x-axis). Pearson correlation coefficient is depicted. (d) Heatmap of accessibility changes measured as log2 fold-changes after BRM014 or ACBI1 treatment versus DMSO control for the 5 clusters from Fig. 3a.
Extended Data Fig. 9. Chromatin and gene expression changes in synthetic lethal conditions.
(a) Heatmap of Z-scores of ATAC-, ChIP- and RNA-seq counts for the genomic regions differentially accessible in the synthetic lethal conditions after dTAG47 treatment (cluster 6 – 11 from Fig. 4b). Quantile normalized counts are depicted for ATAC- and ChIP-seq experiments. Variance stabilizing transformation normalized counts are depicted for RNA-seq experiments. (b) Chromatin accessibility signal (measured by ATAC-seq) and enrichment of different factors or histone modifications (measured by ChIP-seq) are displayed for all differential sites from the dTAG time-courses sorted by H3K27ac signal. Aggregate coverageplot on the top depicts the mean accessibility or factor enrichment of the regions per sample. (c) Violin plots showing log2 counts for ARID1A, H3K27ac and BRD4 binding to regions of the 11 different clusters under wild-type condition (n=1). First and third quartiles are denoted by lower and upper hinges, center is median. The upper/lower whisker extendes to the largest/ smallest value no further than 1.5* inter-quartile range. Data points beyond are plotted individually. (d) Enrichment of HAP1-specific features that overlap with BAF-bound regions on genomic regions per cluster. Enrichment was calculated against all consensus regions. Color code corresponds to the -log10 p-value. Dot size corresponds to the effect size measured as odds ratio. Two-sided Fisher’s exact test was performed. False discovery rate (FDR) correction was performed as implemented in LOLA software. (e) Volcano plots displaying the PRO-seq nascent transcription changes in SMARCA4KOSMARCA2dTAG cells after 3h dTAG47 treatment compared to DMSO control. No significant changes (Padj < 0.01 and abs(log2 fold-change) >1). (f) Enrichment of enhancer types overlapping BAF-bound genomic regions per cluster. Enrichment was calculated against all consensus regions. Color code corresponds to the -log10 p-value. Dot size corresponds to the effect size measured as odds ratio. Two-sided Fisher’s exact test was performed. False discovery rate (FDR) correction was performed as implemented in LOLA software.
Extended Data Fig. 10. Chromatin and gene-expression alterations after loss of chromatin accessibility at super-enhancers.
(a) Boxplots showing log2 fold-changes of all differential regions annotated as super-enhancers (n=444) over time after dTAG47 treatment in the different HAP1 dTAG cell lines. First and third quartiles are denoted by lower and upper hinges, center is median. The upper/lower whisker extendes to the largest/ smallest value no further than 1.5* inter-quartile range. Data points beyond are plotted individually. (b) Heatmap of log2 fold-changes of ATAC and H3K27ac ChIP-seq signal in WT SMARCA4dTAG and SMARCA4KO SMARCA2dTAG cells after dTAG47 treatment versus DMSO control for the genomic regions differentially accessible in any cell line after TAG47 treatment (cluster 1 – 11). (c) Violin plots of log2 expression fold-changes from RNA-seq experiments for all regions, active enhancer and super enhancer regions showing a decrease in accessibility ATAC-seq signal and either a decrease (log2 fold-change < 1) in H3K27 acetylation ChIP-signal at 24h (red) or no response (log2 fold-change > -1 and < 1) in H3K27 acetylation ChIP-signal at 24h (blue) in SMARCA4dTAG, SMARCA4KOSMARCA2dTAG and SMARCC1KOSMARCC2dTAG cells after dTAG47 treatment (n=2 independent experiments). First and third quartiles are denoted by lower and upper hinges, center is median. The upper/lower whisker extendes to the largest/ smallest value no further than 1.5* inter-quartile range. Data points beyond are plotted individually. Differential genes were defined as padjust < 0.01 und log2(fold-change) > 1.
Supplementary Material
Acknowledgements
We thank the Biomedical Sequencing Facility, the Proteomics and Metabolomics Facility and the Platform Austria for Chemical Biology (PLACEBO) at CeMM for their support in generating and analyzing the next generation sequencing or proteomics data, respectively. We gratefully acknowledge Haplogen and Horizon Discovery for HAP1 cell lines. Research in the Kubicek laboratory is supported by the Austrian Federal Ministry for Digital and Economic Affairs and the National Foundation for Research, Technology, and Development, the Austrian Science Fund (FWF) F4701 and the European Research Council (ERC) under the European Union’s Horizon 2020 research and innovation programme (ERC-CoG-772437). C.B. is supported by an ERC Starting Grant (European Union’s Horizon 2020 research and innovation programme, grant agreement no. 679146). S.G. is supported by the Peter and Traudl Engelhorn Foundation.
Footnotes
Author Contributions
S.S., M.P. and S.K. planned the study and designed the experiments; K.K., S.S., D.D., M.J., G.H., J.G.L., A.K. performed the experiments; M.J. and G.W. provided dTAG expertise, constructs and compounds, S.G., A.F.R., N.M., A.M., M.J., M.S., H.I., S.S., and S.K. analyzed the data; S.S. and S.K. wrote the manuscript with input from all coauthors; S.S., M.P., A.M., C.B., G.W., S.K. supervised the work.
Competing Interests Statement
M.P. is an employee of Boehringer Ingelheim RCV GmbH & Co KG. G.W. and S.K. are co-founders and shareholders of Proxygen GmbH.
Data availability
Next-generation sequencing data are deposited to the NCBI GEO repository (GSE148175) and mass spectrometry data to PRIDE (Project accession: PXD018381).
Code availability
All code is available via GitHub (https://github.com/Kubicek-Lab-at-CeMM/BAF-kinetics).
References
- 1.Hodges C, Kirkland JG, Crabtree GR. The Many Roles of BAF (mSWI/SNF) and PBAF Complexes in Cancer. Cold Spring Harb Perspect Med. 2016;6 doi: 10.1101/cshperspect.a026930. [DOI] [PMC free article] [PubMed] [Google Scholar]
- 2.Kadoch C, Crabtree GR. Mammalian SWI/SNF chromatin remodeling complexes and cancer: Mechanistic insights gained from human genomics. Sci Adv. 2015;1:e1500447. doi: 10.1126/sciadv.1500447. [DOI] [PMC free article] [PubMed] [Google Scholar]
- 3.Kadoch C, et al. Proteomic and bioinformatic analysis of mammalian SWI/SNF complexes identifies extensive roles in human malignancy. Nat Genet. 2013;45:592–601. doi: 10.1038/ng.2628. [DOI] [PMC free article] [PubMed] [Google Scholar]
- 4.Mittal P, Roberts CWM. The SWI/SNF complex in cancer - biology, biomarkers and therapy. Nat Rev Clin Oncol. 2020;17:435–448. doi: 10.1038/s41571-020-0357-3. [DOI] [PMC free article] [PubMed] [Google Scholar]
- 5.Shain AH, Pollack JR. The spectrum of SWI/SNF mutations, ubiquitous in human cancers. PLoS One. 2013;8:e55119. doi: 10.1371/journal.pone.0055119. [DOI] [PMC free article] [PubMed] [Google Scholar]
- 6.Hargreaves DC, Crabtree GR. ATP-dependent chromatin remodeling: genetics, genomics and mechanisms. Cell Res. 2011;21:396–420. doi: 10.1038/cr.2011.32. [DOI] [PMC free article] [PubMed] [Google Scholar]
- 7.Pulice JL, Kadoch C. Composition and Function of Mammalian SWI/SNF Chromatin Remodeling Complexes in Human Disease. Cold Spring Harb Symp Quant Biol. 2016;81:53–60. doi: 10.1101/sqb.2016.81.031021. [DOI] [PubMed] [Google Scholar]
- 8.Bailey MH, et al. Comprehensive Characterization of Cancer Driver Genes and Mutations. Cell. 2018;173:371–385.:e18. doi: 10.1016/j.cell.2018.02.060. [DOI] [PMC free article] [PubMed] [Google Scholar]
- 9.Schick S, et al. Systematic characterization of BAF mutations provides insights into intracomplex synthetic lethalities in human cancers. Nat Genet. 2019;51:1399–1410. doi: 10.1038/s41588-019-0477-9. [DOI] [PMC free article] [PubMed] [Google Scholar]
- 10.Kelso TWR, et al. Chromatin accessibility underlies synthetic lethality of SWI/SNF subunits in ARID1A-mutant cancers. Elife. 2017;6 doi: 10.7554/eLife.30506. [DOI] [PMC free article] [PubMed] [Google Scholar]
- 11.Barisic D, Stadler MB, Iurlaro M, Schubeler D. Mammalian ISWI and SWI/SNF selectively mediate binding of distinct transcription factors. Nature. 2019;569:136–140. doi: 10.1038/s41586-019-1115-5. [DOI] [PMC free article] [PubMed] [Google Scholar]
- 12.Hodges HC, et al. Dominant-negative SMARCA4 mutants alter the accessibility landscape of tissue-unrestricted enhancers. Nat Struct Mol Biol. 2018;25:61–72. doi: 10.1038/s41594-017-0007-3. [DOI] [PMC free article] [PubMed] [Google Scholar]
- 13.Menon DU, Shibata Y, Mu W, Magnuson T. Mammalian SWI/SNF collaborates with a polycomb-associated protein to regulate male germline transcription in the mouse. Development. 2019;146 doi: 10.1242/dev.174094. [DOI] [PMC free article] [PubMed] [Google Scholar]
- 14.Xu G, et al. ARID1A determines luminal identity and therapeutic response in estrogen-receptor-positive breast cancer. Nat Genet. 2020;52:198–207. doi: 10.1038/s41588-019-0554-0. [DOI] [PMC free article] [PubMed] [Google Scholar]
- 15.Mathur R, et al. ARID1A loss impairs enhancer-mediated gene regulation and drives colon cancer in mice. Nat Genet. 2017;49:296–302. doi: 10.1038/ng.3744. [DOI] [PMC free article] [PubMed] [Google Scholar]
- 16.Alver BH, et al. The SWI/SNF chromatin remodelling complex is required for maintenance of lineage specific enhancers. Nat Commun. 2017;8:14648. doi: 10.1038/ncomms14648. [DOI] [PMC free article] [PubMed] [Google Scholar]
- 17.Wang X, et al. SMARCB1-mediated SWI/SNF complex function is essential for enhancer regulation. Nat Genet. 2017;49:289–295. doi: 10.1038/ng.3746. [DOI] [PMC free article] [PubMed] [Google Scholar]
- 18.Nakayama RT, et al. SMARCB1 is required for widespread BAF complex-mediated activation of enhancers and bivalent promoters. Nat Genet. 2017;49:1613–1623. doi: 10.1038/ng.3958. [DOI] [PMC free article] [PubMed] [Google Scholar]
- 19.King HW, Klose RJ. The pioneer factor OCT4 requires the chromatin remodeller BRG1 to support gene regulatory element function in mouse embryonic stem cells. Elife. 2017;6 doi: 10.7554/eLife.22631. [DOI] [PMC free article] [PubMed] [Google Scholar]
- 20.Hoffman GR, et al. Functional epigenetics approach identifies BRM/SMARCA2 as a critical synthetic lethal target in BRG1-deficient cancers. Proc Natl Acad Sci U S A. 2014;111:3128–33. doi: 10.1073/pnas.1316793111. [DOI] [PMC free article] [PubMed] [Google Scholar]
- 21.Wilson BG, et al. Residual complexes containing SMARCA2 (BRM) underlie the oncogenic drive of SMARCA4 (BRG1) mutation. Mol Cell Biol. 2014;34:1136–44. doi: 10.1128/MCB.01372-13. [DOI] [PMC free article] [PubMed] [Google Scholar]
- 22.Oike T, et al. A synthetic lethality-based strategy to treat cancers harboring a genetic deficiency in the chromatin remodeling factor BRG1. Cancer Res. 2013;73:5508–18. doi: 10.1158/0008-5472.CAN-12-4593. [DOI] [PubMed] [Google Scholar]
- 23.Mashtalir N, et al. Modular Organization and Assembly of SWI/SNF Family Chromatin Remodeling Complexes. Cell. 2018;175:1272–1288.:e20. doi: 10.1016/j.cell.2018.09.032. [DOI] [PMC free article] [PubMed] [Google Scholar]
- 24.Narayanan R, et al. Loss of BAF (mSWI/SNF) Complexes Causes Global Transcriptional and Chromatin State Changes in Forebrain Development. Cell Rep. 2015;13:1842–54. doi: 10.1016/j.celrep.2015.10.046. [DOI] [PubMed] [Google Scholar]
- 25.Papillon JPN, et al. Discovery of Orally Active Inhibitors of Brahma Homolog (BRM)/SMARCA2 ATPase Activity for the Treatment of Brahma Related Gene 1 (BRG1)/SMARCA4-Mutant Cancers. J Med Chem. 2018;61:10155–10172. doi: 10.1021/acs.jmedchem.8b01318. [DOI] [PubMed] [Google Scholar]
- 26.Farnaby W, et al. BAF complex vulnerabilities in cancer demonstrated via structure-based PROTAC design. Nat Chem Biol. 2019;15:672–680. doi: 10.1038/s41589-019-0294-6. [DOI] [PMC free article] [PubMed] [Google Scholar]
- 27.Mashtalir N, et al. A Structural Model of the Endogenous Human BAF Complex Informs Disease Mechanisms. Cell. 2020;183:802–817.:e24. doi: 10.1016/j.cell.2020.09.051. [DOI] [PMC free article] [PubMed] [Google Scholar]
- 28.Han Y, Reyes AA, Malik S, He Y. Cryo-EM structure of SWI/SNF complex bound to a nucleosome. Nature. 2020;579:452–455. doi: 10.1038/s41586-020-2087-1. [DOI] [PMC free article] [PubMed] [Google Scholar]
- 29.He S, et al. Structure of nucleosome-bound human BAF complex. Science. 2020;367:875–881. doi: 10.1126/science.aaz9761. [DOI] [PubMed] [Google Scholar]
- 30.Wagner FR, et al. Structure of SWI/SNF chromatin remodeller RSC bound to a nucleosome. Nature. 2020;579:448–451. doi: 10.1038/s41586-020-2088-0. [DOI] [PMC free article] [PubMed] [Google Scholar]
- 31.Ye Y, et al. Structure of the RSC complex bound to the nucleosome. Science. 2019;366:838–843. doi: 10.1126/science.aay0033. [DOI] [PMC free article] [PubMed] [Google Scholar]
- 32.Owen-Hughes T, Utley RT, Cote J, Peterson CL, Workman JL. Persistent site-specific remodeling of a nucleosome array by transient action of the SWI/SNF complex. Science. 1996;273:513–6. doi: 10.1126/science.273.5274.513. [DOI] [PubMed] [Google Scholar]
- 33.Phelan ML, Sif S, Narlikar GJ, Kingston RE. Reconstitution of a core chromatin remodeling complex from SWI/SNF subunits. Mol Cell. 1999;3:247–53. doi: 10.1016/s1097-2765(00)80315-9. [DOI] [PubMed] [Google Scholar]
- 34.Wang W, et al. Purification and biochemical heterogeneity of the mammalian SWI-SNF complex. EMBO J. 1996;15:5370–82. [PMC free article] [PubMed] [Google Scholar]
- 35.Wang W, et al. Diversity and specialization of mammalian SWI/SNF complexes. Genes Dev. 1996;10:2117–30. doi: 10.1101/gad.10.17.2117. [DOI] [PubMed] [Google Scholar]
- 36.Biggar SR, Crabtree GR. Continuous and widespread roles for the Swi-Snf complex in transcription. EMBO J. 1999;18:2254–64. doi: 10.1093/emboj/18.8.2254. [DOI] [PMC free article] [PubMed] [Google Scholar]
- 37.Kubik S, et al. Opposing chromatin remodelers control transcription initiation frequency and start site selection. Nat Struct Mol Biol. 2019;26:744–754. doi: 10.1038/s41594-019-0273-3. [DOI] [PubMed] [Google Scholar]
- 38.Kadoch C, et al. Dynamics of BAF-Polycomb complex opposition on heterochromatin in normal and oncogenic states. Nat Genet. 2017;49:213–222. doi: 10.1038/ng.3734. [DOI] [PMC free article] [PubMed] [Google Scholar]
- 39.Miller EL, et al. TOP2 synergizes with BAF chromatin remodeling for both resolution and formation of facultative heterochromatin. Nat Struct Mol Biol. 2017;24:344–352. doi: 10.1038/nsmb.3384. [DOI] [PMC free article] [PubMed] [Google Scholar]
- 40.Nabet B, et al. The dTAG system for immediate and target-specific protein degradation. Nat Chem Biol. 2018;14:431–441. doi: 10.1038/s41589-018-0021-8. [DOI] [PMC free article] [PubMed] [Google Scholar]
- 41.Rago F, et al. Degron mediated BRM/SMARCA2 depletion uncovers novel combination partners for treatment of BRG1/SMARCA4-mutant cancers. Biochem Biophys Res Commun. 2019;508:109–116. doi: 10.1016/j.bbrc.2018.09.009. [DOI] [PubMed] [Google Scholar]
- 42.Buenrostro JD, Wu B, Chang HY, Greenleaf WJ. ATAC-seq: A Method for Assaying Chromatin Accessibility Genome-Wide. Curr Protoc Mol Biol. 2015;109:21 29 1–21 29 9. doi: 10.1002/0471142727.mb2129s109. [DOI] [PMC free article] [PubMed] [Google Scholar]
- 43.Mahat DB, et al. Base-pair-resolution genome-wide mapping of active RNA polymerases using precision nuclear run-on (PRO-seq) Nat Protoc. 2016;11:1455–76. doi: 10.1038/nprot.2016.086. [DOI] [PMC free article] [PubMed] [Google Scholar]
- 44.Loven J, et al. Selective inhibition of tumor oncogenes by disruption of super-enhancers. Cell. 2013;153:320–34. doi: 10.1016/j.cell.2013.03.036. [DOI] [PMC free article] [PubMed] [Google Scholar]
- 45.Hnisz D, et al. Super-enhancers in the control of cell identity and disease. Cell. 2013;155:934–47. doi: 10.1016/j.cell.2013.09.053. [DOI] [PMC free article] [PubMed] [Google Scholar]
- 46.Whyte WA, et al. Master transcription factors and mediator establish super-enhancers at key cell identity genes. Cell. 2013;153:307–19. doi: 10.1016/j.cell.2013.03.035. [DOI] [PMC free article] [PubMed] [Google Scholar]
- 47.Bao X, et al. A novel ATAC-seq approach reveals lineage-specific reinforcement of the open chromatin landscape via cooperation between BAF and p63. Genome Biol. 2015;16:284. doi: 10.1186/s13059-015-0840-9. [DOI] [PMC free article] [PubMed] [Google Scholar]
- 48.Berns K, et al. ARID1A mutation sensitizes most ovarian clear cell carcinomas to BET inhibitors. Oncogene. 2018;37:4611–4625. doi: 10.1038/s41388-018-0300-6. [DOI] [PMC free article] [PubMed] [Google Scholar]
- 49.Brand M, Winter GE. Locus-Specific Knock-In of a Degradable Tag for Target Validation Studies. Methods Mol Biol. 2019;1953:105–119. doi: 10.1007/978-1-4939-9145-7_7. [DOI] [PubMed] [Google Scholar]
- 50.Erb MA, et al. Transcription control by the ENL YEATS domain in acute leukaemia. Nature. 2017;543:270–274. doi: 10.1038/nature21688. [DOI] [PMC free article] [PubMed] [Google Scholar]
- 51.Weintraub AS, et al. YY1 Is a Structural Regulator of Enhancer-Promoter Loops. Cell. 2017;171:1573–1588.:e28. doi: 10.1016/j.cell.2017.11.008. [DOI] [PMC free article] [PubMed] [Google Scholar]
- 52.Wisniewski JR, Zougman A, Nagaraj N, Mann M. Universal sample preparation method for proteome analysis. Nat Methods. 2009;6:359–62. doi: 10.1038/nmeth.1322. [DOI] [PubMed] [Google Scholar]
- 53.Jaeger MG, et al. Selective Mediator dependence of cell-type-specifying transcription. Nat Genet. 2020;52:719–727. doi: 10.1038/s41588-020-0635-0. [DOI] [PMC free article] [PubMed] [Google Scholar]
- 54.Love MI, Huber W, Anders S. Moderated estimation of fold change and dispersion for RNA-seq data with DESeq2. Genome Biol. 2014;15:550. doi: 10.1186/s13059-014-0550-8. [DOI] [PMC free article] [PubMed] [Google Scholar]
- 55.Ramirez F, et al. deepTools2: a next generation web server for deep-sequencing data analysis. Nucleic Acids Res. 2016;44:W160–5. doi: 10.1093/nar/gkw257. [DOI] [PMC free article] [PubMed] [Google Scholar]
- 56.Sheffield NC, Bock C. LOLA: enrichment analysis for genomic region sets and regulatory elements in R and Bioconductor. Bioinformatics. 2016;32:587–9. doi: 10.1093/bioinformatics/btv612. [DOI] [PMC free article] [PubMed] [Google Scholar]
- 57.Heinz S, et al. Simple combinations of lineage-determining transcription factors prime cis-regulatory elements required for macrophage and B cell identities. Mol Cell. 2010;38:576–89. doi: 10.1016/j.molcel.2010.05.004. [DOI] [PMC free article] [PubMed] [Google Scholar]
- 58.Yu G, Wang LG, Han Y, He QY. clusterProfiler: an R package for comparing biological themes among gene clusters. OMICS. 2012;16:284–7. doi: 10.1089/omi.2011.0118. [DOI] [PMC free article] [PubMed] [Google Scholar]
- 59.Robinson JT, Thorvaldsdottir H, Wenger AM, Zehir A, Mesirov JP. Variant Review with the Integrative Genomics Viewer. Cancer Res. 2017;77:e31–e34. doi: 10.1158/0008-5472.CAN-17-0337. [DOI] [PMC free article] [PubMed] [Google Scholar]
- 60.Dietlein F, et al. Identification of cancer driver genes based on nucleotide context. Nat Genet. 2020;52:208–218. doi: 10.1038/s41588-019-0572-y. [DOI] [PMC free article] [PubMed] [Google Scholar]
- 61.Blomen VA, et al. Gene essentiality and synthetic lethality in haploid human cells. Science. 2015;350:1092–6. doi: 10.1126/science.aac7557. [DOI] [PubMed] [Google Scholar]
Associated Data
This section collects any data citations, data availability statements, or supplementary materials included in this article.
Supplementary Materials
Data Availability Statement
Next-generation sequencing data are deposited to the NCBI GEO repository (GSE148175) and mass spectrometry data to PRIDE (Project accession: PXD018381).
All code is available via GitHub (https://github.com/Kubicek-Lab-at-CeMM/BAF-kinetics).


