Abstract
Cancer cells have high demands for non-essential amino acids (NEAA), which are precursors for anabolic and anti-oxidant pathways supporting cell survival and proliferation. It is well established that cancer cells consume the NEAA cysteine, and that cysteine deprivation can induce cell death, however, the specific factors governing acute sensitivity to cysteine starvation are poorly characterised. Here we show that that neither expression of enzymes for cysteine synthesis nor availability of the primary precursor methionine correlated with acute sensitivity to cysteine starvation. We observed a strong correlation between efflux of the methionine-derived metabolite methylthioadenosine (MTA), and cysteine starvation sensitivity. MTA efflux results from genetic deletion of methylthioadenosine phosphorylase (MTAP), which is frequently deleted in cancers. We show that MTAP loss up-regulates polyamine metabolism which, concurrent with cysteine withdrawal, promotes elevated ROS and prevents cell survival. Our results reveal an unexplored metabolic weakness at the intersection of polyamine and cysteine metabolism.
Keywords: Cysteine, cystine, methionine, cancer, MTAP, spermine, spermidine, polyamines, non-essential amino acid, ferroptosis, starvation
Introduction
Cancer cells acquire metabolic adaptations that support their enhanced rates of growth and proliferation1,2. While these adaptations help tune metabolism to support higher anabolic output and bolster anti-oxidant defences, they can also decrease metabolic flexibility and increase dependence on nutrient uptake versus de novo synthesis3,4. There is considerable evidence that cysteine (which commonly exists as the homo-dimer cystine), while technically a NEAA, is required as an essential exogenous nutrient to support cancer cell proliferation. This was noted during the seminal work of Harry Eagle and colleagues in the 1950s5–7. Recent work shows that cysteine withdrawal in certain contexts does not simply impede cancer cell proliferation, but can trigger a distinct iron-dependent form of cell death involving lipid peroxidation termed ferroptosis8,9. Oncogene expression has been shown to promote sensitivity to cysteine limitation10,11, and enzymatic depletion of cysteine has been used to limit tumour growth in murine cancer models12. Inhibition of cystine uptake (xCT transporter), which is up-regulated in tumours13, can also induce ferroptosis14. Overall these studies suggest that limiting cysteine availability is a potentially promising anti-cancer strategy.
A vital cellular function of cysteine is its requirement, along with glycine and glutamate, for synthesis of the major cellular anti-oxidant glutathione (GSH). In cancer cells the up-regulated metabolic processes that support uncontrolled proliferation generate elevated levels of reactive oxygen species (ROS). Adequate levels of GSH synthesis and turnover are therefore vital in supporting cancer cell survival and proliferation3,15. Activation of the NRF2 pathway is common in cancer and drives anti-oxidant responses16, including increased cystine uptake17 and metabolic adaptation to elevated cellular cysteine18. Recent studies show that an important corollary of elevated cystine uptake is an increased dependency on glutaminolysis, which has potential to be targeted therapeutically17, 19–21. Besides its role in GSH synthesis, cysteine is also essential for the synthesis of proteins and protein co-factors such as iron-sulphur clusters, which are important for ROS-sensing22. Better mechanistic understanding of cysteine essentiality will allow improved application of therapeutic strategies that limit cysteine availability.
Previous reports suggest that cancer cells have impaired expression of enzymes for de novo cysteine synthesis via the transsulfuration (also referred to as reverse transsulfuration) pathway (TsP)23,24. Recent work shows that certain cancer cells up-regulate TsP enzymes to improve survival during cysteine limitation25. Here we show, in a panel of cancer cell lines (including breast, colorectal and pancreatic cancer) that TsP enzyme expression did not predict which cells where most sensitive to cysteine starvation. The ultimate upstream precursor of the TsP is the essential amino acid methionine. Methionine, via conversion to S-adenosylmethionine (SAM) and S-adenosylhomocysteine (SAH), supplies homocysteine to the TsP26. While exogenous homocysteine was able to rescue cells from cysteine starvation, methionine did not.
We show that much of the methionine taken up by cancer cells enters the polyamine synthesis pathway, which, through synthesis of spermidine and spermine, consumes SAM and produces 5-methylthioadenosine (MTA). We observed a strong correlation between cellular efflux of MTA (a metabolic consequence of MTAP deletion) and cysteine starvation sensitivity. We found that cells with MTAP deletion (a frequent occurrence in cancer27–29) had increased polyamine pathway activity. We initially hypothesised that polyamine synthesis caused cysteine starvation sensitivity by diverting methionine away from de novo cysteine synthesis. However, detailed metabolic analysis revealed that elevated polyamine metabolism is a metabolic liability during cysteine starvation, independent of the TsP.
Results
Cancer cells are generally sensitive to cysteine starvation and some are highly sensitive
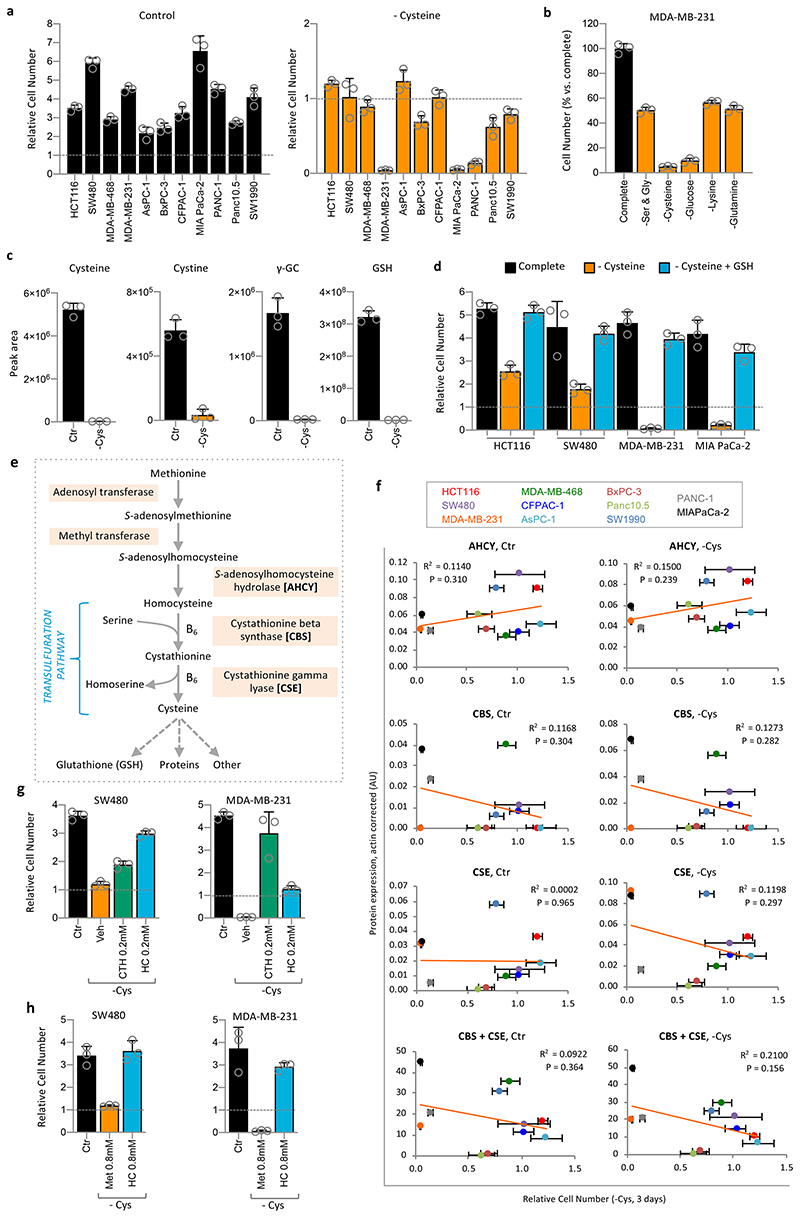
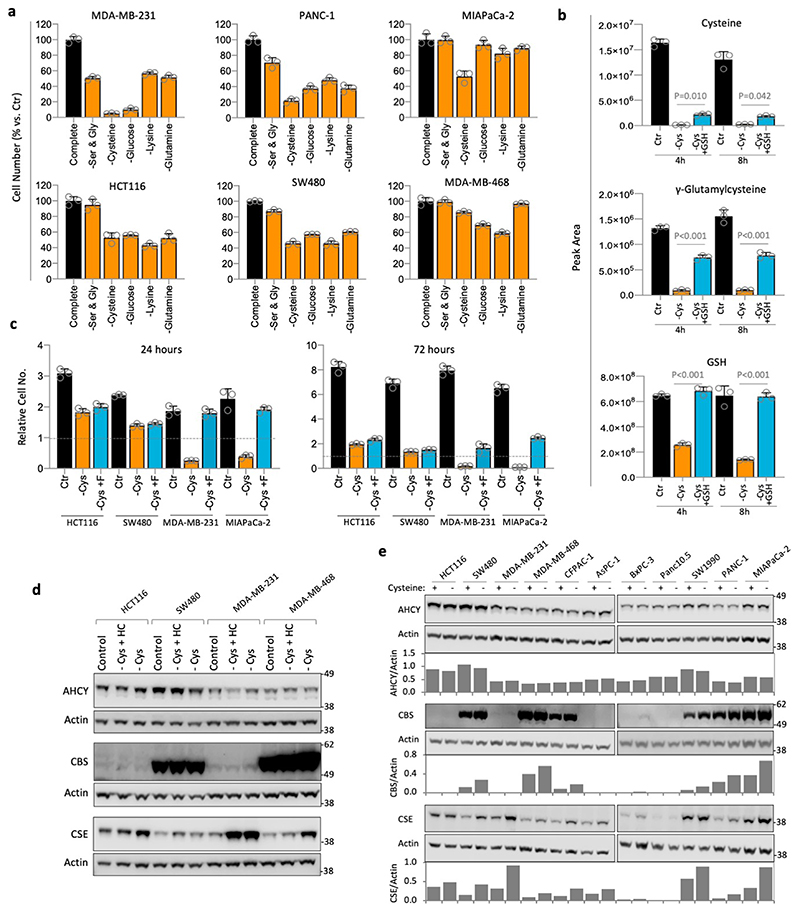
To assess cysteine starvation in a range of cancer cells we utilised a panel of cell lines routinely used in our lab consisting of colorectal (HCT116 & SW480), breast (MDA-MB-231 & MDA-MB-468) and pancreatic cancers (AsPC-1, BxPC-3, CFPAC-1, MIAPaCa-2, PANC-1, Panc10.5 & SW1990). In all experiments, where cysteine was removed, its homo-dimer cystine was also absent. As expected, after three days of cysteine starvation all 11 cell lines showed severely impaired proliferation (Figure 1a). Interestingly, several cell lines maintained approximately the same cell number during starvation (e.g. HCT116, SW480, MDA-MB-468, AsPC-1), indicating that they had survived. Whereas other lines − particularly MDA-MB-231, MIAPaCa-2 and PANC-1 − had a relative cell number (versus the starting cell number) below one, indicating that cell death had occurred.
Figure 1. Cancer cell lines are generally sensitive to cysteine starvation, and some are highly sensitive.
(a) Colorectal (HCT116, SW480), breast (MDA-MB-231, MDA-MB-468) and pancreatic cancer (AsPC-1, BxPC-3, CFPAC-1, MIAPaCa-2, PANC-1, Panc10.05 and SW1990) cells were grown in complete medium, or medium lacking cysteine (and cystine, as for all following experiments) for 3 days. A ‘time-0’ plate was included to record the starting cell number to be able to calculate relative cell numbers. (b) MDA-MB-231 cells were grown in complete medium, or matched medium lacking the stated nutrients for 24h. (c) MDA-MB-231 cells were either grown in complete medium, or matched medium lacking cysteine for 24h. Metabolites were extracted and analysed by LCMS. (d) Cell lines were grown in complete medium, or matched medium lacking cysteine, with or without glutathione (GSH) 5mM for 3 days. (e) Schematic diagram depicting de novo cysteine synthesis, which occurs via the transsulfuration pathway. B6 = vitamin B6. (f) The panel of cell lines shown in Figure 1a was grown with (Control) or without cysteine (-Cysteine) for 24h. Enzymes involved in cysteine synthesis were detected by western blot and quantified with a LiCor infra-red scanner. Actin-corrected band intensities (AU, arbitrary units) are plotted on the y-axis. Relative cell number after 3 days cysteine starvation (as shown in Fig.1a) are plotted on the x-axis. Trendlines and Pearson correlation coefficients are shown on the scatter plots. P-value = two-sided Student’s t-distribution. (g) SW480 and MDA-MB-231 cells were grown in complete medium (containing methionine 0.2mM) or medium lacking cysteine and cystine supplemented with cystathionine (CTH) or homocysteine (HC) at the concentrations shown and allowed to grow for 3 days. (h) SW480 and MDA-MB-231 cells were grown in complete medium (containing methionine 0.2mM) or media lacking cysteine supplemented with homocysteine (HC) 0.8mM or methionine (Met) 0.8mM. All data are averages of n=3 biological replicates, error bars are SD. γ-GC = γ-glutamylcysteine. See Figure S1e for western blots of enzyme expression used in (f).
We compared the response of cells to cysteine starvation versus other major nutrients. Certain cells - MDA-MB-231, MIAPaCa-2 and PANC-1 - were more sensitive to cysteine withdrawal (Fig. 1b & Extended Data Fig. 1a) than key non-essential amino acids (serine & glycine or glutamine), an essential amino acid (lysine), or even complete glucose removal. In contrast, HCT116, SW480 and MDA-MB-468 had similar sensitivity to cysteine withdrawal as other nutrients. We confirmed the basic metabolic effects of cysteine starvation using LCMS. As expected, we found that levels of intracellular cysteine and cystine were substantially depleted on removal of exogenous cysteine. Predictably, these changes were paralleled by decreases in glutathione (GSH) and its cysteine-derived precursor γ-glutamylcysteine (Fig. 1c).
Adding exogenous GSH fully restored intracellular GSH levels, and partially restored cysteine and γ-glutamylcysteine (Extended Data Fig. 1b), which prevented cell death and restored proliferation (Fig. 1d). Ferrostatin is a potent inhibitor of the iron-dependent cell death caused by cysteine starvation30. In sensitive cells, ferrostatin prevented cell death in response to cysteine starvation, and had little impact on the more resistant cells (Extended Data Fig. 1c). In contrast to GSH, ferrostatin did not restore proliferation, reflecting that, unlike GSH, ferrostatin acts downstream of metabolite changes and cannot directly supplement cysteine dependent metabolic pathways.
Transsulfuration enzyme expression fails to correlate with cysteine starvation sensitivity
Next, we investigated the relationship between response to cysteine starvation and expression of TsP enzymes for de novo cysteine synthesis (Fig. 1e). Scatter plots show that there was no correlation between starvation response and expression of S-adenosylhomocysteine hydrolase (AHCY), cystathione β-synthase (CBS), or cystathionine γ-lyase (CSE) (Fig. 1f & Extended Data Fig. 1d,e). Given the lack of correlation, we hypothesised that precursor availability might be a limiting factor in achieving de novo cysteine synthesis. Addition of homocysteine or cystathionine at 0.2mM produced a substantial rescue to survival/proliferation in less sensitive (SW480) and highly sensitive (MDA-MB-231) cells (Fig. 1g). Increasing homocysteine (0.8mM) further restored proliferation, however, supplementation with 0.8mM methionine (4-8 fold higher than culture medium) provided no rescue (Fig. 1h).
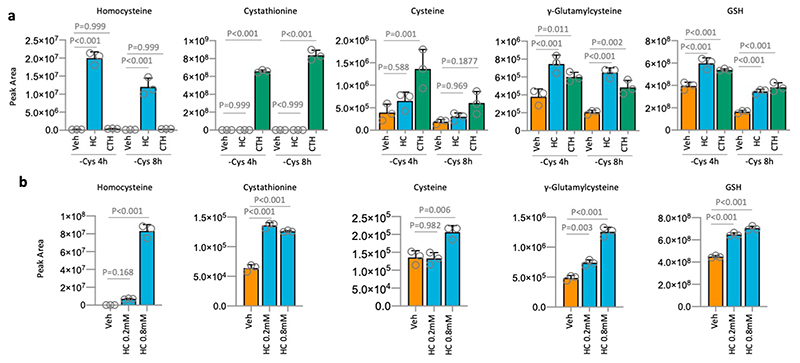
Intracellular homocysteine and cystathionine levels were significantly increased by their addition (at 0.2mM) to the culture medium, leading to moderate increases in cysteine levels, and more marked increases in γ-glutamylcysteine and GSH (Extended Data Fig. 2a). We noted that these increases were not on a scale required to restore metabolite levels to those seen under fed conditions (Fig. 1c), but anticipate that high pathway turnover in the starved state prevents metabolite accumulation. Notably, addition of 0.8mM homocysteine, which restored proliferation in addition to cell survival, provided a significant increase in cysteine levels (unlike 0.2mM homocysteine) (Extended Data Fig. 2b). This suggests that increasing GSH is required to promote survival (by combating ROS) and increasing steady state cysteine levels may be important for allowing cells to proliferate (e.g. by supporting protein synthesis). Supplementing cells with homocysteine had little impact on transsulfuration pathway enzyme expression beyond that caused by starvation alone (Extended Data Fig. 1d). The ability of exogenous homocysteine and cystathionine to rescue proliferation suggests that while transsulfuration enzyme levels may vary substantially between cell lines, the expression and activity of these enzymes is adequate to make cysteine if the proximal precursors are present in adequate quantities.
Methylthioadenosine efflux correlates with sensitivity to cysteine starvation
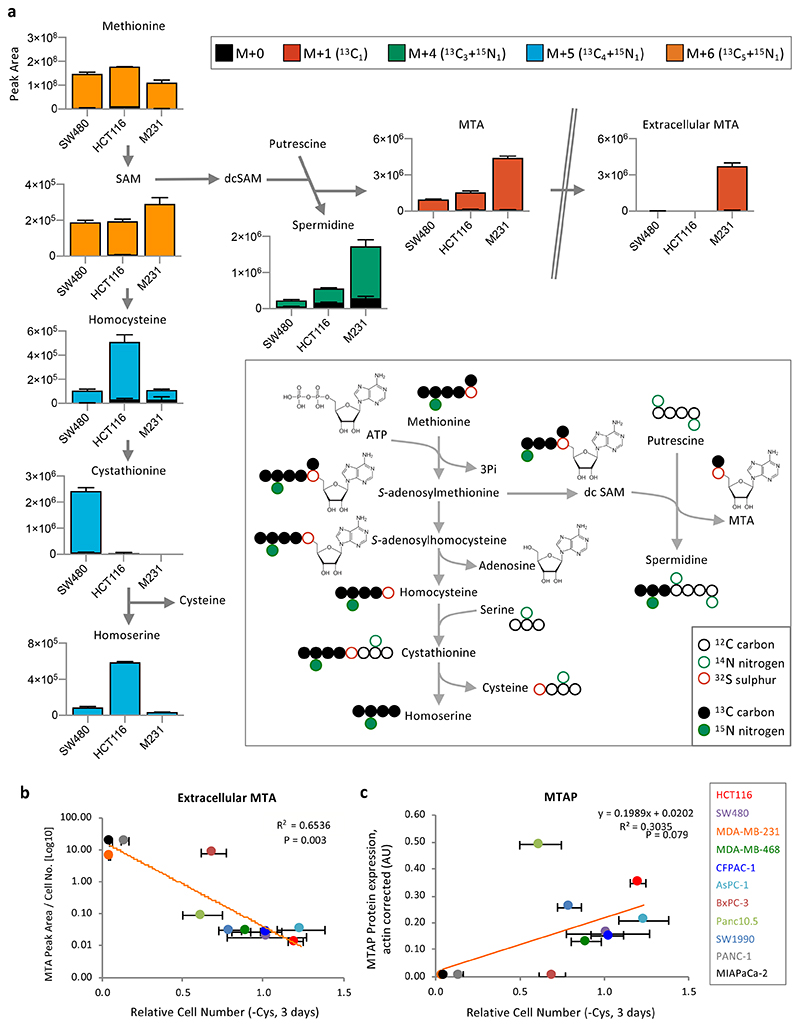
The essential amino acid methionine is the ultimate upstream precursor for cysteine synthesis (Fig. 1e), and should theoretically supply adequate levels of homocysteine for use in transsulfuration. Using 13C515N1-methionine we traced the fate of methionine in highly sensitive MDA-MB-231 cells, and less sensitive HCT116 and SW480 cells. In the HCT116 and SW480 cells, methionine entered the transsulfuration pathway, with labelling detected in homocysteine, cystathionine and homoserine (NB: cysteine carbons and nitrogen are not labelled from methionine as they are derived from serine − see schematic Fig. 2a). However, in MDA-MB-231 cells very little labelling from methionine was seen in transsulfuration pathway metabolites.
Figure 2. Methylthioadenosine efflux correlates with sensitivity to cysteine starvation.
(a) HCT116, SW480 and MDA-MB-231 (M231) cells were grown in complete medium (with 13C515N1-methionine 0.2mM substituted for methionine) for 48h. Metabolites were extracted and analysed by LCMS. Peaks for S-adenosylhomocysteine (SAH) were not detected by LCMS in this analysis. (b) The panel of 11 cancer cell lines shown in Fig.1a were grown in complete medium. Spent media samples were collected after 24h and analysed by LCMS. MTA peak area (normalized for cell number) is plotted versus the relative cell numbers after cysteine starvation shown in Fig. 1a. (c) MTAP protein expression was detected by western blot, quantified with a LiCor scanner and normalized to actin expression (see Extended Data Fig. 3a) and plotted versus cell number as described for Fig. 1f. Trendlines and Pearson correlation coefficients are shown on the scatter plots. P-value = two-sided Student’s t-distribution. LCMS data are averages of n=3 biological replicates, error bars are SD.
An alternative fate for methionine is polyamine synthesis31. Polyamines have important and diverse cellular functions and cancer cells frequently display elevated polyamine pathway activity32. Interestingly, we found that the highly cysteine starvation sensitive MDA-MB-231 cells had comparatively high levels of methionine derived labelling in the polyamine spermidine (Fig. 2a). Furthermore, the polyamine pathway by-product 5-methylthioadenosine (MTA, derived from S-adenosylmethionine) also showed increased levels and labelling in MDA-MB-231 cells. We also noted that unlike HCT116 and SW480, MDA-MB-231 cells had a substantial exogenous pool of methionine derived MTA (Fig. 2a).
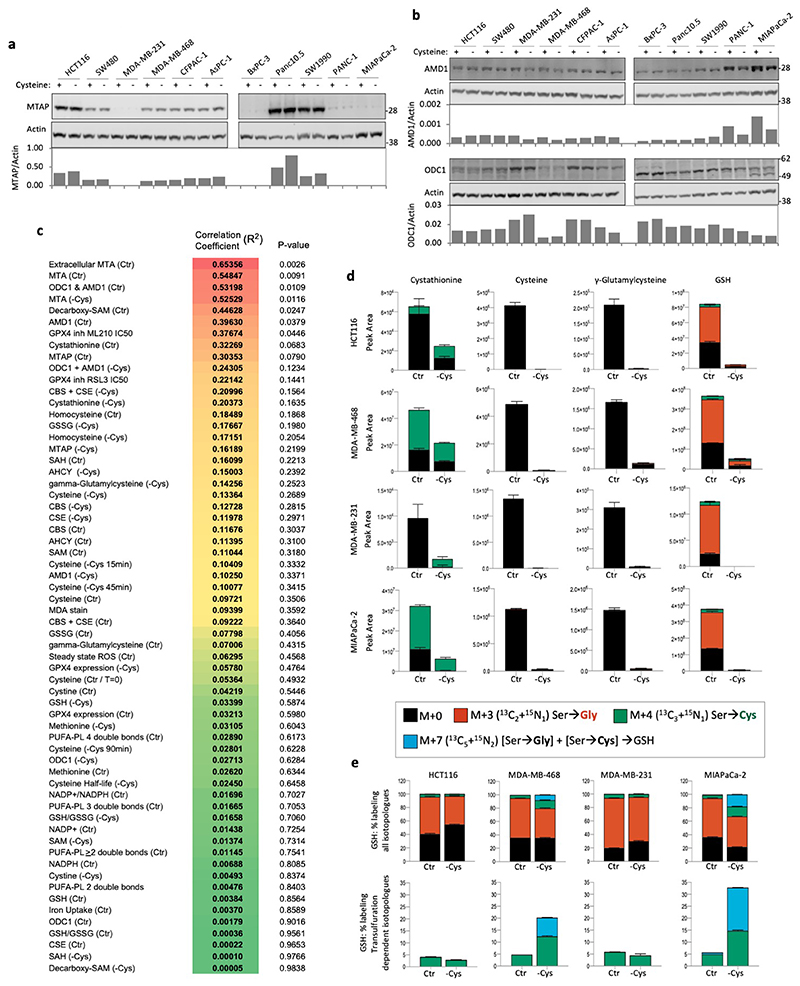
Next, we examined levels of extracellular MTA across our cell line panel by LCMS and plotted MTA levels versus ability to survive cysteine starvation. Unlike transsulfuration enzyme expression (Fig. 1f), there was a clear correlation between extracellular MTA levels and sensitivity to starvation (Fig. 2b). MTA is the direct substrate of MTAP, a key enzyme in the methionine salvage pathway. MTAP protein expression also showed correlation with cysteine starvation response (Fig. 2c & Extended Data Fig. 3a), though to a lesser degree than MTA efflux. As MTA efflux is a functional measure of both MTAP expression and polyamine pathway activity, it potentially explains why this parameter is more predictive of response than MTAP enzyme expression alone.
Polyamine pathway activity correlates with sensitivity to cysteine starvation
Given that numerous cellular processes have the capacity to influence sensitivity to cysteine starvation, we explored a wide range of additional cellular factors in our cell line panel, including: metabolite levels of cysteine, methionine, SAM, decarboxy-SAM (dc-SAM), MTA, cystathionine, homocysteine, γ-glutamylcysteine, GSH, GSSG, NADP+ and NADPH; ratios for GSH/GSSG and NADP+/NADPH; enzyme expression for GPX4, CBS, CSE, AHCY, AMD1, ODC1, and combined CBS+CSE, AMD1+ODC1; lipid ROS levels (Malonyldialdehyde-MDA staining); levels of phospholipids with polyunsaturated fatty acyls (PUFA-PLs; targets of ROS/Fe2+ dependent lipid peroxidation) by LCMS; steady state ROS levels (CellROX staining); cellular iron uptake (Inductively Coupled Plasma - Optical Emission Spectrometry); and GPX4 inhibitor IC50s (Extended Data Fig. 3b & c).
Of the >60 factors tested, the six with highest correlation (extracellular MTA [Ctr], cellular MTA [Ctr / -Cys], combined ODC1+AMD1 expression [Ctr], decarboxy-SAM [Ctr] and AMD1 expression [Ctr] (R2 values = 0.65356 to 0.39630) are all indicators of polyamine pathway activity (Extended Data Fig. 3c). Combined expression of CBS and CSE during cysteine starvation (CBS+CSE expression [-Cys]), was present within the top 15 of the list, supporting a role for TsP activity, but with a markedly lower correlation (R2 = 0.20996), than for polyamine pathway activity. Also in the top 15 of the list are GPX4 inhibitor IC50s. This predictable correlation is indicative that cysteine starvation and GPX4 inhibition kills cells by the same ultimate mechanism − ferroptosis. While its possible that cysteine starvation sensitive cells could be primed for sensitivity by having low GPX4 expression this did not appear to be the case, as GPX4 expression showed little correlation to starvation sensitivity; [R2 GPX4 Ctr = 0.03213, R2 GPX4 -Cys = 0.05780]. Overall these data highlight a clear correlation between polyamine pathway activity and cellular sensitivity to cysteine starvation. Given that the polyamine pathway and the TsP compete for the same metabolic precursors we formed the primary hypothesis that high polyamine pathway activity could sensitise cells to cysteine starvation by depriving the TsP of upstream precursors.
De novo cysteine synthesis does not correlate with high cysteine starvation sensitivity
To further scrutinise de novo cysteine synthesis, we supplemented cells with 13C315N1-serine, which, unlike 13C515N1-methionine, gives rise to labelled cysteine when utilised by the TsP (see schematic Fig. 2a). As we have described previously, it can be difficult to detect measurable intracellular steady state levels of a highly cell permeable nutrient when it is removed from the medium33, 34. Under starvation, newly synthesised high-demand nutrients, such as serine and cysteine, are rapidly converted into downstream metabolites making it difficult for detectable steady state levels to accumulate (Extended Data Fig. S3d). However, it is possible to detect labelling in the downstream metabolites into which the labelled metabolite is converted; in the case of cysteine it can be detected in GSH. There are two possible routes of incorporation of serine-derived carbon and nitrogen into GSH: via glycine synthesis and via cysteine synthesis. Mass+3 (m+3, 13C215N1) GSH indicates serine>glycine>GSH labelling, whereas m+4 (13C315N1) GSH indicates serine>cysteine>GSH labelling. An m+7 GSH peak indicates serine derived glycine (m+3) and serine derived cysteine (m+4) are simultaneously incorporated into GSH.
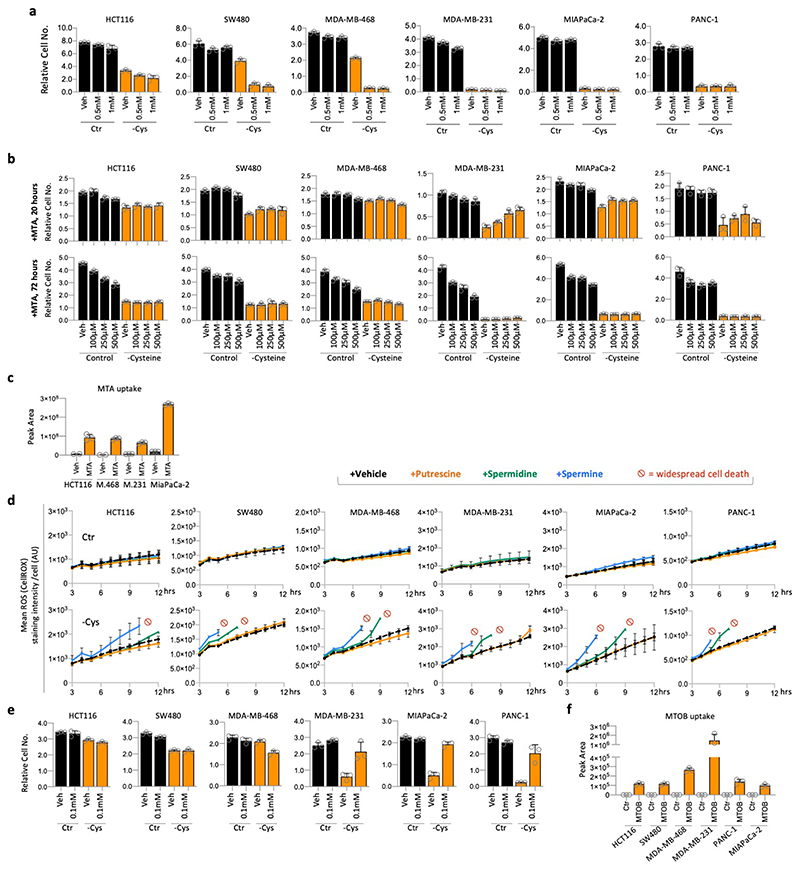
We were surprised to find that de novo cysteine synthesis did not correlate with response to cysteine starvation (Extended Data Fig. 3e). HCT116 (more resistant) and MDA-MB-231 (more sensitive) had comparable low levels of de novo cysteine synthesis during cysteine starvation, and MDA-MB-468 (more resistant) and MIAPaCa-2 (more sensitive) had comparable high levels of de novo cysteine synthesis during cysteine starvation. While the protein expression and LCMS data suggested that de novo cysteine synthesis was not the dominant determinant of sensitivity to cysteine starvation, we sought to confirm the basic underlying importance of de novo cysteine synthesis by treating cells with a CSE inhibitor (beta-cyano-L-Alanine35). As expected, CSE inhibitor treatment increased the sensitivity to cysteine starvation of the resistant cell lines SW480 and MDA-MB-468 (Extended Data Fig. 4a), validating the basic role of TsP in making cysteine, in line with previous work25. HCT116 cells had only a modest response to CSE inhibition - possibly reflecting low levels of TsP activity shown in. Overall, these results suggest that while TsP activity has a clear functional role in helping cells adapt to cysteine starvation, it is not necessarily the dominant factor in determining which cell lines have acute sensitivity.
Due to the lack of correlation between de novo synthesis and cysteine starvation sensitivity, we rejected our initial hypothesis, proposing the alternative hypothesis that polyamine metabolism per se could be the driver of sensitivity, independent of the TsP. To directly assess the impact of polyamine metabolism, we supplemented cells with polyamine pathway metabolites. While MTA tended to decrease the proliferation of fed cells (agreeing with previous work36), MTA did not sensitise cells to cysteine starvation (Extended Data Fig. 4b & c). Furthermore, MTA showed a trend in at least one of the sensitive cell lines (MDA-MB-231) to give short-term protection from cysteine starvation, indicating that MTA itself does not sensitise cells to cysteine starvation.
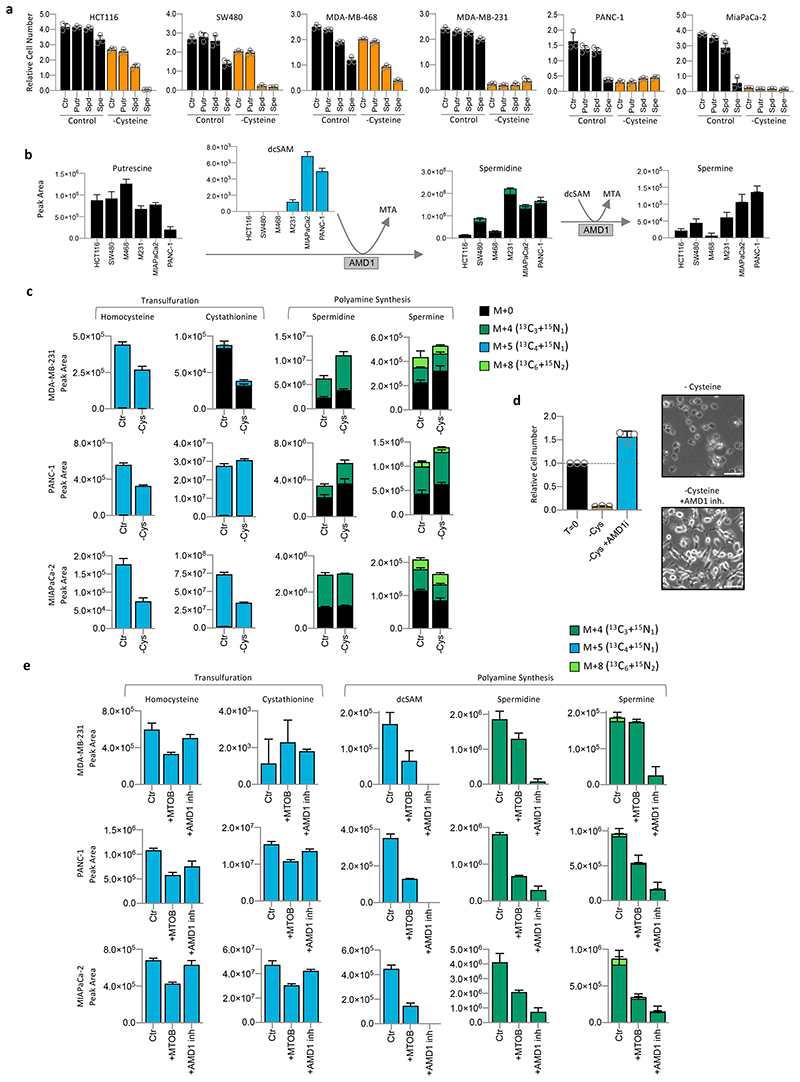
In contrast to MTA and putrescine, spermidine and spermine supplementation had a dramatic impact on cysteine starvation sensitivity. Resistant cell lines HCT116, SW480 and MDA-MB-468 became highly sensitised in their presence (Fig. 3a). Staining for ROS levels in live cells showed that spermidine and spermine rapidly increased ROS levels in cysteine starved cells with very rapid, widespread cell death observed (Fig. 3a & Extended Data Fig. 4d). Using LCMS we directly assessed polyamine levels in cells under control conditions. In the more sensitive cells (MDA-MB-231, PANC-1 and MIAPaCa-2), there was a consistent trend for lower putrescine concurrent with higher spermidine and spermine, suggesting higher rates of de novo spermidine/spermine synthesis (Fig. 3b). While a relatively short (3h) labelling period with 13C515N1-methionine generally showed limited labelling in spermidine & spermine, there was clear labelling upstream in dc-SAM, but only in the MTAP deficient, cysteine starvation sensitive cell lines. dc-SAM is produced from SAM by AMD1-catalysed decarboxylation, and is required for the synthesis of spermidine and spermine, during which dc-SAM is converted to MTA. These results suggest that MTAP-deleted cell lines have higher production of dc-SAM (as previously reported28), leading to increased synthesis of polyamines such as spermidine and spermine, which may contribute to cysteine starvation sensitivity.
Figure 3. Impact of polyamine metabolism on cysteine starvation sensitivity.
(a) Cell lines were grown in complete medium (Control) or matched medium lacking cysteine (-Cysteine) supplemented with putrescine (Putr), spermidine (Spd) or spermine (Spe), all 20uM, for 28h. (b) Cell lines were grown in complete medium (with 13C515N1-methionine 0.2mM substituted for methionine) for 3h. Metabolites were extracted and analysed by LCMS. (c) Cell lines were grown in complete medium (with 13C515N1-methionine 0.2mM substituted for methionine) or matched medium lacking cysteine for 16h. Metabolites were extracted and analysed by LCMS. (d) MDA-MB-231 cells were treated with AMD1 inhibitor sardomozide 20μM for 16h, followed by 20h cysteine starvation (without sardomozide), then cells were fixed, stained and counted. Representative images were taken using a light microscope. Scale bars = 100μm (e) Cell lines were grown in complete medium (with 13C515N1-methionine 0.2mM substituted for methionine) supplemented with 4-methylthio-2-oxobutanoic acid (MTOB) 0.1mM, or sardomozide 20μM for 5h. Metabolites were extracted and analysed by LCMS. All data are averages of n=3 biological replicates, error bars are SD.
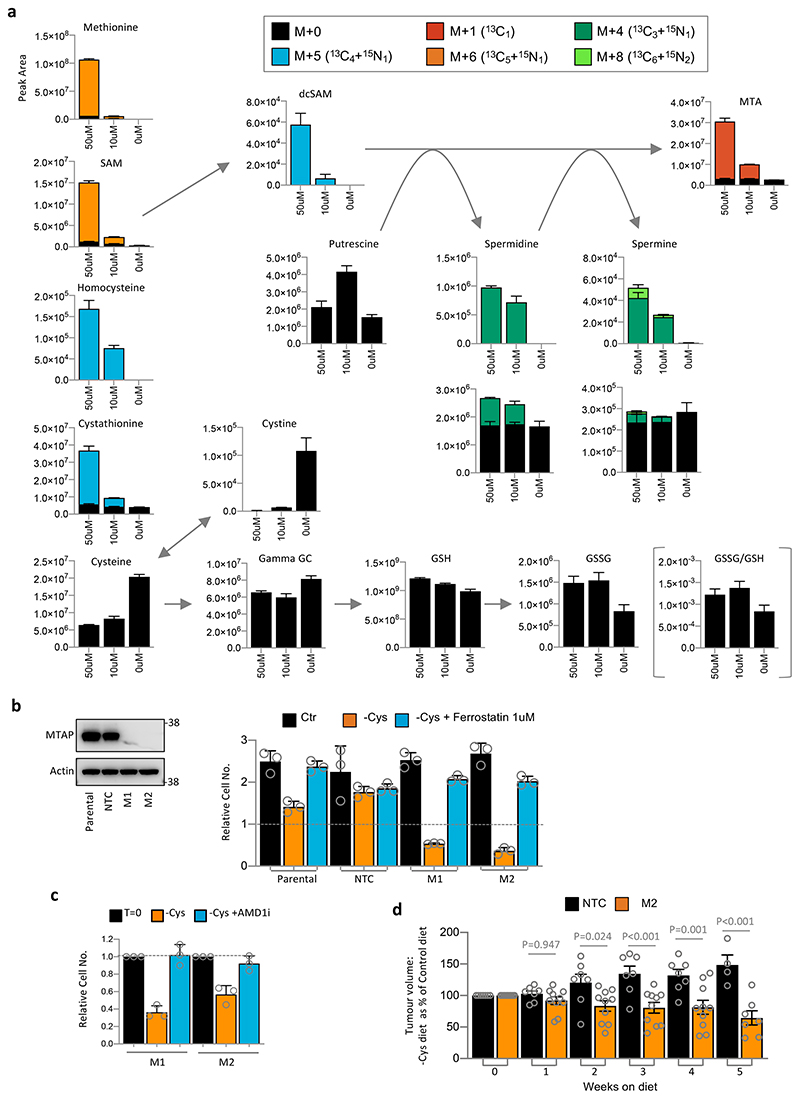
To assess the activity of the polyamine pathway versus TsP during cysteine starvation, we performed LCMS analysis. Longer (16h) incubation with 13C515N1-methionine resulted in a high proportion of polyamines and TsP intermediates being labelled (Fig. 3c). Polyamine labelling was generally maintained or increased, suggesting that polyamine synthesis remains active during starvation. To assess whether diminished polyamine pathway activity could rescue cells from starvation, we employed two methods. As the decarboxylase responsible for SAM to dc-SAM conversion, AMD1 has an important role in regulating polyamine synthesis32. Treating cells with an AMD1 inhibitor (sardomozide) prevented cell death in response to cysteine starvation (Fig. 3d). 4-methylthio-2-oxobutanoic acid (MTOB), an intermediate in the methionine salvage pathway (derived from MTA and dependent on MTAP expression), has been shown to inhibit ODC1 activity (ODC1 catalyses putrescine synthesis, also contributing to regulation of polyamine pathway activity)37,38. Similar to AMD1 inhibition, MTOB supplementation rescued cells from cysteine starvation (Extended Data Fig. 4e & f). We noted that rescue with either method was temporary, especially the AMD1 inhibitor, presumably because levels of polyamines themselves become limiting for normal cell function and survival.
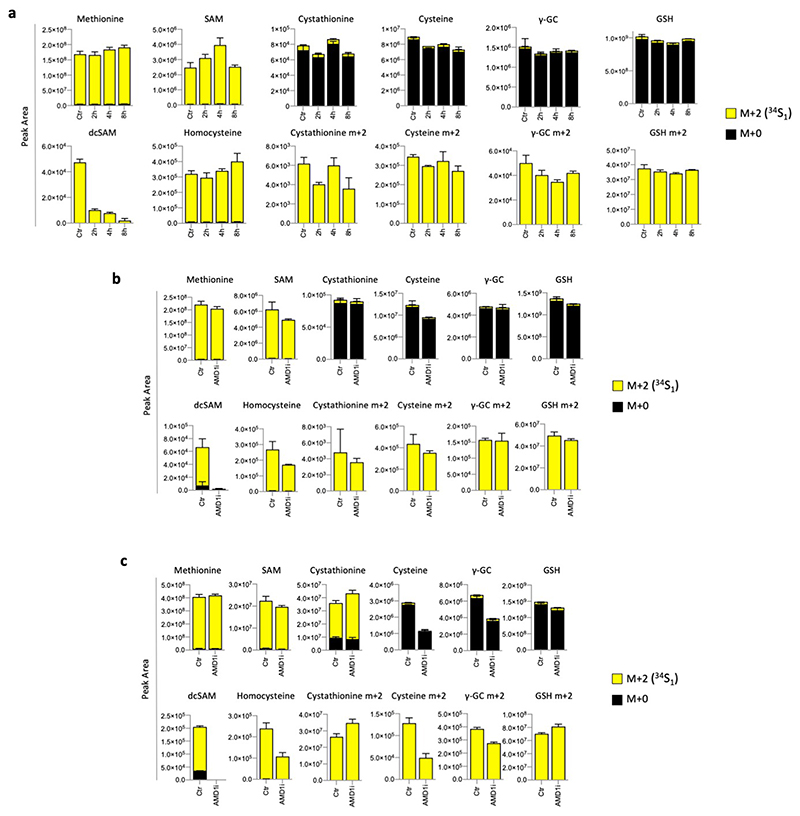
Performing LCMS on cysteine starvation sensitive cells grown with 13C515N1-methionine or 34S1-methionine confirmed that AMD1 inhibition and MTOB supplementation caused a marked inhibition of polyamine synthesis, displayed as decreased dc-SAM and polyamine labelling (Fig. 3e & Extended Data Fig. 5a-c). Importantly, these experiments also reveal that preventing entry of methionine into the polyamine pathway did not appreciably increase the levels of TsP intermediates. This result gives further support to the hypothesis that polyamine pathway activity influences cysteine starvation sensitivity independently of the TsP.
Inhibiting polyamine metabolism protects highly sensitive cells from cysteine starvation
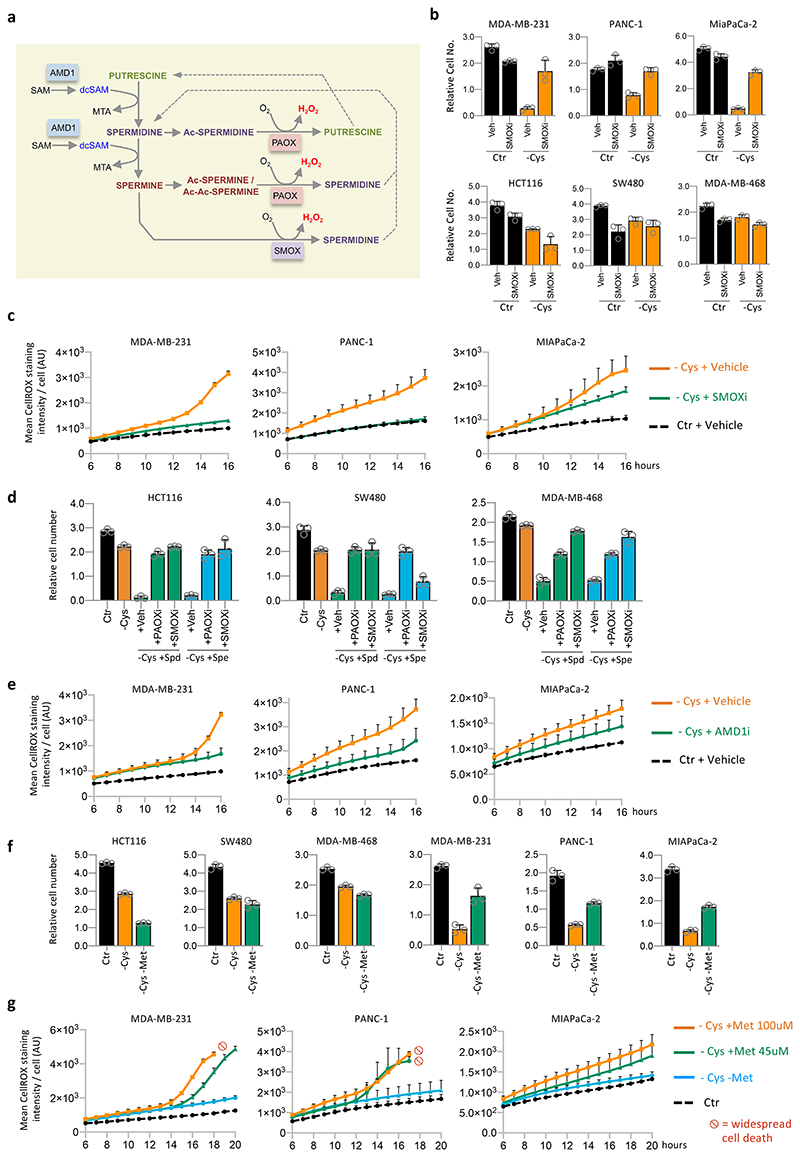
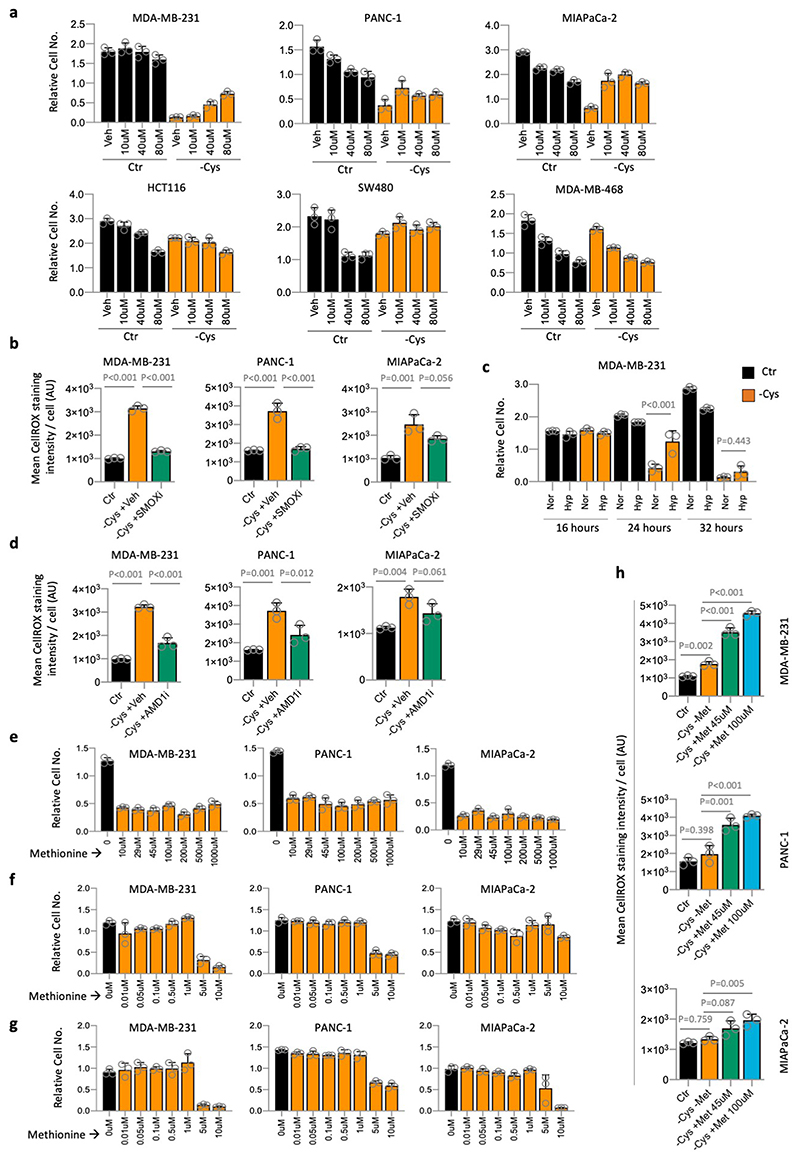
There are multiple reactions of polyamine metabolism that generate the reactive oxygen species hydrogen peroxide (H2O2), potentially explaining the ability of spermidine and spermine to increase ROS levels and sensitise cells to starvation (see schematic Fig. 4a). These reactions are mediated by spermine oxidase (SMOX) and polyamine oxidase (PAOX). Inhibition of SMOX (Fig. 4b) and PAOX (Extended Data Fig. 6a) prevented cell death in starvation sensitive cell lines (MDA-MB-231, MIAPaCa-2 and PANC-1). In starvation resistant cell lines (HCT116, SW480 and MDA-MB-468), SMOX and PAOX inhibitors gave little or no additional advantage during cysteine starvation. Analysis of ROS levels confirmed that inhibiting SMOX during cysteine starvation allowed cells to maintain lower ROS levels (Fig. 4c & Extended Data Fig. 6b).
Figure 4. Inhibition of polyamine metabolism protects highly sensitive cells cells from cysteine starvation.
(a) Schematic diagram depicting polyamine metabolism. Ac = Acetyl group. PAOX = Polyamine oxidase, SMOX = Spermine oxidase. (b) Cell lines were grown in complete medium with either 50μM spermine oxidase (SMOX) inhibitor MDL72527 (SMOXi) or without (Veh) for 16h, followed by 30h of complete medium (Ctr) or matched medium lacking cysteine (-Cys) with or without 50μM SMOX inhibitor. (c) Cell lines were grown in complete medium with (+SMOXi) or without (+Vehicle) SMOX inhibitor MDL72527 50μM for 16h, then grown in complete medium (Ctr) or matched medium lacking cysteine (-Cys) with or without 50μM SMOX inhibitor. Reactive oxygen species (ROS) were detected in real time by an Operetta automated microscope in live cells stained with CellROX deep red. (d) Control cells (Ctr) were grown in complete medium for the entire experiment. Other cells were grown in the absence of cysteine (-Cys), with or without polyamines Spermidine (Spd) or Spermine (Spe) 20um for 28h. Cysteine-starved/polyamine treated cells either received vehicle (+Veh), polyamine oxidase inhibitor (+PAOXi, Diminazene aceturate) or spermine oxidase inhibitor (+SMOXi, MDL27527), both 50μM. SMOXi and PAOXi treatments were added to the cells 16h prior to starvation/polyamine addition, and during the starvation/polyamine treatment period. (e) Cell lines were grown in complete medium (Ctr) or matched medium lacking cysteine (-Cys) with or without 20μM AMD1 inhibitor. Reactive oxygen species (ROS) were detected in real time by an Operetta automated microscope in live cells stained with CellROX deep red. (f) Cell lines were grown in complete medium (Ctr) or matched medium lacking cysteine (-Cys) or lacking cysteine and methionine (-Cys –Met) for 32h. (g) Cell lines were grown in complete medium (Ctr) or matched medium lacking cysteine (-Cys) with or without methionine (Met) at the stated concentrations. Reactive oxygen species (ROS) were detected in real time by an Operetta automated microscope in live cells stained with CellROX deep red. All data are averages of n=3 biological replicates, error bars are SD.
Given that SMOX and PAOX reactions require oxygen (O2), we tested if oxygen levels could modulate the response to cysteine starvation. Growth in hypoxic conditions (1% O2) prevented cell death after 24h cysteine starvation, however this rescue was temporary with cell death occurring by 32 hours (Extended Data Fig. 6c). Next, we tested whether SMOX and PAOX inhibition could rescue starvation resistant cells from the sensitising effects of spermidine and spermine treatment (as seen in Fig. 3a). In HCT116, SW480 and MDA-MB-468 cells we found that SMOX and PAOX inhibition restored the ability of these cells to survive and grow under polyamine treatment concurrent with cysteine starvation (Fig. 4d). In similarity to SMOX inhibition, AMD1 inhibition diminished ROS levels, supporting the hypothesis that polyamine metabolism increases ROS during cysteine starvation (Fig. 4e & Extended Data Fig. 6d).
Methionine withdrawal protects highly sensitive cells from cysteine starvation
Given that methionine is a precursor for both polyamine and cysteine synthesis, we tested whether modulating methionine levels could influence the response to cysteine starvation, with the assumption that methionine withdrawal would further sensitise cells. In cell lines more resistant to cysteine starvation, combined methionine and cysteine starvation tended to mildly (SW480 & MIAPaCa-2) or strongly (HCT116) inhibit cell growth (Fig. 4f). Remarkably, and in stark contrast, we found that combined methionine and cysteine starvation was much better tolerated than cysteine starvation alone in more sensitive cell lines: MDA-MB-231, MIAPaCa-2 and PANC-1 cells all displayed a lack of cell death and even a degree of proliferation under methionine and cysteine free conditions (Fig. 4f). These results suggest that polyamine metabolism dominates over de novo cysteine synthesis in determining whether a cell line is acutely sensitive to cysteine starvation.
As cell culture media contain supra-physiological methionine levels (100-200μM), we tested how lower, more physiological methionine levels, would influence cysteine starvation sensitivity. In adult humans the concentration of methionine in the blood ranges from 10-45μM, with a mean value of approximately 29μM39. MDA-MB-231, MIAPaCa-2 and PANC-1 cells all remained highly sensitive to cysteine starvation in the range 10-1000μM (Extended Data Fig. 6e). Cells remained sensitive to cysteine starvation down to 5μM methionine (Extended Data Fig. 6f). While it is clearly not possible to promote sustainable cell survival and proliferation in the complete absence of cysteine and methionine, the rescue provided by methionine removal was surprisingly durable, lasting over 40 hours (Extended Data Fig. 6g). Remarkably, we found that under cysteine starved conditions, in MTAP deleted cells, ROS levels increased in a dose-dependent manner in response to methionine concentration (Fig. 4g & Extended Data Fig. 6h).
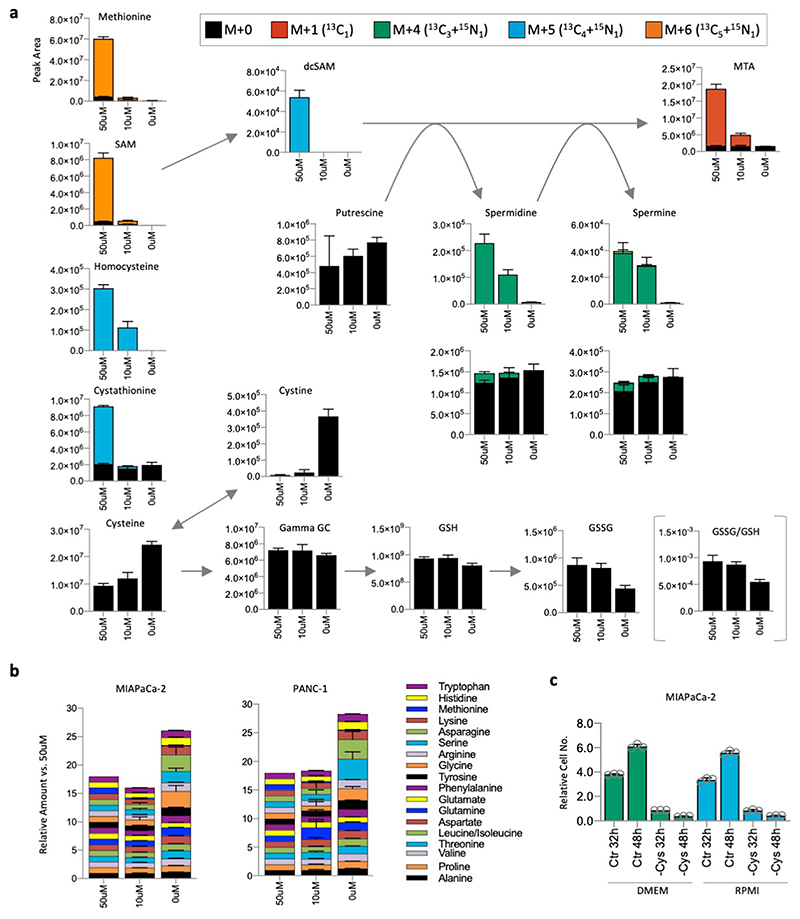
To further examine the impact of methionine levels on cysteine metabolism, we performed LCMS analysis in cysteine starvation sensitive cell lines. As expected, methionine starvation dramatically decreased entry of precursors into the TsP and polyamine synthesis pathway (Fig. 5a & Extended Data Fig. 7a). Intriguingly, these changes were accompanied by increased cysteine and cystine levels, as well as decreased GSSG levels and decreased GSSG/GSH ratio. To assess whether such changes were specific to cysteine − or a generic impact of methionine withdrawal on amino acids − we analysed changes across all other amino acids. Methionine restriction did increase the total cellular levels of amino acids − likely a reflection of inhibited protein synthesis. Notably this effect was most dramatic in cysteine, glycine and serine (all precursors of GSH) and asparagine (used in protein synthesis and as an uptake exchange factor of serine40) (Extended Data Fig. 7b). The paradoxical increase in cysteine levels, and accompanying decrease in GSSG, in response to methionine starvation further supports the hypothesis that decreased polyamine pathway activity alleviates the oxidative burden on MTAP deleted cells. Given differences in methionine levels between different cell culture media (e.g. DMEM ~200um, RPMI1640 ~100uM) we tested whether maintaining cells in different media impacted sensitivity to cysteine starvation. As predicted by the methionine titration experiments, there was no difference in sensitivity based on the maintenance medium (Extended Data Fig. 7c).
Figure 5. Impact of methionine levels and acute MTAP deletion on cysteine starvation sensitivity.
(a) MIAPaCa-2 cells were grown in medium lacking methionine supplemented with varying levels of 13C515N1-methionine for 5h. Metabolites were extracted and analysed by LCMS. (b) MTAP was deleted from HCT116 cells using CRISPR/Cas9 and knockout was validated by western blot. MTAP positive (Parental, NTC) and negative (M1 & M2) HCT116 cell clones were grown in complete medium containing all amino acids (Ctr), or matched medium lacking cysteine (-Cys), with or without the ferroptosis inhibitor ferrostatin (1μM) for 20h. (c) MTAP deleted HCT116 cell clones (M1, M2) were treated with AMD1 inhibitor sardomozide 20μM for 16h, followed by 20h cysteine starvation (without sardomozide), cells were then fixed and counted. (d) CD-1 Nude mice were injected with MTAP positive (NTC) and MTAP deleted (M2) HCT116 cells. Once measurable xenograft tumours had formed mice were transferred to a diet & drinking water regime either containing all amino acids (Control), or lacking cysteine / cystine, but containing all other amino acids (-Cys). For (d) Data are averages, bars are SEM (NTC Control diet n=8, NTC –Cys diet n=7, M2 Control diet n=9, M2 –Cys n=10), statistical comparisons are ordinary one-way ANOVA with Sidak’s multiple comparison test. Except for (d) all data are averages of n=3 biological replicates and error bars are SD.
Acute MTAP deletion and restoration alters polyamine metabolism and starvation sensitivity
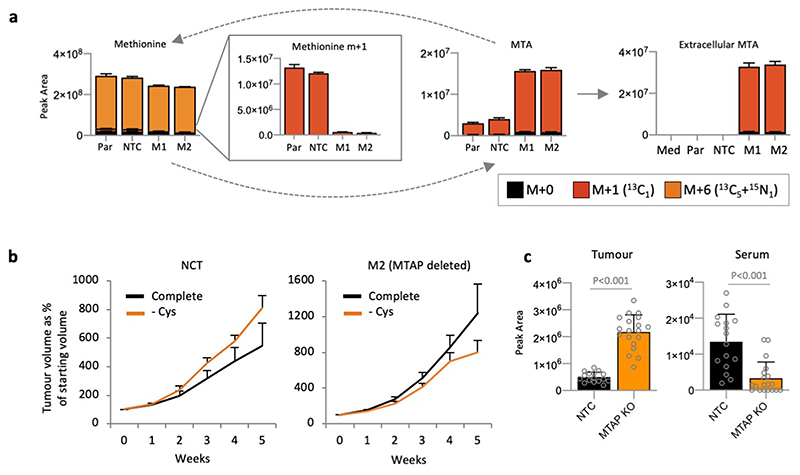
HCT116 cells express relatively high levels of MTAP (Extended Data Fig. 3a), and while sensitive to cysteine starvation, were more resistant to cell death than other cell lines (Fig. 1a). To assess the impact of MTAP deletion we used CRISPR/Cas9 to delete MTAP from HCT116 cells. MTAP-deletion increased the sensitivity of these cells to cysteine starvation, which was rescued by treatment with ferrostatin (Fig. 5b). LCMS confirmed that MTAP deletion prevented methionine salvage (signified by m+1 methionine), and caused intracellular accumulation and efflux of MTA (Extended Data Fig. 8a). Similar to cell lines with endogenous MTAP deletion, treatment with an AMD1 inhibitor restored cell survival in response to cysteine starvation (Fig. 5c).
To test if our in vitro observations could be translated in vivo we performed a xenograft experiment with non-targeting control and MTAP-deleted HCT116 cells. The response of NTC and MTAP-deleted cells to cysteine limitation in vivo differed significantly (Fig. 5d). While the MTAP-expressing NTC cells generally showed increased tumour growth in response to cysteine starvation (a phenomenon that has been previously described41), the MTAP-deleted cells displayed decreased tumour volume compared to NTC cells (Fig. 5d & Extended Data Fig. 8b). LCMS analysis of MTA levels confirmed that MTAP-deleted tumour tissue was significantly higher in MTA versus NTC tumours, however, this did not translate to higher serum MTA (Extended Data Fig. 8c). The results suggest that analysis of MTA levels in tumour biopsy tissue, but not in serum, may be a viable biomarker to detect MTAP deletion.
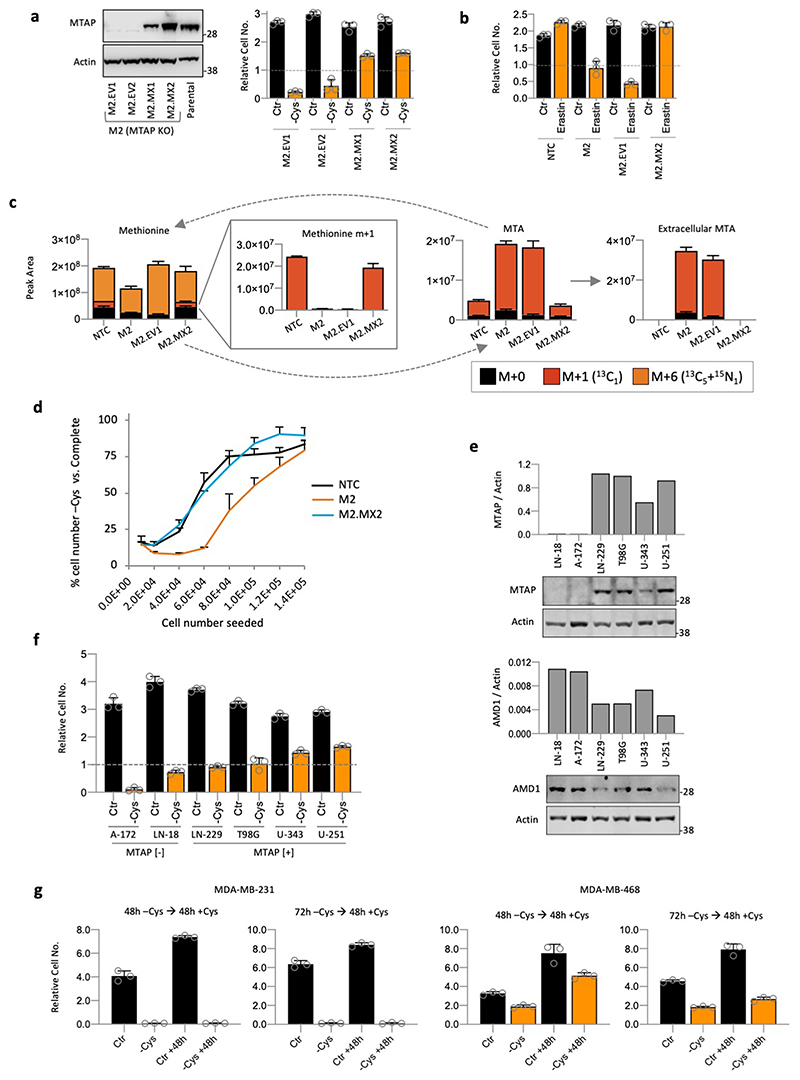
Stable re-expression of MTAP in MTAP-deleted HCT116 cells restored the ability of these cells to survive during cysteine starvation and treatment with the cysteine-uptake inhibitor erastin (Extended Data Fig. 9a & b). In MDA-MB-231 cells (endogenous MTAP deletion), overexpression of MTAP did not rescue sensitivity (not shown), suggesting that in cells suffering long-term MTAP deletion an adaptive process occurs that confers an inability to acutely re-adapt to MTAP expression. LCMS analysis confirmed that MTAP re-expression in MTAP-deleted HCT116 cells prevented MTA efflux and restored the ability of these cells to salvage methionine from MTA (Extended Data Fig. 9c). In line with the early observations of Eagle and colleagues, who reported that single cells have higher nutrient demands42, we consistently observed that cell confluence had an impact on response to starvation. While sparsely seeded cells were more sensitive than confluent cells, the effect of MTAP deletion/restoration was consistent across a range of cell densities (Extended Data Fig. 9d).
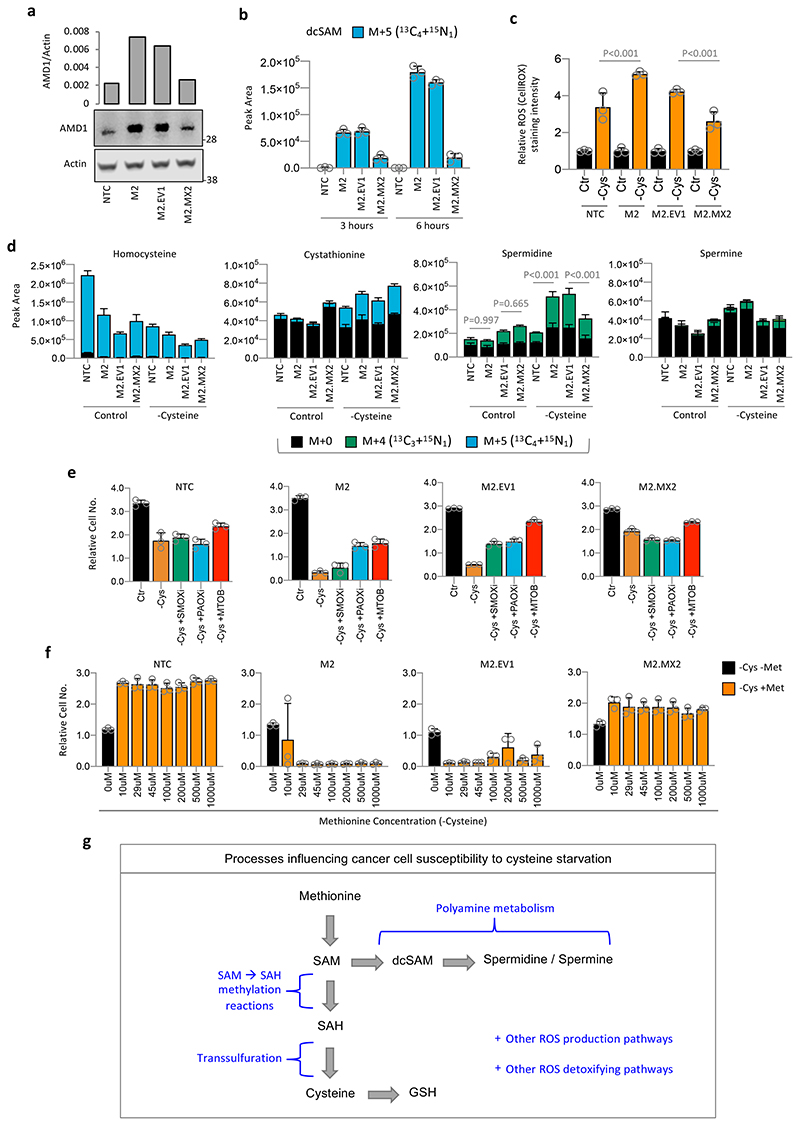
Western blot showed that MTAP loss promoted a three-fold increase in AMD1 expression, whereas MTAP restoration decreased AMD1 to basal levels (Fig. 6a). LCMS showed that AMD1 up-regulation led to a dramatic increase in methionine-dependent dc-SAM labelling, indicative of increased polyamine pathway activity (Fig. 6b). MTAP-deleted HCT116 cells showed increased elevation of cellular ROS levels in response to cysteine starvation (Fig. 6c). Underlying these changes, and in line with increased dc-SAM labelling, MTAP-deleted cells had substantially higher methionine-dependent labelling in spermidine, with no consistent difference in labelling of TsP intermediates (Fig. 6d).
Figure 6. MTAP status is linked to AMD1 expression, polyamine pathway activity and sensitivity to cysteine starvation.
(a) MTAP was deleted from HCT116 cells using CRISPR/Cas9 (M2), control cells received non-targeting vector (NTC). MTAP knockout cell line M2 was stably transfected with either an empty vector (M2.EV1; MTAP negative) or a plasmid for MTAP expression (M2.MX2; MTAP positive). AMD1 levels were detected by western blot. Western blot is representative of two independent experiments. (b) The four HCT116 isogenic cell lines as described above were grown in complete medium with 13C515N1-methionine 0.2mM substituted for methionine for 3h and 6h. (c) MTAP knockout and re-expressing cell lines were grown in complete medium (Ctr) or matched medium lacking cysteine (-Cys) for 20h. Reactive oxygen species (ROS) were detected in real time by an Operetta automated microscope in live cells stained with CellROX deep red. (d) The four HCT116 isogenic cells as described above were grown in complete medium (Control) or medium lacking cysteine (-Cysteine) with 13C515N1-methionine 0.2mM substituted for methionine for 24h. (e) MTAP knockout and re-expressing HCT116 cells were grown in complete medium with or without 100μM SMOX inhibitor, 80μM PAOX inhibitor or 0.2mM MTOB for 16h, then grown in either complete medium (Ctr), or matched medium lacking cysteine with or without 100μM SMOX inhibitor, 80μM PAOX inhibitor or 0.2mM MTOB for 32h. (f) MTAP knockout and re-expressing cells were grown in medium lacking cysteine (-Cys) with increasing amounts of methionine (Met; 0-1mM) for 24h, before being fixed and counted. (g) Schematic diagram depicting major pathways influencing the susceptibility of cancer cells to cysteine starvation. All data are averages of n=3 biological replicates, error bars are SD. Statistical comparisons in (c) and (d) are ordinary one-way ANOVA with Sidak’s multiple comparison test.
To further assess the relationship between polyamine synthesis and sensitivity to cysteine starvation in MTAP-deleted/restored HCT116 cells, we used SMOX and PAOX inhibitors, and MTOB supplementation. Inhibition of polyamine metabolism with all three agents had little impact on MTAP expressing cells, but rescued cell survival in MTAP-deleted cells during cysteine starvation (Fig. 6e). We saw a dramatic contrast in the effect of methionine withdrawal on MTAP-deleted versus restored HCT116 cells. While the presence of methionine was advantageous to MTAP expressing cells during cysteine starvation, even low levels of methionine inhibited the ability of MTAP deleted cells to survive (Fig. 6f). Glioblastomas (GBM) have a relatively high frequency of MTAP deletion, so we tested a panel of GBM cell lines for sensitivity to cysteine starvation. MTAP-deleted lines showed highest expression of AMD1 and were amongst the most sensitive to starvation (Extended Data Fig. 9e & f). Finally, we tested the ability of cells to recover from and proliferate post-cysteine starvation. As expected, highly cysteine starvation sensitive MDA-MB-231 cells did not survive/recover, whereas more resistant MDA-MB-468 cells were able to survive and grow (Extended Data Fig. 9g).
Discussion
Despite being − theoretically − a non-essential amino acid, a wealth of data demonstrate that cysteine is an essential exogenous nutrient for cancer cells. The reasons for this paradox are not well understood. Previous reports point to inadequate expression of TsP enzymes23,24 and a limitation in the conversion of SAM to SAH25,43. Our data support the hypothesis that there is limited entry of methionine to the TsP, but add another dimension − polyamine metabolism − to our understanding of why cancer cells can display acute sensitivity to cysteine starvation (Fig. 6g). Exogenous cysteine was vital to support maximal proliferation across a range of breast, colorectal and pancreas cancer cell lines. We found that a sub-set of cancer cells were particularly susceptible to cysteine starvation, which was even more damaging than complete glucose withdrawal. In the panel of cells tested here, we found that TsP enzyme expression did not correlate with the ability to survive during cysteine starvation.
Given the ability of homocysteine and cystathionine to rescue cells from cysteine starvation, it was intriguing to find that excess methionine, the ultimate precursor for these metabolites, was unable to provide rescue. Based on this result we formed the initial hypothesis that methionine was diverted to an alternative metabolic pathway. Polyamine synthesis requires the methionine-derived precursor dc-SAM to produce spermine and spermidine44. Polyamines are essential for growth in eukaryotic cells, where they are present at millimolar concentrations, and have varied roles45. Up-regulated polyamine synthesis is a well-established feature of cancer cells32,44,46,47, with the formation of putrescine catalysed by the classic myc-target ODC148. We found that methionine readily entered the polyamine pathway, labelling polyamines and MTA. Whereas MTA can be recycled via the methionine salvage pathway, certain cells displayed a substantial MTA efflux, illustrating a lack of methionine salvage.
Genetic deletion of the MTA metabolising enzyme MTAP, which is chromosomally co-located with the tumour suppressor p16, is a common event in cancer, described as a ‘bystander/passenger’ gene deletion49. Loss of MTAP prevents methionine recycling, meaning that a constant supply of new methionine is required to enter polyamine synthesis in MTAP deleted cells. Levels of exogenous MTA (a combined measure of polyamine synthesis and MTAP status) correlated strongly with sensitivity to cysteine starvation. This observation led to our initial hypothesis that increased entry of methionine into the polyamine pathway prevented MTAP-deleted cells channelling enough methionine to the TsP to support de novo cysteine synthesis. To our surprise, labelling experiments with 13C315N1-serine showed that starvation sensitive MTAP-deleted cells did not necessarily have lower cysteine synthesis than the more resistant MTAP positive cells. Furthermore, inhibition of the polyamine pathway, which rescued MTAP-deleted cells from cysteine starvation, did not increase entry of methionine-derived precursors into the TsP. Based on these results we rejected our initial hypothesis and tested the alternate hypothesis that polyamine metabolism itself was the cause of sensitivity in MTAP-deleted cells.
LCMS revealed that MTAP-deleted cells had much higher methionine-derived labelling in the polyamine synthesis precursor dc-SAM along with higher polyamine steady state levels and higher methionine-derived polyamine labelling. Supplementing with spermidine or spermine increased cellular ROS levels and dramatically sensitised cells to cysteine starvation. Inhibition of polyamine synthesis or inter-conversion decreased cellular ROS levels and rescued MTAP-deleted cells from cysteine starvation. Given the cyclical nature of polyamine metabolism (Fig. 4a), the potential for SMOX/PAOX dependent ROS production in the context of elevated dc-SAM levels is theoretically very high.
Given the logic that the availability of methionine-derived precursors is the critical factor in allowing cells to survive cysteine starvation, it was remarkable to discover that methionine withdrawal rescued MTAP-deleted cells from cysteine starvation. While our data firmly supports the notion that cancer cells have a paucity of methionine-derived precursors available for cysteine synthesis, and that TsP activity is important to allow cells to survive cysteine withdrawal, our data shows that polyamine metabolism can override these factors and acutely sensitise cancer cells to cysteine starvation induced cell death. Therapeutic depletion of cysteine was recently presented as a potential anti-cancer strategy12. Given the relatively high frequency of MTAP deletion in cancer this offers a potential opportunity to stratify patients for cysteine limitation therapy. Interestingly our in vivo data suggests that dietary cysteine limitation can promote or diminish tumour formation depending on the tumour genotype. We speculate this effect may occur because cysteine uptake (as cystine) causes substantial efflux of glutamate17,19, an important metabolic precursor, a process which can confer decreased metabolic flexibility21.
In addition to the factors described above there are multiple other inputs that will combine to dictate the overall sensitivity of cells to cysteine deprivation. Differing rates of basal ROS production will mean different cancer cells have differing demands for GSH synthesis and therefore cysteine. The status of oncogenes such as KRas and PI3K is also known to influence methionine and cysteine metabolism10,11,50. Recent work has shown that methylation reactions promote TsP activity by facilitating the conversion of SAM to SAH and homocysteine25,43. The ability of cells to effectively up-regulate TsP enzyme expression and activity in response to cysteine starvation has been shown to improve cell survival25,51. Supporting these observations we found that TsP enzyme expression was up-regulated in response to cysteine starvation, and that direct inhibition of TsP activity could sensitise cells to cysteine starvation. However, the influence of polyamine metabolism was dominant over TsP enzyme expression in determining acute cysteine starvation sensitivity in the cell lines tested here. Notably, MDA-MB-231 cells − displaying both low expression of TsP enzymes and MTAP-deletion − showed the highest degree of sensitivity to cysteine starvation.
Whereas the in-depth mechanistic analysis we have performed here focuses on a limited panel of cell lines, further work will be required to establish exactly how generalizable and clinically applicable these results may be. A recent study of cancer cell lines (derived from different cancers than in the present study) highlights the importance of nutrient levels in shaping methionine metabolism in MTAP-deleted cells, but notes a lack of consistency in the metabolomic impact of MTAP-deletion52.
The concept of targeting MTAP loss for cancer therapy was established a number of years ago49, and genetic synthetic lethalities with MTAP loss have been reported27–29. Our work presents a previously unappreciated metabolic susceptibility for MTAP deficient tumours that may have therapeutic potential.
Methods
Cell culture
HCT116, SW480, MDA-MB-468, MDA-MB-231, AsPC-1, BxPC-3, CFPAC-1, MIAPaCa-2, PANC-1, Panc10.05, SW1990, U-251, LN-18, LN-229, T98G, U-343, A-172 cells were obtained from ATCC. Cell lines were authenticated using Short Tandem Repeat (STR) profiling (Promega GenePrint 10) and tested for mycoplasma using Mycoalert (Lonza). Cell culture media and supplements were obtained from Gibco/Thermo Fisher Scientific, product numbers are shown for each item: Colorectal and breast cancer cell lines were grown in DMEM (21969), PDAC cell lines were grown in RPMI 1640 (31870). Both were supplemented with penicillin-streptomycin, amphotericin, L-glutamine 2mM and 10% FBS (10270). Cells were kept at 37°C in 5% CO2 in a humidified cell culture incubator. A formulated medium lacking L-cysteine, cystine, L-methionine and L-serine was used as a base for creating experimental media. Base medium formulation: L-Histidine 0.2mM, L-Isoleucine 0.4mM, L-Leucine 0.4mM, L-Lysine 0.4mM, L-Phenylalanine 0.2mM, L-Threonine 0.4mM, L-Tryptophan 0.08mM, L-Valine 0.4mM, L-Arginine 0.2mM, L-Glutamine 2mM, L-Tyrosine 0.2mM, L-Alanine 0.4mM, L-Proline 0.3mM, L-Glutamic acid 0.15mM, L-Aspartic acid 0.1mM, L-Asparagine 0.2mM, Glycine 0.4mM. Base medium was supplemented 10% dialysed FBS (Gibco/Thermo Fisher Scientific), penicillin-streptomycin and amphotericin. To ensure an adequate supply of vitamin B6 (a crucial co-factor for de novo cysteine synthesis) base medium was supplemented with additional vitamin B6 20uM (Sigma, P6280). Control experimental medium = base medium supplemented with L-cysteine 0.4mM, L-methionine 0.2mM and L-serine 0.4mM. Cysteine starvation (-Cys) experimental medium = base medium supplemented with L-methionine 0.2mM and L-serine 0.4mM.
Generation of MTAP-KO cells by CRISPR/Cas9 and MTAP re-expression
HCT116 cells were transfected using Lipofectamine 3000 (Thermo Fisher Scientific) with pSpCas9(BB)-2A-Puro (PX459) V2.0 (Addgene plasmid # 62988; http://n2t.net/addgene:62988;RRID:Addgene_62988 was a gift from Feng Zhang (Broad Institute, Cambridge MA) which expresses both Cas9 and gRNA [NTC: AAAATAGCAGTAAACTCAAC, MTAP KO seq 1: GTTTTGCCCCAAAACGAGAG, MTAP KO seq 2: GCCTGGTAGTTGACCTTTGA]. Successfully transfected cells were selected with puromycin (Sigma) and grown as clonal colonies. Clones were selected based initially on MTA efflux measured by LCMS; clones with greatest MTA efflux were selected, MTAP knockout was then confirmed by western blot. MTAP-KO HCT116 cells were transfected with pCMV-Hygro-MTAP and pCMV-Hygro-Negative control vector (Sino Biological) using Lipofectamine 3000 and selected using hygromycin B (Sigma) and grown as clonal colonies. Clones were selected based initially on MTA efflux measured by LCMS; clones with low MTA efflux were selected, then MTAP re-expression was confirmed by western blot.
Cell counting experiments
Cells were seeded at 6 x 10⁴ cells per well into 24-well plates (triplicate wells per condition) in the relevant complete medium and allowed to adhere for a full 24-hour period. A ‘time-0’ plate was included to record the starting cell number to be able to calculate relative cell numbers. Cells were washed once with PBS before receiving experimental medium containing or lacking the specified amino acids / metabolites / drugs. At the stated time-points the medium was removed, then cells were fixed in 4% formalin-PBS solution. Cells were then washed and stored in PBS before staining with DAPI-TritonX100-PBS solution for 1 hour, followed by storage in PBS at 4°C until further analysis. DAPI-stained cell nuclei were detected using an Operetta automated microscope platform with Harmony software and analysed using Columbus software (all PerkinElmer).
Homocysteine, cystathionine, glutathione, putrescine, spermine, spermidine, GPX4 inhibitor ML210, SMOX inhibitor MDL 72527, PAOX inhibitor diminazene aceturate, Ferrostatin-1 and Erastin were all obtained from Sigma. AMD1 inhibitor sardomozide/SAM486A was obtained from MedKoo Biosciences Inc. GPX4 inhibitor RSL3 was obtained from APExBIO. CSE inhibitor beta-cyano-L-Alanine was obtained from Santa Cruz. For experiments using sardomozide, cells were seeded as stated above. Prior to cysteine starvation, cells were fed complete medium supplemented with the stated concentration of sardomozide. After 16 hours, medium was removed and cells washed in PBS. Either complete or cysteine-free medium (without any sardomozide) was then added and cells incubated for the stated times before fixing for cell counts.
For experiments using SMOX and PAOX inhibitors, as well as MTOB, cells were pre-treated with stated concentrations for 16 hours in complete medium. After, cells were washed in PBS, before treatment was continued in complete or cysteine-free medium for stated times. After treatment was finished, cells were fixed and stained as above. For experiments using MTA, polyamines, GPX4 and CSE inhibitors, treatment started at the same time as cysteine starvation. For experiments involving hypoxic conditions, cells were seeded in normoxic conditions and allowed to adhere for 24 hours, before control and cysteine starvation medium was added and cells immediately transferred either to a humidified cell culture incubator set to 37°C in 20% O2 (Normoxia), or a hypoxia chamber set to 37°C in 1% O2 (Hypoxia) for the stated times. Cells were fixed immediately and stained as stated above.
Throughout the cysteine starvation experiments we noted the previously observed effect of low cell density on susceptibility to nutrient withdrawal42 - Extended Data Fig. 9d. I.e. low seeding density generally increased the sensitivity of all cells to cysteine starvation and high cell density decreased cell sensitivity. For example, cells relatively resistant to cysteine starvation, such as HCT116, become more sensitive if at low confluence, and more starvation sensitive cells such as MIAPaCa-2 become more resistant to cell death if at high confluence. To limit this confounding factor in cell counting experiments cells were seeded to be 20-30% confluent at the time of starvation, i.e. low enough to be in a proliferative state (i.e. not suffering substantial contact inhibition), but high enough not to be overtly sensitized to nutrient limitation. For experiments such as LCMS analysis (described in more detail below) we intentionally seeded cells at higher densities to prolong cell survival and allow labelling (e.g. with 13C315N1-serine into GSH, Extended Data Fig. 3d) to be assessed in cells deprived of cysteine for up to 48h.
Western blotting
Protein was extracted from whole cells by lysis in RIPA buffer (Pierce/Thermo Scientific) supplemented with protease and phosphate inhibitor cocktail (Pierce/Thermo Scientific). Lysates were cleared using centrifugation, resolved on Bolt 4-12% bis-tris pre-cast gels (Invitrogen, Life Technologies) and transferred to nitrocellulose membranes. Primary antibodies: MTAP (Proteintech, 11475-1-AP), AMD1 (Proteintech, 11052-1-AP), ODC1 (Proteintech, 17003-1-AP), GPX4 (Abcam, Ab125066), AHCY (Abcam, ab134966, EPR9261), CBS (Abcam, ab140600, EPR8579), CSE (Abcam, ab189916, EPR15468) and actin (EMD Millipore, MAB1501, clone C4) as loading control on the same blots. Secondary antibodies: IRDye800CW anti-mouse (925-32212), IRDye680RD anti-mouse (925-68072), IRDye800CW anti-rabbit (925-32213), IRDye680RD anti-rabbit (925-68073). Protein bands were detected and quantified using a Li-Cor Odyssey Fc infrared scanner and Image Studio (v5.2) software (Li-Cor Biosciences).
CellROX assay on live cells
Cells were seeded as stated above. Live cells were stained with Hoechst 33342 nuclear stain (Thermo Scientific, 62249) for 20min. Medium was removed and cells stained in 100μl medium containing CellTracker Green CMFDA (Invitrogen/Thermo Scientific, C7025) and Hoechst stain for 40min. After, cells were washed with PBS and 300μl of the relevant experimental medium was added for 1 hour, before CellROX Deep Red (Invitrogen/Thermo Scientific, C10422) was spiked into the medium and incubated for 40min. Medium was removed, cells washed with PBS and new relevant experimental medium including CellROX added and imaged using an Operetta automated microscope platform set to 37°C in 5% CO2 with Harmony software every hour for 16 − 24 hours. Images were analysed using Columbus software.
MDA staining on fixed cells
Cells were seeded, treated and fixed as stated above. Blocking was performed in 5% donkey serum (Sigma, D9663), 0.3% Triton X100 (Sigma, X100) in PBS for 1 hour at 4°C. Staining was performed using blocking buffer including MDA antibody 1:600 (Abcam, ab6463) overnight at 4°C on a shaker. Cells were washed with PBS and secondary antibody Alexa Fluor 568, goat-anti rabbit (Invitrogen, A11011) and Calcein AM 0.2nM (Invitrogen, C1430) in blocking solution was added for 1 − 2 hours at RT in the dark. Cells were washed in PBS again, before imaging using an Operetta automated microscope platform with Harmony and analysed using Columbus software.
Steady state metabolite measurements
Metabolomics experiments (other than spermine, see below) were performed as described previously53. Cells were seeded into 6-well plates (5 x10⁵ − 1.5 x 10⁶ cells per ml, depending on time-course, triplicate wells per condition) in complete medium and allowed to adhere overnight. Cells were washed with PBS and the relevant experimental media were added for the stated times. Duplicate wells were used for cell counting: cell counts were used to normalise the volume of lysis solvent prior to metabolite extractions (2 x 10^6 cells per ml). Cells were washed quickly in PBS, then ice-cold lysis solvent (Methanol 50%, acetonitrile 30%, water 20%) was added and cells scraped on ice. Lysates were transferred to 1.5ml tubes on ice, vortexed, then centrifuged at 15,000rpm at 4°C for 10 minutes. Supernatants were collected and stored at -80°C for LCMS analysis. For spermine analysis a Sequant ZIC-HILIC column guard (20mm x 2.1mm) (Merck) was used to separate spermine with the mobile phase mixed by A=0.1% (v/v) formic acid in water and B=0.1% (v/v) formic acid in acetonitrile. The flow rate was set to 200 μL/min and the injection volume was 20 μL. The separation was done using an isocratic program of 80% of A and 20% of B, with a total run time of 3 min. The Exactive mass spectrometer was operated in full scan mode over a mass range of 50–800 m/z at a resolution of 50,000 in positive mode.
Carbon-13 labelling of metabolites
For experiments using labelled methionine the same basic protocol was used as for steady state metabolite measurements (see above). Experimental media were formulated lacking methionine or serine (see above) and supplemented with the stated concentrations of 13C515N1-methionine, 13C315N1-serine (CKGas/Cambridge Isotope Laboratories Inc.) or 34S1-methionine (2BScientific). Metabolites were extracted as described above.
LCMS analysis and data processing
Prepared samples were analysed on a LCMS platform consisting of an Accela 600 LC system and an Exactive mass spectrometer (Thermo Scientific). A Sequant ZIC-HILIC column (4.6mm x 150mm, 3.5μm) (Merck) was used to separate the metabolites with the mobile phase mixed by A=0.1% (v/v) formic acid in water and B=0.1% (v/v) formic acid in acetonitrile. A gradient program starting at 20% of A and linearly increasing to 80% at 30 min was used followed by washing (92% of A for 5 mins) and re-equilibration (20% of A for 10min) steps. The total run time of the method was 45 min. The LC stream was desolvated and ionised in the HESI probe. The Exactive mass spectrometer was operated in full scan mode over a mass range of 70–1,200 m/z at a resolution of 50,000 with polarity switching. The LCMS raw data was converted into mzML files by using ProteoWizard and imported to MZMine 2.10 for peak extraction and sample alignment. An in-house database including all possible 13C and 15N isotopic m/z values of the relevant metabolites was used for the assignment of LCMS signals. Finally the peak areas were used for comparative quantification.
LCMS analysis of polyunsaturated phospholipids
Cells were seeded as 3 × 10⁵ cells per well into 6-well plates (triplicate wells per condition) and cultured in complete medium for 48 hours. For lipid extraction the cell samples were prepared as described above except that ice-cold isopropanol (IPA) was used as the lysis solvent. LCMS methods were based on those described previously54. For phospholipid measurement by LCMS 20μl of lysate solution was injected into a LCMS platform consisting of an Accela 600 LC system and an Exactive mass spectrometer (Thermo Scientific). An ACE silica gel column (3 mm × 150 mm × 3μm) (HiChrom) was used to separate the lipids in normal phase mode with the mobile phase mixed by A=20mM ammonium acetate/IPA (80:20, v/v) and B=ACN/IPA (80:20, v/v). A gradient program with flow rate of 0.3ml/min was used; starting at 8% of A for 1 min, from 1 to 5 min linearly increasing A to 9% and to 20% from 5 to 10 min, to 25% from 10 to 16 min and to 35% from 16 to 23 min and finally back to 8% of A from 26–40 min for re-equilibration. The Exactive mass spectrometer was operated in full scan mode over a mass range of 100–1,200 m/z at a resolution of 50,000 with polarity switching. The LCMS raw were was converted into mzML files by using ProteoWizard and imported to MZMine 2.10 for peak extraction and sample alignment. Phospholipids were identified by an in silico algorithm (Lipid search) in MZMine 2.10 with lipid classification and detailed fatty acyl information including the number of carbons and double bonds and finally the peak areas were used for comparative analysis.
Inductively Coupled Plasma Optical Emission Spectrometry (ICP-OES) Iron Assay
Cell lines were seeded in 6-well plates (each line in five wells) with the appropriate media as described above. After 24 hours two wells of cells were counted and the average number was used in million/ml as T=0h. The cells in the remaining three wells were cultured with 1.5ml of complete media. After 72 hours 1ml of used medium was taken and diluted with 4ml of deionized water for iron measurement by ICP-OES. The cells were counted and the average number in million/ml was used as T=72h. The diluted media were analyzed using Perkin Elmer Optima 7300 DV ICP-OES. The iron levels in ppm from triplicate samples of each cell line were averaged and then normalized to the difference in cell number between T=0h and T=72h for comparative analysis.
Xenograft experiment
In vivo experiments were carried out in line with previously described protocols4; animal work was performed to comply with the Animals (Scientific Procedures) Act 1986 and EU Directive 2010 (PPL70/8645) and was approved by the University of Glasgow local ethical review process. CD1-Nude (Crl:CD1-Foxn1nu) 6-8 week old female mice were obtained from Charles River (UK) and housed in a barrier facility proactive in environmental enrichment. Prior to experimental dietary modifications, mice were fed normal chow diet (Rat and Mouse Breeder & Grower, 801730, Special Diet Services, UK) and water ad libitum. HCT116-NTC and HCT116-MTAP-KO cells (4 x 10^6/flank) were implanted by unilateral sub-cutaneous injection. Injection sites were monitored daily until visible, measurable tumours had formed (approximately 5mm length). Mice with tumours were given experimental diet based on Baker Purified amino acid diet55 containing all essential amino acids, but lacking all non-essential amino acids (TestDiet, Richmond IN): Sucrose 15%, Corn starch 49.76%, Corn oil 7.89%, Amino acid premix 16%, Vitamin mix 0.2%, Mineral mix 10%, Sodium bicarbonate 1%, DL-alpha tocopheryl acetate 0.004%, Ethoxyquin (preservative) 0.019%, colour dye 0.03%. Amino acid premix (% by weight of total formulation): L-histidine-HCl 1.33%, L-isoleucine 1.78%, L-leucine 2.67%, L-lysine-HCl 3.11% L-Methionine 1.33%, L-Phenylalanine 1.78%, L-Threonine 1.78%, L-Tryptophan 0.44%, L-valine 1.78%. Drinking water contained or lacked L-cysteine & cystine, with all other non-essential amino acids added. Control drinking water (pH 7) contained Glycine, L-alanine, L-asparagine, L-aspartic acid, L-glutamic acid, L-proline, L-serine, L-glutamine, L-arginine, L-cysteine hydrochloride monohydrate (all 16mM), L-tyrosine disodium salt hydrate (3mM) and D-glucose (25mM) all Merck/Sigma. Cysteine-free drinking water (pH 7) contained L-alanine, L-asparagine, L-aspartic acid, L-glutamic acid, L-proline, L-glutamine, L-arginine (all 18.3mM), Glycine and L-serine (16mM), L-tyrosine disodium salt hydrate (3mM) and D-glucose (25mM) all Merck/Sigma. Both diet and drinking water were allowed ad libitum. Tumours were measured three times per week with callipers, volumes were calculated using the formula: volume = (length x width2) / 2. On reaching the maximum permitted tumour size (length or width = 15mm) or if tumours became ulcerated, mice were humanely killed.
Data presentation and statistics
For each set of data the n-numbers and error bars are shown in the figure legends. Where mean values of individual measurements are shown, bars are standard deviation (SD), where mean of means are shown (Fig. 5d and Extended Data Fig. 8b only) bars are standard error of mean (SEM). In vitro data are generally displayed as averages of n=3 biological replicates, noted in each figure legend. Tumour sizes were measured three times per week, tumour volumes were converted to changes in volume (as percentage) compared to the starting volume when diet was changed. Data are presented as weekly mean tumour volumes with bars showing SEM (Extended Data Fig. 8b). To compare the relative effects of cysteine-free diet on NTC and MTAP-KO cells, we calculated the difference in weekly mean tumour volume (as percentage) between individual tumours on the cysteine-free diet and the mean tumour volume on control diet (Fig. 5d). Throughout the paper statistical comparison between multiple groups was done by ordinary one-way ANOVA with Sidak’s multiple comparison test using GraphPad Prism v8.2.1 (279). For Extended Data Fig. 8c, where only two groups are compared, an unpaired TTEST with two-tails was performed using Microsoft excel for Mac (v14.7.7). Pearson correlation coefficients (R2) and associated p-values (two-sided Student’s t-distribution) were calculated with Microsoft excel for Mac (v14.7.7). P-values are shown to 3 decimal places, statistical significance was taken as P<0.05. A Reporting Summary to accompany this manuscript has been completed in line with Nature Research policy.
Extended Data
Extended Data Fig. 1. Cellular response to cysteine starvation.
(a) Cell lines were grown in complete medium, or matched medium lacking the stated nutrients for 24h. MDA-MB-231 data is replicated from Fig.1b for comparison with other cell lines. (b) MDA-MB-231 cells were either grown in complete medium containing all amino acids (Ctr), or matched medium lacking cysteine, with (-Cys +GSH) or without (-Cys) glutathione 5mM for the stated times. Metabolites were extracted and analysed by LCMS. (c) Cell lines were grown with (Ctr) or without cysteine (-Cys) and Ferrostatin (+F) 1μM for 24h and 72h. (d) Colorectal (HCT116 & SW480) and breast (MDA-MB-231 & MDA-MB-468) cancer cells were either grown in complete medium containing all amino acids (Control), or matched medium lacking cysteine, with (-Cys +HC) or without (-Cys) homocysteine 0.8mM for 24h. Cell lysates were probed for transsulfuration pathway enzyme expression by western blot. (e) Cells were either grown in complete medium containing all amino acids (+), or matched medium lacking cysteine (-) for 24h. Cell lysates were probed for transsulfuration pathway enzyme expression by western blot. Western blots are representative of two independent experiments. Bands were quantified on a LiCor scanner, actin corrected band intensity (arbitrary units) are shown. Statistical comparisons in b were done by an ordinary one-way ANOVA with Sidak’s multiple comparison test. Other than western blots, all data are averages of n=3 biological replicates, error bars are SD.
Extended Data Fig. 2. Rescue with cysteine precursors homocysteine and cystathionine.
(a) MDA-MB-231 cells were grown in medium lacking cysteine (-Cys), supplemented either with vehicle (Veh), homocysteine 0.2mM (HC) or cystathionine 0.2mM (CTH) for the stated times. Metabolites were extracted and analysed by LCMS. (b) MDA-MB-231 cells were grown in medium lacking cysteine, supplemented with vehicle (Veh), homocysteine (HC) 0.2mM or 0.8mM for 8h. Metabolites were extracted and analysed by LCMS. Statistical comparisons in f and g were done by an ordinary one-way ANOVA with Sidak’s multiple comparison test. All data are averages of n=3 biological replicates, error bars are SD.
Extended Data Fig. 3. Correlation between polyamine pathway activity and cysteine starvation sensitivity.
(a) Cells were grown with (+) or without (-) cysteine for 24h. Cell lysates were probed for MTAP expression by western blot and quantified with a LiCor scanner. (b) Cells were grown with (+) or without (-) cysteine for 24h. Cell lysates were probed for AMD1 and ODC1 enzyme expression by western blot and quantified with a LiCor scanner. Western blots are representative of two independent experiments. (c) Pearson correlation coefficients (R2) for a range of biological parameters versus sensitivity of 11 cell lines to cysteine starvation are shown. P-value = two-sided Student’s t-distribution Metabolite levels are all intracellular, except for ‘Extracellular MTA’. Multiple parameters were assessed under fed (Ctr) and cysteine starved (-Cys) conditions. All metabolite levels are normalized to cell number. Protein expression was quantified by western blot using a LiCor scanner, and are all normalized to actin. Iron uptake was assessed by ICP-OES. Steady state ROS levels were detected by live cell imaging of CellROX stain, steady state lipid peroxidation levels were evaluated by immunocytochemistry staining for MDA (malonyldialdehyde), both quantified using an automated microscope. (d) Cells were grown in complete medium (with 13C315N-?-serine 0.4mM substituted for serine) for 48h. Metabolites were extracted and analysed by LCMS. (e) Using peak area data shown in panel (d); GSH levels are shown as % of total GSH pool. In the top panel all isotopologues are shown, in the lower panel only cysteine derived isotopologues (m+4 and m+7) are shown. Supplementary data file contains analysis underlying correlation coefficients in (c). Other than western blots, all data are averages of n=3 biological replicates, error bars are SD.
Extended Data Fig. 4. Impact of polyamines on ROS levels.
(a) Cells were grown in complete (Ctr) or medium lacking cysteine (-Cys), with or without (Veh) CSE inhibitor beta-cyano-L-Alanine (0.5mM and 1mM) for 48h. (b) Cells were either grown in complete medium containing all amino acids (Control), or matched medium lacking cysteine (-Cysteine), with increasing amounts of MTA for 20h and 72h. (c) Cells were grown in complete medium with vehicle or MTA 500μM for 24h. Metabolites were extracted and analysed by LCMS. (d) Top panel: Cells were grown in complete medium containing either putrescine (+Putrescine), spermidine (+Spermidine) or spermine (+Spermine), all 20μM or without (+Vehicle). Bottom panel: Cells were grown in medium without cysteine containing either putrescine (+Putrescine), spermidine (+Spermidine) or spermine (+Spermine), all 20μM or without (+Vehicle). Reactive oxygen species (ROS) were detected in real time by an Operetta automated microscope in live cells treated with CellROX deep red. (e) Cells were grown in complete medium with or without 0.1mM MTOB for 16h, then either grown in complete medium (Ctr), or matched medium lacking cysteine (-Cys) with or without 0.1mM MTOB for 32h. (f) Cells were grown in complete medium with or without 0.1mM MTOB for 5h (with 13C515N1-methionine 0.2mM substituted for methionine). All data are averages of n=3 biological replicates, error bars are SD.
Extended Data Fig. 5. Labelling transsulfuration intermediates with 34S-methionine.
(a) MDA-MB-231 cells were grown in complete medium (with 34S1-methionine 0.2mM substituted for methionine) for 24h and then treated with AMD1 inhibitor sardomozide 20μM for 2h, 4h and 8h. (b) MDA-MB-231 cells and (c) MIAPaCa-2 (right) were grown in complete medium with or without AMD1 inhibitor sardomozide 20μM for 16h (with 34S1-methionine 0.2mM substituted for methionine). All data are averages of n=3 biological replicates, error bars are SD.
Extended Data Fig. 6. Impact of polyamine pathway modulation on ROS levels.
(a) Cells were grown in complete medium with or without PAOX inhibitor 10 μM, 40 μM or 80μM for 16h, then grown in complete medium (Ctr), or matched medium lacking cysteine with or without PAOX inhibitor 10μM, 40μM or 80μM for 24h. (b) Cell lines were grown in complete medium with (+SMOXi) or without (+Vehicle) SMOX inhibitor MDL72527 50μM, then grown in complete medium (Ctr) or matched medium lacking cysteine (-Cys) with or without 50μM SMOX inhibitor. Reactive oxygen species (ROS) were detected in real time by an Operetta automated microscope in live cells treated with CellROX deep red. ROS staining intensity is shown for 16h timepoint. (c) MDA-MB-231 cells were grown in either complete medium (black bars) or medium lacking cysteine (orange bars) under either normoxia (Nor) or hypoxia (Hyp); 1% oxygen, for stated times. (d) Cell lines were grown in complete medium (Ctr) or matched medium lacking cysteine (-Cys) with or without 20μM AMD1 inhibitor. Reactive oxygen species (ROS) were detected in real time by an Operetta automated microscope in live cells treated with CellROX deep red. ROS staining intensity is shown for 16h timepoint. (e) Cell lines highly sensitive to cysteine starvation (MDA-MB-231, PANC-1, MIAPaCa-2) were grown in medium without cysteine containing increasing concentrations of Methionine (0 to 1mM) for 20h. (f & g) Cell lines sensitive to cysteine starvation (MDA-MB-231, PANC-1, MIAPaCa-2) were grown in medium without cysteine containing increasing concentrations of Methionine (0 to 10μM) for 17h (f) and 41h (g). (h) Cell lines were grown in complete medium (Ctr) or matched medium lacking cysteine (-Cys) with or without methionine (Met) at the stated concentrations. Reactive oxygen species (ROS) were detected in real time by an Operetta automated microscope in live cells treated with CellROX deep red. ROS staining intensity is shown for 18h timepoint. Statistical comparisons in b, c, d & h were done by an ordinary one-way ANOVA with Sidak’s multiple comparison test. All data are averages of n=3 biological replicates, error bars are SD.
Extended Data Fig. 7. Impact of methionine restriction on polyamine and transsulfuration pathways.
(a) PANC-1 cells were grown in medium lacking methionine supplemented with varying levels of 13C515N1-methionine for 5h. Metabolites were extracted and analysed by LCMS. (b) Levels of amino acids were assessed using LCMS data from the experiments shown in Fig. 5a and Extended Data Fig. 7a. Relative quantity (peak area, relative to 50uM condition) is shown for each amino acid. (c) MIAPaCa-2 cells were cultured in either DMEM or RPMI for two weeks. Experiments were performed by growing cells either in complete medium (Ctr) or matched medium lacking cysteine (-Cys) for 32h and 48h. All data are averages of n=3 biological replicates with error bars as SD.
Extended Data Fig. 8. Consequences of acute MTAP deletion in HCT116 cells.
(a) MTAP positive (Parental/Par, NTC) and negative (M1, M2) HCT116 cells were grown in complete medium (with 13C515N1-methionine 0.2mM substituted for methionine) for 30h. Metabolites were extracted and analysed by LCMS. Data are averages of n=3 biological replicates with error bars as SD. (b) CD-1 Nude mice were injected with MTAP positive (NTC) and MTAP deleted (M2) HCT116 cells. Once measurable xenograft tumours had formed, mice were transferred to a diet & drinking water regime either containing all amino acids (Complete), or lacking cysteine and cystine, but containing all other amino acids (-Cys), data are averages, bars are SEM (NTC Control diet n=8, NTC –Cys diet n=7, MTAP-KO2 Control diet n=9, MTAP-KO2 –Cys n=10). (c) Metabolites were extracted from xenograft tumours and serum and subjected to LCMS analysis for MTA levels, data are averages, bars are SD, unpaired Ttest, 2-tails, NTC n=16, MTAP KO n=19.
Extended Data Fig. 9. Consequences of acute MTAP restoration in HCT116 cells.
(a) HCT116 cells in which MTAP had been deleted by CRISPR/Cas9 (M2), were either stably transfected with an empty vector (clones M2.EV1 & M2.EV2) or a plasmid for MTAP expression (clones M2.MX1 & M2.MX2). MTAP expression was validated by western blot. Western blot is representative of two independent experiments. Cells were grown in complete medium containing all amino acids (Ctr), or matched medium lacking cysteine (-Cys). After 20h, cells were fixed, stained and counted. (b) The stated HCT116 clones were grown in complete medium with or without the xCT inhibitor and ferroptosis inducer erastin 10μM for 18h. (c) MTAP expressing (NTC & M2.MX2) and MTAP deleted (M2 & M2.EV1) HCT116 cells were grown in complete medium (with 13C515N1-methionine 0.2mM substituted for methionine) for 30h. Metabolites were extracted and analysed by LCMS. (d) MTAP expressing (NTC & M2.MX2) and MTAP deleted (M2) HCT116 cells were seeded at a range of cell densities in complete medium in 24-well plates. After 24h, cells were washed with PBS and medium was changed for medium lacking cysteine or complete medium containing all amino acids. After 20h, cells were fixed, stained and counted. (e) Glioblastoma (GBM) cell lines were grown in complete medium for 24h. Cell lysates were probed for MTAP, AMD1 and Actin expression by western blot and quantified with a LiCor scanner. Western blot is representative of two independent experiments. (f) GBM cell lines were grown in either complete medium (Ctr) or medium lacking cysteine (-Cys) for 48h. (g) The breast cancer cell lines MDA-MB-231 (highly sensitive) and MDA-MB-468 (resistant) were grown in either control (Ctr) or medium lacking cysteine (-Cys) for 48 or 72h. Cells for this timepoint were fixed and counted, while other cells treated the same way were re-fed with complete medium for an additional 48h (Ctr +48h, -Cys 48h), before cells were counted. All data except western blots are averages of n=3 biological replicates, error bars are SD.
Supplementary Material
Footnotes
Author contributions
TZ performed cell culture experiments, mass spectrometry and data analysis. CB performed cell culture experiments and analysis, live-cell imaging experiments, plus data analysis. ACN performed cell culture experiments, designed CRISPR constructs and generated CRISPR clones. AHU performed cell culture, mass spectrometry and associated data analysis. DA performed and analysed data for in vivo experiments. KB contributed to designing, supervising and analysing in vivo work. ODKM performed cell culture experiments, contributed to experimental design, data analysis and interpretation and wrote the manuscript. All authors contributed to finalising the manuscript.
Competing interests
ODKM contributed to CRUK Cancer Research Technology filing of UK Patent Application no. 1609441.9, relating to dietary modulation of amino acids and is a co-founder and shareholder in Faeth Therapeutics Inc. The other authors declare no competing interests.
Acknowledgements
We wish to thank the staff of the Biological Services facility at the CRUK Beatson Institute, funded by (A18076 & A17196). We thank Dan Tennant, Saverio Tardito, Kevin Ryan and Anthony Chalmers for assistance with biological resources. KB and DA are core funded by CRUK (A17196 & A29799). ODKM, TZ, CB and ACN were funded by a Cancer Research UK Career Development Fellowship awarded to ODKM (C53309/A19702).
Data Availability Statement
Source data for Figures will be available at the Nature Metabolism website and deposited at: http://researchdata.gla.ac.uk
References
- 1.DeBerardinis RJ, Chandel NS. Fundamentals of cancer metabolism. Sci Adv. 2016;2:e1600200. doi: 10.1126/sciadv.1600200. [DOI] [PMC free article] [PubMed] [Google Scholar]
- 2.Hanahan D, Weinberg RA. Hallmarks of cancer: the next generation. Cell. 2011;144:646–674. doi: 10.1016/j.cell.2011.02.013. [DOI] [PubMed] [Google Scholar]
- 3.Maddocks OD, et al. Serine starvation induces stress and p53-dependent metabolic remodelling in cancer cells. Nature. 2013;493:542–546. doi: 10.1038/nature11743. [DOI] [PMC free article] [PubMed] [Google Scholar]
- 4.Maddocks ODK, et al. Modulating the therapeutic response of tumours to dietary serine and glycine starvation. Nature. 2017;544:372–376. doi: 10.1038/nature22056. [DOI] [PubMed] [Google Scholar]
- 5.Eagle H. The specific amino acid requirements of a mammalian cell (strain L) in tissue culture. J Biol Chem. 1955;214:839–852. [PubMed] [Google Scholar]
- 6.Eagle H. The specific amino acid requirements of a human carcinoma cell (Stain HeLa) in tissue culture. J Exp Med. 1955;102:37–48. doi: 10.1084/jem.102.1.37. [DOI] [PMC free article] [PubMed] [Google Scholar]
- 7.Eagle H. Nutrition needs of mammalian cells in tissue culture. Science. 1955;122:501–514. doi: 10.1126/science.122.3168.501. [DOI] [PubMed] [Google Scholar]
- 8.Dixon SJ, et al. Ferroptosis: an iron-dependent form of nonapoptotic cell death. Cell. 2012;149:1060–1072. doi: 10.1016/j.cell.2012.03.042. [DOI] [PMC free article] [PubMed] [Google Scholar]
- 9.Yang WS, et al. Peroxidation of polyunsaturated fatty acids by lipoxygenases drives ferroptosis. Proc Natl Acad Sci U S A. 2016;113:E4966–4975. doi: 10.1073/pnas.1603244113. [DOI] [PMC free article] [PubMed] [Google Scholar]
- 10.De Sanctis G, Spinelli M, Vanoni M, Sacco E. K-Ras Activation Induces Differential Sensitivity to Sulfur Amino Acid Limitation and Deprivation and to Oxidative and Anti-Oxidative Stress in Mouse Fibroblasts. PLoS One. 2016;11:e0163790. doi: 10.1371/journal.pone.0163790. [DOI] [PMC free article] [PubMed] [Google Scholar]
- 11.Poursaitidis I, et al. Oncogene-Selective Sensitivity to Synchronous Cell Death following Modulation of the Amino Acid Nutrient Cystine. Cell Rep. 2017;18:2547–2556. doi: 10.1016/j.celrep.2017.02.054. [DOI] [PMC free article] [PubMed] [Google Scholar]
- 12.Cramer SL, et al. Systemic depletion of L-cyst(e)ine with cyst(e)inase increases reactive oxygen species and suppresses tumor growth. Nat Med. 2017;23:120–127. doi: 10.1038/nm.4232. [DOI] [PMC free article] [PubMed] [Google Scholar]
- 13.McCormick PN, et al. Assessment of Tumor Redox Status through (S)-4-(3-[(18)F]fluoropropyl)-L-Glutamic Acid PET Imaging of System xc (-) Activity. Cancer Res. 2019;79:853–863. doi: 10.1158/0008-5472.CAN-18-2634. [DOI] [PMC free article] [PubMed] [Google Scholar]
- 14.Dixon SJ, et al. Pharmacological inhibition of cystine-glutamate exchange induces endoplasmic reticulum stress and ferroptosis. Elife. 2014;3:e02523. doi: 10.7554/eLife.02523. [DOI] [PMC free article] [PubMed] [Google Scholar]
- 15.Harris IS, et al. Glutathione and thioredoxin antioxidant pathways synergize to drive cancer initiation and progression. Cancer Cell. 2015;27:211–222. doi: 10.1016/j.ccell.2014.11.019. [DOI] [PubMed] [Google Scholar]
- 16.DeNicola GM, et al. Oncogene-induced Nrf2 transcription promotes ROS detoxification and tumorigenesis. Nature. 2011;475:106–109. doi: 10.1038/nature10189. [DOI] [PMC free article] [PubMed] [Google Scholar]
- 17.Sayin VI, et al. Activation of the NRF2 antioxidant program generates an imbalance in central carbon metabolism in cancer. Elife. 2017;6 doi: 10.7554/eLife.28083. [DOI] [PMC free article] [PubMed] [Google Scholar]
- 18.Kang YP, et al. Cysteine dioxygenase 1 is a metabolic liability for non-small cell lung cancer. Elife. 2019;8 doi: 10.7554/eLife.45572. [DOI] [PMC free article] [PubMed] [Google Scholar]
- 19.Muir A, et al. Environmental cystine drives glutamine anaplerosis and sensitizes cancer cells to glutaminase inhibition. Elife. 2017;6 doi: 10.7554/eLife.27713. [DOI] [PMC free article] [PubMed] [Google Scholar]
- 20.Romero R, et al. Keap1 loss promotes Kras-driven lung cancer and results in dependence on glutaminolysis. Nat Med. 2017;23:1362–1368. doi: 10.1038/nm.4407. [DOI] [PMC free article] [PubMed] [Google Scholar]
- 21.Shin CS, et al. The glutamate/cystine xCT antiporter antagonizes glutamine metabolism and reduces nutrient flexibility. Nat Commun. 2017;8:15074. doi: 10.1038/ncomms15074. [DOI] [PMC free article] [PubMed] [Google Scholar]
- 22.Alvarez SW, et al. NFS1 undergoes positive selection in lung tumours and protects cells from ferroptosis. Nature. 2017;551:639–643. doi: 10.1038/nature24637. [DOI] [PMC free article] [PubMed] [Google Scholar]
- 23.Kim J, et al. Expression of cystathionine beta-synthase is downregulated in hepatocellular carcinoma and associated with poor prognosis. Oncol Rep. 2009;21:1449–1454. doi: 10.3892/or_00000373. [DOI] [PubMed] [Google Scholar]
- 24.Zhao H, et al. Frequent epigenetic silencing of the folate-metabolising gene cystathionine-beta-synthase in gastrointestinal cancer. PLoS One. 2012;7:e49683. doi: 10.1371/journal.pone.0049683. [DOI] [PMC free article] [PubMed] [Google Scholar]
- 25.Zhu JJ, et al. Transsulfuration Activity Can Support Cell Growth upon Extracellular Cysteine Limitation. Cell Metab. 2019;30:865. doi: 10.1016/j.cmet.2019.09.009. [DOI] [PMC free article] [PubMed] [Google Scholar]
- 26.Brosnan JT, Brosnan ME. The sulfur-containing amino acids: an overview. J Nutr. 2006;136:1636S–1640S. doi: 10.1093/jn/136.6.1636S. [DOI] [PubMed] [Google Scholar]
- 27.Kryukov GV, et al. MTAP deletion confers enhanced dependency on the PRMT5 arginine methyltransferase in cancer cells. Science. 2016;351:1214–1218. doi: 10.1126/science.aad5214. [DOI] [PMC free article] [PubMed] [Google Scholar]
- 28.Marjon K, et al. MTAP Deletions in Cancer Create Vulnerability to Targeting of the MAT2A/PRMT5/RIOK1 Axis. Cell Rep. 2016;15:574–587. doi: 10.1016/j.celrep.2016.03.043. [DOI] [PubMed] [Google Scholar]
- 29.Mavrakis KJ, et al. Disordered methionine metabolism in MTAP/CDKN2A-deleted cancers leads to dependence on PRMT5. Science. 2016;351:1208–1213. doi: 10.1126/science.aad5944. [DOI] [PubMed] [Google Scholar]
- 30.Zilka O, et al. On the Mechanism of Cytoprotection by Ferrostatin-1 and Liproxstatin-1 and the Role of Lipid Peroxidation in Ferroptotic Cell Death. ACS Cent Sci. 2017;3:232–243. doi: 10.1021/acscentsci.7b00028. [DOI] [PMC free article] [PubMed] [Google Scholar]
- 31.Shlomi T, Fan J, Tang B, Kruger WD, Rabinowitz JD. Quantitation of cellular metabolic fluxes of methionine. Anal Chem. 2014;86:1583–1591. doi: 10.1021/ac4032093. [DOI] [PMC free article] [PubMed] [Google Scholar]
- 32.Zabala-Letona A, et al. mTORC1-dependent AMD1 regulation sustains polyamine metabolism in prostate cancer. Nature. 2017;547:109–113. doi: 10.1038/nature22964. [DOI] [PMC free article] [PubMed] [Google Scholar]
- 33.Labuschagne CF, van den Broek NJ, Mackay GM, Vousden KH, Maddocks OD. Serine, but not glycine, supports one-carbon metabolism and proliferation of cancer cells. Cell Rep. 2014;7:1248–1258. doi: 10.1016/j.celrep.2014.04.045. [DOI] [PubMed] [Google Scholar]
- 34.Zhang T, Labuschagne CF, Vousden KH, Maddocks ODK. Direct Estimation of Metabolic Flux by Heavy Isotope Labeling Simultaneous with Pathway Inhibition: Metabolic Flux Inhibition Assay. Methods Mol Biol. 2019;1862:109–119. doi: 10.1007/978-1-4939-8769-6_8. [DOI] [PubMed] [Google Scholar]
- 35.Asimakopoulou A, et al. Selectivity of commonly used pharmacological inhibitors for cystathionine β synthase (CBS) and cystathionine γ lyase (CSE) Br J Pharmacol. 2013;169:922–932. doi: 10.1111/bph.12171. [DOI] [PMC free article] [PubMed] [Google Scholar]
- 36.Andreu-Perez P, et al. Methylthioadenosine (MTA) inhibits melanoma cell proliferation and in vivo tumor growth. BMC Cancer. 2010;10:265. doi: 10.1186/1471-2407-10-265. [DOI] [PMC free article] [PubMed] [Google Scholar]
- 37.Subhi AL, et al. Methylthioadenosine phosphorylase regulates ornithine decarboxylase by production of downstream metabolites. J Biol Chem. 2003;278:49868–49873. doi: 10.1074/jbc.M308451200. [DOI] [PubMed] [Google Scholar]
- 38.Subhi AL, et al. Loss of methylthioadenosine phosphorylase and elevated ornithine decarboxylase is common in pancreatic cancer. Clin Cancer Res. 2004;10:7290–7296. doi: 10.1158/1078-0432.CCR-04-0972. [DOI] [PubMed] [Google Scholar]
- 39.Wishart DS, et al. HMDB 4.0: the human metabolome database for 2018. Nucleic Acids Res. 2018;46:D608–D617. doi: 10.1093/nar/gkx1089. [DOI] [PMC free article] [PubMed] [Google Scholar]
- 40.Krall AS, Xu S, Graeber TG, Braas D, Christofk HR. Asparagine promotes cancer cell proliferation through use as an amino acid exchange factor. Nat Commun. 2016;7:11457. doi: 10.1038/ncomms11457. [DOI] [PMC free article] [PubMed] [Google Scholar]
- 41.Harris PN, Krahl ME, Clowes GH. p-Dimethylaminoazobenzene carcinogenesis with purified diets varying in content of cysteine, cystine, liver extract, protein, riboflavin, and other factors. Cancer Res. 1947;7:162–175. [PubMed] [Google Scholar]
- 42.Lockart RZ, Jr, Eagle H. Requirements for growth of single human cells. Science. 1959;129:252–254. doi: 10.1126/science.129.3344.252. [DOI] [PubMed] [Google Scholar]
- 43.Ye C, Sutter BM, Wang Y, Kuang Z, Tu BP. A Metabolic Function for Phospholipid and Histone Methylation. Mol Cell. 2017;66:180–193.:e188. doi: 10.1016/j.molcel.2017.02.026. [DOI] [PMC free article] [PubMed] [Google Scholar]
- 44.Casero RA, Jr, Marton LJ. Targeting polyamine metabolism and function in cancer and other hyperproliferative diseases. Nat Rev Drug Discov. 2007;6:373–390. doi: 10.1038/nrd2243. [DOI] [PubMed] [Google Scholar]
- 45.Ramani D, De Bandt JP, Cynober L. Aliphatic polyamines in physiology and diseases. Clin Nutr. 2014;33:14–22. doi: 10.1016/j.clnu.2013.09.019. [DOI] [PubMed] [Google Scholar]
- 46.Bistulfi G, et al. The essential role of methylthioadenosine phosphorylase in prostate cancer. Oncotarget. 2016;7:14380–14393. doi: 10.18632/oncotarget.7486. [DOI] [PMC free article] [PubMed] [Google Scholar]
- 47.Gerner EW, Meyskens FL., Jr Polyamines and cancer: old molecules, new understanding. Nat Rev Cancer. 2004;4:781–792. doi: 10.1038/nrc1454. [DOI] [PubMed] [Google Scholar]
- 48.Bello-Fernandez C, Packham G, Cleveland JL. The ornithine decarboxylase gene is a transcriptional target of c-Myc. Proc Natl Acad Sci U S A. 1993;90:7804–7808. doi: 10.1073/pnas.90.16.7804. [DOI] [PMC free article] [PubMed] [Google Scholar]
- 49.Bertino JR, Waud WR, Parker WB, Lubin M. Targeting tumors that lack methylthioadenosine phosphorylase (MTAP) activity: current strategies. Cancer Biol Ther. 2011;11:627–632. doi: 10.4161/cbt.11.7.14948. [DOI] [PMC free article] [PubMed] [Google Scholar]
- 50.Lien EC, Ghisolfi L, Geck RC, Asara JM, Toker A. Oncogenic PI3K promotes methionine dependency in breast cancer cells through the cystine-glutamate antiporter xCT. Sci Signal. 2017;10 doi: 10.1126/scisignal.aao6604. [DOI] [PMC free article] [PubMed] [Google Scholar]
- 51.Hayano M, Yang WS, Corn CK, Pagano NC, Stockwell BR. Loss of cysteinyl-tRNA synthetase (CARS) induces the transsulfuration pathway and inhibits ferroptosis induced by cystine deprivation. Cell Death Differ. 2016;23:270–278. doi: 10.1038/cdd.2015.93. [DOI] [PMC free article] [PubMed] [Google Scholar]
- 52.Sanderson SM, Mikhael PG, Ramesh V, Dai Z, Locasale JW. Nutrient availability shapes methionine metabolism in p16/MTAP-deleted cells. Sci Adv. 2019;5:eaav7769. doi: 10.1126/sciadv.aav7769. [DOI] [PMC free article] [PubMed] [Google Scholar]
- 53.Maddocks OD, Labuschagne CF, Adams PD, Vousden KH. Serine Metabolism Supports the Methionine Cycle and DNA/RNA Methylation through De Novo ATP Synthesis in Cancer Cells. Mol Cell. 2016;61:210–221. doi: 10.1016/j.molcel.2015.12.014. [DOI] [PMC free article] [PubMed] [Google Scholar]
- 54.Zhang T, et al. Changeover from signalling to energy-provisioning lipids during transition from colostrum to mature milk in the giant panda (Ailuropoda melanoleuca) Sci Rep. 2016;6:36141. doi: 10.1038/srep36141. [DOI] [PMC free article] [PubMed] [Google Scholar]
- 55.Hirakawa DA, Olson LM, Baker DH. Comparative Utilization of a Crystalline Amino-Acid Diet and a Methionine-Fortified Casein Diet by Young-Rats and Mice. Nutr Res. 1984;4:891–895. [Google Scholar]
Associated Data
This section collects any data citations, data availability statements, or supplementary materials included in this article.
Supplementary Materials
Data Availability Statement
Source data for Figures will be available at the Nature Metabolism website and deposited at: http://researchdata.gla.ac.uk


