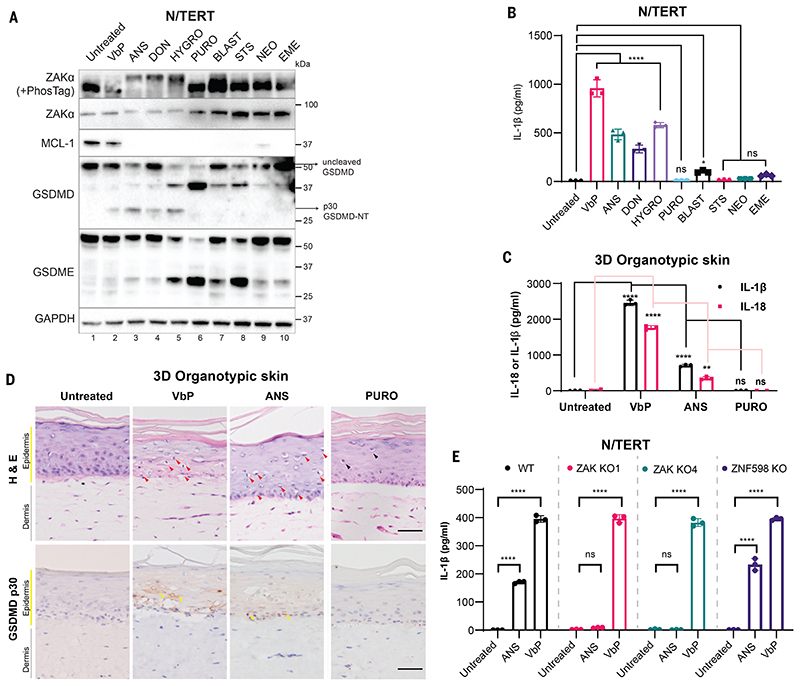
Figure 2. ZAKα-activating compounds induce NLRP1-driven pyroptosis.
(A) Immunoblot of N/TERT cell lysate after treatment with the indicated drugs. ZAKα phosphorylation was detected after 3 hours of drug treatment, while immunoblots for MCL-1, GSDMD, and GSDME were performed using samples 24 hours post treatment. (B) IL-1β ELISA of N/TERT cell media 24 hours post treatment with the indicated drugs at concentrations specified in A. Note that a smaller volume of the media and a higher number of cells were used in this experiment, accounting for the overall higher concentration of IL-1β. (C) IL-1β and IL-18 ELISA of growth media collected from 3D organotypic skin cultures treated with the indicated drugs. (D) H&E and cleaved GSDMD-NT (p30 specific) immunostaining of 3D organotypic skin cultures treated with the indicated drugs in D. Scale bar represents 100 μm. Red arrows indicate keratinocytes with diminished eosin but dense hematoxylin staining that were abundant in VbP- and ANS-treated cultures. Black arrows indicate putatively apoptotic cells with low eosin and hematoxylin staining that were abundant in PURO-treated samples. Yellow arrows indicate membranous GSDMD p30 staining. Images represent one of 3 independent organotypic skin cultures. (E) IL-1β ELISA of culture media from N/TERT cells of the indicated genotypes after 24 hours of drug treatment. VbP was used at 3 μM and ANS at 1 μM. Error bars represent standard errors of the mean (S.E.M.) from three biological replicate experiments, where one replicate refers to an independent seeding and treatment of the cells. The significance values were calculated based on two-way ANOVA followed by Dunnett’s test for multiple pairwise comparisons in (B) and (C), and Sidak’s test in (E). ns, non-significant, *P<0.05, **P<0.01, ****P<0.0001.

