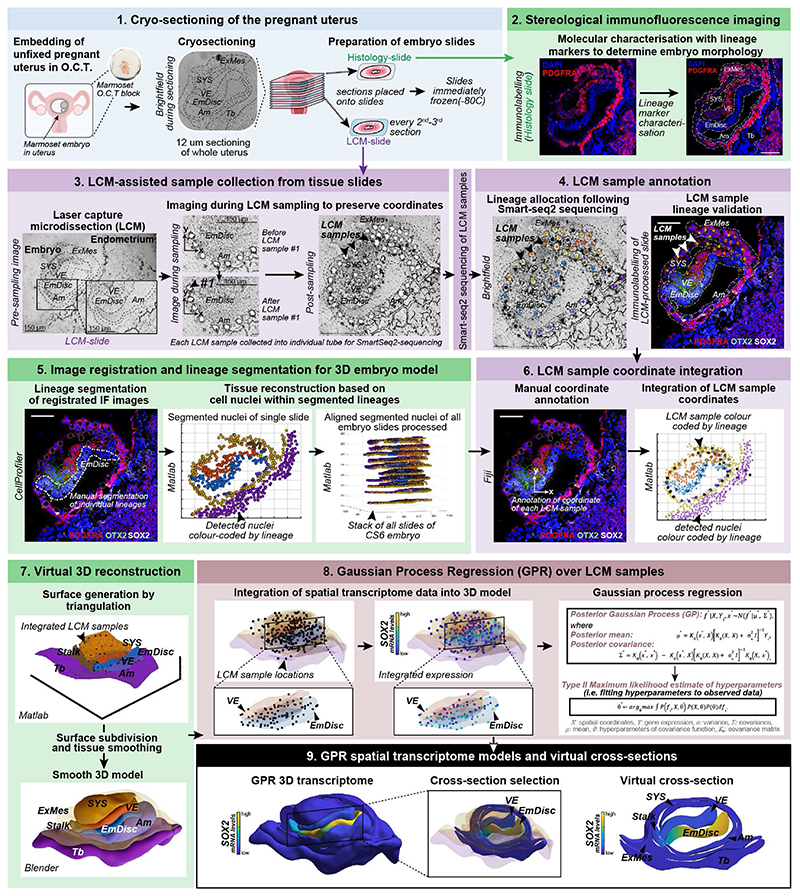
Extended Data Figure 1. Overview of the STEP method.
1. Cryosectioning of the pregnant uterus: Pregnant marmoset uteri were extracted, embedded in O.C.T. and snap-frozen. To provide the best possible RNA quality, the tissue was processed unfixed for laser capture microdissection (LCM)-mediated Smart-Seq2 sequencing. 2. Stereological immunofluorescence imaging: Immunostainings for established lineage markers were performed for every other to every third section containing the implanted embryo. Tile-scan images were generated tile-scan with a confocal or apotome microscope. 12μm-thick cryosections were catalogued in ascending order, which was used to determine the Z-coordinate of LCM-transcriptomes. 3. LCM assisted sample collection: Every other to every third section was processed for LCM sample collection and all LCM-processed sections were subjected to immunofluorescence (IF) with lineage markers afterwards. For transcriptome sample acquisition, a photo was taken of the section. Then, one to three cells in a region of interest were selected using the LCM software Zeiss PALM and cut out by the laser. In a second step, a pulse laser catapulted the sample into a collection tube with lysis buffer. Then, a second picture was taken of the section at the matching position with the sample removed and matched to the collection tube and image file. Each STEP-transcriptome was assigned an individual ID and lineage identity based on the original location within the embryo cryosection, i.e. the cut-out location of the LCM-sample. 4. Sample annotation: Collected LCM-samples were subjected to the Smart-Seq2 protocol and sequenced to an average depth of > 2 million 150bp paired reads. LCM-sample lineage identity was assigned based on the position within the embryo. Sample annotation was performed manually, side-by-side with phase contrast images acquired during sample collection and the confocal image with lineage markers (e.g. PDGFRA, OTX2, SOX2) of the same section. In addition, annotations were guided by the density and orientation of DAPI-labelled nuclei, which allowed us to discriminate between neighbouring tissues. We refined annotations by integration of lineage marker expression from immunofluorescence stainings or STEP-transcriptome data. Samples with more than one lineage signature were annotated as mixed and removed from downstream analysis. 5. Image registration and lineage segmentation: Images were aligned by image registration in Fiji, whereby each image was registered to the DAPI channel of the previous image. Next, nuclei were segmented into individual objects using Cell Profiler. For lineage segmentation, the segmented nuclei were assigned lineages based on lineage marker immunostaining (e.g. POU5F1 to demarcate the EmDisc and Amnion, PDGFRA for ExMes, VE and SYS, TFAP2C for trophoblast, Amnion and PGCs), and taking into account known anatomical features of the embryo (e.g. EmDisc resides in-between VE and Amnion). 6. Transcriptome coordinate integration: The X and Y coordinates of the annotated transcriptomes were compiled into MATLAB matrices. 7.Virtual 3D embryo reconstruction: We generated primary surfaces in MATLAB by triangulation (see Methods). In a second step, embryonic and extraembryonic surfaces were smoothened in Blender, an open-source 3D modelling and animation software. 8. Gaussian Process Regression (GPR) over LCM samples: LCM spatial transcriptome sample coordinates were integrated into the 3D embryo models and continuous expression patterns between discrete LCM samples were inferred using Gaussian Process Regression (see Methods). Since expression patterns may be discontinuous across tissue types, we inferred an independent GPR model for each tissue at each stage. 9. GPR spatial transcriptome models and virtual cross sections: Final smooth GPR gene expression patterns could be displayed in 3D on embryo models. Defined coordinates were used to extract expression patterns in each lineage for visualisation of virtual cross sections. Scale bars represent 100 μm. cs, Carnegie stage; O.C.T, Optimal cutting temperature compound (used to mount uteri); EmDisc, Embryonic disc; Am, Amnion; SYS, Secondary Yolk Sac; VE, Visceral Endoderm; Tb, Trophoblast; ExMes, Extraembryonic mesoderm; PGCs, Primordial Germ Cells.

