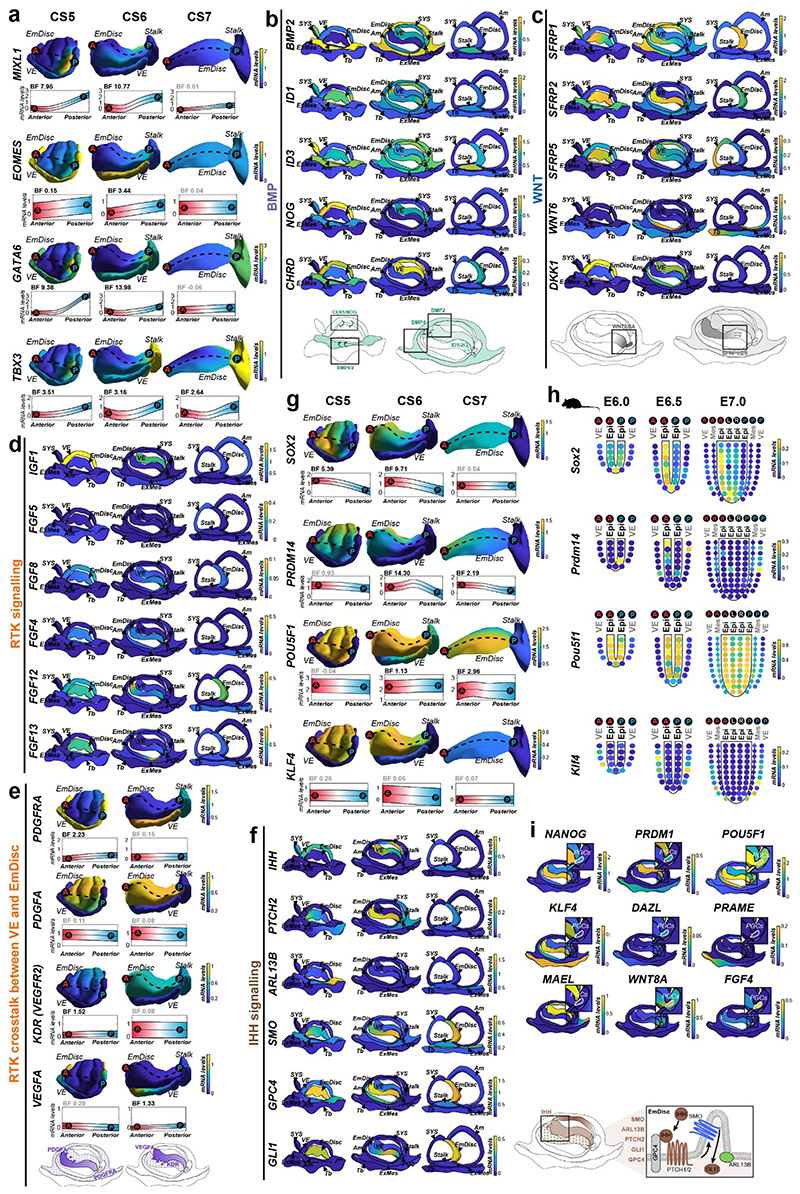
Extended Data Figure 4. Expression gradients and signalling environment in marmoset gastrulation.
a, Posterior markers depicted in Gaussian process regression-based 3D models of CS5-7 EmDisc and VE. Upper panels: Relative mRNA levels across the model. Lower panels: mRNA expression change along EmDisc anterior-posterior axis (indicated by dashed line; anterior (red, A) to posterior (blue, P)), quantified by Bayes Factor (BF) (relates to Figure 3a).
b, BMP signalling-related gene expression depicted in CS5-7 model cross sections. Schematic (bottom) summarises BMP signalling pathways in the context of amnion differentiation from EmDisc boundaries in CS5 and 6.
c, WNT signalling genes shown in CS5-7 in model cross sections. Schematic summarises WNT signalling patterning in the CS6 EmDisc during gastrulation.
d, RTK-related gene expression depicted in CS5-7 model cross sections displays VE is the primary source of IGF1, low expression of FGFs involved in mouse gastrulation (FGF8, FGF5), and presence of FGF4 and intracellular FGFs (FGF12, FGF13).
e, RTK-related gene expression depicted in EmDisc and VE in CS5 and 6 3D models. Schematic summarizes PDGFA and VEGFA in the CS6 embryo.
f, IHH signalling-related gene expression shown in CS5-7 in model cross sections. Schematic summarises proposed paracrine IHH signalling pathways.
g, Representative anterior pluripotency genes depicted in CS5-7 EmDisc and VE 3D models (relates to Fig 3e)
h, Corn plots of matched pluripotency genes in the gastrulating mouse embryo at E6.0, E6.5, and E7.05. Each kernel represents the average transcriptome of micro-dissected, spatially-defined sections of mouse embryos (relates to Figure 3c).
i, Early (NANOG, PRDM1, POU5F1, KLF4) and late (DAZL, MAEL, PRAME) PGC marker and enriched signalling components (FGF4, WNT8A) expression in PGCs, depicted in CS6 model cross sections.
EmDisc, Embryonic Disc; SYS, Secondary Yolk Sac; VE, Visceral Endoderm; ExMes, Extraembryonic Mesoderm; Am, Amnion; Tb, Trophoblast.

