

Abstract
Neuronal activity propagates through the network during seizures, engaging brain dynamics at multiple scales. Such propagating events can be described through the avalanches framework, which can relate spatiotemporal activity at the microscale with global network properties. Interestingly, propagating avalanches in healthy networks are indicative of critical dynamics, where the network is organized to a phase transition, which optimizes certain computational properties. Some have hypothesized that the pathologic brain dynamics of epileptic seizures are an emergent property of microscale neuronal networks collectively driving the brain away from criticality. Demonstrating this would provide a unifying mechanism linking microscale spatiotemporal activity with emergent brain dysfunction during seizures. Here, we investigated the effect of drug-induced seizures on critical avalanche dynamics, using in vivo whole-brain two-photon imaging of GCaMP6s larval zebrafish (males and females) at single neuron resolution. We demonstrate that single neuron activity across the whole brain exhibits a loss of critical statistics during seizures, suggesting that microscale activity collectively drives macroscale dynamics away from criticality. We also construct spiking network models at the scale of the larval zebrafish brain, to demonstrate that only densely connected networks can drive brain-wide seizure dynamics away from criticality. Importantly, such dense networks also disrupt the optimal computational capacities of critical networks, leading to chaotic dynamics, impaired network response properties and sticky states, thus helping to explain functional impairments during seizures. This study bridges the gap between microscale neuronal activity and emergent macroscale dynamics and cognitive dysfunction during seizures.
SIGNIFICANCE STATEMENT Epileptic seizures are debilitating and impair normal brain function. It is unclear how the coordinated behavior of neurons collectively impairs brain function during seizures. To investigate this we perform fluorescence microscopy in larval zebrafish, which allows for the recording of whole-brain activity at single-neuron resolution. Using techniques from physics, we show that neuronal activity during seizures drives the brain away from criticality, a regime that enables both high and low activity states, into an inflexible regime that drives high activity states. Importantly, this change is caused by more connections in the network, which we show disrupts the ability of the brain to respond appropriately to its environment. Therefore, we identify key neuronal network mechanisms driving seizures and concurrent cognitive dysfunction.
Keywords: calcium imaging, criticality, epilepsy, state transitions, whole brain, zebrafish
Introduction
Epilepsy is a collection of neurologic syndromes primarily defined by the recurrence of seizures (Fisher et al., 2014). Seizures can acutely impair awareness (Blumenfeld, 2012), and patients with uncontrolled seizures (∼1/3; Kwan and Brodie, 2000) experience severely reduced quality of life (Sperling, 2004). Seizures are characterized by abnormal brain dynamics at multiple scales, engaging neurons and glia (Khoshkhoo et al., 2017; Diaz Verdugo et al., 2019; Magloire et al., 2019a), neuronal ensembles (Muldoon et al., 2013; J. Liu and Baraban, 2019), and coarse brain areas (Gibbs et al., 1935), with nontrivial relationships between micro and macroscale dynamics (Martinet et al., 2017).
One approach to linking microscale collective behaviors during seizures with emergent properties at larger scales is statistical physics, which estimates microscopic variables probabilistically to study macroscopic properties. In particular, quantifying how systems respond to perturbations with spreading bursts of activity, known as avalanches (Bak et al., 1987), can be informative about the global organization of the network (Sethna et al., 2001). For example, avalanche dynamics in the brain indicate that healthy neuronal networks are organized at a phase transition, called criticality, which is computationally favorable (Beggs and Plenz, 2003; Ponce-Alvarez et al., 2018). The avalanches framework is also relevant to seizure dynamics, which consist of slowly spreading wavefronts of bursting activity (Schevon et al., 2012; Trevelyan et al., 2006), from which fast, depolarizing potentials propagate outwards (Martinet et al., 2017; Smith et al., 2016). Interestingly, macroscopic seizure recordings suggest that coarse propagating events give rise to exponentially growing avalanches (Harris, 1963; Meisel et al., 2012; Arviv et al., 2016), fueling speculation that neuronal activity drives the network away from criticality. Although hypersynchronous burst firing in the ictal core resembles such avalanche expansion (Weiss et al., 2013), evidence for heterogeneous spatial recruitment (Muldoon et al., 2013; Lau et al., 2022) and asynchronous neuronal activity during seizures (Truccolo et al., 2011; Aeed et al., 2020), suggest a more complicated picture at the microscale. Therefore, it remains uncertain whether microscale avalanche behavior collectively drives network dynamics away from a phase transition during epileptic seizures.
Importantly, the proximity of networks to criticality can be used to infer emergent computational properties relevant to brain pathology (Hesse and Gross, 2014). In particular, systems at criticality can encode a diversity of inputs (Kinouchi and Copelli, 2006), flexibly explore many brain states, and reside between suboptimal regimes of chaos and order (Haldeman and Beggs, 2005). Therefore, a departure from criticality could explain emergent network dysfunction that occurs during seizures. For example, such a “supercritical” regime, could explain the stereotyped population dynamics of the seizure-onset zone (S. Liu et al., 2018), the reduced entropy of brain states (Ren et al., 2021) and the chaotic behavior (Babloyantz and Destexhe, 1986) that arises during seizures. In this way, a loss of criticality may provide a unifying mechanism through which microscale propagating activity drives emergent pathologic dynamics during seizures.
Here, we studied avalanche dynamics during seizures to investigate criticality and emergent computational properties in seizure networks. Importantly, micro and macroscale seizure recordings often show disparate dynamics, because of low spatial resolution of macroscale recordings (Meyer et al., 2018; Wenzel et al., 2019a), and the impact of subsampling neuronal activity at the microscale (Priesemann et al., 2009). To address these concerns, we take advantage of the transparency of larval zebrafish to perform in vivo functional imaging of the whole brain at single-cell resolution during seizures (Ahrens et al., 2013; Burrows et al., 2020; Hadjiabadi et al., 2021). We show that brain-wide, single neuron activity collectively drives macroscale dynamics away from criticality. We then use spiking network models to demonstrate that only densely connected networks can drive the network away from criticality during seizures. Importantly, such dense networks also disrupt the optimal computational capacities of critical networks, helping to explain functional impairments during seizures. This study bridges the gap between microscale neuronal activity and emergent macroscale dynamics and brain dysfunction during seizures.
Materials and Methods
Experimental models
In order to capture brain-wide seizure activity at cellular resolution, we took advantage of the optical transparency of the larval zebrafish. Transgenic zebrafish larvae, Tg(elavl3:H2B-GCaMP6s), expressing a nuclear-localized, genetically-encoded calcium sensor pan-neuronally, were used to capture neuronal dynamics (gift from Misha Ahrens, Janelia Research Campus; Freeman et al., 2014). To maximize optical transparency, Tg(elavl3:H2B-GCaMP6s) larvae were crossed with melanophore-deficient (−/−) roy;nacre mitfa mutants (Lister et al., 1999). Zebrafish larvae were raised at 28°C in Danieau solution on a day and night cycle of 12:12 h. All imaging experiments were performed at 6 days post-fertilization (dpf), using fish of either sex. This work was approved by the local Animal Care and Use Committee (Kings College London) and was conducted in accordance with the Animals (Experimental Procedures) Act, 1986, under license from the United Kingdom Home Office.
Two-photon calcium imaging
In order to record brain activity we performed two-photon calcium imaging of Tg(elavl3:H2B-GCaMP6s), (−/−) roy;nacre larval zebrafish. Nonanesthetized larvae at 6 dpf were immobilized in 2% low-melting point agarose (Sigma-Aldrich) and mounted dorsal side up on a raised glass platform that was placed in a custom-made Danieau-filled chamber. All imaging was performed on a custom built two-photon microscope (Independent NeuroScience Services; INSS), which utilizes a Mai Tai HP ultrafast Ti:Sapphire laser (Spectraphysics) tuned to 940 nm. Objective laser power was at 15 mW for all experiments. Emitted light was collected by a 16×, 0.8 NA water immersion objective (Nikon) and detected via a gallium arsenide phosphide detector (ThorLabs). Scanning was performed by a resonance scanner (x-axis) and galvo-mirror (y-axis), with a piezo lens holder (Physik Intrumente) adjusting the z-plane (Fig. 1A). Images were acquired at a resolution of 512 × 512 pixels, with a pixel size of 1.05 × 1.03 μm. Single planes were imaged at 30 Hz, with a pixel dwell time of 88 ns. Volumetric data were collected across 10 planes at 15-μm intervals, with a flyback time of 17 ms and actuator lag of 10 ms, resulting in a frame rate of 2.73 Hz per volume with 4914 volumes collected per imaging block (Fig. 1B); 15-μm intervals were chosen to minimize the possibility for double-identification of neurons across planes, as studies investigating cell body size in larval zebrafish suggest cell diameters smaller than 15 μm (J. C. Liao and Haehnel, 2012).
Figure 1.

Study design. A, In vivo two-photon imaging setup with head-fixed larval zebrafish. B, Imaging was captured across 10 planes with 15-μm spacing at an imaging rate of 2.73 Hz per volume. C, Max projection across two imaging planes of larval zebrafish volume taken with two-photon microscope, demonstrating coverage of major brain regions. D, Nuclear localized GCaMP fluorescence enables the segmentation of single neurons, as shown over exemplar forebrain (left), midbrain (top right) and hindbrain areas (bottom right) for a representative fish. The two images below the forebrain region show raw GCaMP signal (left) and segmented neurons (right) over a magnified area (scale bar is 10 μm). E, Single-cell traces shown from representative neurons for a single fish, showing normalized calcium fluorescence over time for spontaneous (black), 5 mm PTZ (orange), and 20 mm PTZ (red) conditions. A hidden Markov model (HMM) was used to infer spike times (black bars). F, The spatiotemporal propagation of activity through the network was quantified as avalanches, as shown for three example avalanches (colored by avalanche) for an example raster plot (top). Avalanche statistics were calculated to assess critical dynamics (bottom). G, A network model of the larval zebrafish brain was constructed, which was used to test the role of specific network mechanisms in driving empirical avalanche dynamics.
Seizure induction
To image seizure dynamics with the two-photon, we administered the GABAA antagonist pentylenetetrazole (PTZ) to larval zebrafish. PTZ elicits clonus-like convulsions and epileptiform discharges (Baraban et al., 2005), which are removed with conventional anti-seizure medication (Berghmans et al., 2007; Afrikanova et al., 2013). To capture baseline and seizure dynamics we recorded 3 × 30 min consecutive imaging blocks for each fish: (1) spontaneous activity representing normal dynamics (Movie 1), (2) 5 mm PTZ causing focal hyperexcitability (Movie 2), and (3) 20 mm PTZ causing highly synchronous, brain-wide hyperexcitability suggestive of generalized seizures (Movie 3; Fig. 1D). Here, we refer to generalized network activity as generalized seizures, but it is important to note that these dynamics are not necessarily clinically-defined generalized seizures. PTZ was added into the imaging chamber immediately after each session via a 1 ml dose of PTZ suspended in Danieau, after which point imaging was restarted. Data were collected and analyzed in 10 fish.
Spontaneous activity. GCaMP6s calcium imaging of a single plane from a representative period of spontaneous activity. Acquisition speed = 2.73 frames/s. Movie is played at 2× acquisition.
Brain activity following exposure to 5 mm PTZ. GCaMP6s calcium imaging of a single plane from a representative period of brain activity following administration of 5mM PTZ. Acquisition speed = 2.73 frames/s. Movie is played at 2× acquisition.
Brain activity following exposure to 20 mm PTZ. GCaMP6s calcium imaging of a single plane from a representative period of brain activity following administration of 20 mm PTZ. Acquisition speed = 2.73 frames/s. Movie is played at 2× acquisition.
Two-photon image processing
In order to derive single neuron activity from two-photon images, we performed quality control, registration, and segmentation steps. Registration and segmentation processing steps were performed across each plane separately. First, recordings were corrected for drift in x- and y-planes by using the rigid registration algorithm on suite2p (Pachitariu et al., 2017). Next, we applied the segmentation algorithm on suite2p, which identifies contiguous, correlated pixels enabling the identification of nuclear-localized GCaMP signals (Fig. 1D). We selected the diameter of nuclei for segmentation as 5 pixels, corresponding to ∼5 μm. Five pixels was chosen as it best matched the size of single nuclei in our observed imaging data. Importantly, 5 μm lies within the reported diameter of neuronal nuclei as reported in previous studies at similar ages in larval zebrafish (∼3–10 μm; Kim et al., 2014; Migault et al., 2018; Bruzzone et al., 2021).
We found that the segmentation process identified some false positive cells because of noise. To remove these noncells, a false-positive detection algorithm was designed which relies on the assumption that true cells would show fluorescence spikes with a slower decay time than shot noise events, because of the decay time of GCaMP6s. The false-positive detection algorithm works as follows: (1) split the trace for each cell into nine-frame windows, (2) find the minimum fluorescence value across each window, (3) find the single maximum value across all minimum window values for each cell. This process creates a distribution of max-of-min fluorescence window values (a measure of the fluorescence decay speed), for all segmented cells across the brain. A threshold was then chosen to remove noncells for each fish. This process enabled the accurate segmentation of ∼10,000 neurons per fish.
Calcium transient estimation
In order to estimate calcium events we applied a hidden Markov model (HMM) to single neuron fluorescence traces, using a method previously developed by our group (Diana et al., 2019). This method enables the robust estimation of the onset of calcium transients, and labels each time point for a given neuron as either on or off. The model requires the selection of the parameter q, defining the probability of an event occurring. This parameter's value was chosen by visual inspection of which q gave the most accurate representation of calcium traces in our data (q = 0.59; Fig. 1E).
Identification of seizure state transitions
To examine neuronal dynamics just before and right after seizure onset, we identified timepoints where seizure transitions occurred. To clearly delineate before and after seizure periods, we took advantage of the characteristic brain dynamics during 20 mm PTZ administration, where the brain abruptly transitions into a generalized seizure state (Diaz Verdugo et al., 2019). To define the transition time point for each fish, we moved a 30 frame sliding window over the mean activity across all neurons. By finding the window with the maximum difference between the starting time point and the subsequent 29 frames, we could identify the time window in which the greatest activity increase occurs (i.e., the generalized seizure transition). To compare dynamics across state transitions, we compared activity from 400 frames just before the generalized seizure (pre-ictal), the first 400 frames of the generalized seizure (ictal-onset) and 400 frames from a randomly selected segment of spontaneous recording (baseline).
Neuronal avalanche estimation
We were interested in describing the population dynamics of neuronal activity at the microscale. A key form of collective behavior in certain systems, is the propagation of activity through the network, often described as avalanches (Bak et al., 1987; Fig. 1F). Evidence from brain recordings suggest the presence of avalanches in brain activity, termed neuronal avalanches (Beggs and Plenz, 2003). Here, we apply the avalanches framework to study the propagation of brain activity under both physiological and pathologic (seizure) conditions. In order to capture avalanches we estimated the spatiotemporal propagation of activity through the network, using the binarized activity traces across all neurons. Given that the underlying synaptic connectivity in our network is unknown, we infer the flow of activity from an n by m matrix, where n represents each neuron and m is the on/off state at time point m. To do this we adapt methods used in previous studies to estimate avalanche size and duration (Tagliazucchi et al., 2012; Ponce-Alvarez et al., 2018).
First, we assume that neuron u can only activate other neurons in the population P that lie within a neighborhood Nu,v where v is the set of the closest k% of cells to u. This introduces a spatial constraint to avalanche propagation such that activity can only flow between putatively connected neurons, preventing disparate cascades combining into one large avalanche (Fig. 2). An avalanche begins when at least n cells within a neighborhood Nu,v are active at tx, that were not part of an avalanche in the previous timestep. Here, we label the neurons currently active at tx which belong to the avalanche as the set Ax = {a,b,c…z}. All active neurons of P at tx connected to any of Ax via a neighborhood are included into the set Ax.
Figure 2.

Avalanche estimation. A, Neurons exhibit on (red circles) and off (white circles) dynamics giving rise to ensembles that grow in space and time. B, Hidden Markov model estimation of calcium transients showing normalized traces (blue), and estimated calcium transients (red). C, Avalanche calculation legend. D, For avalanches to begin, at least three nodes within the same neighborhood must be active at t0. To propagate in time, any avalanche node active at t0 must also be active at t1. Once this step is satisfied, any nodes active at t1 that are connected via a neighborhood to avalanche nodes at t1 become avalanche members. Avalanches terminate when no more nodes are active. Avalanche size (s) is the total number of activations and duration (d) is the number of time steps of the avalanche.
At each subsequent step avalanche propagation iterates as follows (Fig. 2):
If at least one neuron that was part of avalanche Ax is also active at tx+1 then the avalanche continues in time, forming the set Ax+1 = {a,b,c…z}.
Any neurons from P active at tx+1 that are connected to any of Ax+1 via a neighborhood are included into the set Ax+1.
Once step 1 is no longer satisfied the avalanche terminates. Avalanches whose active neighborhoods converge are grouped into a single avalanche. Avalanche size was calculated as the total number of calcium events during the avalanche. Avalanche duration was the number of time steps for which the avalanche was active.
Our avalanche approach requires the selection of parameter k, defining the percentage of neighbors a neuron can connect to. Although the precise ratio of short to long range synaptic connections in the larval zebrafish is unknown, the few studies of structural connectivity in entire nervous systems have shown a strong preference for local connections (Cherniak, 1994; Ahn et al., 2006; B. L. Chen et al., 2006). Importantly, local connectivity preferences can give rise to the strong local correlations (Betzel, 2020), and the shared tuning properties of local neuronal ensembles (Romano et al., 2015), that are found in the larval zebrafish around 5–8 dpf. While this does not preclude the known presence of long range connections in the brain (Kunst et al., 2019), here we chose to focus on local connections to provide the simplest model of propagation which could reasonably describe observed network dynamics while relying on the most probable neuron-to-neuron connections. This approach is the basis for the results demonstrated in Fig. 3. However, to demonstrate the robustness of our avalanche dynamics to the presence of short versus long-range connections, we studied the effect of varying k on spontaneous avalanche dynamics. While changing k (0.04–3%; ∼10–50 μm) altered avalanche dynamics (Fig. 4B,C), key markers of criticality (power laws and relationships between avalanche size and duration exponents) were partially conserved across k, power laws were present across all k values (Fig. 4A), while critical exponent relations were maintained for neighborhoods <30 μm (Fig. 4D). This suggests that key critical statistics are partially robust to the specific parameterization of k in our avalanche algorithm. That critical exponent relations are lost for large neighborhoods indicates that network with dense, local and medium-range connections fail to give rise to critical avalanche dynamics, as reported in previous studies (Ponce-Alvarez et al., 2018). For further analyses, k was selected (0.16%) so that the mean neighborhood radius was predominantly local (20.4 ± 0.98 μm), and lay within ranges used in previous studies (<30 μm).
Figure 3.

Whole-brain spontaneous neuronal activity exhibits critical statistics. A, Empirical distributions for avalanche size (S) with dotted line showing power law exponent τ, and corresponding log likelihood ratio tests for power law versus lognormal distributions (right). Data points are colored by fish. Avalanche schematic demonstrating the calculation of avalanche size s (top) for a single avalanche event, where colored dots represent active neurons at tx. B, Same as in A, for avalanche duration (T) with exponent α. C, The scaling relationship between S and T is shown by plotting mean S against T and fitting a linear regression line to estimate the exponent γ (dotted line). The exponent relation (α − 1)/(τ − 1) is calculated using avalanche exponents for S and T. DCC is calculated as the absolute difference between γ and (α − 1)/(τ − 1). D, DCCs plotted for each fish against each null model (dotted line = critical threshold of DCC < 0.2). E, Branching ratio σ plotted for each fish against each null model (dotted line = critical value of σ ∼ 1). Avalanche schematic demonstrating calculation of σ (right). F, The quantity r(d), which estimates pairwise neuronal correlation as a function of distance, follows an approximate power-law with exponent η (dotted-line). Schematic demonstrating estimation of correlation (r) as a function of distance (d; right). Magenta neuron is the neuron of interest. Other neurons are colored by their correlation r to magenta neuron. *p < 0.01.
Figure 4.

Effect of avalanche parameters on critical statistics. A–D, Criticality statistics in spontaneous activity for increasing avalanche neighborhood size k, over smaller (left, k = 0.04–0.23%; 10–19 μm) and larger ranges (right, k = 0.5–3.0%; 23–50 μm). E–H, Criticality statistics in spontaneous activity for different minimum avalanche initiation sizes, from 2 to 4.
Our avalanche approach also requires the selection of parameter n, which defines the minimum number of active neurons required to initiate an avalanche. We explored the effect of changing n on avalanche statistics in spontaneous activity (n = 2, 3, 4). While changing n did slightly alter avalanche dynamics (Fig. 4F,G), avalanche power law relationships and critical exponent relationships were conserved across all parameter values (Fig. 4E,H). This indicates that critical statistics in spontaneous activity are not biased by the specific parameterization of n in our avalanche algorithm. For all remaining analyses we set the minimum avalanche initiation size to 3, as used in previous studies.
We note that because of the relatively slow decay time of GCaMP6s (550-ms decay half-life), our imaging rate (2.73 Hz) is sufficient to capture action potential-induced calcium transients in sampled neurons (T. W. Chen et al., 2013). However, our imaging rate is too slow to resolve the exact number of spikes giving rise to a calcium transient in each timestep. Instead, neuronal activity can be classified into on/off periods. Furthermore, the typical synaptic delay times (∼1 ms) are too fast for our imaging setup to resolve the exact sequence of spiking events in the network (Barnes et al., 2015). Nonetheless, because of the slow GCaMP6s decay times all events within a sequence should be detected, but grouped into ∼360-ms bins. Therefore, our avalanche approach captures the propagation of activity through the network in a temporally downsampled manner, based on the presence or absence of calcium transients at a given time step.
Avalanche power law estimation
We were interested in using the avalanches framework to infer the proximity of the network to a phase transition, known as criticality. Specifically, criticality occurs when a system is poised at a second order phase transition, between distinct macroscopic regimes of order and disorder (Cocchi et al., 2017). To test for the presence of criticality in avalanche dynamics, we took advantage of the fact that avalanches at criticality are scale-invariant. This means that only at criticality can avalanches span all scales, from small to large, which gives rise to power law distributions of avalanche size and duration (Hesse and Gross, 2014). Specifically, critical systems should exhibit power laws for avalanche size S and duration T with the following form:
| (1) |
| (2) |
Therefore, we tested for the presence of power law distributions in neuronal avalanches. To statistically evaluate the presence of power law distributions, we used an importance sampling approach to compare the likelihood of our data being generated by a power-law compared with a log normal distribution, an alternative heavy tailed distribution conventionally used as an alternative hypothesis (Alstott et al., 2014). For a given power law exponent λ, the likelihood is given by
| (3) |
with observed avalanche sizes or durations defined from s1, s2, s3…sM. z(λ) is the normalization constant which is defined as
| (4) |
where a and b are the minimum and maximum avalanche values used as the power law cutoffs (avalanche size: a = 3, b = maximum observed value, duration: a = 2, b = maximum observed value). The log likelihood (log L) is then defined as
| (5) |
Log likelihoods were calculated across a range of sampled λ values, which were weighted by the log probability of observing λi from the prior and proposal distributions. To be precise, the weight wi for exponent λi is given by
| (6) |
Marginal likelihoods (ML) were then estimated as the empirical means of all the weights
| (7) |
Finally, the likelihood ratio (LR) was calculated as the ML of a power law minus the ML of a lognormal distribution, with positive values indicating more evidence for a power law distribution. Avalanche power law exponents were estimated as the maximum likelihood of λ given the data.
Avalanche exponent relations
It is important to note that the presence of power laws alone is insufficient evidence of criticality, as they can arise from noncritical and random mechanisms (Miller, 1957; Stumpf and Porter, 2012; Touboul and Destexhe, 2017). An alternative criterion which may more robustly assess neuronal criticality is the relationship between avalanche exponents α and τ (Sethna et al., 2001; Friedman et al., 2012). At criticality, if Equations 1 and 2 hold, there should be a scaling relation between avalanche size S and duration T, as
| (8) |
This relationship exists because critical systems are self-similar, so a single exponent γ can predict the relationship between S and T across all scales of space and time. At criticality the scaling exponent γ is a function of avalanche exponents α and τ, defined as
| (9) |
Importantly, this exponent relationship can separate out critical from noncritical systems which generate power law distributions (Touboul and Destexhe, 2017; Fontenele et al., 2019). However, one should note that even exponent relationships can emerge in random systems (Destexhe and Touboul, 2021). Nonetheless, exponent relations offer an adjunct test for criticality alongside the presence of power laws. To test for critical exponent relationships in avalanche data, we use the previously developed deviation from criticality coefficient (DCC; Ma et al., 2019). DCC is defined as the absolute difference between empirically derived γ, using the slope of〈S〉(T), and the predicted γ, calculated from the equation (α − 1)/(τ − 1). The slope of〈S〉(T) was estimated by plotting the mean size <S> against duration T and fitting exponents via linear regression.
Branching parameter
To further test for the presence of criticality in our empirical data, we used a metric known as the branching parameter. A branching process describes how an ancestor element can generate descendant elements (Harris, 1963), e.g., an active neuron activating other neurons. The branching parameter σ captures the expected number of offspring elements from a given ancestor (Corral and Font-Clos, 2012). Interestingly, branching processes undergo a phase transition when σ = 1, at which point avalanches can span all scales. Evidence from brain recordings suggest that σ is close to 1 in critical networks (Beggs and Plenz, 2003). σ was estimated as the mean ratio of descendants to ancestors at each time step over all avalanches defined as
| (10) |
where t is the number of avalanche propagation timesteps over all avalanches.
Correlation functions
Long range correlations are another key hallmark of critical systems. For example, in lattice-like systems the correlation length is maximal at criticality, although this is not necessarily the case in systems with long range structural connections. The presence of long-range correlations between distant brain areas can give rise to power law scaling of correlation as a function of distance in resting-state activity (Expert et al., 2011; Ponce-Alvarez et al., 2018; Lombardi et al., 2021). Therefore, to further test for criticality we assessed correlation function power law relationships. Specifically, we define the correlation function
| (11) |
which defines the relationship between the correlation between two time series r and the distance between the sources of those time series d, where η captures the slope of the power law relationship. r was assessed as the Pearson's correlation coefficient between neuron time series', while d was the Euclidean distance in space. To assess the function r(d), neuron-neuron paired distances were placed in 200 bins, equally spaced across the range of neuron-neuron distances of all neurons in the brain. r(d) was estimated as the mean correlation within each bin. Given that these relationships are not distributions, we cannot perform the likelihood ratio tests described above. Therefore, to assess closeness of fit to power laws we calculated the Euclidean distance between a power law fitted by linear regression and the empirical function.
Null models for critical statistics
In order to confirm that the observed critical statistics emerge from the spatial and temporal structure of empirical neuronal activity and would not emerge from random signals, we applied a series of null models to our data. The first null model is the spatial null, which tests the hypothesis that critical avalanche dynamics emerge from local neighborhoods of putatively connected neurons. It was generated by randomly shuffling the locations of neurons such that a neurons' neighborhood would consist of neurons scattered across the brain rather than nearby neurons. The second null model is the correlation null, which tests the hypothesis that critical avalanche dynamics are generated by the correlation structure of neural activity. It was generated by circularly permuting the time series independently for each neuron, such that the correlation across neurons was lost. The third null model is the autocorrelation null, which tests the hypothesis that avalanche dynamics are generated by the integration of activity over time within neurons, rather than from shot noise events. It was generated by randomly shuffling the binarized activity of all neurons in a dependent fashion, such that autocorrelation was lost but the cell-cell correlation retained. To compare critical statistics from empirical and null data, 50 nulls were randomly generated for each fish and for each null type, with avalanches and critical statistics calculated as above.
Network model dynamics and architecture
To probe the microscale changes driving whole-brain avalanche dynamics in seizures, we modeled the brain as a network of spiking neurons (Fig. 1G). We considered a network of leaky integrate-and-fire neurons with N excitatory neurons (N = 8990), and E external excitatory inputs (E = 1000) onto each neuron. The membrane voltage for neuron i is defined at subthreshold voltages by the differential equation
| (12) |
where Vi is the membrane voltage, τm is the membrane time constant (τm = 20), Vr is the resting membrane potential (Vr = 0), Rm is the resistance, and Ii is the input current. For voltages beyond the voltage threshold Vth the neuron fires a spike, at which point Vi is reset to Vr.
The input to neuron i at time t is defined by
| (13) |
The first term describes the input from other neurons in the network, where Jij is the weighted, directed adjacency matrix, between the presynaptic neuron i and postsynaptic neuron j. A spike from neuron j will affect neuron i after a synaptic delay τd = 1, through Dirac's δ function. The second term describes the input from the external current, where U is the weighted adjacency matrix between the presynaptic neuron i and the external neuron e. External input spikes are modeled as a Poisson point process with rate λ = 10 Hz. Uie for all connections were set to 0.1.
To accurately model the larval zebrafish brain structure, we embedded our model network in a three-dimensional brain space that recapitulated the structural boundaries, anatomically-defined neuron densities, and the neuron-neuron distance distributions found in the larval zebrafish brain. Specifically, we registered all neuron coordinates across all brains (10 fish, three conditions) to a standard space (Tabor et al., 2019). Next, we performed k-means clustering on the spatial locations of all neurons (k = 8990, the mean number of cells across all datasets), with resulting cluster centroids used as network node locations. This enabled the construction of an “average” larval zebrafish brain, which respected the structural boundaries and the spatial neuronal distributions of the brain, at the scale of empirical recordings. To connect neurons in the network we chose to model the connectivity in a scale-invariant network. Network connectivity was defined by the growth and preferential-attachment algorithm (Barabasi and Albert, 1999), that has been extended to brain networks (Eguíluz et al., 2005).
Network model fitting
Having defined the network model, we wanted to probe the specific neuronal parameter changes that drive seizure activity. We defined three variable parameters in the neuronal network (Fig. 1G): (1) network connectivity, the number of connections between neurons defined by parameter m; (2) synaptic weights, the strength of synapses between neurons defined by parameter r; and (3) intrinsic excitability, the propensity of individual neurons to spike defined by parameter Vth.
Network connectivity was varied by altering m in the growth and preferential-attachment algorithm, thus changing the number of binary edges between neurons. Synaptic weights defines the distributions of edge weights across the network. To define this, we took into account the metabolic constraints imposed on the formation of synapses over long distances (Ahn et al., 2006), we modeled synaptic weights throughout the network as an exponentially decaying function showing reduced weights as distance increases. To vary synaptic weights smoothly we created a weight function w(d) which defines synaptic weights as a function of distance, where w(d) is defined
| (14) |
where i is the initial nonscaled synaptic weight (i = 1.2), s is the softening parameter that dictates the magnitude of exponential decay for the synaptic weight over distance (s = 0.1), d is the neuron-neuron distance and r defines the strength of the synaptic weights across the network (weak = low r, strong = high r). This allowed the smooth variation of the weight-distance relationship across all neurons, from a regime in which synaptic weights were weak for most neuron pairs (except neighboring ones), to one in which synaptic weights were strong across all neuron pairs. Finally, intrinsic excitability was varied by changing the spike threshold for each neuron in the leaky-integrate-and-fire model. Using different combinations of these three parameters, we could generate model network dynamics for model fitting.
We simulated network dynamics for 4000 time steps. Spiking activity was binned into 10 timestep windows for avalanche estimation. Model avalanche distributions were fit to empirical data generated from concatenated avalanche size distributions from spontaneous, pre-ictal, and ictal-onset datasets (n = 9, 400 frames per dataset). Avalanche simulations were run nine times, and concatenated together to generate fits to empirical data.
In order to assess the closeness of fit between model and empirical data, we designed a cost function which quantified the distance between empirical and model avalanche distributions. We adapted the mean squared error function with a regularization term, to account for short-tailed distributions that match the candidate distribution over short-medium avalanche sizes, but have empty bins over the longer tail of the distribution. This cost function was defined as
| (15) |
where yi = P(S) for each avalanche bin, n is the number of avalanche distribution bins, k is the number of parameters, β is the difference in nonempty bin numbers between model and empirical data, and α scales the effect of the regularization (α = 0.09). This allowed us to identify the network parameters that most faithfully produced empirically observed avalanche distributions.
Network model response properties
Certain network response properties are optimal at criticality. In particular, in vitro and in silico studies have shown that (1) the network-mediated separation (NMS), a network's ability to discriminate between inputs (Bertschinger and Natschläger, 2004); and (2) the dynamic range (δ), a network's ability to represent a wide range of inputs (Shew et al., 2009), should be optimized at the critical point. In order to assess the effect of seizure dynamics on critical network response properties, we quantified NMS and δ in network models.
To calculate NMS we provided pairs of inputs, a and b separated by distance z onto different network models. For each input, x nodes were randomly activated once the network had reached steady state at time t (4000 time steps). Here, network activity was binned into 10 time step windows to approximate network outputs. To distinguish between the separation of network activity because of the input responses, as opposed to the intrinsic variability in the network, we define the normalized NMS property as
| (16) |
where ‖ ‖ denotes the Euclidean distance. na and n are the binarized state vectors at time t, for identical instantiations of a network that received input a or received no input, respectively. mb and m are the binarized state vectors at time t, for identical instantiations of a network that received input b or received no input, respectively. This enabled the normalization of the distance between two network states following similar inputs a and b, to the exact distance between those two states as expected in nonperturbed networks.
We estimated δ by adapting previous measures (Shew et al., 2009). Here, we provided input to the network by randomly activating x neurons across a range of input sizes (x range = 5–500, stepsize = 10), once the network had reached steady state (4000 time steps). As above, network activity was binned into 10 time step windows to estimate the network response. In order to separate out the network response to a given input from the ongoing network activity, the corresponding output size was calculated as
| (17) |
where na and n are binarized state vectors for identical instantiations of a network that received input a or did not receive input at time t, respectively. This enabled the separation of active neurons because of the input from active neurons because of the ongoing activity in the network. δ is then defined across the range of input sizes as
| (18) |
where Smax and Smin are the input sizes leading to 90th and 10th percentiles over the range of output sizes, respectively.
Stability of network dynamics
Another key property of some critical networks, is that the dynamics are neutral, residing between stability and chaos (Haldeman and Beggs, 2005). This means that points in state space maintain their distance over time, a property that is linked to minimal information loss. In order to test whether epileptic seizures disrupt the neutral dynamics expected in critical systems, we calculated the stability of brain dynamics in empirical and model data.
To do this, we approximate the largest Lyapunov exponent (λ), which estimates the divergence of nearby trajectories in phase space. One way to do this is to reconstruct the full dynamical system, here, we use Takens' theorem which states that a reconstructed attractor constructed from a variable Y0, given by {Y0(t), Y0(t − τ), …, Y0(t − (E − 1)τ)}, is topologically equivalent to the original dynamical system {Y0(t), Y1(t), …, YE-1(t)}, where E is the dimension of the system and τ is the time lag (Takens, 1981). We use the first principal component of the data matrix to reconstruct the attractor for each dataset. The embedding dimension E was estimated using the false nearest neighbors approach (Kennel et al., 1992). To estimate τ, one usually finds the τ that minimizes the mutual information between time series. However, given the slow sampling rate of our recordings relative to the kinetics of GCaMP6s, we opted to use τ = 1.
To estimate λ from reconstructed attractors, we firstly locate the nearest neighbor for each point expressed as
| (19) |
where di(0) is the initial distance between Xi and its nearest neighbor Xj. From this we calculate the change in distance over time for all nearest neighbors along the attractor which for each t is
| (20) |
where di(t) is the distance between Xi and Xj at t, and M is the number of points on the reconstructed manifold (Rosenstein et al., 1993; Sato et al., 1987). The largest Lyapunov exponent is thus the mean separation rate for nearest neighbor points over a given time period.
To estimate stability in our network model, we take advantage of the fact that we have full control of the network. Therefore λ can be calculated by perturbing the network and following trajectories over time. We apply small perturbations to the network model once it has reached steady state (4000 time steps), and follow the trajectories over time, where λ is
| (21) |
Metastable state estimation
Another key property of critical networks is that the number of states the system can enter into is maximal (Haldeman and Beggs, 2005). In order to assess the effect of seizures on brain state number, we adapt methods developed by Haldeman & Beggs to calculate metastable states. They define a metastable state as a set of state vectors that are more similar to one another than expected in a random system. To identify metastable states in empirical data, we clustered all state vectors together for a given fish using affinity propagation, which does not require cluster number to be defined a priori (Frey and Dueck, 2007). Any clusters for which the number of state vectors belonging to that cluster was equal to 1 were removed. To calculate the similarity between state vectors that belong to a cluster, we define
| (22) |
where Ω is a state vector and <, > denotes the dot product. For clusters to be identified as metastable, they needed to show greater similarity than expected by chance. We estimated the chance level similarity by performing affinity propagation clustering and similarity calculation on a null network using event-count matched shuffling. Any cluster with higher average similarity than the null network was declared a metastable state.
Eigenspectrum analysis
In order to test the effect of epileptic seizures on correlations across many neurons, we take advantage of the eigenspectrum function, which captures the variance of the nth principal component. Eigenspectra were calculated by performing principal components analysis (PCA) on covariance matrices generated from neuronal activity data. PCA was performed on raw fluorescence traces – here, we reasoned that some of the intrinsic variation in calcium signal might be missed using conventional spike deconvolution methods, which can introduce artefacts (Theis et al., 2016). Therefore, to minimize the risk of artefacts, we performed PCA and eigenspectra analyses using raw fluorescence traces.
The eigenspectrum slope ϕ dictates the degree of variance captured by early versus late components, with a high slope indicating that the variance is dominated by early components. If one large, highly correlated subnetwork dominates the dynamics then the point cloud in state space would fall nearly onto a line – only a few components would be needed to capture the variance of the data. Therefore, high multidimensional correlation would cause a steep eigenspectrum slope, as such we use the eigenspectrum slope as a readout of multidimensional correlation.
In order to simulate eigenspectra we use a one-dimensional model introduced by Stringer et al. (2019). We define a function f(x) which describes the variance of n components across x samples as
| (23) |
which gives rise to covariance eigenvalues that follow n-ϕ. The quantity n was uniformly distributed between 0 and 2π. Changing ϕ changes the degree of variance captured by earlier versus later components, and thus alters the slope of the eigenspectrum.
EEG avalanche estimation
In order to test whether avalanche dynamics during seizures are conserved across spatial scales, we also calculated avalanche statistics using EEG recordings from human patients. Anonymized intracranial EEG recordings from stereotactically implanted EEG electrodes were selected from the clinical database at Great Ormond Street Hospital. Patients underwent EEG recording for presurgical evaluation of a pharmacoresistant focal epilepsy of presumed focal onset with or without visible lesion on clinical MR imaging. Ethical approval for the use of anonymized data were granted by the United Kingdom Health Regulatory Authority (IRAS 229772) and the Joint Research Office at the UCL-Great Ormond Street Institute of Child Health (Project ID 17NP05). 30 patients were selected based on the availability of at least three seizures during the EEG recording; as well as artifact-free baseline segments of corresponding duration that were >60 min away from ictal recordings. For each patient, data of 3 × 30-s windows of baseline awake EEG activity, and three clinically identified seizures were selected for analysis. Clinical EEG data were recorded at a sampling frequency of 1024 Hz. Raw EEG data were re-referenced to an average reference, and filtered to a 1- to 250-Hz broad frequency spectrum using a finite impulse response filter using the window method with a Hamming filter window in the MNE (MEG and EEG analysis and visualization) toolbox in Python (Gramfort et al., 2013).
The signal from each EEG channel was z-scored against the baseline recording of that channel, by subtracting the baseline mean and dividing it by the baseline standard deviation. Data were then binarized by identifying peaks that exceed a peak amplitude threshold parameter p (Arviv et al., 2016). Individual peaks across channels were grouped into a single avalanche if they occurred within a short time window Δt. Thus, neuronal avalanches in EEG data were defined as sequences of spatially distributed peaks of oscillatory activity.
Statistical analysis and software
D'Agostino's K2 test was used to test for normality in data distributions (α = 0.05). Paired t tests or Wilcoxon signed-rank tests were used to compare spontaneous, focal ictal, generalized ictal, state transition data, and human EEG datasets in cases of normality, and non-normality, respectively (α = 0.05). Independent t tests or Mann–Whitney U tests were used to compare different network models in cases of normality, and non-normality, respectively (α = 0.05). Bonferroni corrections were used to control for false positives because of multiple comparisons.
To compare network response properties across different models we generated 50 simulations for each parameterized model, comparing the means of each simulation across model conditions. To calculate the effect of changing the network topology parameter m on network response properties, we parameterized the network to pre-ictal levels before increasing m in steps to the levels of the network connectivity model, while keeping other parameters fixed. We performed 50 simulations for each m. We calculated the correlation between m and network response properties using Pearson's correlation coefficient.
Data were analyzed using custom code written in Python. Image registration and cell segmentation was performed using suite2p (Pachitariu et al., 2017). Neural network simulations were run using Brian2 (Stimberg et al., 2019). Statistical hypothesis tests were performed using scipy. Graphs were generated using matplotlib and seaborn.
Resource accessibility
Details of key reagents and resources are included in Table 1. Datasets may be downloaded from the Open Science Framework at https://osf.io/em7f2/. Further information, requests for resources and datasets should be directed to the corresponding author.
Table 1.
Key resources table
| Regent or resource | Source | Identifier |
|---|---|---|
| Tg(elavl3:H2B-GCaMP6s) | Freeman et al. (2014) | ZDB-TGCONSTRCT-141023–1 |
| Scanimage Software, Vidrio Technologies (image acquisition) | This paper | https://docs.scanimage.org/ |
| Suite2p (image registration and segmentation) | Pachitariu et al. (2017) | https://github.com/MouseLand/suite2p |
| Hidden Markov model (calcium transient estimation) | Diana et al. (2019) | https://github.com/giovannidiana |
| Brian2 (Python network modeling software) | Stimberg et al. (2019) | https://github.com/brian-team/brian2 |
Code accessibility
Custom written python code can be accessed at: https://github.com/dmnburrows/criticality; https://github.com/dmnburrows/avalanche_model; https://github.com/dmnburrows/seizure_dynamics; https://github.com/dmnburrows/img_process.
Results
In this study, we recorded single neuron activity brain-wide, to measure critical dynamics during epileptic seizures. We performed two-photon imaging of head-fixed larval zebrafish across 10 planes (Fig. 1A,B), using GCaMP6s expressed only in the nucleus, which enables the segmentation of ∼10,000 neurons per animal (Fig. 1C). To image seizure dynamics we administered 5 mm PTZ causing focal hyperexcitability (Movie 2), followed by 20 mm PTZ causing generalized hyperexcitability (Movie 3; Fig. 1E). The on/off states of each neuron were then estimated using a hidden Markov model (HMM; Diana et al., 2019; Fig. 1E). From these data we were able to calculate the spatiotemporal propagation of activity through the network (see Materials and Methods; Fig. 1F), known as neuronal avalanches (Beggs and Plenz, 2003). Importantly, certain features of avalanche dynamics are found in systems at criticality. We use these features to ask whether neuronal avalanche dynamics across the whole brain deviate from criticality during seizures.
Spontaneous brain-wide neuronal activity exhibits critical statistics
Several statistical features have been reported as indicators of criticality, including (1) power law distributions of avalanche size and duration, (2) relations between avalanche power law exponents, (3) branching ratios close to unity, and (4) power law scaling of neuron correlation and distance. We first evaluate each of these features to validate the presence of critical dynamics in brain-wide networks at single cell resolution during spontaneous activity.
A key feature of criticality is the presence of scale-invariant avalanche dynamics, these describe the spatiotemporal propagation of activity through the network (Fig. 2). At criticality avalanches span all scales, from small to large, which gives rise to scale-invariant power law distributions of avalanche size and duration (Sethna et al., 2001; Hesse and Gross, 2014). To calculate avalanche dynamics, we adapted an algorithm used in previous studies to single neuron data (see Materials and Methods; Ponce-Alvarez et al., 2018). We estimated empirical distributions for avalanche size and duration from spontaneous activity, which were well fit by power laws (Fig. 3A,B). Using log likelihood ratio testing, we found that all datasets were better explained by power law than lognormal distributions, the most rigorous alternative heavy-tail distribution test (see Materials and Methods; Fig. 3A,B). Importantly, we found that the presence of power law relationships was robust to avalanche estimation parameters. Specifically, we varied the neighborhood radius (from 10 to 50 μm), which defines the radius of neighbors that a given neuron can send outputs to, and the number active neurons required for avalanche initiation (from 2 to 4; see Materials and Methods). Avalanche distributions were power laws across all sampled parameter values (Fig. 4A,E), suggesting that the presence of power laws in avalanche distributions is a feature of the underlying data, rather than an artifact of the avalanche estimation algorithm. This indicates that avalanche dynamics in spontaneous activity are scale invariant, as expected at criticality.
However, power laws can also emerge in noncritical systems. An adjunct test for criticality is the relationship between the power law exponents for avalanche size (τ) and duration (α; Sethna et al., 2001; Friedman et al., 2012). At criticality, avalanche size S should scale as a power of avalanche duration T, this scaling exponent γ should follow the form (α − 1)/(τ − 1) (see Materials and Methods). We use the deviation from criticality coefficient (DCC; see Materials and Methods) to assess exponent relation, which compares the exponent γ of the function 〈S〉(T) with the exponent relation (α − 1)/(τ − 1) (Fig. 3C; Ma et al., 2019). Our data show close agreement between the slope γ and (α−1)/(τ−1), suggesting the presence of near-critical dynamics (DCC = 0.13 ± 0.04; Fig. 3D). To understand whether such relationships could have been generated by a random system, we created three null models: spatial, correlation, and autocorrelation nulls (see Materials and Methods). With these models we were able to assess whether randomly generated neuronal activity, resulting from shuffling spatial structure, cell-cell correlation and autocorrelation, respectively, would also generate critical DCCs. Importantly, exponent relation was significantly less well preserved in spatial nulls (DCC = 0.31 ± 0.02, t = −4.80, p < 0.001) compared with empirical data, but not correlation (DCC = 0.15 ± 0.04, t = −0.48, p = 0.64) and autocorrelation (DCC = 0.21 ± 0.05, t = −1.60, p = 0.15) nulls (see Fig. 3D). This suggests that empirically observed critical exponent relations emerge because of the spatial structure of neural dynamics, rather than from random activity. This provides further evidence for critical statistics in brain-wide cellular resolution network dynamics at rest.
Another hallmark of critical systems is a branching parameter (σ) close to 1 (see Materials and Methods). The branching parameter describes the expected number of offsprings that an ancestor produces, and when σ ∼ 1, the system undergoes a phase transition and avalanches can span all scales (Corral and Font-Clos, 2012). We calculate σ by estimating the mean ratio of descendants to ancestors in spontaneous data (see Materials and Methods), and find σ slightly below 1 in spontaneous activity (σ = 0.93 ± 0.03; Fig. 3E). Values of σ slightly below 1 suggest the presence of a slightly subcritical state (Priesemann et al., 2014); however, σ is likely to be underestimated in finite networks because of the convergence of activity onto shared descendants (Zierenberg et al., 2020). We complement our approach with an alternative method which uses multiple-regression and is robust to subsampling to confirm σ values (Wilting and Priesemann, 2018; Spitzner et al., 2021). Using this approach we find σ even closer to 1 (σ = 0.97 ± 0.00), providing further evidence for near-critical dynamics in spontaneous activity. Importantly, using our method, we find that empirical σ is significantly closer to unity than spatial (σ = 0.77 ± 0.03, t = 21.8, p < 0.0001), and correlation (σ = 0.92 ± 0.03, t = 4.45, p < 0.01), but not autocorrelation nulls (σ = 0.93 ± 0.03, t = −0.28, p = 0.79; Fig. 3E). This suggests that σ near to 1 in our data are a feature of the underlying spatial structure and correlation in neural activity, suggesting near-critical dynamics in our spontaneous activity data.
Long-range correlations between neuronal signals are another hallmark of critical systems. Such long-range correlations can give rise to a power law relationship between distance and correlation in spontaneous activity at criticality (Expert et al., 2011; Lombardi et al., 2021). To assess the presence of correlation-distance power laws, we calculated the correlation function r(d) as the Pearson's correlation between the activity of neuron pairs as a function of their distance (see Materials and Methods; Fig. 3F). Interestingly, we found that r(d) qualitatively follows a power law which is well approximated by linear regression fit (Fig. 3F). This suggests the presence of both short and long-range correlations which can support avalanches spanning the full spatial scale of the system.
Taken together we find that spontaneous neuronal dynamics exhibit (1) power law relationships of neuronal avalanches, (2) exponent relations close to critical values, (3) branching ratios close to 1, and (4) power law scaling of neuron correlation and distance. These findings provide evidence that microscale collective behavior is organized near to criticality in whole-brain networks.
Brain-wide neuronal activity deviates from criticality during seizures
In a next step, we investigated whether whole-brain networks at the microscale deviate from criticality during epileptic seizures. To this end, we compared critical statistics in spontaneous activity with focal (5 mm PTZ) and generalized seizure (20 mm PTZ) dynamics.
We first compared avalanche exponents, estimated from the full range of observed avalanche sizes and durations (see Materials and Methods), to determine whether seizures alter avalanche dynamics. Interestingly, avalanche exponents for both size and duration significantly decreased, in the 5 mm (Size: τ = 2.65 ± 0.10, w = 0, p < 0.01; Duration: α = 3.34 ± 0.12, w = 2.0, p < 0.01) and 20 mm conditions (Size: τ = 2.56 ± 0.05, t = 4.59, p < 0.01; Duration: α = 3.30 ± 0.11, t = 4.06, p < 0.01) when compared with spontaneous activity (Size: τ = 2.98 ± 0.13; Duration: α = 3.58 ± 0.14; Fig. 5A,B). This manifested as a less steep slope during focal and generalized seizures, indicating a higher probability of larger and longer avalanches. Furthermore, the 20 mm PTZ condition caused a bump in the heavy tail of the distribution (Fig. 5A,B), suggesting the emergence of characteristic scale because of the occurrence of unusually common, excessively large and long avalanches, which is expected in “supercritical” systems driven away from criticality (Beggs and Plenz, 2003).
Figure 5.
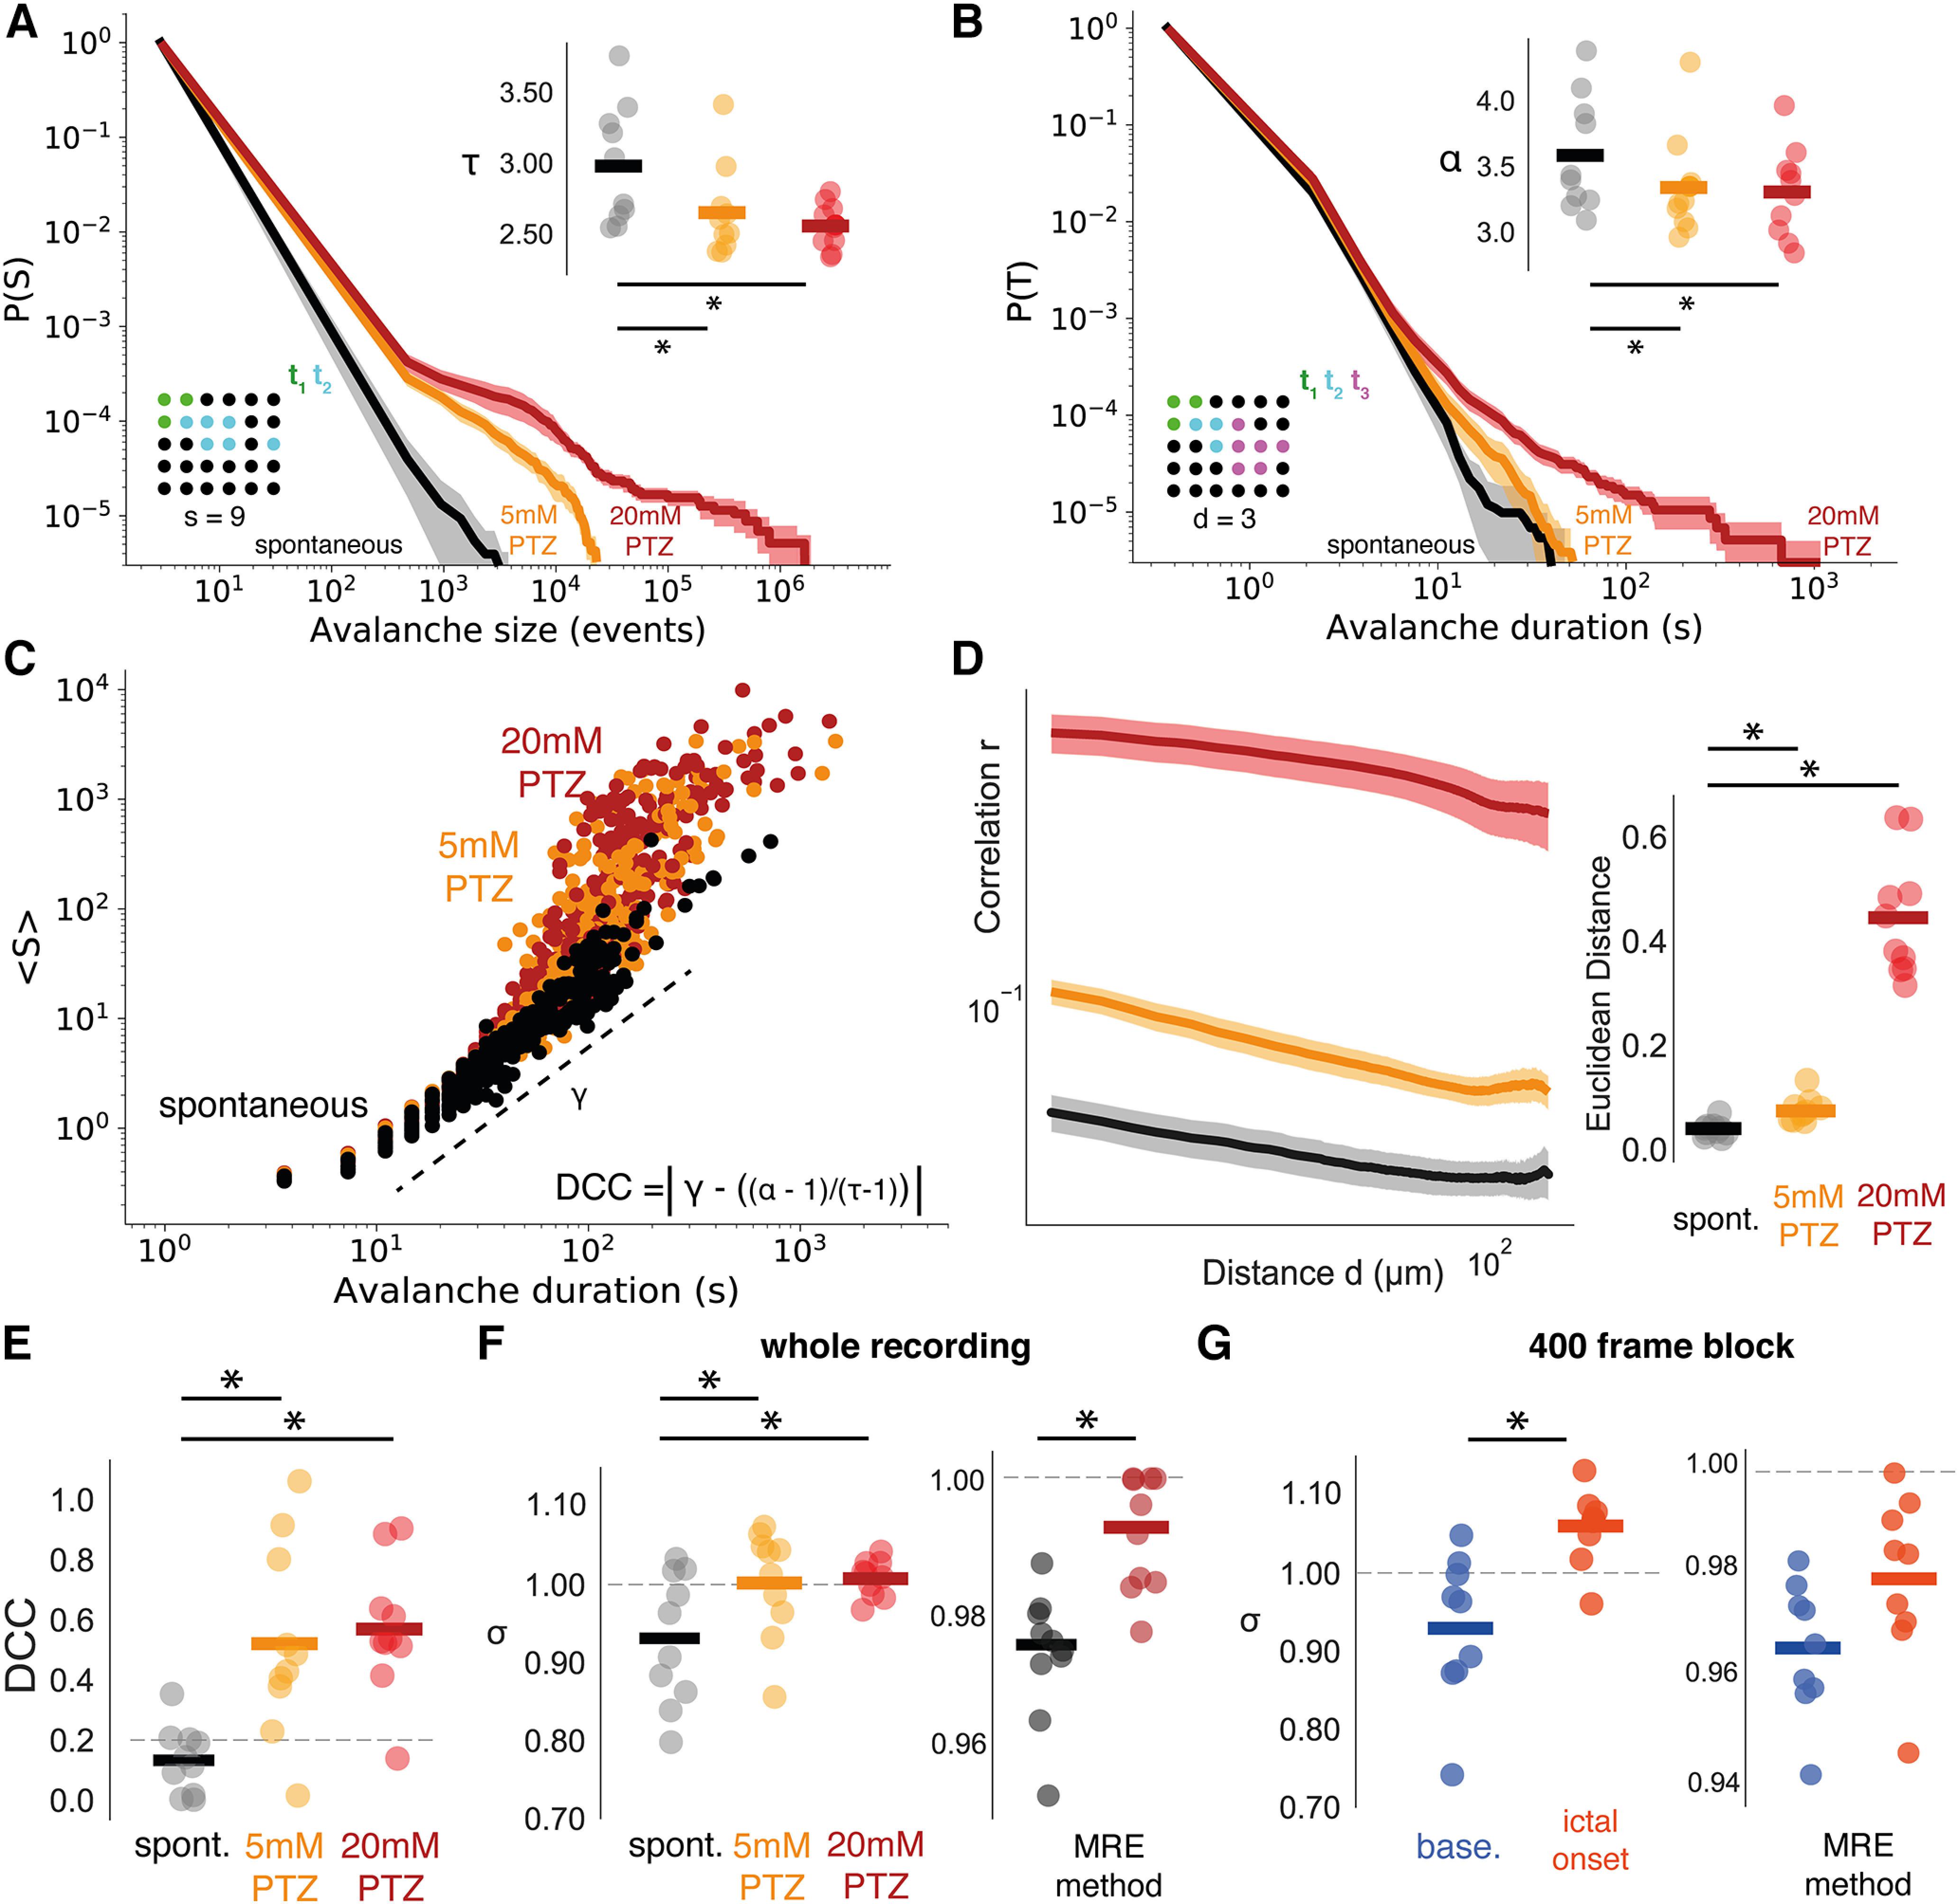
Seizures cause a loss of whole-brain critical statistics. A, Complementary cumulative distributions for avalanche size (S), showing mean distributions across conditions (shaded regions represent the standard error), with power law exponents τ compared (top right) across spontaneous (black), 5 mm PTZ (orange), and 20 mm PTZ (red) conditions. B, Same as in A, for avalanche duration (T) with exponent α. C, The scaling relationship between S and T is shown by plotting mean S against T and fitting a linear regression line to estimate the exponent γ (dotted line), as shown for spontaneous (black), 5 mm PTZ (orange), and 20 mm PTZ (red) conditions. DCC is calculated as the absolute difference between γ and (α − 1)/(τ − 1). D, The correlation function r(d) compared across conditions (left), with the Euclidean distance from fitted power laws plotted for each condition (right). E, DCC compared across conditions. F, The branching parameter σ plotted for each dataset across 30 min recordings, using avalanche (left) and multiple-regression estimation approaches (right). G, Same as in F, for shorter 400 frame state transition periods, where baseline (base.) is before seizure transition and ictal onset is immediately following transition. *p < 0.01.
Next, we investigated whether such alterations to avalanche probabilities were conserved across brain scales. Specifically, various studies have assessed avalanche dynamics at coarse scales using EEG and MEG (Meisel et al., 2012; Arviv et al., 2016); however, whether such macroscale avalanche dynamics capture the underlying collective behavior of neuronal activity is unclear. To this end, we calculated avalanche dynamics from sequences of oscillatory peaks in human intracranial EEG recordings during seizures (see Materials and Methods), to ascertain whether larger and longer avalanches are also recorded at the macroscale. We found that focal-onset seizures in epilepsy patients gave rise to concordant decreases in avalanche exponents (Size: median τ = 1.94, 1.38–3.92, U = 3.71, p < 0.001; Duration: median α = 2.25, 1.47–3.77, U = 4.24, p < 0.001), when compared with interictal periods (Size: median τ = 2.52, 1.99–5.9; Duration: median α = 3.16, 2.26–11.64; Fig. 6). This suggests that the presence of longer and larger avalanches at the microscale during seizures, is also conserved in macroscale EEG data. However, we note that specific avalanche exponents are not conserved across scales, suggesting intrinsic differences between power law behavior at each scale.
Figure 6.

Human epileptic seizures at the macroscale alter avalanche dynamics. Complementary cumulative distribution functions for avalanche size (A) and duration (B), comparing mean distributions across EEG datasets for interictal (black) and seizure periods (red). Avalanche exponents are compared for avalanche size (τ) and duration (α) in interictal (black bar = mean), and seizure (red bar = mean) conditions.
Next, we assessed the effect of PTZ-induced seizures on critical exponent relations. Interestingly, on visual inspection, while the relationship between S and T clearly follows a power law in spontaneous datasets, this relationship appears to be lost during seizures (Fig. 5C). Specifically, while small avalanches in PTZ conditions appear to follow the scaling relationship γ defined from spontaneous activity, as avalanches get larger in size they occur at a faster rate than expected from the scaling exponent γ. This suggests a loss of self-similarity in avalanche dynamics during seizures, which is a defining feature of criticality (see Materials and Methods). A loss of power law scaling between S and T implies that the critical exponent relationship γ = (α − 1)/(τ − 1) would break down (Perković et al., 1995). To confirm this, we assessed DCC values – as expected seizures caused a divergence from critical exponent relations, with both 5 mm PTZ (DCC = 0.52 ± 0.10, t = −3.24, p = 0.01) and 20 mm PTZ (DCC = 0.57 ± 0.07, t = −5.70, p < 0.001) causing significant increases in DCCs (Fig. 5E). Therefore, seizures disrupt the collective behavior of neuronal activity at the microscale such that self-similarity and critical exponent relations are lost.
We also assessed the effect of seizures on the branching parameter σ which is expected to be close to 1 at criticality. We found a significant increase in both the 5 mm PTZ (σ = 1.00 ± 0.02, t = −3.79, p < 0.01) and 20 mm PTZ conditions (σ = 1.01 ± 0.01, t = −3.11, p < 0.017), suggesting an increased propensity for a neuron to activate descendants (Fig. 5F). To confirm this change, we also calculated σ under seizure conditions using the multiple-regression approach, here, we also find a significant increase in the branching parameter during seizures (20 mm PTZ, σ = 0.99 ± 0.00, t = −5.22, p < 0.0001; Fig. 5F). Interestingly, these changes indicate that brain dynamics may be operating closer to criticality during seizures as σ approaches 1. However, identifying σ > 1 is difficult in finite-size networks as avalanches will always be bounded by the size of the system (Zierenberg et al., 2020). One approach to identify σ > 1 in finite systems, is to look at σ over shorter periods, to capture the extending phase of the avalanche before it is reaches the full size of the system (Hagemann et al., 2021). To this end, we also compared σ during shorter 400 frame windows of spontaneous activity (baseline) and generalized seizure (ictal-onset; see Materials and Methods). Using our method, we found that σ shows a greater magnitude increase beyond 1 during seizure onset (baseline: σ = 0.94 ± 0.03, ictal-onset: σ = 1.05 ± 0.02, t = −3.41, p < 0.01; Fig. 5G). To confirm this finding, we also calculated the branching parameter in short 10 frame bins throughout generalized seizure transitions. As expected, σ drastically increased beyond 1 over short periods across all tested datasets, indicating transient departures from criticality (Fig. 7). Therefore, seizures transiently cause an increase in the branching parameter above 1, as expected for a supercritical system pushed away from criticality. Interestingly, σ dynamics were highly diverse across seizure periods, with mixtures of critical (σ ∼ 1) and supercritical (σ > 1) branching values throughout seizure evolution (Fig. 7).
Figure 7.
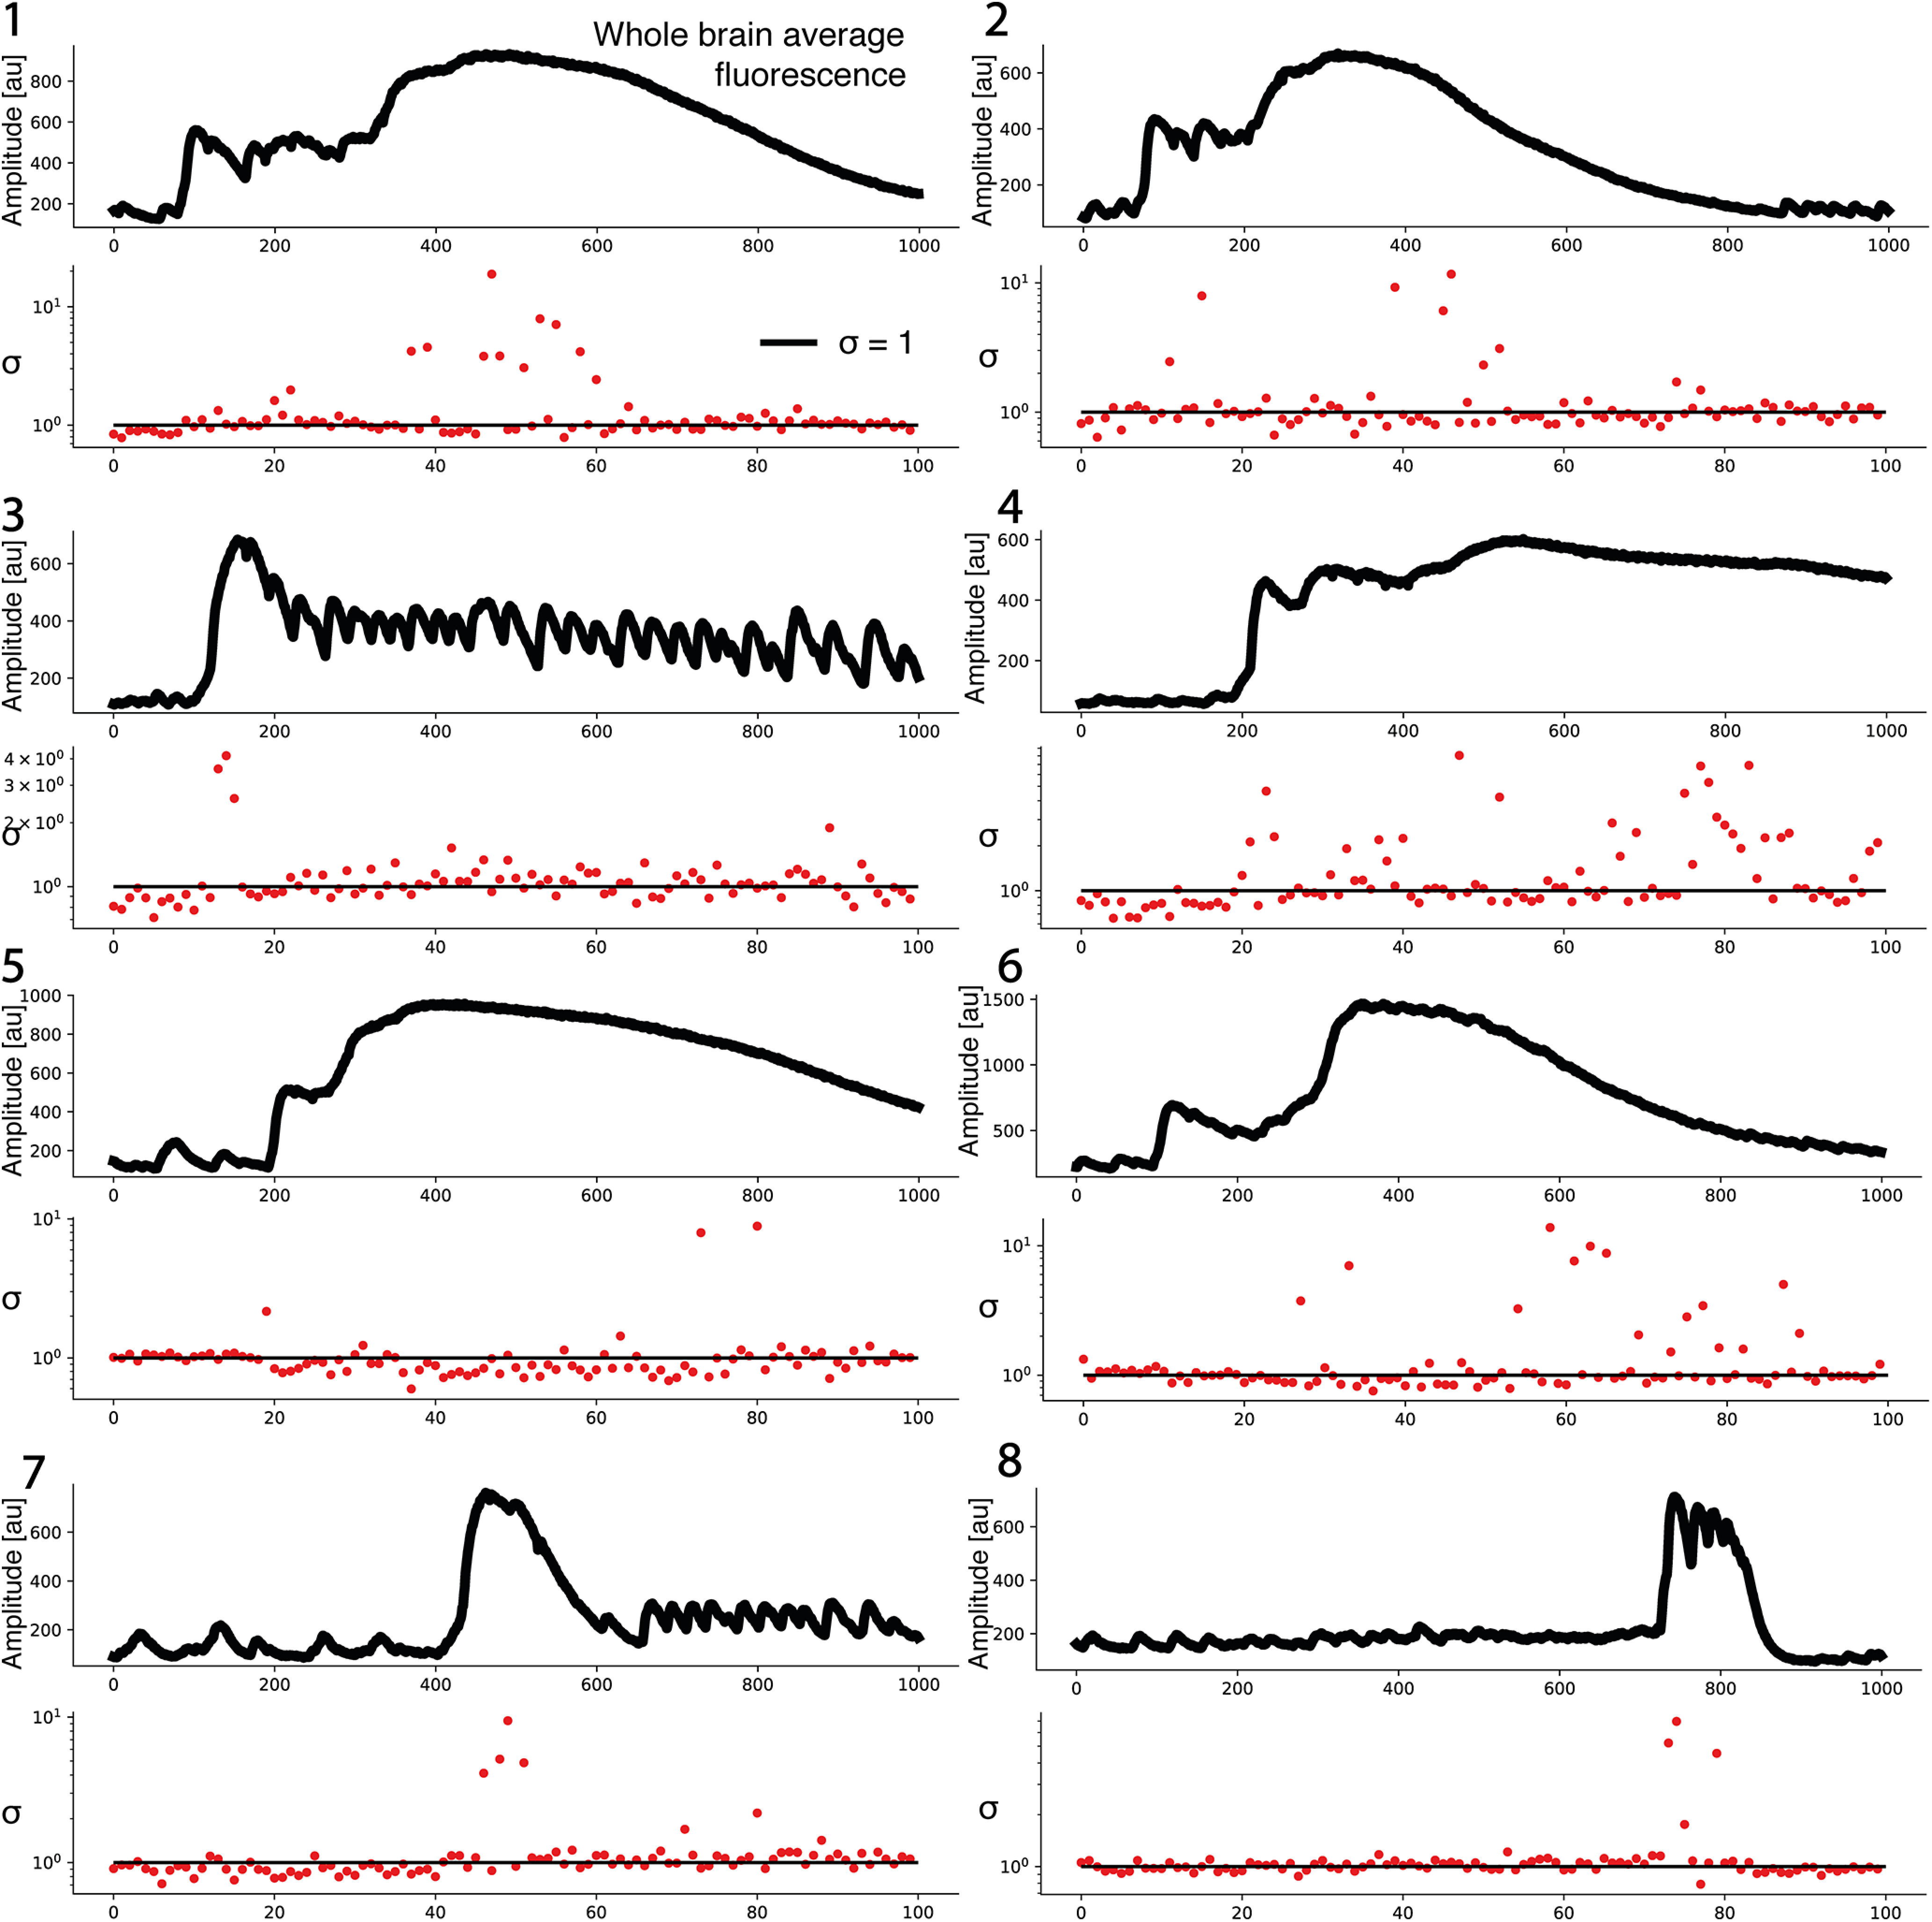
Branching parameter assessed throughout seizure evolution. The branching parameter σ was estimated using the avalanche approach across 1000 frames of generalized seizure periods in 10 frame bins. Two datasets were excluded based on the absence of clear transitions from nongeneralized to generalized activity, or insufficient frames following the transition initiation. σ remains close to 1 in the leadup to the generalized seizure and drastically increases as dynamics become highly synchronous, for most datasets (2, 3, 4, 5, 7, 8). Interestingly, following initial increases, σ quickly returns to ∼1 while high synchrony is ongoing. Note that for some datasets (1, 6) σ remains close to 1 until after the onset of highly synchronous activity. Oscillatory dynamics following the peak of synchronous activity are characterized by moderate increases in σ above 1 (3, 7).
However, we note that using the multiple regression approach on 400 frame datasets led to a nonsignificant increase in σ (baseline: σ = 0.96 ± 0.00, ictal-onset: σ = 0.98 ± 0.01, w = 9.0, p = 0.13; Fig. 5G). Taken together, the direction of the branching parameter change relative to the phase transition is unclear from our data.
Finally, we assessed the effect of seizures on correlation function power laws. Interestingly, correlation functions were significantly less well approximated by power laws in both the 5 mm (Euclidean distance from power-law = 0.07 ± 0.01, w = 1.0, p < 0.01) and 20 mm PTZ conditions (Euclidean distance = 0.44 ± 0.04, w = 0.0, p < 0.01) compared with spontaneous datasets (Euclidean distance = 0.04 ± 0.00; see Materials and Methods; Fig. 5D). This indicates that seizures saturate the system with excessive correlations, thus disrupting power law relationships that are a hallmark of criticality.
Taken together, we find that seizures cause a loss of critical statistics, with (1) the emergence of characteristic scale in avalanche distributions, (2) a departure from critical exponent relations, (3) increases in near-critical σ values, and (4) a loss of correlation function power laws. That avalanches sampled at single neuron resolution across the whole brain, exhibit a loss of critical statistics during seizures, indicates that microscale neuronal activity collectively drives network-wide dynamics away from the phase transition during seizures. Next, we wanted to understand what microscale network changes facilitate this loss of criticality during seizures.
Densely connected networks drive avalanche dynamics away from criticality
If seizures emerge as a loss of criticality, what network changes drive the brain away from the phase transition into seizure states? Interestingly, synaptic genes are risk factors in epilepsy (Rosch et al., 2019) and synaptic plasticity is essential for organizing critical dynamics in silico (Zeraati et al., 2021). As network models have demonstrated a diversity of synaptic mechanisms supporting self-organizing criticality, these approaches may provide clues into the synaptic pathways which, when dysregulated in epilepsy, give rise to a loss of criticality and seizures. In particular, modeling studies have implicated the number of connections in the network (Tetzlaff et al., 2010), the strength of synapses (de Arcangelis et al., 2006) and the intrinsic excitability of neurons (Levina et al., 2007), in stabilizing brain dynamics to criticality.
To probe the synaptic changes that drove avalanche dynamics away from criticality into seizure states, we modeled the brain as a spiking network of excitatory leaky-integrate-and-fire neurons (see Materials and Methods). We were particularly interested in the network mechanisms supporting the emergence of seizure state transitions. Accordingly, we fit network models to three avalanche datasets comprising normal activity (baseline), activity immediately preceding the generalized seizure (pre-ictal), and the generalized seizure itself (ictal-onset; see Materials and Methods). To distinguish between the differential involvement of synaptic changes in driving seizure state transitions, we investigated three parameters in our model: (1) network connectivity, the number of connections between neurons defined by parameter m; (2) synaptic weights, the strength of synapses between neurons defined by parameter r; and (3) intrinsic excitability, the propensity of individual neurons to spike defined by parameter Vth (Fig. 8). While a diversity of other parameters can drive epileptic seizures, including neuronal subtype (Sessolo et al., 2015; Khoshkhoo et al., 2017; Magloire et al., 2019a), nonsynaptic (Dudek et al., 1998; Bikson et al., 2018; Magloire et al., 2023), and non-neuronal mechanisms (Coulter and Steinhäuser, 2015; Diaz Verdugo et al., 2019; Wu et al., 2020; Vezzani et al., 2022), we restricted our model to three simplified plasticity parameters, to relate predictions from criticality theory with observed seizure avalanche dynamics. Importantly, such simplified plasticity models make few assumptions about the underlying dynamics, and if they can explain observed data, can demonstrate the sufficiency of general synaptic mechanisms in driving seizure activity and critical dynamics.
Figure 8.

Neuronal network mechanisms driving generalized seizure dynamics. A, Avalanche distributions from baseline, pre-ictal, and ictal-onset periods, alongside best model fits using all parameters. B, Network connectivity schematic for sparse and dense networks (left). Best model fits using network connectivity parameter only, to pre-ictal (middle) and ictal-onset data (right). C, Synaptic weights schematic for strong and weak synaptic weights (edge thickness = synaptic strength; left). Best model fits using synaptic weights parameter only, to pre-ictal (middle) and ictal-onset data (right). D, Intrinsic excitability schematic for high and low threshold to spike networks (red node = closer to spike; left). Best model fits using intrinsic excitability parameter only to pre-ictal (middle) and ictal-onset data (right). E, Model comparison for three parameter models (black), two parameter models (gray), and single parameter models (colors as above), for pre-ictal (middle) and ictal-onset data. The cost function used for model comparison was a regularized mean squared error term (left; see Materials and Methods).
We performed a grid-search of ∼1400 parameter combinations, finding the combinations which best captured baseline, pre-ictal, and ictal-onset avalanche dynamics. Using all three parameters, we generated approximate model fits to baseline (m = 7, r = 5, Vth = 20, cost = 0.113), pre-ictal (m = 6, r = 0, Vth = 16, cost = 0.176), and ictal-onset data (m = 31, r = 1, Vth = 17, cost = 0.120; Fig. 8A).
To compare the importance of each network parameter in the emergence of the pre-ictal state, we explored a subset of parameters that were free to vary, while keeping others fixed. Specifically, we fixed parameters to the best baseline model fit while allowing subsets of parameters to vary freely for model fitting. This was done because the partially hyperexcitable dynamics of the pre-ictal state were preceded by a baseline activity state before the addition of PTZ. Allowing only single parameters to vary freely for fitting demonstrated that the intrinsic excitability parameter provided the best fit to pre-ictal data (Vth = 19, cost = 0.223; Fig. 8D), through increases in intrinsic excitability. Network connectivity changes alone gave rise to avalanche distributions with excessive heavy tails (m = 15, cost = 0.241; Fig. 8B), while synaptic weights changes alone were unable to generate sufficiently heavy tails (r = 6, cost = 1.06; Fig. 8C). However, we found that the model with all three parameters free to vary provided the best pre-ictal fit (Fig. 8E), while models with any combination of two free parameters provide better fits than intrinsic excitability alone. Therefore, while increases in intrinsic excitability is the singular parameter change that best explains the emergence of pre-ictal dynamics, nonspecific combinations of all three parameters can more accurately describe such dynamics. This indicates that the pre-ictal state likely emerges from small, nonspecific changes to network connectivity, synaptic weights, and intrinsic excitability.
Next, to model the emergence of the ictal-onset state, we fixed parameters to the best pre-ictal model fit while allowing subsets of parameters to vary freely for model fitting. Allowing only single parameters to vary demonstrated that only the network connectivity parameter provided a reasonable fit to ictal-onset data (m = 30, cost = 0.190; Fig. 8B), emerging because of an increase in the number of connections from the pre-ictal state. Changing both synaptic weights (r = 7, cost = 0.465) and intrinsic excitability (Vth = 15, cost = 0.744) parameters alone failed to generate sufficiently heavy tails (Fig. 8C,D). This suggests that increases in network connectivity are central to driving generalized seizure dynamics and thus pushing the brain away from criticality. In fact, while model fits with all three parameters provided the best overall fit, the network connectivity model alone provided a better fit than the model with both synaptic weights and intrinsic excitability free to vary (Fig. 8E). Therefore, increasing the connectivity of the network alone is sufficient to drive the heavy-tailed avalanche dynamics of generalized seizures.
Taken together, we find that the emergence of the pre-ictal state is driven by nonspecific changes to combinations of neuronal connectivity, synapse strength and node excitability. Conversely, generalized seizure dynamics can only emerge in densely connected networks. This indicates that the density of network connections is a key parameter for disrupting critical dynamics during seizures. Next, we investigated the effects of such dense connectivity on the emergent computational properties of critical networks.
Dense connectivity drives the emergence of chaos in seizure networks
Having identified key neuronal parameters driving generalized seizure dynamics, we next investigated the functional implications of such changes. Interestingly, during generalized seizures patients regularly exhibit a complete loss of awareness (Dudek et al., 1998; Bikson et al., 2018; Shimoda et al., 2020; Magloire et al., 2023). Given that generalized seizures emerge as a loss of criticality, we theorized that co-occurring cognitive dysfunction would be caused by the suboptimal computational capacities of networks away from criticality. One key prediction for critical networks is that the phase transition can separate out stable and chaotic regimes, where the critical point exhibits neutral dynamics (Haldeman and Beggs, 2005). Such neutral dynamics give rise to long autocorrelation and minimal information loss about inputs (Hesse and Gross, 2014). Therefore, if critical brain dynamics exist at the boundary between stability and chaos, then one would expect a loss of neutral dynamics during generalized seizures.
To test this hypothesis, we approximated the largest Lyapunov exponent (λ). λ Captures the distance of nearby trajectories in state space, where λ > 0 implies that points grow further apart over time (chaos), λ < 0 implies that points get closer over time (stable), and λ ∼ 0 implies that points retain their distances over time (neutral; Fig. 9B). λ was estimated from spontaneous and 20 mm PTZ empirical datasets, by reconstructing the attractor of the system using Takens' embedding theorem (see Materials and Methods; Fig. 9A). We found that generalized seizures were significantly more chaotic (20 mm PTZ: λ = 0.0034 ± 0.0001, t = −10.7, p < 0.0001), than spontaneous dynamics (λ = 0.0024 ± 0.0001; Fig. 9B). To confirm this finding, we also calculated λ in our model network, by directly perturbing the system and following the trajectories over time (see Materials and Methods). Using this approach we find that ictal-onset models were also significantly more chaotic than baseline models (baseline: λ = 0.0002 ± 0.0001, ictal-onset: λ = 0.0065 ± 0.0001, t = −45.5, p < 0.0001), using all-parameter models (Fig. 9C,D). This indicates that close-by trajectories will grow further apart over time, suggesting a heightened sensitivity to initial conditions in the seizure state (Fig. 7B).
Figure 9.

Increased connectivity drives the emergence of chaos in seizure networks. A, Using lagged coordinate embedding single variable (Y) can be used to reconstruct an attractor that is topologically equivalent to the full system, by using a series of delayed variables (Y, Yt-τ, Yt-2τ …, Yt-(m-1)τ) of delay τ and dimension m. Embedding each lagged variable into state space provides the reconstructed attractor, where tx is the position in state space at time x corresponding to the dotted red line (left). Isomap 3d embeddings of reconstructed attractors using lagged coordinate embedding for spontaneous (middle) and 20 mm PTZ (right) data for a representative fish. B, Schematic outlining the meaning of different λ values (top). Each color represents the trajectory over time for a specific initial point along the attractor (high to low brightness represents movement in time). λ is the ratio of the difference between two points at the start (d0) and at t (dt). λ > 1: chaotic (red), λ < 1: stable (blue), λ = 1: neutral (green), where λ for each trajectory is calculated against the black trajectory. λ over time is compared for spontaneous and 20 mm PTZ conditions (bottom), and mean λ is compared across spontaneous (black bar = mean) and 20 mm PTZ conditions (red bar = mean; top right). C, λ over time compared for baseline and ictal-onset full parameter models (top), and λ over time is shown as a function of edge density m (bottom), ranging from pre-ictal values to ictal-onset values. Each line represents the mean λ over time for each model over 50 simulations. D, Mean λ compared for baseline (base.) and ictal-onset full parameter models, and single parameter models (m = network connectivity, Vth = intrinsic excitability, r = synaptic strength; top left). Correlation between m and mean λ is shown, ranging from pre-ictal values to ictal-onset values (bottom). Mean λ calculated using lagged coordinate embedding (LCE) on full parameter models across baseline (gray bar = mean) and ictal-onset models (crimson bar = mean; top right).
To confirm the validity of our embedding approach we also compared model λ as generated from the direct perturbation and embedding approaches (see Materials and Methods). Importantly, the embedding approach also shows a significant increase in λ in the ictal-onset period in the model (baseline: λ = 0.02 ± 0.0003, ictal-onset: λ = 0.03 ± 0.0004, U = 0.0, p < 0.0001; Fig. 9D). Therefore, this indicates that during generalized seizures the brain enters a chaotic state, as expected for a supercritical network away from criticality (Haldeman and Beggs, 2005).
Next, to relate observed chaotic dynamics with underlying neuronal parameter changes driving seizures, we tested the link between λ and network connectivity in the network model. To do this we compared λ across single parameter models, with fixed parameters set to pre-ictal values and free parameters fitted to ictal-onset data. Interestingly, only the network connectivity m model produced λ that matched the full model (0.0067 ± 0.0001, U = 1108.0, p = 0.16), while synaptic weights r (0.0010 ± 0.0001, U = 0.0, p < 0.0001) and intrinsic excitability Vth (−0.0010 ± 0.0001, U = 0.0, p < 0.0001) models failed to produce more chaotic dynamics (Fig. 9D). This suggests that only the network connectivity parameter can drive the emergence of chaotic dynamics observed during generalized seizures. We also found a significant positive correlation between the number of connections m and λ (r = 0.95, p < 0.0001; Fig. 9D), with increasing m from pre-ictal to ictal-onset values directly causing a loss of neutral dynamics and the emergence of chaos (Fig. 9C). Therefore, the increased network connectivity driving generalized seizures, also causes the emergence of chaotic dynamics. This would impair the network's ability to maintain maximal memory about inputs, thus giving rise to network dysfunction during seizures (Haldeman and Beggs, 2005). Next, we investigated the effect of such chaotic dynamics on the response properties of the network.
Dense connectivity impairs the optimal network response properties of critical networks
Another key property at criticality is that certain network response properties are optimized. In particular, evidence from in vitro and in silico studies have demonstrated that (1) the network-mediated separation (NMS), a network's ability to discriminate between inputs (Bertschinger and Natschläger, 2004); and (2) the dynamic range (δ), a network's ability to represent a wide range of inputs (Kinouchi and Copelli, 2006; Shew et al., 2009), should be optimized at the critical point. Therefore, if generalized seizures emerge as a loss of criticality, one would expect emergent brain dysfunction because of impaired network response properties. Here, we assessed NMS and δ using the network model as we can disentangle the networks' responses to inputs from its ongoing activity, something which is not possible in vivo.
NMS is the property of a network to encode distinct inputs with distinct network states, enabling similar inputs to be separated and discriminated by a readout function (see Materials and Methods; Fig. 10A). As predicted, baseline networks assume higher NMS values across the range of input sizes compared with ictal-onset networks (baseline: mean NMS = 0.91 ± 0.01, ictal-onset: 0.18 ± 0.00, U = 556,991.0, p < 0.0001; Fig. 10B). This suggests an impaired ability of the network to discriminate between inputs during seizures. Furthermore, ictal-onset networks exhibit a significantly more shallow NMS slope (baseline: slope = 0.0034 ± 0.0000, ictal-onset: slope = 0.0007 ± 0.0000, t = 109.5, p < 0.0001; Fig. 10B). This indicates a reduced sensitivity of the NMS property to input size differences, demonstrating an impaired ability to distinguish between similar input pairs and highly different input pairs. Therefore, generalized seizures impair the ability of the brain to not only discriminate between inputs, but also represent input pairs according to their similarity.
Figure 10.

Increased connectivity disrupts the optimal network response properties of critical networks. A, For two similar inputs (i1 and i2) onto the network, the network-mediated separation (NMS) is the Euclidean distance between the two corresponding network states (s1 and s2). B, NMS is shown as a function of input difference compared for baseline and ictal-onset full parameter models (top). NMS slope and mean NMS is compared for baseline and ictal-onset full models and single parameter models (m = network connectivity, Vth = intrinsic excitability, r = synaptic strength; bottom). C, NMS as a function of input difference for increasing network connectivity m, ranging from pre-ictal to ictal-onset m values (top). Correlation between m and mean NMS (bottom). D, For different inputs, the dynamic range δ is the log ratio of the input sizes (i1 and i2) that give rise to the largest and smallest network responses (smax and smin). E, Output size as a function of input size compared for baseline and ictal-onset full parameter models (top). δ compared for baseline and ictal-onset full models and single parameter models (bottom). F, Output size as a function of input size for increasing network connectivity m, ranging from pre-ictal to ictal-onset m values. Correlation between m and δ (bottom). *p < 0.01.
Furthermore, to relate NMS reductions with underlying neuronal changes in seizures, we tested the link between NMS and network connectivity. We found that only the network connectivity m model produced NMS values matching the full model (0.18 ± 0.00, U = 3,081,443.4, p = 0.20), while synaptic weights r (0.49 ± 0.01, U = 1,104,945.0, p < 0.0001) and intrinsic excitability Vth (0.51 ± 0.01, U = 1,546,742.0, p < 0.0001) models failed to reduce NMS sufficiently to ictal-onset levels (Fig. 10B). Furthermore, increasing the number of connections m resulted in a significantly correlated reduction in NMS statistics (mean NMS: r = −0.99, p < 0.0001, NMS slope: r = −0.99, p < 0.0001), indicating a direct link between increased edge density and impaired NMS (Fig. 10C).
We also investigated the dynamic range (δ), a measure of the range of input sizes that a system can represent (see Materials and Methods; Fig. 10D). We found that ictal-onset networks exhibit significantly lower δ than baseline networks (baseline: 8.22 ± 0.06, ictal-onset: 7.70 ± 0.07, t = 5.83, p < 0.0001). This suggests that seizure networks exhibit a reduced capacity to represent a wide range of inputs, as expected in a network away from criticality. Once again, only the network connectivity m model matched the full ictal-onset model for δ (m: 7.62 ± 0.05, t = −0.95, p = 0.34; r = 8.18 ± 0.07, U = 593.0, p < 0.0001; vth: 8.15 ± 0.08, t = 4.28, p < 0.0001; Fig. 10E). The parameter network connectivity m was also significantly negatively correlated with δ (r = −0.71, p < 0.0001), although we note a nonlinear relationship (Fig. 10F). This suggests that increased network connectivity during generalized seizures directly impairs the dynamics range.
Taken together, our model demonstrates that increased network connectivity impairs the optimal response properties of critical networks, resulting in reductions in NMS and dynamic range. Overall, this suggests that brain dysfunction emerging during generalized seizures is caused by a disruption of the optimal network response properties at criticality.
Generalized seizure networks are inflexible because of the emergence of sticky states
Finally, we investigated the impact of generalized seizures on state transition dynamics. A key property of systems at criticality is the ability to flexibly transition across a diversity of brain states – the number of states available to the system is maximal at the critical point (Haldeman and Beggs, 2005). Therefore, we theorized that generalized seizures should reduce the diversity of brain states, thus limiting the dynamic repertoire of the brain to a limit subset (Fig. 11A). To this end, we compared the number of available states during spontaneous and generalized seizure (20 mm PTZ) periods in empirical recordings. To do this, we estimated the number of metastable states, defined as a set of state vectors that are more similar to one another than expected in a random system (see Materials and Methods). Interestingly, generalized seizure dynamics exhibit significantly fewer metastable states than spontaneous dynamics (spontaneous: 20.9 ± 3.30, PTZ 20 mm: 11.9 ± 2.31, w = 1.9, p < 0.05; Fig. 11B). This indicates that generalized seizures limit the diversity of states the brain can enter into, which likely impairs the flexible transitioning across the full dynamic repertoire.
Figure 11.
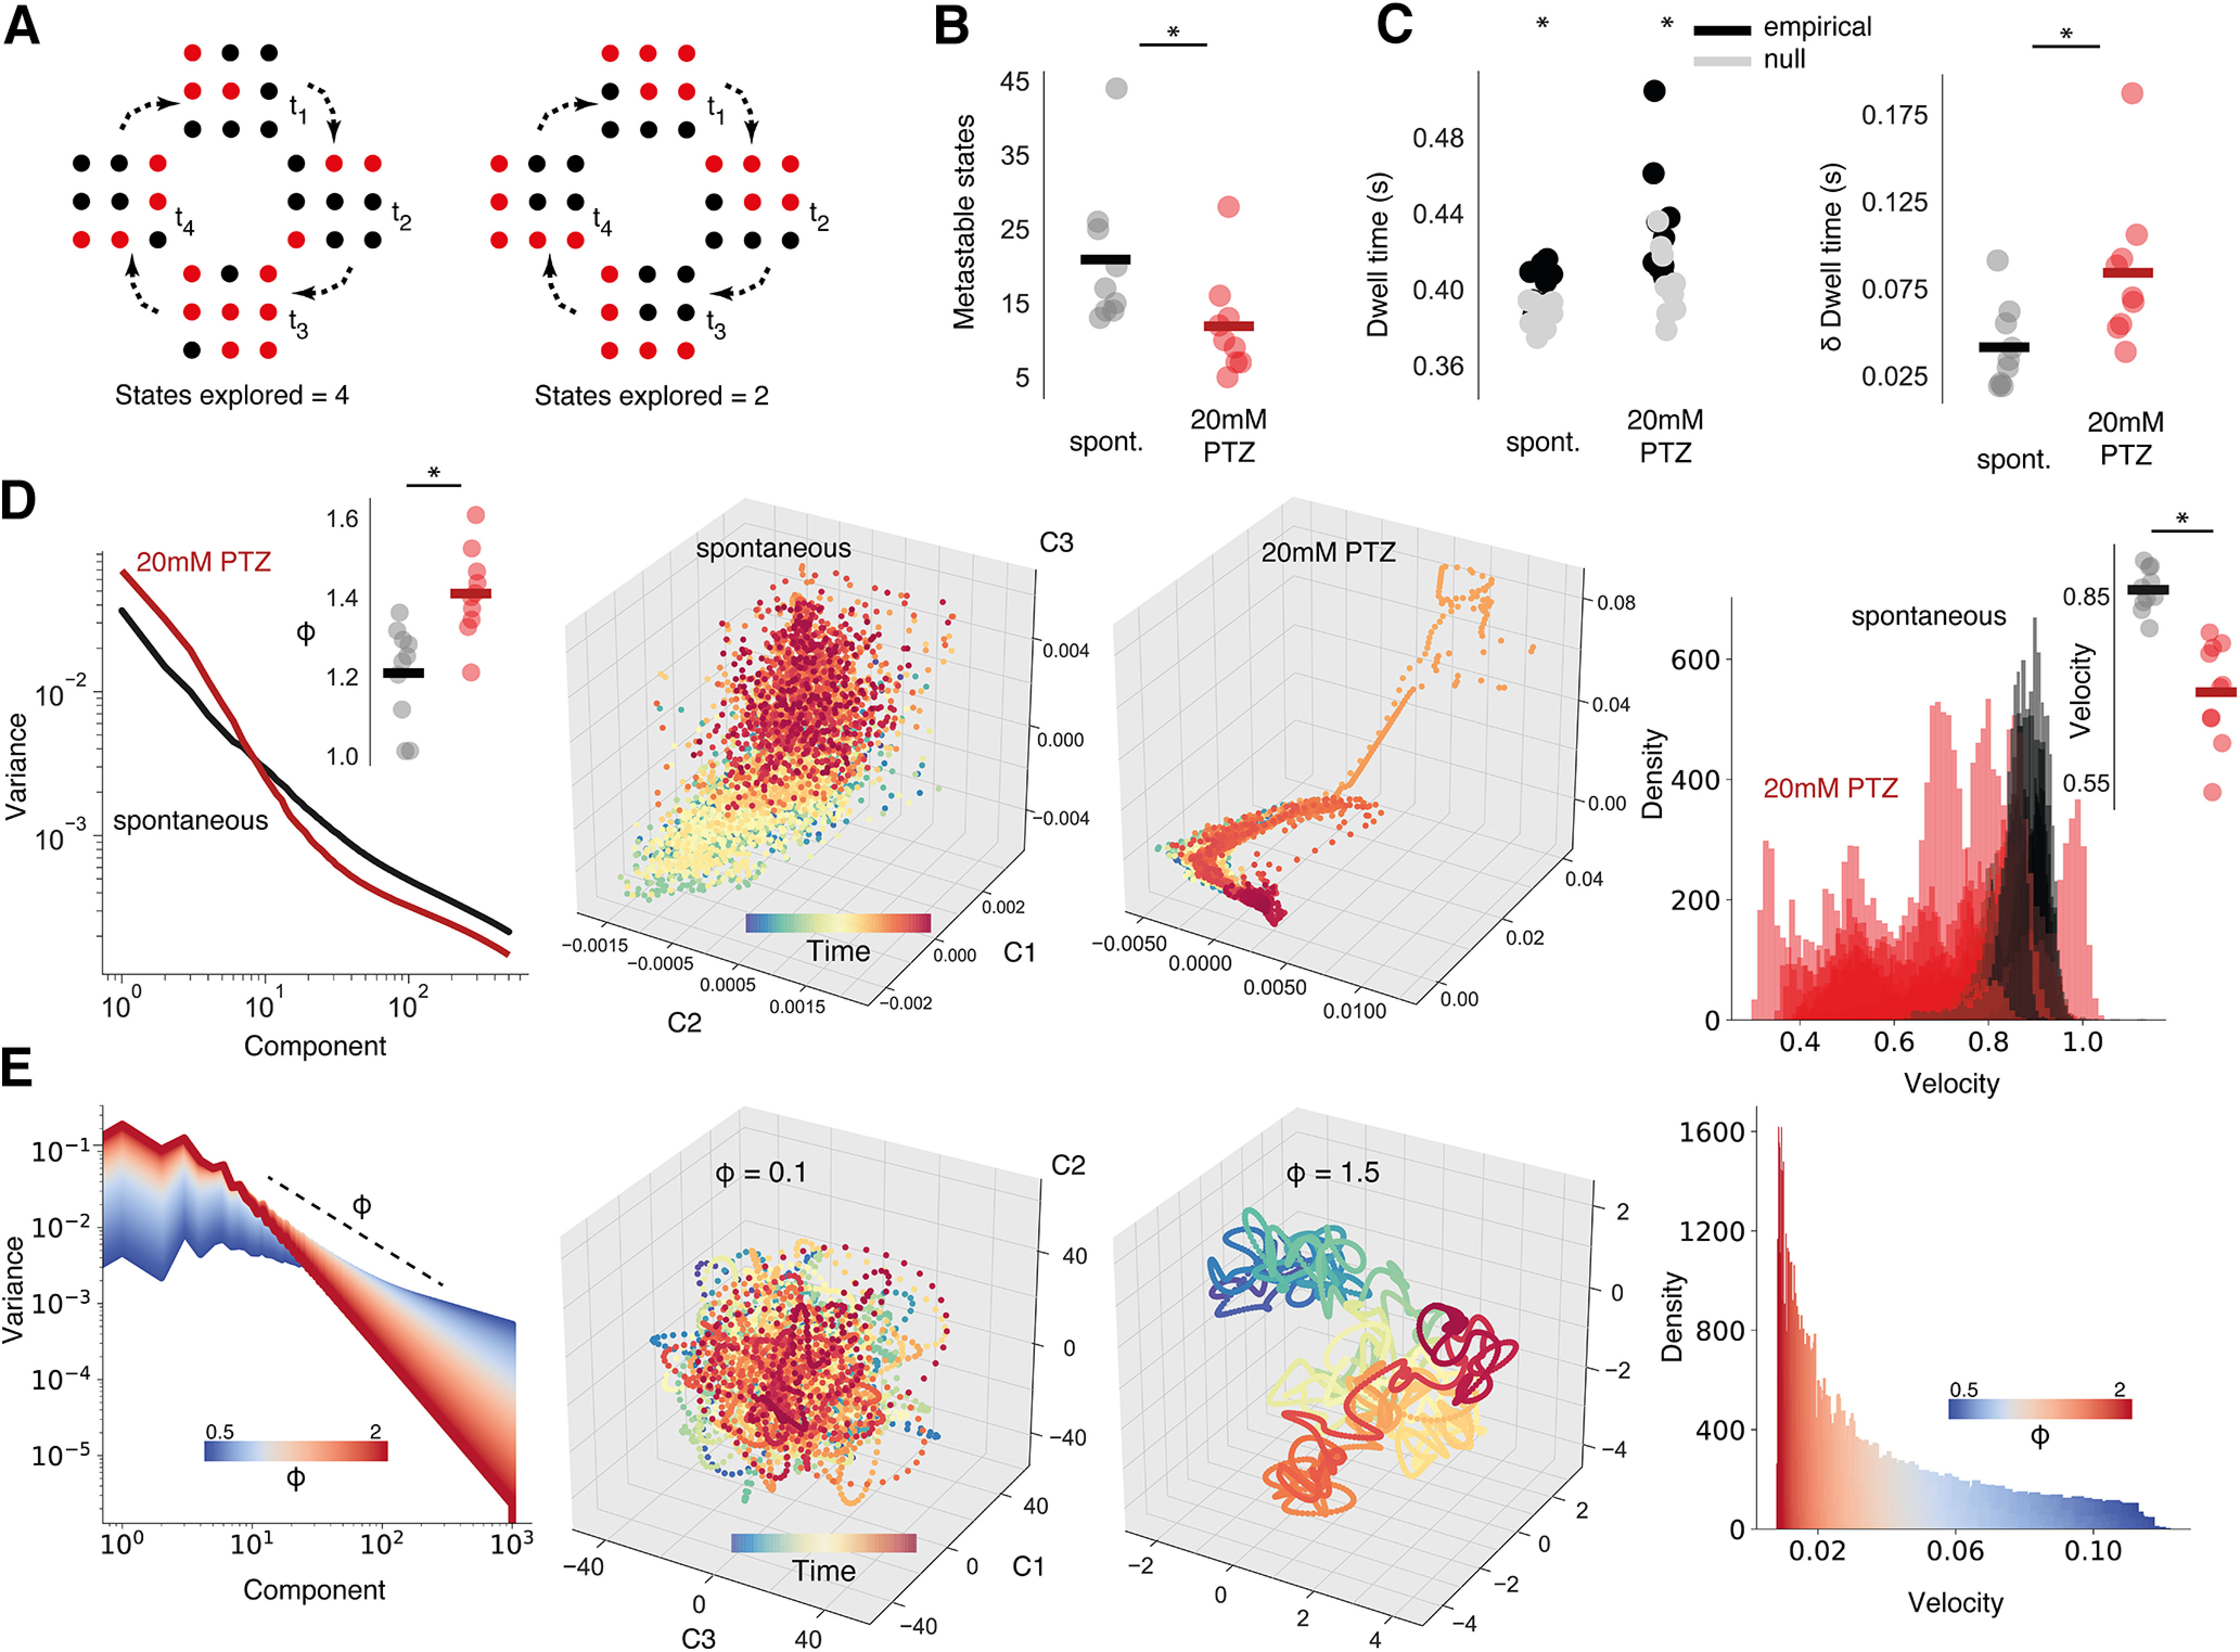
Generalized seizures cause sticky dynamics. A, A critical system can explore a greater subset of its possible brain states (left), while a noncritical system will explore a more limited subset (right). B, The number of metastable states compared across spontaneous (black bar = mean) and 20 mm PTZ conditions (red bar = mean). C, Mean dwell time in each state compared across conditions, plotting both empirical and null model datapoints (left). Empirical dwell time minus null model dwell time (δ dwell time), as a measure of dwell time normalized to number of available states, compared across datasets (right). D, Left, Mean eigenspectrum function plotted across conditions, with eigenspectrum slope ϕ plotted for each dataset (top right). D, Middle, 3d Isomap embedding of reconstructed attractor for an example fish. D, Right, State space velocity probability densities plotted for all fish, comparing spontaneous and 20 mm PTZ conditions, with mean velocity compared across datasets (top right). E, Left, Simulated eigenspectrum function plotted for increasing ϕ. E, Middle, Random projection of eigenspectra into state space for different ϕ. E, Right, State space velocity probability densities plotted as a function of ϕ. *p < 0.01.
Next, we investigated the population mechanisms that might disrupt flexible dynamics. Having identified increased network connectivity as a driver of seizures, we reasoned that fewer brain states might be a natural consequence of the correlational structure of densely connected networks. We hypothesized that high multidimensional correlation in seizure networks would naturally limit the diversity of brain states, by restricting the space of possible neuronal activation patterns to a more limited subset. To test this, we use the eigenspectrum function which defines the amount of variance explained by the nth principal component, providing a measure of multidimensional correlation (see Materials and Methods). We found that the eigenspectrum slope ϕ significantly increased during generalized seizures (spontaneous: ϕ = 1.20 ± 0.04; 20 mm PTZ: ϕ = 1.41 ± 0.03, t = −6.05, p < 0.001), indicating greater variance captured in the first few components and increased multidimensional correlation (Fig. 11D).
Interestingly, we note a direct relationship between ϕ and the velocity of the underlying dynamics. Here, we define velocity as the normalized Euclidean distance traveled per unit time across the whole neuronal population. As multidimensional correlation and therefore ϕ increases, population dynamics exhibit slower transitions in state space (Fig. 11E). To visualize this, we simulate eigenspectra power laws and randomly project them into three-dimensional space using a previously developed method (see Materials and Methods; Fig. 11E; Stringer et al., 2019). In line with this prediction, we find significantly slower dynamics during generalized seizures (in networks with high ϕ), compared with spontaneous activity (spontaneous: velocity = 0.86 ± 0.01, 20 mm PTZ: velocity = 0.70 ± 0.03, w = 0.0, p < 0.01; Fig. 11D). Slower dynamics occur because of earlier components dominating the variance, such that the variance of reconstructed trajectories in state space is driven by only a few key modes. Slower transitions in state space suggest the emergence of sticky states which are difficult to leave. This could explain reductions in state diversity, as sticky dynamics prevent the flexible transitioning into and out of the full dynamic repertoire.
For such sticky states to arise, we would expect longer times spent in each metastable state.
In line with this, we find significantly increased dwell times during generalized seizures [spontaneous: dwell time (s) = 0.40 ± 0.01, 20 mm PTZ: dwell time (s) = 0.43 ± 0.01, w = 1.0, p < 0.01; Fig. 11C]. However, longer dwell times could occur by chance in systems with fewer states. Therefore, we calculated null models for each system, by evaluating the dwell time expected by chance. We find that the dynamics for spontaneous and generalized seizure periods are nonrandom, with longer dwell times than expected by chance (spontaneous: w = 0.0, p < 0.01, 20 mm PTZ: w = 0.0, p < 0.01; Fig. 11C). Importantly, generalized seizures show significantly longer dwell times even when accounting for the fewer available states [spontaneous: δ dwell time (s) = 0.02 ± 0.01, 20 mm PTZ: δ dwell time (s) = 0.03 ± 0.01, w = 2.0, p < 0.05; Fig. 11C].
Taken together, we find that the flexible dynamics of critical networks are impaired during generalized seizures, with a reduction in brain state diversity. Such inflexible dynamics may be caused by higher multidimensional correlation in dense networks, which gives rise to slow, sticky dynamics. Sticky, homogeneous dynamics would prevent flexible responses to inputs and impair the optimal exploration of semi-stable states required for scale-invariant dynamics at criticality, giving rise to brain dysfunction during seizures.
Discussion
In this study, we estimated avalanche dynamics in whole-brain networks at neuronal resolution, to understand the effect of epileptic seizures on critical dynamics and emergent computation. Microscale avalanche dynamics showed that global network dynamics are driven away from a phase transition during seizures, a shift that was driven by increased density of network connections. Importantly, network connection density also regulated key computational properties that are optimized at criticality, giving rise to impaired network response properties and inflexible state transitions in seizure networks. Therefore, this study illustrates that criticality offers a unifying framework for understanding emergent brain dynamics and impairment during epileptic seizures.
Understanding epileptic seizures through the lens of criticality
Criticality describes a system in which dynamics are organized near to a phase transition, giving rise to favorable computational properties (Packard, 1988; Langton, 1990). A key property of critical systems are scale-invariant avalanches, propagating events that span the entire scale of the system (Sethna et al., 2001). Interestingly, scale-invariant avalanches have been reported in neuronal dynamics across multiple scales (Beggs and Plenz, 2003; Tagliazucchi et al., 2012), leading to the critical brain hypothesis. Studies of small neuronal populations first identified a link between seizures and criticality, drug-induced hyperexcitability gives rise to a loss of critical avalanche statistics (Beggs and Plenz, 2003; Pasquale et al., 2008; Shew et al., 2009; Bellay et al., 2015). These were later complemented by macroscale seizure recordings in epilepsy patients, which further suggested a deviation from the phase transition in coarse avalanche dynamics (Meisel et al., 2012; Arviv et al., 2016). However, bridging the gap between neuronal avalanches and macroscale dynamics, where seizures typically occur, has not previously been possible. We build on previous work by investigating avalanche dynamics across all spatial scales, from single neurons to entire brain regions. This is vital, because macroscale recordings mask the heterogeneity of single neuron activity (Keller et al., 2010; Muldoon et al., 2013; Meyer et al., 2018), thus obscuring neuronal avalanche dynamics. Conversely, inferring criticality in small neuronal populations is also challenging, subsampling larger networks can give rise to spurious critical statistics (Priesemann et al., 2009), while different brain regions can be differentially tuned to criticality (Suryadi et al., 2018). Given that we record from vastly greater numbers of neurons across all brain regions, avalanche dynamics will be more accurately assessed by mitigating subsampling and region-specific effects. The fact that whole-brain, neuronal-resolution critical statistics deviate dramatically during seizures suggests that microscale activity drives macroscale dynamics away from the phase transition.
However, we note that critical statistics are correlative measures and can appear in noncritical systems (Touboul and Destexhe, 2017; Destexhe and Touboul, 2021). Therefore, any inferences about the critical state of an observed system should be made with caution, as the network parameters defining the system's dynamics are unknown and must be inferred indirectly.
The seizure avalanche dynamics observed in this study indicate the emergence of a supercritical regime, which predicts exponentially growing avalanches that saturate the macroscopic dynamics (Harris, 1963). This is corroborated by multiscale seizure studies, that show propagating waves spreading throughout all microscale recording sites, before emerging at the macroscale (Martinet et al., 2017). However, these studies also suggest a more complicated picture than theory predicts, while some propagating events rapidly spread outwards from the ictal wavefront (Trevelyan et al., 2007; Smith et al., 2016), others are restrained by feedback inhibition, manifesting as postsynaptic potentials that fail activate their targets (Trevelyan et al., 2006; Schevon et al., 2012). This could explain the heterogeneous branching ratio values observed in this study, with transient departures from criticality emerging because of the push-and-pull between local excitation and inhibition.
Importantly, such a supercritical regime can explain emergent computational properties reported during epileptic seizures. In particular, we demonstrate that seizures exhibit an increase in chaotic dynamics, as predicted for a supercritical branching process (Haldeman and Beggs, 2005). Therefore, supercritical dynamics can explain the chaotic behavior that has been reported in seizure networks, at the microscale using local field potentials (Hayashi and Ishizuka, 1995), and the macroscale via EEG recordings (Babloyantz and Destexhe, 1986). Such chaotic dynamics would reduce the network's memory about recent inputs, because of high reverberating activity in the network.
Another key prediction from supercritical networks, is disruptions to flexible dynamics. Critical systems can engage in metastable dynamics manifesting as the transient formation and dissipation of diverse semi-stable states (Wildie and Shanahan, 2012), which supports flexible state transitions (Fingelkurts and Fingelkurts, 2001). We have shown that seizure dynamics exhibit reductions in brain state diversity, as predicted in supercritical networks. This can explain the reduced entropy of theta oscillatory rhythms recorded during hippocampal kindling in rats (Ren et al., 2021), and the emergence of highly stereotyped oscillatory dynamics from the seizure-onset zone in patients (S. Liu et al., 2018), which point to the emergence of abnormally attracting states that are frequently visited. Interestingly, reduced diversity of brain states is a key finding in medically-induced loss of consciousness studies in mice and human brain dynamics (Schartner et al., 2015; Wenzel et al., 2019b). Therefore, a loss of metastable dynamics in supercritical networks, could explain the loss of consciousness that occurs during absence and tonic-clonic seizures (Blumenfeld, 2012).
Although we demonstrate a link between supercriticality and acute seizure impairments, further work is needed to show that chronic cognitive dysfunctions in epilepsy occur through similar mechanisms (Meador, 2002), by studying avalanche dynamics in epilepsy models of chronic cognitive impairment (Shuman et al., 2020). One should also note that PTZ-induced GABA blockade does not capture the full diversity of seizure driving mechanisms in epilepsy (Rosch et al., 2019). Future work should therefore test the generalizability of supercriticality as a network regime for seizure dynamics using distinct genetic models of seizures (Baraban et al., 2013; M. Liao et al., 2019).
Microscale neuronal network mechanisms driving macroscale seizure dynamics
This study used whole-brain neuronal network modeling to infer the microscale alterations driving generalized seizure dynamics. Large scale models of epileptic networks have already demonstrated key microscale properties underlying seizures, such as inhibition exhaustion (Liou et al., 2020), excessive inhibitory to inhibitory coupling (Depannemaecker et al., 2022) and hub neurons (Morgan and Soltesz, 2008; Hadjiabadi et al., 2021). Here, we studied three key parameters, network connectivity, synaptic weights and intrinsic excitability, drawing inspiration from theoretical models of criticality (Zeraati et al., 2021), to relate predictions from criticality theory with observed seizure avalanche dynamics. Interestingly, modeling studies have shown that changing neuronal connections (Bornholdt and Rohlf, 2000; Bornholdt and Röhl, 2003; Tetzlaff et al., 2010; van Ooyen and Butz-Ostendorf, 2019), synaptic strengths (de Arcangelis et al., 2006; Rubinov et al., 2011), and intrinsic neuronal excitability (Levina et al., 2007), can stabilize brain dynamics to criticality. Importantly, these changes have all been implicated in the emergence of seizures, with changes in the number of axonal connections (Buckmaster et al., 2002; Buckmaster, 2014; Chu et al., 2010), the strengths of synapses (Geinisman et al., 1988; Poulter et al., 1999; Zhang et al., 2012), and the intrinsic excitability of neurons (Upreti et al., 2012; Tokudome et al., 2016; Vannini et al., 2020) linked to animal models of epilepsy.
We found that generalized seizure avalanches can be explained by increased neuronal connectivity. This is supported by large scale models of the rate dentate gyrus, which show that increased connections between granule cells can drive network hyperexcitability (Dyhrfjeld-Johnsen et al., 2007). However, we note that in our data, the formation of structural synapses is likely limited during the short timescales between pre-ictal and ictal periods following PTZ administration (Le Bé and Markram, 2006; Ozcan, 2017). Therefore, dense connectivity may instead be explained by the formation of new effective connections between neurons, these could arise through a diversity of mechanisms, such as volume transmitted GABA waves diffusing extracellularly (Magloire et al., 2023), or glia-glia coupling via gap junctions which can synchronize noncoupled neurons (Diaz Verdugo et al., 2019). However, a diversity of other microscale parameters not explored here have been shown to drive epileptic seizures, including intracellular Cl− (Staley, 2006; Huberfeld et al., 2007; Magloire et al., 2019b; Shen et al., 2021), extracellular K+ (Florence et al., 2009; Ying et al., 2015; Uva et al., 2017), pro-ictal inhibition (Chang et al., 2018; Miri et al., 2018), distinct neuronal cell type dynamics (Khoshkhoo et al., 2017; Makinson et al., 2017), and cell death (Sloviter, 1987; Dingledine et al., 2014). Future work should use more specific parameterizations, to disentangle the differential role of each of these microscale parameters in driving excessive network connectivity during seizures.
In conclusion, we covered all spatial scales to investigate the collective behavior of neuronal activity during seizures. In doing so we found evidence that networks deviate from criticality during seizures, and emerge as a chaotic state which impairs brain function. This investigation links the microscale population activity of neuronal networks with macroscale pathologic brain dynamics that are characteristic of epileptic seizures.
Footnotes
D.R.W.B. was supported by a Medical Research Council-Sackler PhD Fellowship. D.S.B. was supported by the John D. and Catherine T. MacArthur Foundation. M.P.M. was supported by the Wellcome Investigator Award 204788/Z/16/Z. R.E.R. was supported by the Wellcome Trust Grant 209164/Z/17/Z. This research was funded in whole, or in part, by the Wellcome Trust. For the purpose of open access, the author has applied a CC BY public copyright license to any Author Accepted Manuscript version arising from this submission. We thank John Beggs and Fabrizio Lombardi for their helpful comments for the manuscript.
The authors declare no competing financial interests.
References
- Aeed F, Shnitzer T, Talmon R, Schiller Y (2020) Layer- and cell-specific recruitment dynamics during epileptic seizures in vivo. Ann Neurol 87:97–115. 10.1002/ana.25628 [DOI] [PubMed] [Google Scholar]
- Afrikanova T, Serruys ASK, Buenafe OEM, Clinckers R, Smolders I, Witte PA, Crawford AD, Esguerra CV (2013) Validation of the zebrafish pentylenetetrazol seizure model: locomotor versus electrographic responses to antiepileptic drugs. PLoS One 8:e54166. 10.1371/journal.pone.0054166 [DOI] [PMC free article] [PubMed] [Google Scholar]
- Ahn YY, Jeong H, Kim B (2006) Wiring cost in the organization of a biological neuronal network. Physica A Stat Mech Appl 367:531–537. 10.1016/j.physa.2005.12.013 [DOI] [Google Scholar]
- Ahrens MB, Orger MB, Robson DN, Li JM, Keller PJ (2013) Whole-brain functional imaging at cellular resolution using light-sheet microscopy. Nat Methods 10:413–420. 10.1038/nmeth.2434 [DOI] [PubMed] [Google Scholar]
- Alstott J, Bullmore E, Plenz D (2014) powerlaw: a Python package for analysis of heavy-tailed distributions. PLoS One 9:e85777. 10.1371/journal.pone.0085777 [DOI] [PMC free article] [PubMed] [Google Scholar]
- Arviv O, Medvedovsky M, Sheintuch L, Goldstein A, Shriki O (2016) Deviations from critical dynamics in interictal epileptiform activity. J Neurosci 36:12276–12292. 10.1523/JNEUROSCI.0809-16.2016 [DOI] [PMC free article] [PubMed] [Google Scholar]
- Babloyantz A, Destexhe A (1986) Low-dimensional chaos in an instance of epilepsy. Proc Natl Acad Sci U S A 83:3513–3517. 10.1073/pnas.83.10.3513 [DOI] [PMC free article] [PubMed] [Google Scholar]
- Bak P, Tang C, Wiesenfeld K (1987) Self-organized criticality: an explanation of the 1/f noise. Phys Rev Lett 59:381–384. 10.1103/PhysRevLett.59.381 [DOI] [PubMed] [Google Scholar]
- Baraban SC, Taylor MR, Castro PA, Baier H (2005) Pentylenetetrazole induced changes in zebrafish behavior, neural activity and c-fos expression. Neuroscience 131:759–768. 10.1016/j.neuroscience.2004.11.031 [DOI] [PubMed] [Google Scholar]
- Baraban SC, Dinday MT, Hortopan GA (2013) Drug screening in Scn1a zebrafish mutant identifies clemizole as a potential Dravet syndrome treatment. Nat Commun 4:2410. 10.1038/ncomms3410 [DOI] [PMC free article] [PubMed] [Google Scholar]
- Barabasi AL, Albert R (1999) Emergence of scaling in random networks. Science 286:509–512. 10.1126/science.286.5439.509 [DOI] [PubMed] [Google Scholar]
- Barnes SJ, Cheetham CE, Liu Y, Bennett SH, Albieri G, Jorstad AA, Knott GW, Finnerty GT (2015) Delayed and temporally imprecise neurotransmission in reorganizing cortical microcircuits. J Neurosci 35:9024–9037. 10.1523/JNEUROSCI.4583-14.2015 [DOI] [PMC free article] [PubMed] [Google Scholar]
- Beggs JM, Plenz D (2003) Neuronal avalanches in neocortical circuits. J Neurosci 23:11167–11177. 10.1523/JNEUROSCI.23-35-11167.2003 [DOI] [PMC free article] [PubMed] [Google Scholar]
- Bellay T, Klaus A, Seshadri S, Plenz D (2015) Irregular spiking of pyramidal neurons organizes as scale-invariant neuronal avalanches in the awake state. Elife 4:e07224. 10.7554/eLife.07224 [DOI] [PMC free article] [PubMed] [Google Scholar]
- Berghmans S, Hunt J, Roach A, Goldsmith P (2007) Zebrafish offer the potential for a primary screen to identify a wide variety of potential anticonvulsants. Epilepsy Res 75:18–28. 10.1016/j.eplepsyres.2007.03.015 [DOI] [PubMed] [Google Scholar]
- Bertschinger N, Natschläger T (2004) Real-time computation at the edge of chaos in recurrent neural networks. Neural Comput 16:1413–1436. 10.1162/089976604323057443 [DOI] [PubMed] [Google Scholar]
- Betzel RF (2020) Organizing principles of whole-brain functional connectivity in zebrafish larvae. Netw Neurosci 4:234–256. 10.1162/netn_a_00121 [DOI] [PMC free article] [PubMed] [Google Scholar]
- Bikson M, Ruiz-Nuño A, Miranda D, Kronberg G, Jiruska P, Fox JE, Jefferys JGR (2018) Synaptic transmission modulates while non-synaptic processes govern the transition from pre-ictal to seizure activity in vitro (p. 280321). bioRxiv 280321. 10.1101/280321. [DOI] [Google Scholar]
- Blumenfeld H (2012) Impaired consciousness in epilepsy. Lancet Neurol 11:814–826. 10.1016/S1474-4422(12)70188-6 [DOI] [PMC free article] [PubMed] [Google Scholar]
- Bornholdt S, Röhl T (2003) Self-organized critical neural networks. Phys Rev E Stat Nonlin Soft Matter Phys 67:066118. 10.1103/PhysRevE.67.066118 [DOI] [PubMed] [Google Scholar]
- Bornholdt S, Rohlf T (2000) Topological evolution of dynamical networks: global criticality from local dynamics. Phys Rev Lett 84:6114–6117. 10.1103/PhysRevLett.84.6114 [DOI] [PubMed] [Google Scholar]
- Bruzzone M, Chiarello E, Albanesi M, Miletto Petrazzini ME, Megighian A, Lodovichi C, dal Maschio M (2021) Whole brain functional recordings at cellular resolution in zebrafish larvae with 3D scanning multiphoton microscopy. Sci Rep 11:11048. 10.1038/s41598-021-90335-y [DOI] [PMC free article] [PubMed] [Google Scholar]
- Buckmaster PS (2014) Does mossy fiber sprouting give rise to the epileptic state? In: Issues in clinical epileptology: a view from the bench (Scharfman HE and Buckmaster PS, eds.), pp 161–168. Amsterdam: Springer Netherlands. [DOI] [PubMed] [Google Scholar]
- Buckmaster PS, Zhang GF, Yamawaki R (2002) Axon sprouting in a model of temporal lobe epilepsy creates a predominantly excitatory feedback circuit. J Neurosci 22:6650–6658. 10.1523/JNEUROSCI.22-15-06650.2002 [DOI] [PMC free article] [PubMed] [Google Scholar]
- Burrows DRW, Samarut É, Liu J, Baraban SC, Richardson MP, Meyer MP, Rosch RE (2020) Imaging epilepsy in larval zebrafish. Eur J Paediatr Neurol 24:70–80. 10.1016/j.ejpn.2020.01.006 [DOI] [PMC free article] [PubMed] [Google Scholar]
- Chang M, Dian JA, Dufour S, Wang L, Moradi Chameh H, Ramani M, Zhang L, Carlen PL, Womelsdorf T, Valiante TA (2018) Brief activation of GABAergic interneurons initiates the transition to ictal events through post-inhibitory rebound excitation. Neurobiol Dis 109:102–116. 10.1016/j.nbd.2017.10.007 [DOI] [PubMed] [Google Scholar]
- Chen BL, Hall DH, Chklovskii DB (2006) Wiring optimization can relate neuronal structure and function. Proc Natl Acad Sci U S A 103:4723–4728. 10.1073/pnas.0506806103 [DOI] [PMC free article] [PubMed] [Google Scholar]
- Chen TW, Wardill TJ, Sun Y, Pulver SR, Renninger SL, Baohan A, Schreiter ER, Kerr RA, Orger MB, Jayaraman V, Looger LL, Svoboda K, Kim DS (2013) Ultra-sensitive fluorescent proteins for imaging neuronal activity. Nature 499:295–300. 10.1038/nature12354 [DOI] [PMC free article] [PubMed] [Google Scholar]
- Cherniak C (1994) Component placement optimization in the brain. J Neurosci 14:2418–2427. 10.1523/JNEUROSCI.14-04-02418.1994 [DOI] [PMC free article] [PubMed] [Google Scholar]
- Chu Y, Jin X, Parada I, Pesic A, Stevens B, Barres B, Prince DA (2010) Enhanced synaptic connectivity and epilepsy in C1q knockout mice. Proc Natl Acad Sci U S A 107:7975–7980. 10.1073/pnas.0913449107 [DOI] [PMC free article] [PubMed] [Google Scholar]
- Cocchi L, Gollo LL, Zalesky A, Breakspear M (2017) Criticality in the brain: a synthesis of neurobiology, models and cognition. Prog Neurobiol 158:132–152. 10.1016/j.pneurobio.2017.07.002 [DOI] [PubMed] [Google Scholar]
- Corral A, Font-Clos F (2012) Criticality and self-organization in branching processes: Application to natural hazards. arXiv 1207.2589. arXiv. http://arxiv.org/abs/1207.2589. [Google Scholar]
- Coulter DA, Steinhäuser C (2015) Role of astrocytes in epilepsy. Cold Spring Harb Perspect Med 5:a022434. 10.1101/cshperspect.a022434 [DOI] [PMC free article] [PubMed] [Google Scholar]
- de Arcangelis L, Perrone-Capano C, Herrmann HJ (2006) Self-organized criticality model for brain plasticity. Phys Rev Lett 96:028107. 10.1103/PhysRevLett.96.028107 [DOI] [PubMed] [Google Scholar]
- Depannemaecker D, Carlu M, Bouté J, Destexhe A (2022) A model for the propagation of seizure activity in normal brain tissue. eNeuro 9:ENEURO.0234-21.2022. 10.1523/ENEURO.0234-21.2022 [DOI] [PMC free article] [PubMed] [Google Scholar]
- Destexhe A, Touboul JD (2021) Is there sufficient evidence for criticality in cortical systems? eNeuro 8:ENEURO.0551-20.2021. 10.1523/ENEURO.0551-20.2021 [DOI] [PMC free article] [PubMed] [Google Scholar]
- Diana G, Sainsbury TTJ, Meyer MP (2019) Bayesian inference of neuronal assemblies. PLoS Comput Biol 15:e1007481. 10.1371/journal.pcbi.1007481 [DOI] [PMC free article] [PubMed] [Google Scholar]
- Diaz Verdugo C, Myren-Svelstad S, Aydin E, Van Hoeymissen E, Deneubourg C, Vanderhaeghe S, Vancraeynest J, Pelgrims R, Cosacak MI, Muto A, Kizil C, Kawakami K, Jurisch-Yaksi N, Yaksi E (2019) Glia-neuron interactions underlie state transitions to generalized seizures. Nat Commun 10:3830. 10.1038/s41467-019-11739-z [DOI] [PMC free article] [PubMed] [Google Scholar]
- Dingledine R, Varvel NH, Dudek FE (2014) When and how do seizures kill neurons, and is cell death relevant to epileptogenesis? Adv Exp Med Biol 813:109–122. 10.1007/978-94-017-8914-1 [DOI] [PMC free article] [PubMed] [Google Scholar]
- Dudek FE, Yasumura T, Rash JE (1998) 'Non-synaptic' mechanisms in seizures and epileptogenesis. Cell Biol Int 22:793–805. 10.1006/cbir.1999.0397 [DOI] [PubMed] [Google Scholar]
- Dyhrfjeld-Johnsen J, Santhakumar V, Morgan RJ, Huerta R, Tsimring L, Soltesz I (2007) Topological determinants of epileptogenesis in large-scale structural and functional models of the dentate gyrus derived from experimental data. J Neurophysiol 97:1566–1587. 10.1152/jn.00950.2006 [DOI] [PubMed] [Google Scholar]
- Eguíluz VM, Chialvo DR, Cecchi GA, Baliki M, Apkarian AV (2005) Scale-free brain functional networks. Phys Rev Lett 94:018102. 10.1103/PhysRevLett.94.018102 [DOI] [PubMed] [Google Scholar]
- Expert P, Lambiotte R, Chialvo DR, Christensen K, Jensen HJ, Sharp DJ, Turkheimer F (2011) Self-similar correlation function in brain resting-state functional magnetic resonance imaging. J R Soc Interface 8:472–479. 10.1098/rsif.2010.0416 [DOI] [PMC free article] [PubMed] [Google Scholar]
- Fingelkurts AA, Fingelkurts AA (2001) Operational architectonics of the human brain biopotential field: towards solving the mind-brain problem. Brain and Mind 2:261–296. 10.1023/A:1014427822738 [DOI] [Google Scholar]
- Fisher RS, Acevedo C, Arzimanoglou A, Bogacz A, Cross JH, Elger CE, Engel J Jr, Forsgren L, French JA, Glynn M, Hesdorffer DC, Lee B. i, Mathern GW, Moshé SL, Perucca E, Scheffer IE, Tomson T, Watanabe M, Wiebe S (2014) ILAE official report: a practical clinical definition of epilepsy. Epilepsia 55:475–482. 10.1111/epi.12550 [DOI] [PubMed] [Google Scholar]
- Florence G, Dahlem MA, Almeida A-CG, Bassani JWM, Kurths J (2009) The role of extracellular potassium dynamics in the different stages of ictal bursting and spreading depression: a computational study. J Theor Biol 258:219–228. 10.1016/j.jtbi.2009.01.032 [DOI] [PubMed] [Google Scholar]
- Fontenele AJ, de Vasconcelos NAP, Feliciano T, Aguiar LAA, Soares-Cunha C, Coimbra B, Dalla Porta L, Ribeiro S, Rodrigues AJ, Sousa N, Carelli PV, Copelli M (2019) Criticality between cortical States. Phys Rev Lett 122:208101. 10.1103/PhysRevLett.122.208101 [DOI] [PubMed] [Google Scholar]
- Freeman J, Vladimirov N, Kawashima T, Mu Y, Sofroniew NJ, Bennett DV, Rosen J, Yang C-T, Looger LL, Ahrens MB (2014) Mapping brain activity at scale with cluster computing. Nat Methods 11:941–950. 10.1038/nmeth.3041 [DOI] [PubMed] [Google Scholar]
- Frey BJ, Dueck D (2007) Clustering by passing messages between data points. Science 315:972–976. 10.1126/science.1136800 [DOI] [PubMed] [Google Scholar]
- Friedman N, Ito S, Brinkman BAW, Shimono M, DeVille REL, Dahmen KA, Beggs JM, Butler TC (2012) Universal critical dynamics in high resolution neuronal avalanche data. Phys Rev Lett 108:208102. 10.1103/PhysRevLett.108.208102 [DOI] [PubMed] [Google Scholar]
- Geinisman Y, Morrell F, deToledo-Morrell L (1988) Remodeling of synaptic architecture during hippocampal 'kindling.' Proc Natl Acad Sci U S A 85:3260–3264. 10.1073/pnas.85.9.3260 [DOI] [PMC free article] [PubMed] [Google Scholar]
- Gibbs FA, Davis H, Lennox WG (1935) The electro-encephalogram in epilepsy and in conditions of impaired consciousness. Arch NeurPsych 34:1133–1148. 10.1001/archneurpsyc.1935.02250240002001 [DOI] [Google Scholar]
- Gramfort A, Luessi M, Larson E, Engemann D, Strohmeier D, Brodbeck C, Goj R, Jas M, Brooks T, Parkkonen L, Hämäläinen M (2013) MEG and EEG data analysis with MNE-Python. Front Neurosci 7:267. 10.3389/fnins.2013.00267 [DOI] [PMC free article] [PubMed] [Google Scholar]
- Hadjiabadi D, Lovett-Barron M, Raikov IG, Sparks FT, Liao Z, Baraban SC, Leskovec J, Losonczy A, Deisseroth K, Soltesz I (2021) Maximally selective single-cell target for circuit control in epilepsy models. Neuron 109:2556–2572.e6. 10.1016/j.neuron.2021.06.007 [DOI] [PMC free article] [PubMed] [Google Scholar]
- Hagemann A, Wilting J, Samimizad B, Mormann F, Priesemann V (2021) Assessing criticality in pre-seizure single-neuron activity of human epileptic cortex. PLoS Comput Biol 17:e1008773. 10.1371/journal.pcbi.1008773 [DOI] [PMC free article] [PubMed] [Google Scholar]
- Haldeman C, Beggs JM (2005) Critical branching captures activity in living neural networks and maximizes the number of metastable states. Phys Rev Lett 94:058101. 10.1103/PhysRevLett.94.058101 [DOI] [PubMed] [Google Scholar]
- Harris TE (1963) The theory of branching processes. Heidelberg: Springer-Verlag. [Google Scholar]
- Hayashi H, Ishizuka S (1995) Chaotic responses of the hippocampal CA3 region to a mossy fiber stimulation in vitro. Brain Res 686:194–206. 10.1016/0006-8993(95)00485-9 [DOI] [PubMed] [Google Scholar]
- Hesse J, Gross T (2014) Self-organized criticality as a fundamental property of neural systems. Front Syst Neurosci 8:166. 10.3389/fnsys.2014.00166 [DOI] [PMC free article] [PubMed] [Google Scholar]
- Huberfeld G, Wittner L, Clemenceau S, Baulac M, Kaila K, Miles R, Rivera C (2007) Perturbed chloride homeostasis and GABAergic signaling in human temporal lobe epilepsy. J Neurosci 27:9866–9873. 10.1523/JNEUROSCI.2761-07.2007 [DOI] [PMC free article] [PubMed] [Google Scholar]
- Keller CJ, Truccolo W, Gale JT, Eskandar E, Thesen T, Carlson C, Devinsky O, Kuzniecky R, Doyle WK, Madsen JR, Schomer DL, Mehta AD, Brown EN, Hochberg LR, Ulbert I, Halgren E, Cash SS (2010) Heterogeneous neuronal firing patterns during interictal epileptiform discharges in the human cortex. Brain 133:1668–1681. 10.1093/brain/awq112 [DOI] [PMC free article] [PubMed] [Google Scholar]
- Kennel MB, Brown R, Abarbanel HDI (1992) Determining embedding dimension for phase-space reconstruction using a geometrical construction. Phys Rev A 45:3403–3411. 10.1103/physreva.45.3403 [DOI] [PubMed] [Google Scholar]
- Khoshkhoo S, Vogt D, Sohal VS (2017) Dynamic, cell-type-specific roles for GABAergic interneurons in a mouse model of optogenetically inducible seizures. Neuron 93:291–298. 10.1016/j.neuron.2016.11.043 [DOI] [PMC free article] [PubMed] [Google Scholar]
- Kim CK, Miri A, Leung LC, Berndt A, Mourrain P, Tank DW, Burdine RD (2014) Prolonged, brain-wide expression of nuclear-localized GCaMP3 for functional circuit mapping. Front Neural Circuits 8:138. 10.3389/fncir.2014.00138 [DOI] [PMC free article] [PubMed] [Google Scholar]
- Kinouchi O, Copelli M (2006) Optimal dynamical range of excitable networks at criticality. Nature Phys 2:348–351. 10.1038/nphys289 [DOI] [Google Scholar]
- Kunst M, Laurell E, Mokayes N, Kramer A, Kubo F, Fernandes AM, Förster D, Dal Maschio M, Baier H (2019) A cellular-resolution atlas of the larval zebrafish brain. Neuron 103:21–38.e5. 10.1016/j.neuron.2019.04.034 [DOI] [PubMed] [Google Scholar]
- Kwan P, Brodie MJ (2000) Early identification of refractory epilepsy. N Engl J Med 342:314–319. 10.1056/NEJM200002033420503 [DOI] [PubMed] [Google Scholar]
- Langton CG (1990) Computation at the edge of chaos: phase transitions and emergent computation. Physica D 42:12–37. 10.1016/0167-2789(90)90064-V [DOI] [Google Scholar]
- Lau LA, Staley KJ, Lillis KP (2022) In vitro ictogenesis is stochastic at the single neuron level. Brain 145:531–541. 10.1093/brain/awab312 [DOI] [PMC free article] [PubMed] [Google Scholar]
- Le Bé JV, Markram H (2006) Spontaneous and evoked synaptic rewiring in the neonatal neocortex. Proc Natl Acad Sci U S A 103:13214–13219. 10.1073/pnas.0604691103 [DOI] [PMC free article] [PubMed] [Google Scholar]
- Levina A, Herrmann JM, Geisel T (2007) Dynamical synapses causing self-organized criticality in neural networks. Nature Phys 3:857–860. 10.1038/nphys758 [DOI] [Google Scholar]
- Liao JC, Haehnel M (2012) Physiology of afferent neurons in larval zebrafish provides a functional framework for lateral line somatotopy. J Neurophysiol 107:2615–2623. 10.1152/jn.01108.2011 [DOI] [PMC free article] [PubMed] [Google Scholar]
- Liao M, Kundap U, Rosch RE, Burrows DRW, Meyer MP, Ouled Amar Bencheikh B, Cossette P, Samarut É (2019) Targeted knockout of GABA-A receptor gamma 2 subunit provokes transient light-induced reflex seizures in zebrafish larvae. Dis Model Mech 12:dmm040782. 10.1242/dmm.040782 [DOI] [PMC free article] [PubMed] [Google Scholar]
- Liou J, Smith EH, Bateman LM, Bruce SL, McKhann GM, Goodman RR, Emerson RG, Schevon CA, Abbott L (2020) A model for focal seizure onset, propagation, evolution, and progression. Elife 9:e50927. 10.7554/eLife.50927 [DOI] [PMC free article] [PubMed] [Google Scholar]
- Lister JA, Robertson CP, Lepage T, Johnson SL, Raible DW (1999) Nacre encodes a zebrafish microphthalmia-related protein that regulates neural-crest-derived pigment cell fate. Development 126:3757–3767. 10.1242/dev.126.17.3757 [DOI] [PubMed] [Google Scholar]
- Liu J, Baraban SC (2019) Network properties revealed during multi-scale calcium imaging of seizure activity in zebrafish. eNeuro 6:ENEURO.0041-19.2019. 10.1523/ENEURO.0041-19.2019 [DOI] [PMC free article] [PubMed] [Google Scholar]
- Liu S, Gurses C, Sha Z, Quach MM, Sencer A, Bebek N, Curry DJ, Prabhu S, Tummala S, Henry TR, Ince NF (2018) Stereotyped high-frequency oscillations discriminate seizure onset zones and critical functional cortex in focal epilepsy. Brain 141:713–730. 10.1093/brain/awx374 [DOI] [PMC free article] [PubMed] [Google Scholar]
- Lombardi F, Shriki O, Herrmann HJ, de Arcangelis L (2021) Long-range temporal correlations in the broadband resting state activity of the human brain revealed by neuronal avalanches. Neurocomputing 461:657–666. [Google Scholar]
- Ma Z, Turrigiano GG, Wessel R, Hengen KB (2019) Cortical circuit dynamics are homeostatically tuned to criticality in vivo. Neuron 104:655–664.e4. 10.1016/j.neuron.2019.08.031 [DOI] [PMC free article] [PubMed] [Google Scholar]
- Magloire V, Cornford J, Lieb A, Kullmann DM, Pavlov I (2019a) KCC2 overexpression prevents the paradoxical seizure-promoting action of somatic inhibition. Nat Commun 10:1225. 10.1038/s41467-019-08933-4 [DOI] [PMC free article] [PubMed] [Google Scholar]
- Magloire V, Mercier MS, Kullmann DM, Pavlov I (2019b) GABAergic interneurons in seizures: investigating causality with optogenetics. Neuroscientist 25:344–358. 10.1177/1073858418805002 [DOI] [PMC free article] [PubMed] [Google Scholar]
- Magloire V, Savtchenko LP, Sylantyev S, Jensen TP, Cole N, Marvin JS, Looger LL, Kullmann DM, Walker MC, Pavlov I, Rusakov DA (2023) Volume-transmitted GABA waves drive epileptiform rhythms in the hippocampal network. Curr Biol 33:1249–1264.e7. [DOI] [PMC free article] [PubMed] [Google Scholar]
- Makinson CD, Tanaka BS, Sorokin JM, Wong JC, Christian CA, Goldin AL, Escayg A, Huguenard JR (2017) Regulation of thalamic and cortical network synchrony by Scn8a. Neuron 93:1165–1179.e6. 10.1016/j.neuron.2017.01.031 [DOI] [PMC free article] [PubMed] [Google Scholar]
- Martinet LE, Fiddyment G, Madsen JR, Eskandar EN, Truccolo W, Eden UT, Cash SS, Kramer MA (2017) Human seizures couple across spatial scales through travelling wave dynamics. Nat Commun 8:14896. 10.1038/ncomms14896 [DOI] [PMC free article] [PubMed] [Google Scholar]
- Meador KJ (2002) Cognitive outcomes and predictive factors in epilepsy. Neurology 58:S21–26. 10.1212/wnl.58.8_suppl_5.s21 [DOI] [PubMed] [Google Scholar]
- Meisel C, Storch A, Hallmeyer-Elgner S, Bullmore E, Gross T (2012) Failure of adaptive self-organized criticality during epileptic seizure attacks. PLoS Comput Biol 8:e1002312. 10.1371/journal.pcbi.1002312 [DOI] [PMC free article] [PubMed] [Google Scholar]
- Meyer J, Maheshwari A, Noebels J, Smirnakis S (2018) Asynchronous suppression of visual cortex during absence seizures in stargazer mice. Nat Commun 9:1938. 10.1038/s41467-018-04349-8 [DOI] [PMC free article] [PubMed] [Google Scholar]
- Migault G, van der Plas TL, Trentesaux H, Panier T, Candelier R, Proville R, Englitz B, Debrégeas G, Bormuth V (2018) Whole-brain calcium imaging during physiological vestibular stimulation in larval zebrafish. Curr Biol 28:3723–3735.e6. 10.1016/j.cub.2018.10.017 [DOI] [PMC free article] [PubMed] [Google Scholar]
- Miller GA (1957) Some effects of intermittent silence. Am J Psychol 70:311–314. 10.2307/1419346 [DOI] [PubMed] [Google Scholar]
- Miri ML, Vinck M, Pant R, Cardin JA (2018) Altered hippocampal interneuron activity precedes ictal onset. Elife 7:e40750. 10.7554/eLife.40750 [DOI] [PMC free article] [PubMed] [Google Scholar]
- Morgan RJ, Soltesz I (2008) Nonrandom connectivity of the epileptic dentate gyrus predicts a major role for neuronal hubs in seizures. Proc Natl Acad Sci U S A 105:6179–6184. 10.1073/pnas.0801372105 [DOI] [PMC free article] [PubMed] [Google Scholar]
- Muldoon SF, Soltesz I, Cossart R (2013) Spatially clustered neuronal assemblies comprise the microstructure of synchrony in chronically epileptic networks. Proc Natl Acad Sci U S A 110:3567–3572. 10.1073/pnas.1216958110 [DOI] [PMC free article] [PubMed] [Google Scholar]
- Ozcan AS (2017) Filopodia: a rapid structural plasticity substrate for fast learning. Front Synaptic Neurosci 9:12. 10.3389/fnsyn.2017.00012 [DOI] [PMC free article] [PubMed] [Google Scholar]
- Pachitariu M, Stringer C, Dipoppa M, Schröder S, Rossi LF, Dalgleish H, Carandini M, Harris KD (2017) Suite2p: beyond 10,000 neurons with standard two-photon microscopy. bioRxiv 061507. 10.1101/061507. [DOI] [Google Scholar]
- Packard NH (1988) Adaptation toward the edge of chaos. Champaign: University of Illinois at Urbana-Champaign, Center for Complex Systems Research. [Google Scholar]
- Pasquale V, Massobrio P, Bologna LL, Chiappalone M, Martinoia S (2008) Self-organization and neuronal avalanches in networks of dissociated cortical neurons. Neuroscience 153:1354–1369. 10.1016/j.neuroscience.2008.03.050 [DOI] [PubMed] [Google Scholar]
- Perković O, Dahmen K, Sethna JP (1995) Avalanches, Barkhausen noise, and plain old criticality. Phys Rev Lett 75:4528–4531. 10.1103/PhysRevLett.75.4528 [DOI] [PubMed] [Google Scholar]
- Ponce-Alvarez A, Jouary A, Privat M, Deco G, Sumbre G (2018) Whole-brain neuronal activity displays crackling noise dynamics. Neuron 100:1446–1459.e6. 10.1016/j.neuron.2018.10.045 [DOI] [PMC free article] [PubMed] [Google Scholar]
- Poulter MO, Brown LA, Tynan S, Willick G, William R, McIntyre DC (1999) Differential expression of alpha1, alpha2, alpha3, and alpha5 GABAA receptor subunits in seizure-prone and seizure-resistant rat models of temporal lobe epilepsy. J Neurosci 19:4654–4661. 10.1523/JNEUROSCI.19-11-04654.1999 [DOI] [PMC free article] [PubMed] [Google Scholar]
- Priesemann V, Munk MH, Wibral M (2009) Subsampling effects in neuronal avalanche distributions recorded in vivo. BMC Neurosci 10:40. 10.1186/1471-2202-10-40 [DOI] [PMC free article] [PubMed] [Google Scholar]
- Priesemann V, Wibral M, Valderrama M, Pröpper R, Le Van Quyen M, Geisel T, Triesch J, Nikolić D, Munk MHJ (2014) Spike avalanches in vivo suggest a driven, slightly subcritical brain state. Front Syst Neurosci 8:108. 10.3389/fnsys.2014.00108 [DOI] [PMC free article] [PubMed] [Google Scholar]
- Ren X, Brodovskaya A, Hudson JL, Kapur J (2021) Connectivity and neuronal synchrony during seizures. J Neurosci 41:7623–7635. 10.1523/JNEUROSCI.0669-21.2021 [DOI] [PMC free article] [PubMed] [Google Scholar]
- Romano SA, Pietri T, Pérez-Schuster V, Jouary A, Haudrechy M, Sumbre G (2015) Spontaneous neuronal network dynamics reveal circuit's functional adaptations for behavior. Neuron 85:1070–1085. 10.1016/j.neuron.2015.01.027 [DOI] [PMC free article] [PubMed] [Google Scholar]
- Rosch R, Burrows DRW, Jones LB, Peters CH, Ruben P, Samarut É (2019) Functional genomics of epilepsy and associated neurodevelopmental disorders using simple animal models: from genes, molecules to brain networks. Front Cell Neurosci 13:556. 10.3389/fncel.2019.00556 [DOI] [PMC free article] [PubMed] [Google Scholar]
- Rosenstein MT, Collins JJ, De Luca CJ (1993) A practical method for calculating largest Lyapunov exponents from small data sets. Physica D 65:117–134. 10.1016/0167-2789(93)90009-P [DOI] [Google Scholar]
- Rubinov M, Sporns O, Thivierge JP, Breakspear M (2011) Neurobiologically realistic determinants of self-organized criticality in networks of spiking neurons. PLoS Comput Biol 7:e1002038. 10.1371/journal.pcbi.1002038 [DOI] [PMC free article] [PubMed] [Google Scholar]
- Sato S, Sano M, Sawada Y (1987) Practical methods of measuring the generalized dimension and the largest Lyapunov exponent in high dimensional chaotic systems. Prog Theoret Phys 77:1–5. 10.1143/PTP.77.1 [DOI] [Google Scholar]
- Schartner M, Seth A, Noirhomme Q, Boly M, Bruno M-A, Laureys S, Barrett A (2015) Complexity of multi-dimensional spontaneous EEG decreases during propofol induced general anaesthesia. PLoS One 10:e0133532. 10.1371/journal.pone.0133532 [DOI] [PMC free article] [PubMed] [Google Scholar]
- Schevon CA, Weiss SA, McKhann G, Goodman RR, Yuste R, Emerson RG, Trevelyan AJ (2012) Evidence of an inhibitory restraint of seizure activity in humans. Nat Commun 3:1060. 10.1038/ncomms2056 [DOI] [PMC free article] [PubMed] [Google Scholar]
- Sessolo M, Marcon I, Bovetti S, Losi G, Cammarota M, Ratto GM, Fellin T, Carmignoto G (2015) Parvalbumin-positive inhibitory interneurons oppose propagation but favor generation of focal epileptiform activity. J Neurosci 35:9544–9557. 10.1523/JNEUROSCI.5117-14.2015 [DOI] [PMC free article] [PubMed] [Google Scholar]
- Sethna JP, Dahmen KA, Myers CR (2001) Crackling noise. Nature 410:242–250. 10.1038/35065675 [DOI] [PubMed] [Google Scholar]
- Shen KF, Yang XL, Liu GL, Zhu G, Wang ZK, Shi XJ, Wang TT, Wu ZF, Lv SQ, Liu SY, Yang H, Zhang CQ (2021) The role of voltage-gated chloride channels in the epileptogenesis of temporal lobe epilepsy. EBioMedicine 70:103537. 10.1016/j.ebiom.2021.103537 [DOI] [PMC free article] [PubMed] [Google Scholar]
- Shew WL, Yang H, Petermann T, Roy R, Plenz D (2009) Neuronal avalanches imply maximum dynamic range in cortical networks at criticality. J Neurosci 29:15595–15600. 10.1523/JNEUROSCI.3864-09.2009 [DOI] [PMC free article] [PubMed] [Google Scholar]
- Shimoda Y, Magloire V, Marvin JS, Leite M, Looger LL, Kullmann DM (2020) Extracellular glutamate and GABA transients at the transition from interictal spiking to seizures. bioRxiv 381707. 10.1101/2020.11.13.381707. [DOI] [PMC free article] [PubMed] [Google Scholar]
- Shuman T, et al. (2020) Breakdown of spatial coding and interneuron synchronization in epileptic mice. Nat Neurosci 23:229–238. 10.1038/s41593-019-0559-0 [DOI] [PMC free article] [PubMed] [Google Scholar]
- Sloviter RS (1987) Decreased hippocampal inhibition and a selective loss of interneurons in experimental epilepsy. Science 235:73–76. 10.1126/science.2879352 [DOI] [PubMed] [Google Scholar]
- Smith EH, Liou J, Davis TS, Merricks EM, Kellis SS, Weiss SA, Greger B, House PA, McKhann GM II, Goodman RR, Emerson RG, Bateman LM, Trevelyan AJ, Schevon CA (2016) The ictal wavefront is the spatiotemporal source of discharges during spontaneous human seizures. Nat Commun 7:11098. 10.1038/ncomms11098 [DOI] [PMC free article] [PubMed] [Google Scholar]
- Sperling MR (2004) The consequences of uncontrolled epilepsy. CNS Spectr 9:98–101, 106–109. 10.1017/s1092852900008464 [DOI] [PubMed] [Google Scholar]
- Spitzner FP, Dehning J, Wilting J, Hagemann A, Neto JP, Zierenberg J, Priesemann V (2021) MR. Estimator, a toolbox to determine intrinsic timescales from subsampled spiking activity. PLoS One 16:e0249447. 10.1371/journal.pone.0249447 [DOI] [PMC free article] [PubMed] [Google Scholar]
- Staley KJ (2006) Wrong-way chloride transport: is it a treatable cause of some intractable seizures? Epilepsy Curr 6:124–127. 10.1111/j.1535-7511.2006.00119.x [DOI] [PMC free article] [PubMed] [Google Scholar]
- Stimberg M, Brette R, Goodman DF (2019) Brian 2, an intuitive and efficient neural simulator. Elife 8:e47314. 10.7554/eLife.47314 [DOI] [PMC free article] [PubMed] [Google Scholar]
- Stringer C, Pachitariu M, Steinmetz N, Carandini M, Harris KD (2019) High-dimensional geometry of population responses in visual cortex. Nature 571:361–365. 10.1038/s41586-019-1346-5 [DOI] [PMC free article] [PubMed] [Google Scholar]
- Stumpf MPH, Porter MA (2012) Critical truths about power laws. Science 335:665–666. 10.1126/science.1216142 [DOI] [PubMed] [Google Scholar]
- Suryadi, Ramaswamy M, Jesuthasan S, Chew LY (2018) Features of criticality are asymmetric in the zebrafish habenula. bioRxiv 481358. 10.1101/481358. [DOI] [Google Scholar]
- Tabor KM, Marquart GD, Hurt C, Smith TS, Geoca AK, Bhandiwad AA, Subedi A, Sinclair JL, Rose HM, Polys NF, Burgess HA (2019) Brain-wide cellular resolution imaging of Cre transgenic zebrafish lines for functional circuit-mapping. Elife 8:e42687. 10.7554/eLife.42687 [DOI] [PMC free article] [PubMed] [Google Scholar]
- Tagliazucchi E, Balenzuela P, Fraiman D, Chialvo DR (2012) Criticality in large-scale brain fMRI dynamics unveiled by a novel point process analysis. Front Physiol 3:15. 10.3389/fphys.2012.00015 [DOI] [PMC free article] [PubMed] [Google Scholar]
- Takens F (1981) Detecting strange attractors in turbulence. In: Dynamical systems and turbulence, Warwick 1980. (Rand D and Young LS, eds.), pp 366–381. New York: Springer. [Google Scholar]
- Tetzlaff C, Okujeni S, Egert U, Wörgötter F, Butz M (2010) Self-organized criticality in developing neuronal networks. PLoS Comput Biol 6:e1001013. 10.1371/journal.pcbi.1001013 [DOI] [PMC free article] [PubMed] [Google Scholar]
- Theis L, Berens P, Froudarakis E, Reimer J, Román Rosón M, Baden T, Euler T, Tolias AS, Bethge M (2016) Benchmarking spike rate inference in population calcium imaging. Neuron 90:471–482. 10.1016/j.neuron.2016.04.014 [DOI] [PMC free article] [PubMed] [Google Scholar]
- Tokudome K, Okumura T, Shimizu S, Mashimo T, Takizawa A, Serikawa T, Terada R, Ishihara S, Kunisawa N, Sasa M, Ohno Y (2016) Synaptic vesicle glycoprotein 2A (SV2A) regulates kindling epileptogenesis via GABAergic neurotransmission. Sci Rep 6:27420. 10.1038/srep27420 [DOI] [PMC free article] [PubMed] [Google Scholar]
- Touboul J, Destexhe A (2017) Power-law statistics and universal scaling in the absence of criticality. Phys Rev E 95:012413. 10.1103/PhysRevE.95.012413 [DOI] [PubMed] [Google Scholar]
- Trevelyan AJ, Baldeweg T, van Drongelen W, Yuste R, Whittington M (2007) The source of afterdischarge activity in neocortical tonic–clonic epilepsy. J Neurosci 27:13513–13519. 10.1523/JNEUROSCI.3005-07.2007 [DOI] [PMC free article] [PubMed] [Google Scholar]
- Trevelyan AJ, Sussillo D, Watson BO, Yuste R (2006) Modular propagation of epileptiform activity: evidence for an inhibitory veto in neocortex. J Neurosci 26:12447–12455. 10.1523/JNEUROSCI.2787-06.2006 [DOI] [PMC free article] [PubMed] [Google Scholar]
- Truccolo W, Donoghue JA, Hochberg LR, Eskandar EN, Madsen JR, Anderson WS, Brown EN, Halgren E, Cash SS (2011) Single-neuron dynamics in human focal epilepsy. Nat Neurosci 14:635–641. 10.1038/nn.2782 [DOI] [PMC free article] [PubMed] [Google Scholar]
- Upreti C, Otero R, Partida C, Skinner F, Thakker R, Pacheco LF, Zhou Z, Maglakelidze G, Velíšková J, Velíšek L, Romanovicz D, Jones T, Stanton PK, Garrido-Sanabria ER (2012) Altered neurotransmitter release, vesicle recycling and presynaptic structure in the pilocarpine model of temporal lobe epilepsy. Brain 135:869–885. 10.1093/brain/awr341 [DOI] [PMC free article] [PubMed] [Google Scholar]
- Uva L, Saccucci S, Chikhladze M, Tassi L, Gnatkovsky V, Milesi G, Morbin M, de Curtis M (2017) A novel focal seizure pattern generated in superficial layers of the olfactory cortex. J Neurosci 37:3544–3554. 10.1523/JNEUROSCI.2239-16.2016 [DOI] [PMC free article] [PubMed] [Google Scholar]
- van Ooyen A, Butz-Ostendorf M (2019) Homeostatic structural plasticity can build critical networks. In: The functional role of critical dynamics in neural systems. (Tomen N, Herrmann JM, and Ernst U eds.), pp 117–137. New York: Springer International Publishing. [Google Scholar]
- Vannini E, Restani L, Dilillo M, McDonnell LA, Caleo M, Marra V (2020) Synaptic vesicles dynamics in neocortical epilepsy. Front Cell Neurosci 14:606142. 10.3389/fncel.2020.606142 [DOI] [PMC free article] [PubMed] [Google Scholar]
- Vezzani A, Ravizza T, Bedner P, Aronica E, Steinhäuser C, Boison D (2022) Astrocytes in the initiation and progression of epilepsy. Nat Rev Neurol 18:707–722. 10.1038/s41582-022-00727-5 [DOI] [PMC free article] [PubMed] [Google Scholar]
- Weiss SA, Banks GP, McKhann GM Jr, Goodman RR, Emerson RG, Trevelyan AJ, Schevon CA (2013) Ictal high frequency oscillations distinguish two types of seizure territories in humans. Brain 136:3796–3808. 10.1093/brain/awt276 [DOI] [PMC free article] [PubMed] [Google Scholar]
- Wenzel M, Hamm JP, Peterka DS, Yuste R (2019a) Acute focal seizures start as local synchronizations of neuronal ensembles. J Neurosci 39:8562–8575. 10.1523/JNEUROSCI.3176-18.2019 [DOI] [PMC free article] [PubMed] [Google Scholar]
- Wenzel M, Han S, Smith EH, Hoel E, Greger B, House PA, Yuste R (2019b) Reduced repertoire of cortical microstates and neuronal ensembles in medically induced loss of consciousness. Cell Syst 8:467–474.e4. 10.1016/j.cels.2019.03.007 [DOI] [PMC free article] [PubMed] [Google Scholar]
- Wildie M, Shanahan M (2012) Metastability and chimera states in modular delay and pulse-coupled oscillator networks. Chaos 22:043131. 10.1063/1.4766592 [DOI] [PubMed] [Google Scholar]
- Wilting J, Priesemann V (2018) Inferring collective dynamical states from widely unobserved systems. Nat Commun 9:2325. 10.1038/s41467-018-04725-4 [DOI] [PMC free article] [PubMed] [Google Scholar]
- Wu W, Li Y, Wei Y, Bosco DB, Xie M, Zhao M-G, Richardson JR, Wu L-J (2020) Microglial depletion aggravates the severity of acute and chronic seizures in mice. Brain Behav Immun 89:245–255. 10.1016/j.bbi.2020.06.028 [DOI] [PMC free article] [PubMed] [Google Scholar]
- Ying T, Grayden DB, Burkitt AN, Kameneva T (2015) An increase in the extracellular potassium concentration can cause seizures. BMC Neurosci 16:P113. 10.1186/1471-2202-16-S1-P113 [DOI] [Google Scholar]
- Zeraati R, Priesemann V, Levina A (2021) Self-organization toward criticality by synaptic plasticity. Front Phys 9:619661. 10.3389/fphy.2021.619661 [DOI] [Google Scholar]
- Zhang W, Huguenard JR, Buckmaster PS (2012) Increased excitatory synaptic input to granule cells from hilar and CA3 regions in a rat model of temporal lobe epilepsy. J Neurosci 32:1183–1196. 10.1523/JNEUROSCI.5342-11.2012 [DOI] [PMC free article] [PubMed] [Google Scholar]
- Zierenberg J, Wilting J, Priesemann V, Levina A (2020) Description of spreading dynamics by microscopic network models and macroscopic branching processes can differ due to coalescence. Phys Rev E 101:022301. 10.1103/PhysRevE.101.022301 [DOI] [PubMed] [Google Scholar]
Associated Data
This section collects any data citations, data availability statements, or supplementary materials included in this article.
Supplementary Materials
Spontaneous activity. GCaMP6s calcium imaging of a single plane from a representative period of spontaneous activity. Acquisition speed = 2.73 frames/s. Movie is played at 2× acquisition.
Brain activity following exposure to 5 mm PTZ. GCaMP6s calcium imaging of a single plane from a representative period of brain activity following administration of 5mM PTZ. Acquisition speed = 2.73 frames/s. Movie is played at 2× acquisition.
Brain activity following exposure to 20 mm PTZ. GCaMP6s calcium imaging of a single plane from a representative period of brain activity following administration of 20 mm PTZ. Acquisition speed = 2.73 frames/s. Movie is played at 2× acquisition.