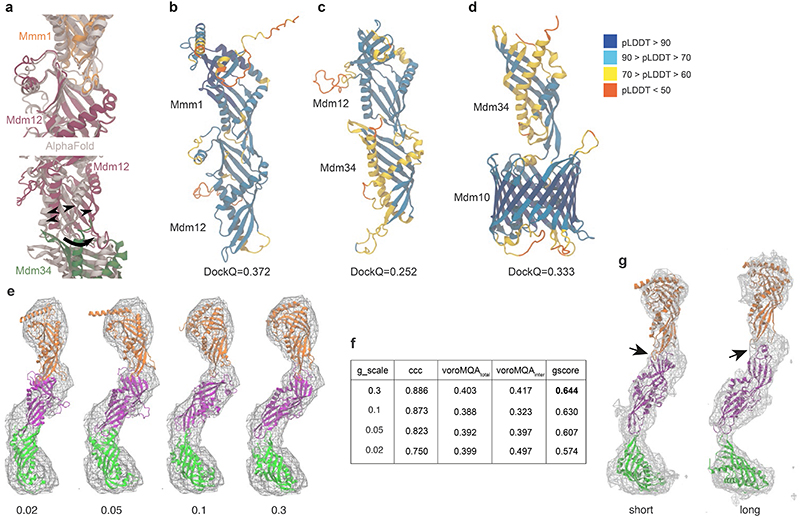
Extended Data Figure 8. Integrative modelling of the ERMES complex.
a: Differences between FD (in colour) and AF multimer (grey) predicted structures. While initial predictions of the complex structure using AF multimer27,65 and FD26 yield a nearly identical Mmm1-Mdm12 interface, the Mdm12-Mdm34 FD-interface shows a larger aperture (black arrowheads) which tends to close upon fitting to the cryo-ET STA map (black arrow). This difference between AF and FD highlights a lack of dynamic information as a current limitation of structural prediction. b-d: Quality estimation of the dimer predictions (Mmm1/Mdm12, Mdm12/Mdm34, Mdm34/Mdm10) using the FoldDock (FD) protocol. For each protein, the local pLDDT score is shown, together with the overall DockQ score of the dimer. For all protein-protein interfaces, the DockQ score is above the value generally considered to successfully predict heteromeric interfaces (DockQ>0.23)26,65. e: Final conformations of the trimeric Mmm1-Mdm12-Mdm34 complex, obtained from the MDFF simulations including 4 POPE lipids after fitting with different scaling factors (g_scale, numerical values given below models). The scaling factor determines the weight of the experimental STA map on the total molecular potential. f: Assessment of MDFF-derived models obtained using different scaling factors, shown in panel e. ccc refers to the cross-correlation coefficient between map and model, voroMQAtotal and voroMQAinter refer to the global voroMQA score and the component including only inter-subunit contacts, respectively. Based on the gscore which combines the assessment parameters (see Methods), g_scale=0.3 was considered best and is thus shown in other figures. g: Models obtained when the conformation of the Mmm1-Mdm12-Mdm34 complex was biased by MDFF into the short (left) and long (right) STA maps. The interaction between Mmm1 and Mdm12 (indicated by black arrows) appears to be diminished in the long conformation. In both cases, the model contained 4 lipids and the scaling factor was g_scale=0.1 See also Supplementary Table 1.

