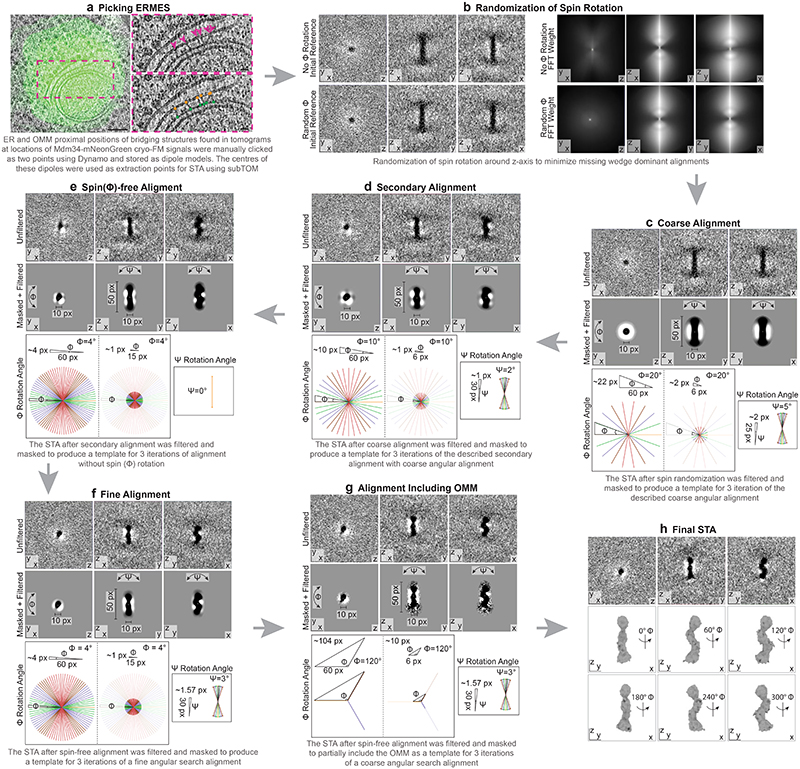
Extended Data Figure 3. Subtomogram averaging pipeline.
The strategy using sequential alignment steps is outlined in steps a - h. The data set consisted of manually picked coordinates of the ER and OMM anchor points of 1098 bridge structures from 51 electron cryo-tomograms at positions of Mdm34-mNeonGreen signals. The resolution of the final STA map is potentially affected by a minor fraction of bridge-like particles of different identity, which could contribute noise. Images in a are the same as shown in Fig. 2b and c, with modifications to the overlay. Scale bars in a are 100 nm (left image) and 20 nm (images in pink dashed boxes).

