Abstract
The implementation of recommendations for type 2 diabetes (T2D) screening and diagnosis focuses on the measurement of glycated hemoglobin (HbA1c) and fasting glucose. This approach leaves a large number of individuals with isolated impaired glucose tolerance (iIGT), who are only detectable through oral glucose tolerance tests (OGTTs), at risk of diabetes and its severe complications. We applied machine learning to the proteomic profiles of a single fasted sample from 11,546 participants of the Fenland study to test discrimination of iIGT defined using the gold-standard OGTTs. We observed significantly improved discriminative performance by adding only three proteins (RTN4R, CBPM and GHR) to the best clinical model (AUROC = 0.80 (95% confidence interval: 0.79–0.86), P = 0.004), which we validated in an external cohort. Increased plasma levels of these candidate proteins were associated with an increased risk for future T2D in an independent cohort and were also increased in individuals genetically susceptible to impaired glucose homeostasis and T2D. Assessment of a limited number of proteins can identify individuals likely to be missed by current diagnostic strategies and at high risk of T2D and its complications.
Introduction
Current clinical guidelines for type 2 diabetes (T2D) screening and diagnosis are based on glycated haemoglobin (HbA1c) and fasting glucose (FG) levels for reasons of practicality; however alternative tests can be used1,2. Globally, over 7.5% of adults have impaired glucose tolerance (IGT)3 with increased prevalence reported in older individuals4 and specific ethnic groups, such as people from Southeast Asia5. A substantial proportion of people with IGT (28 – 86%)6–8 can only be identified through oral glucose tolerance tests (OGTTs), which are inconvenient and time-consuming. Individuals with isolated IGT (iIGT), that is, 2-h plasma glucose (2hPG) ≥7.8 and < 11.1 mmol/L but normal HbA1c and FG, remain undetected by current T2D detection strategies9–12 but are at a very high risk of developing diabetes (annualized T2D relative risk of 5.5 compared to normoglycemic individuals)13 and presenting with its severe micro- and macrovascular complications9–12,14. Compared to individuals with fasting hyperglycaemia, mortality is twice as high in the iIGT group over a period of 46 5 to 12 years15,16.
Small proof-of-concept studies in cohorts of high-risk individuals have demonstrated the value of deep molecular profiling for early identification of pathways that are differentially regulated between individuals with and without insulin resistance17,18 and to guide its prediction19. Deep profiling of the plasma proteome at population scale has become possible through aptamer-based affinity assays20. The systematic study of the circulating proteome promises to improve strategies for prediction and diagnosis18 as well as aetiological understanding, including identification of novel pathways leading to T2D and refinement of aetiological subtypes.
Because of the high global prevalence of IGT and iIGT, their severe complications, and the currently unmet need of screening strategies that can identify iIGT without a challenge test, we used machine learning to test whether large-scale proteomic profiling of a single fasted sample could identify individuals with iIGT and improve current clinical models. We then tested whether the most discriminatory proteins were affected by fasting status, to assess the feasibility of using non-fasted samples to identify iIGT. To gain insights into IGT and iIGT aetiology, we 1) identified and characterised biochemical, phenotypic, and anthropometric influences on discriminatory proteins, 2) investigated whether their plasma levels were associated with the risk of future T2D in two independent prospective cohorts and 3) tested the influence of genetic susceptibility to T2D or related phenotypes on protein levels.
Results
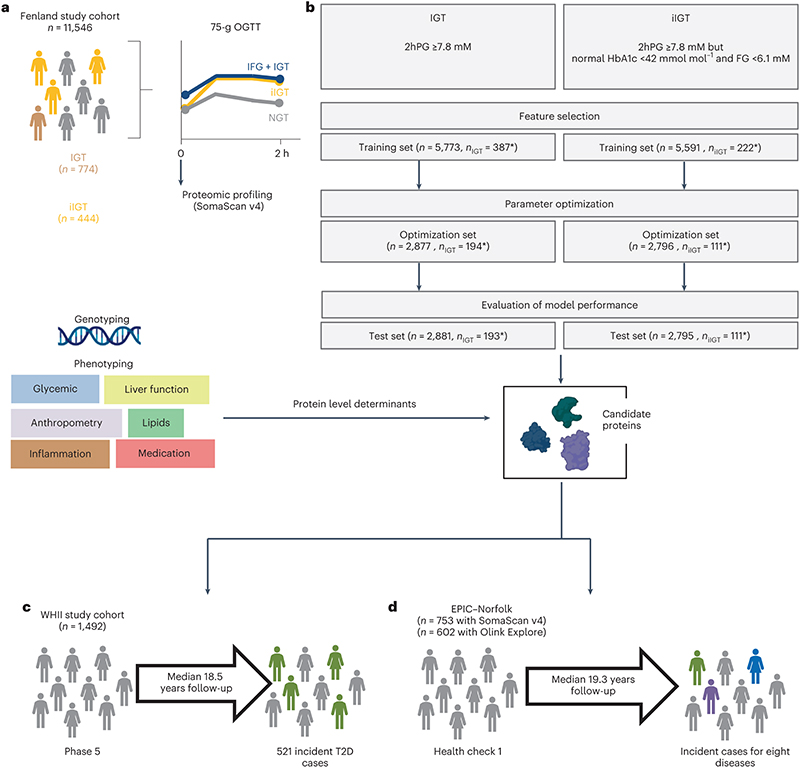
We used an aptamer-based assay to target 4,775 distinct fasting plasma proteins by 4,979 aptamers in 11,546 participants (5,389 men and 6,157 women) without diagnosed diabetes from the contemporary Fenland study21 (baseline visit in 2005-2015, mean age 48.5 years (7.5 s.d.), Supplementary Table 1), as previously described18 (Methods). Participants completed a 75-g OGTT (Figure 1a). We defined isolated post challenge hyperglycaemia as 2hPG ≥7.8 mM but HbA1c <42mmol mol–1 and FG <6.1 mM. This definition captured all participants with iIGT (2hPG of 7.8-11.1mM but HbA1c <42mmol mol–1 and FG <6.1 mM) as well as participants with isolated post-challenge hyperglycaemia in the diabetic range (2hPG ≥ 11.1 mM but HbA1c <42mmol mol–1 and FG <6.1 mM, n=117), that is, high-risk individuals missed by standard FG and HbA1c testing. For simplicity, we refer from here on to IGT (or iIGT) for all individuals with 2hPG ≥ 7.8 mM, without specifically distinguishing post-challenge hyperglycaemia ≥ 11.1 mM. We used a least absolute shrinkage and selection operator (LASSO) regression framework implemented as a three-step approach, including independent feature selection (50% sample size), optimization (25%) and validation (25%) to discriminate IGT (prevalence 6.7%) and iIGT (3.9%) based on fasting assessment of 4,775 proteins (targeted by 4,979 aptamers) (Figure 1b). We defined highly discriminatory proteins as those selected in >80%, 90%, or 95% of bootstrap subsamples of the study population during feature selection (Extended Data Figure 1).
Figure 1. Study design.
a,Proteomic profiling was done in fasting plasma samples from participants from the Fenland cohort that had undergone an OGTT. b, Three-step modelling framework for IGT and iIGT classification. The asterisk denotes the difference in cases due to exclusion of non-isolated IGT for iIGT prediction. c, Association of top discriminatory proteins with incident T2D was assessed in the WHII study. d, Association of iIGT protein scores with eight incident cardiometabolic diseases was assessed in a sub-cohort of the EPIC-Norfolk study. IFG: impaired fasting glucose, NGT: normal glucose tolerance.
Proteomic signatures to discriminate IGT and IIGT
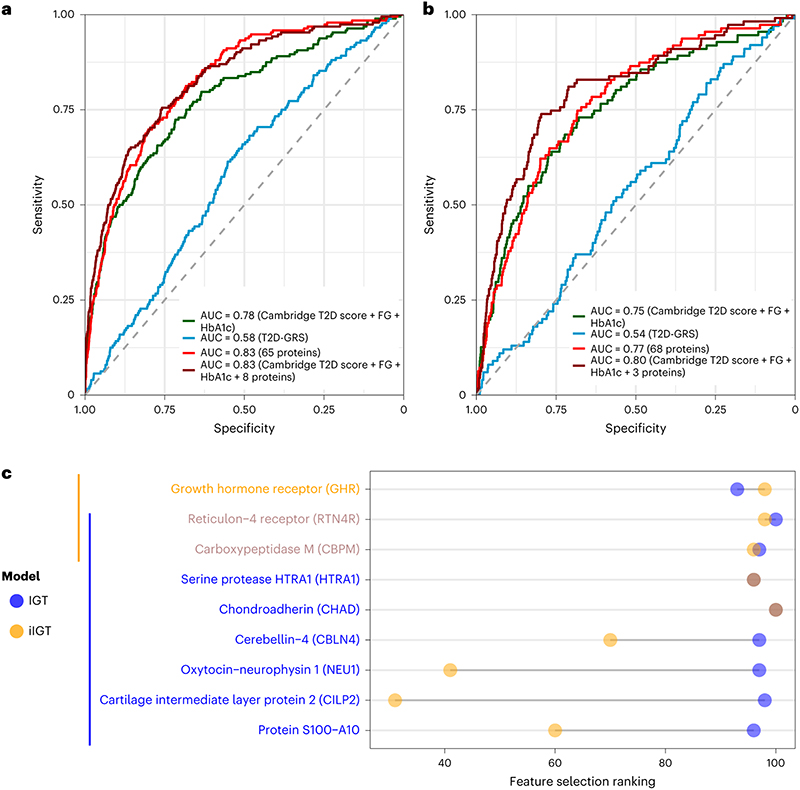
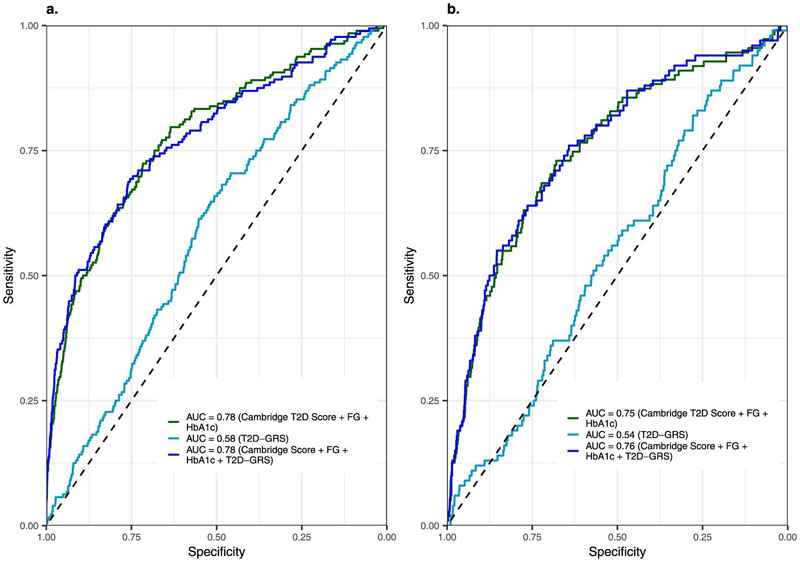
We identified 65 and 68 proteins that achieved an area under the receiver operating characteristic curve (AUROC) (95% confidence interval) of 0.83 (0.80 – 0.86) and 0.77 (0.72 – 0.81) , respectively, for discrimination of IGT and iIGT in the independent validation set (Extended Data Figure 2, Supplementary Tables 2 and 3). This represented a significantly better predictor when compared to the performance of a T2D genetic risk score (T2D-GRS, AUROCIGT 0.58 (0.52 – 0.63), AUROCiIGT 0.54 (0.49 – 0.60)) (Figure 2a and b, and Extended Data Figure 3). Protein-based models further outperformed the standard patient information-based model (based on the Cambridge T2D risk score including age, sex, family history of diabetes, smoking status, prescription of steroid or antihypertensive medication and body mass index (BMI))22 (AUROCIGT = 0.71 (0.67 – 0.75); AUROCiIGT = 0.71 (0.66 – 0.76)) and the standard clinical model that additionally included blood test results, that is, FPG and HbA1c (AUROCIGT= 0.78 (0.74 – 0.82); AUROCiIGT=0.75 (0.70 – 0.80)) (Figure 2a and b, Supplementary Table 4).
Figure 2. Performance of LASSO trained models for impaired glucose tolerance (a) and isolated impaired glucose tolerance (b) discrimination in the internal validation test set.
a,IGT discrimination performance in the independent internal validation test set (N=2881, 192 IGT individuals) for the standard clinical model (Cambridge T2D risk Score + FPG + HbA1c), a 65-protein model and a clinical + 8 protein model. b, iIGT discrimination performance in the independent internal validation test set (N=2795, 111 iIGT individuals) for the standard clinical model, a 68-protein model and a clinical + 3 protein model. c, Comparison of protein ranking during feature selection for iIGT (N=2795, 111 iIGT individuals) and IGT (N=2881, 192 IGT individuals) top discriminatory proteins. AUC, area under the curve.
Considering a limited set of the most informative proteins that were identified by the feature selection framework (Methods), discrimination was still superior to the standard clinical model adding only eight proteins for IGT (AUROCIGT 0.83 (0.80 – 0.86), p-value = 4.13 × 10⁻⁵, Figure 2a, Supplementary Table 2) and three proteins for iIGT (AUROCiIGT 0.80 (0.76 – 0.85), p-value = 0.004, Figure 2b, Supplementary Table 3), including two proteins (reticulon-4 receptor (RTN4R) and Carboxypeptidase M (CBPM)) selected for both (Figure 2c, Supplementary Table 523–33). The weights for the variables included in these final models are available in Supplementary Table 6. We observed significant improvement over and above the clinical model of similar magnitude in the independent Whitehall II (WHII) study (Supplementary Table 7 and 8, Extended Data Figure 4).
To identify participants with iIGT and IGT, we chose a cut-off for the clinical + protein model that optimized sensitivity (recall) at 0.70 and 0.71, respectively, which yielded a positive predicted value (precision) of 0.20 and 0.13, respectively. The net reclassification index was higher for the final iIGT model (14.5%) compared to IGT (6.5%), consistent with the current lack of informative predictors.
Of the nine distinct proteins included in the two final models, eight were not significantly affected by fasting status (Methods) with maximum postprandial fold changes ranging between 0.07 and 0.16; only HTRA1 showed some evidence of a post-prandial increase (maximum fold change= 0.15, p-value=0.004, Supplementary Table 9).
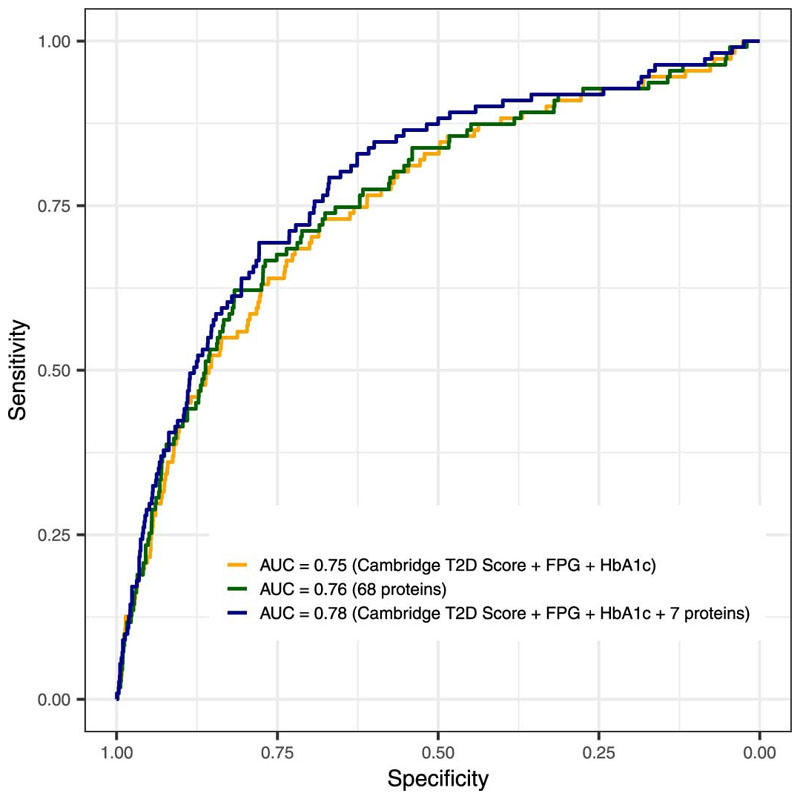
Finally, we tested model performance de novo omitting the three most informative proteins to predict iIGT. The new model included seven proteins and still performed significantly better than the best clinical model (AUROC = 0.78 (0.73 – 0.83), p-value = 0.04, Extended Data Figure 5). This finding illustrates redundancy in the protein biomarkers available to select from for iIGT prediction, providing practical benefits for clinical implementation, for example, with regard to flexibility of prioritizing choice of proteins more easily targeted by clinical chemistry assays and least affected by fasting status or sample handling.
Proteomically informed screening strategies
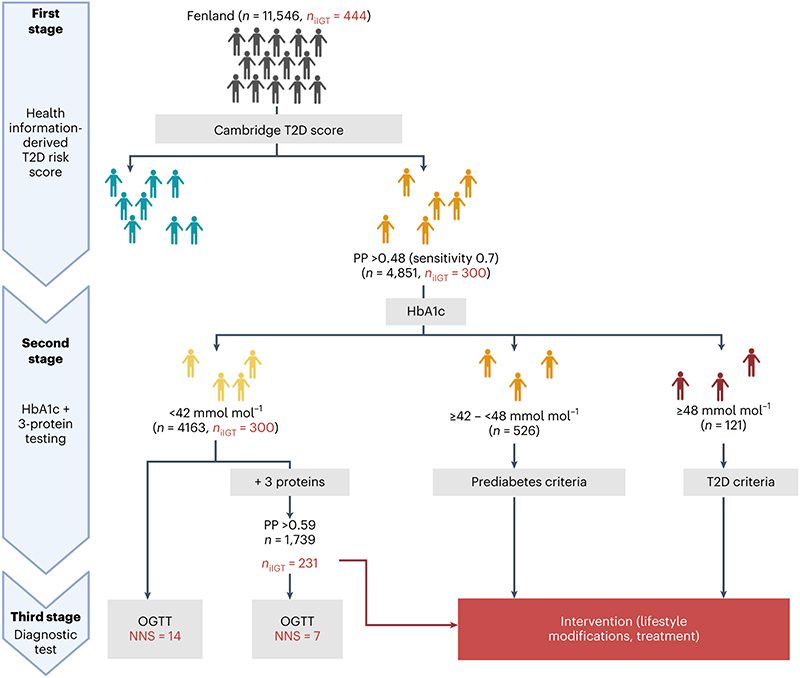
We calculated the numbers needed to screen (NNS) to determine how many OGTTs would need to be performed to identify one participant with iIGT using a three-stage screening approach (Figure 3). We stratified all Fenland individuals based on the patient-derived information model in the first instance and based on their HbA1c levels and the three-protein iIGT model in the second instance (Methods). According to current guidelines2, individuals at high predicted risk based on the patient-derived information model, but but who have HbA1c levels below the cutoffs for prediabetes or T2D2 would not be considered for further testing (N Fenland = 4163, NNS = 14, Figure 3). Applying the clinical + three-protein iIGT model on this group enabled identification of a high-risk subgroup (N = 1739) in which application of an OGTT should be considered, because the NNS was only 7 to identify one additional individual with iIGT (Figure 3, Supplementary Table 10). Hence, our proposed approach identified an additional >30% of individuals who would be reclassified (as having prediabetes) and could be offered preventative interventions, that is, a substantial proportion of high-risk individuals who would otherwise be missed by current strategies. To test for potential bias in the NNS estimates arising from overfitting, we applied the same screening algorithm in the test set only, which provided internal validation for the estimates and results from the entire Fenland set (Extended Data Figure 6).
Figure 3. Proposed 3-stage screening strategy.
In the first stage, individuals in the entire of Fenland were divided into those with low and high risk according to the Cambridge T2D risk score. The high-risk group would undergo a second stage involving measurement of HbA1c and of the three iIGT-associated proteins. Individuals with HbA1c levels within the T2D or prediabetic range would be referred for intervention and lifestyle modifications. Individuals with HbA1c below the prediabetic range, would be further stratified using the final clinical + three-iIGT protein model to identify a high-risk group, which on a third stage would be taken forward for OGTT testing to identify iIGT cases that would have otherwise been missed by current screening guidelines. The figure was designed with BioRender.com.
Characterisation of discriminatory proteins
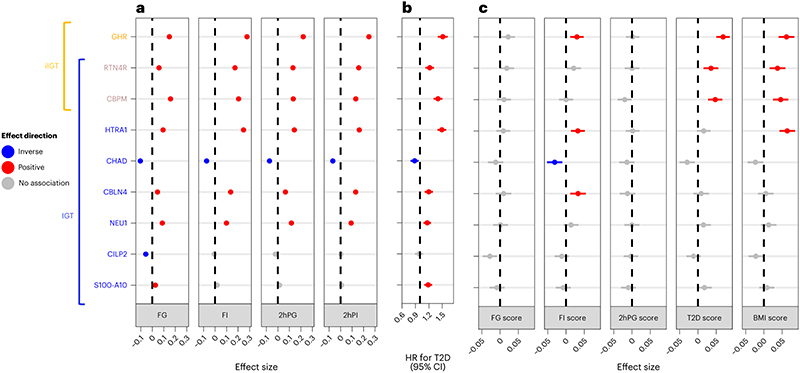
To investigate whether increased genetic risk of diabetes and related metabolic risk factors affects the abundances of the identified proteins, we compared their plasma levels in individuals with higher versus lower genetic risk based on the GRS for T2D33 and related endophenotypes, including FG34 , fasting insulin (FI)34, 2hPG34, andBMI35, using linear regression models. We found evidence of significant, directionally concordant associations between genetic susceptibility to these phenotypes and plasma abundance for four of the nine most predictive IGT and iIGT proteins, (p-value < 0.001,Figure 4c). Plasma abundances of growth hormone receptor (GHR), RTN4R, CBPM and the serine protease HTRA1 was associated with genetic susceptibility to more than one of these phenotypes, including FI, T2D and BMI.
Figure 4. Characterization of the association between top impaired glucose tolerance and isolated impaired glucose tolerance discriminatory proteins and glycaemic traits, future T2D risk and genetic predisposition to metabolic phenotypes.
a,Association of top IGT and iIGT discriminatory proteins with fasting and 2-hour glucose and insulin in the Fenland study (N = 10259 individuals). Beta estimates with 95% CIs are shown. b, Association of top IGT and iIGT discriminatory proteins with incident T2D in the WHII study (N = 1492, 521 incident T2D cases). Hazard ratios (HR) with 95% CIs are shown. c, Association of GRSs for FG, FI, 2hPG, T2D and BMI with top IGT and iIGT discriminatory proteins in the Fenland study (N = 7973 individuals). Beta estimates with a 95% CIs are shown.
The three most predictive iIGT proteins and six of the eight most predictive IGT proteins were significantly associated with higher measured concentrations of fasting and 2-h glucose and insulin.
Chondroadherin (CHAD) was the only protein inversely associated with all four measures. From the remaining two IGT predictor proteins, only cartilage intermediate layer protein 2 (CILP2) was significantly inversely associated with FG (p-values<0.001, Figure 3a). In the independent prospective WHII cohort (n = 1,492, including 521 incident T2D cases, Supplementary Table 11), all proteins were significantly associated with an increased risk of developing future T2D, except for CHAD, which was inversely associated (p-value < 0.006, Figure 4b), and CILP2, which showed no significant association. Effect sizes ranged from 0.88 to 1.51 (hazard ratio (HR) for T2D per s.d. difference in the protein target) adjusting for age, sex, and BMI. Associations for HTRA1, GHR, and CBPM remained significant even upon additional adjustment for FG, total triglycerides, high-density lipoprotein (HDL) cholesterol and lipid lowering medication (Supplementary Table 12).
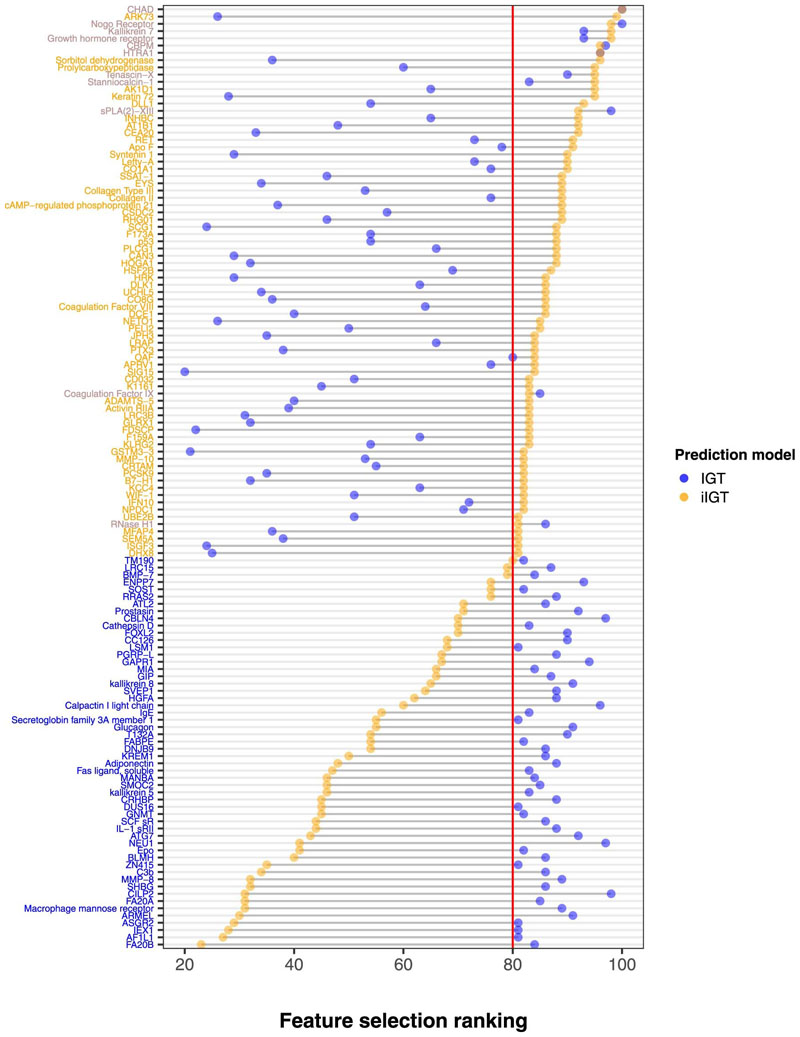
Informative biomarkers are not only relevant to improve screening strategies but can also inform understanding of the separate and shared aetiologies of IGT and iIGT. Comparison of protein ranking from IGT as opposed to iIGT feature selection revealed that most discriminatory proteins differed strongly between the IGT and iIGT selections (Extended Data Figure 7) with only 11 proteins achieving similarly high rankings for both outcomes, that is, being selected in >80% across random subsets of the study population. The top two biological Gene Ontology (GO) term processes differed between the 65-IGT protein signature ('proteolysis' and 'cytokine-mediated signalling pathway' Supplementary Table 13) and the 68-iIGT protein signature ('cartilage development', 'collagen fibril organization' Supplementary Table 14), however, none were significantly enriched following Bonferroni adjustment for multiple comparisons.
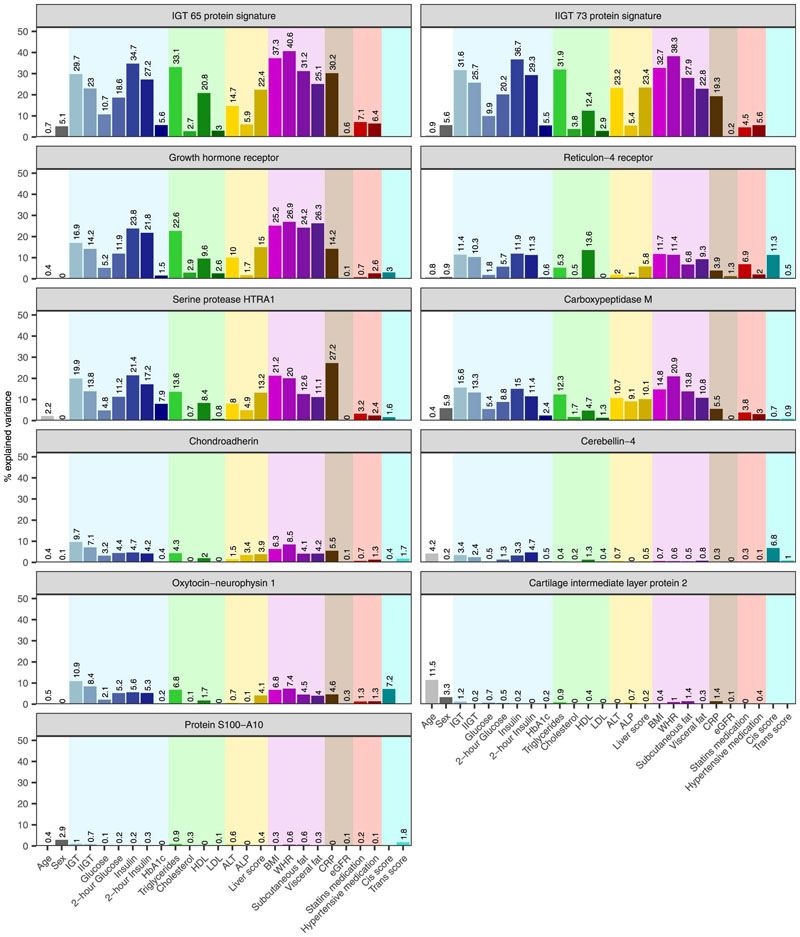
To identify potential differences in factors influencing these IGT and iIGT protein signatures, we computed the proportion of variance in the first principal component ofthe 65-IGT and 68-iIGT protein signatures explained by 24 biochemical, phenotypic, and anthropometric factors. Both signatures had similarly large proportions of explained variance explained by glycaemic (5.2 – 37.8%) and anthropometric (25.1– 40.9%) measures, blood lipids (2.7 – 33.1%), or an ultrasound-based score for hepatic steatosis (22.4 – 24.5%) (Methods). Differences included the higher proportion of variance explained by C-reactive protein (CRP) and the lower proportion explained by alanine aminotransferase (ALT, a biomarker of liver injury) for the 65-IGT compared to the 68-iIGT protein signature (CRP 30.2% vs 20.3% and ALT 14.7% vs 23.2%, respectively; Extended Data Figure 8). Measures related to glucose metabolism (explaining up to 23.8% of the variance) and adiposity (explaining up to 26.9 % of the variance) were identified as the main factors explaining variance in the nine predictive IGT or iIGT proteins included in the final prediction models. Other protein specific factors included total triglycerides (explaining up to 22.6% of GHR), HDL cholesterol (up to 13.6% of RTN4R), measures of hepatic steatosis (liver score explaining up to 15% of GHR) and inflammation (up to 27.2% of HTRA1), as well as genetic variants in the proximity of the relevant protein-encoding gene (up to 11.3% of RTN4R) (Extended Data Figure 8).
Long-term health outcomes associated with predicted iIGT
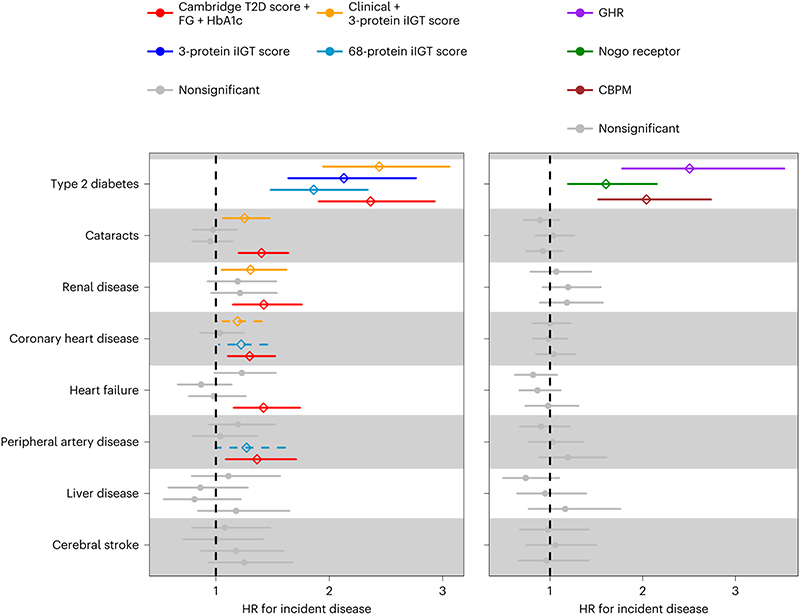
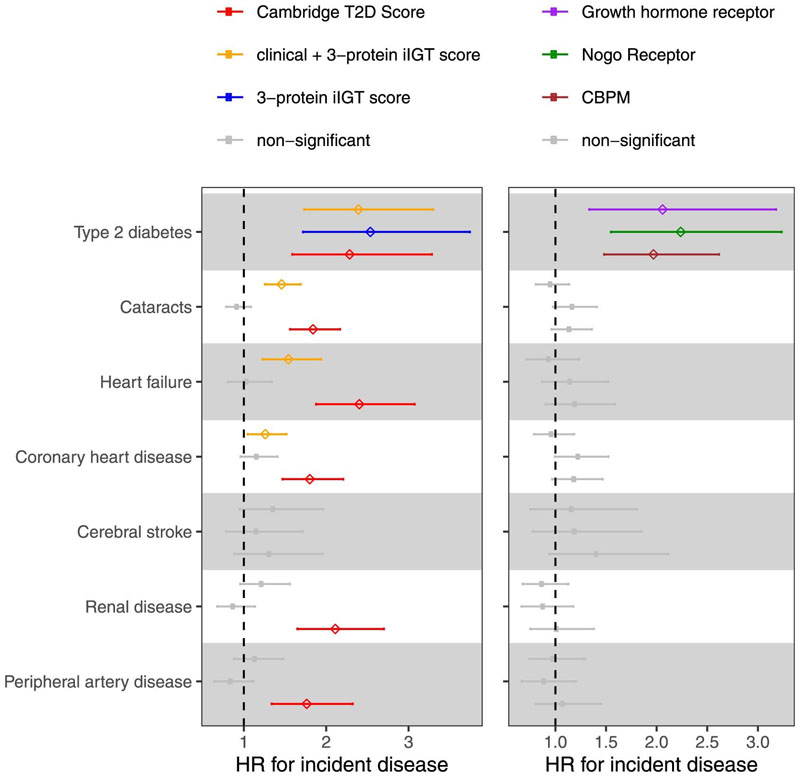
To explore the clinical consequences of isolated impaired glucose tolerance in the absence of an OGTT, we performed an exploratory analysis in a random sub-cohort of the prospective EPIC-Norfolk study37 (n=753). We evaluated associations between predicted probabilities based on 1) the final clinical + 3-protein model, 2) the 3-protein model only and 3) the 68-protein iIGT model with the onset of eight cardiometabolic diseases based on electronic heath record linkage38 (n of incident cases, 30-235; follow-up time between 18 and 19 years; Supplementary Tables 15 - 16). All scores were significantly associated with a greater risk of future T2D (52 incident T2D cases) at 5% false discovery rate (FDR). The iIGT final clinical + three-protein score was further associated with cataracts and renal disease, possibly reflecting the known association between chronically elevated 2hPG levels and micro- or macrovascular complications. Predicted probabilities from the best performing 68-protein-based iIGT-model showed a nominally significant association for coronary artery disease (HR = 1.22, p-value = 0.03) and peripheral artery disease (HR = 1.27, p-value = 0.04), T2D-related complications, although these did not reach statistical significance when adjusting for multiple testing given the small number of incident cases in this small exploratory cohort. We observed significant associations for individual proteins with the risk of future T2D, with effect sizes comparable to those in the WHII study39 (Figure 5).
Figure 5. Association of iIGT protein scores with incident cardiometabolic diseases.
Association of iIGT prediction scores (left panel) or individual top iIGT proteins (right panel) with eight cardiometabolic disease outcomes in a sub-cohort the EPIC-Norfolk study (N=753 individuals). Hazard ratios (HR) with 95% CIs are shown.
We used proteomic measures obtained with a distinct proteomic technique, the Olink Explore panel40 in an independent study (random sub-cohort of the prospective EPIC-Norfolk study, n=602) to test correlation of overlapping protein predictors and to validate some of our findings using an orthogonal technique. We observed a high correlation between the SomaScan and Olink measurements for the top three selected proteins (n=50, Spearman’s r = 0.80 for GHR, 0.70 for RTN4R and 0.87 for CBPM; Pearson’s r = 0.80 for GHR, 0.72 for RTN4R and 0.82 for CBPM). In line with this, we replicated the previously observed associations with an increased risk of incident T2D, including comparable effect sizes, and further observed significant associations between the final clinical + three-protein model and incident cataracts, heart failure, and coronary heart disease (Extended Data Figure 9). These findings suggest cross-platform transferability of our results.
Discussion
Behavioural interventions in individuals with IGT have been shown to delay progression to T2D and reduce the risk of long-term microvascular and macrovascular complications41. However, individuals with iIGT are likely to remain undiagnosed because the current implementation of recommendations for screening and diagnosing T2D does not focus on OGTTs, for reasons of practicality. People with iIGT are at high risk of developing T2D and its associated complications, and failure to identify them can lead to the development of severe and potentially irreversible complications of their unmanaged hyperglycaemia16.
By combining deep plasma proteomic profiling with machine learning, we developed models for improved identification of IGT and iIGT and demonstrated that as few as eight and three proteins, respectively, provided significant improvement over established clinical predictors 22. We provided external validation of the significant and substantial improvement achieved by the selected proteins over and above the stringent benchmark provided by the best clinical model, something rarely done in genomic or other omic prediction studies. The improvement observed in our independent replication study was slightly greater than what was originally observed, and we note that the lack of HbA1c measurements and other differences in study design (previous phases including OGTT screening) and participant characteristics (older and more males on average) of the WHII cohort39 are likely to have contributed to this, leading to a lower AUROC for the clinical model and/or potential misclassification of iIGT.
We propose a three-step screening strategy, in line with the current UK Diabetes Prevention Programmes42, involving risk assessment by 1) a patient-derived information model, 2) measuring HbA1c levels and only three additional proteins from a single spot blood sample, and 3) an OGTT for eventual diagnosis. Implementation of this proposed screening strategy could lead to a large proportion of individuals with iIGT being additionally identified with a lower NNS, compared to the currently recommended two-stage approach42. Our findings illustrate how the identified proteins could most efficiently be integrated into existing screening approaches to identify individuals with iIGT, who are at high risk of T2D and its complications but are currently being missed. Behavioural interventions have shown to be effective at reversing post-load hyperglycaemia independently of FG levels43,44, emphasising the value of identifying individuals with iIGT who would benefit the most from these interventions. We further provided evidence of a link between our developed iIGT predictive scores and incident T2D as well as several known cardiometabolic comorbidities resulting from chronically elevated 2hPG. These findings highlight the potential of applying such a predictive risk score not only for cross-sectional identification of iIGT, but for monitoring future risk for associated comorbidities that impact patients’ quality of life.
We showed that the identified proteins are not strongly affected by fasting status, suggesting that they could enable a simple and convenient strategy to better identify individuals with IGT and iIGT, compared to an OGTT, which requires repeated blood draws conveying additional costs18. Protein assessment could substantially improve the feasibility and acceptability of an improved strategy to identify iIGT, more so than alternative strategies that have been proposed such as a 1-h OGTT45, bringing it in line with existing strategies for the screening and diagnosis of T2D. Because HbA1c testing requires anticoagulated whole blood, usually EDTA, a subset of the same sample type could be processed for plasma preparation to measure discriminatory proteins, avoiding the need for additional blood sampling.
This study provided insights into aetiological differences between iIGT and IGT. Our results suggested a stronger low-grade inflammatory component46–49 among proteins discriminatory for IGT compared to those for iIGT. These proteins might represent refined biomarkers of low-grade inflammation, as they were highlighted as being predictive over and above established inflammatory markers also covered in our proteomic study, such as CRP. At an individual biomarker level, we identified a number of proteins shared or distinctly associated with these metabolic disturbances, including GHR, HTRA1, CBPM, CHAD, cerebellin-4 (CBLN4), oxytocin–neurophysin 1 (NEU1), CILP2 and S100-A10. We used genetic data to provide evidence that early deregulation of diabetes-related pathways is linked to the candidate proteins, most of which were also significantly associated with risk of future development of T2D, providing a novel set of high priority T2D targets for further follow-up and assessment in in more diverse settings and ethnicities.
While our model estimated a meaningful decrease in the NNS, there are important consideration for implementation of the proposed strategy. A considerable proportion of individuals with iIGT were missed by being classified as low risk in either the first or subsequent screening steps. A further limitation of our study was the lack of orthogonal validation of our protein-based prediction models with an alternative proteomic technology. Technical, genetic and other biological factors can result in biased protein measurements due to changes in affinity of the aptamer reagents50. However, the strong correlations observed with the antibody-based Olink Explore panel suggests cross-platform transferability. We further validated the phenotypic association of the iIGT predictive protein scores with incident cardiometabolic diseases using Olink Explore measurements, providing the possibility of implementing our model with alternative proteomic technologies.
In summary, we demonstrated the utility of the plasma proteome to inform strategies for screening of iIGT and for gaining new aetiological insights into early signatures of IGT, a globally very common and clinically important metabolic disorder, but one that it is difficult to detect and treat in routine clinical practice.
Methods
Study Samples
The Fenland study21 is a population-based cohort of 12,435 men and women born between 1950 and 1975 who underwent detailed phenotyping at the baseline visit from 2005-2015. Participants were recruited from general practice surgeries in Cambridge, Ely and Wisbech (UK). Exclusion criteria of the Fenland study included pregnancy, prevalent diabetes, an inability to walk unaided, psychosis, or terminal illness. The study was approved by the Cambridge Local Research Ethics Committee (NRES Committee – East of England Cambridge Central, ref. 04/Q0108/19) and all participants provided written informed consent. The consent covered measurements made from blood samples as well as extends beyond the baseline examination as described previously21.
Clinical assessment
All participants completed a 2-hour 75 g OGTT following an overnight fast. Blood samples were collected at fasting and 2-hour post glucose load in EDTA tubes for plasma separation by centrifugation. Samples were kept at -80°C until further analysis. Glucose (assayed in a Dade Behring Dimension RxL analyser) and insulin (DELFIA® immunoassay, Perkin Elmner) concentrations were measured at fasting and 2-hours, as well as lipid profiles (triglycerides, HDL and total cholesterol), alanine aminotransferase (ALT), alkaline phosphatase (ALP), C-reactive protein (CRP) and serum creatinine (assayed in a Dade Behring Dimension RxL analyser) at fasting, and HbA1c (Tosoh Bioscience, TOSOH G7 analyser).
IGT and T2D were defined by 2-hour glucose according to IEC diagnosis criteria2 as glucose levels between 7.8 and < 11.1 mmol/L (141 and < 199 mg/dL) and ≥ 11.1 mmol/L (≥ 199 mg/dL), respectively. IGT was defined as 2hPG ≥7.8 mmol/L and <11.1 mmol/L, post-challenge hyperglycaemia as 2hPG ≥11.1mmol/L, iIGT as individuals with IGT but HbA1c <42mmol/mol (6%) and FG <6.1 mmol/L (<110mg/dL), and isolated post-challenge hyperglycaemia as individuals with post-challenge hyperglycaemia but HbA1c <42mmol/mol and FG <6.1 mmol/L. The number of individuals with post-challenge hyperglycaemia in the diabetic range (i.e., 2hPG ≥ 11.1 mmol/L) was too low to investigate the performance of our models to identify this group of people with undiagnosed T2D biochemically defined solely due to elevated 2-hour glucose. These individuals would still be missed and remain undiagnosed by FG and HbA1c testing. We therefore used the terms IGT and iIGT to refer to all individuals with 2hPG ≥ 7.8 mmol/L throughout text and in order to develop a model that captures all individuals that would remain undiagnosed by current strategies. We note that the thresholds to define glycaemic categories vary across the American Diabetes Association (ADA) , WHO and the International Expert Committee (IEC)51. We use the IEC HbA1c and FG thresholds to reflect current clinical practice in the UK. We note that using ADA thresholds will likely results in lower case numbers for IGT and iIGT at the cost of a substantially higher false-positive rate. Body mass index (BMI) was calculated as weight (kg) / square of height (m2). Additionally, the homeostasis model assessment of insulin resistance (HOMA-IR) was calculated as FI (µIU/mL) × fasting glucose (mmol/mL)/22.552. Estimated glomerular filtration rate (eGFR) was calculated by the CKD-EPI equation using serum creatinine53.
Hepatic steatosis was evaluated by an abdominal ultrasound and images were scored by two trained operators. Criteria used for scoring included: increased echotexture of the liver parenchyma, decreased visualisation of the intra-hepatic vasculature and attenuation of ultrasound beam. Anormal liver was considered as a score from 3 – 4, mild steatosis from 5 – 7, moderate steatosis from 8 – 10 and sever steatosis ≥ 11 54.
Participants completed DEXA scan measurements using a Lunar Prodigy advanced fan beam scanner (GE Healthcare) performed by trained operators using standard imaging, positioning protocols and manually processed according to a standardized procedure described previously35. Abdominal visceral and subcutaneous fat mass was estimated using the DEXA software.
Differences in clinical characteristics were evaluated by ANOVA followed by posthoc Tukey test, or χ2 for categorical variables. Non-normally distributed variables were log transformed when appropriate.
Proteomic profiling of the Fenland cohort
Proteomic profiling was done using an aptamer-based technology (SomaScan proteomic assay). Fasting proteomic profiling was done in participants from the Fenland cohort at baseline, from which relative abundancies of 4,775 unique protein targets (evaluated by 4,979 SOMAmer reagents, SomaLogic v4)18,55 was evaluated in EDTA plasma. Briefly, proteins are targeted by modified single stranded DNA sequences (aptamers). Concentration is then approximated as relative fluorescence units using a DNA microarray 56.
To account for variation in hybridization within runs, hybridization control probes are used to generate a hybridization scale factor for each sample. To control for total signal differences between samples due to variation in overall protein concentration or technical factors such as reagent concentration, pipetting or assay timing, we used the adaptive median normalisation (AMN), unless stated otherwise. Briefly, a ratio between each aptamer's measured value and a reference value from an external reference population is computed, and the median of these ratios is computed for each of the three dilution sets (20%, 1% and 0.005%) and applied to each dilution set to shift the intrapersonal distribution of protein intensities accordingly to match the reference population. We removed samples if they did not meet an acceptance criterion for scaling factors with values outside of the recommend range (0.25-4) or were flagged as technical failures (n=19). Detailed SomaLogic’s normalization, calibration data, and quality control processes have been previously described in detail18. At a protein level, we took only human protein targets forward for subsequent analysis (4,979 out of the 5284 aptamers). Intraassay coefficients of variation (calculated based on raw fluorescence units) had a median of 4.98% (interquartile range 3.87% - 6.99%) suggesting good quality measures for the vast majority of protein targets. We decided to not apply any other filters to individual protein qualities given that even poorly measured proteins might be informative and left it to the restrictive feature selection approach applied to drop uninformative proteins, including possibly poorly measured once. Aptamers’ target annotation and mapping to UniProt accession numbers as well as Entrez gene identifiers were provided by SomaLogic and we used those to obtain genomic positions of protein encoding genes.
Genome wide genotyping and imputation
Fenland participants were genotyped using three genotyping arrays: the Affymetrix UK Biobank Axiom array (OMICs, N=8994), Illumina Infinium Core Exome 24v1 (Core-Exome, N=1060) and Affymetrix SNP5.0 (GWAS, N=1402). Samples were excluded for the following reasons: 1) failed channel contrast (DishQC <0.82); 2) low call rate (<95%); 3) gender mismatch between reported and genetic sex; 4) heterozygosity outlier; 5) unusually high number of singleton genotypes or 6) impossible identity-by-descent values. Single nucleotide polymorphisms (SNPs) were removed if: 1) call rate < 95%; 2) clusters failed Affymetrix SNPolisher standard tests and thresholds; 3) MAF was significantly affected by plate; 4) SNP was a duplicate based on chromosome, position, and alleles (selecting the best probe set according to Affymetrix SNPolisher); 5) Hardy-Weinberg equilibrium p<10-6; 6) did not match the reference or 7) MAF=0.
Autosomes for the OMICS and GWAS subsets were imputed to the HRC (r1) panel using IMPUTE4, and the Core-Exome subset and the X-chromosome (for all subsets) were imputed to HRC.r1.1 using the Sanger imputation server57. All three arrays subsets were also imputed to the UK10K+1000Gphase358 panel using the Sanger imputation server in order to obtain additional variants that do not exist in the HRC reference panel. Variants with MAF < 0.001, imputation quality (info) < 0.4 or Hardy Weinberg Equilibrium p < 10-7 in any of the genotyping subsets were excluded from further analyses.
Statistical Analyses
Classification of IGT and iIGT from the fasting proteome
To identify and validate a proteomic signature able to discriminate IGT and iIGT (as a binary outcome), the entire Fenland study (N=11,546 without missing data for 2hPG), was divided into three subsets: for feature selection (50%, N = 5773), parameter optimization (25%, N=2887) and validation (25%, N=2881). IGT and iIGT cases were split equally into 50% for training (NIGT = 387, NiIGT = 222), 25 % for optimization (NIGT = 194, NiIGT = 111) and 25% for testing (NIGT = 193, NiIGT = 111) sets. For these analyses, SOMAmer RFUs were log10-transformed. Feature selection was carried out by least absolute shrinkage and selection operator (LASSO) regression. We chose to use LASSO because it was the most suitable model to 1) identify the smallest possible set of independent predictors, 2) it is computationally efficient, which allowed us to implement a robust framework using bootstrap resampling to identify a core set of most informative predictors and 3) it is less prone to overfitting. To address case-control imbalance we used the ROSE R package59, which implements down-sampling of the majority class (controls) along with synthetic new data points for the minority class (IGT or iIGT). A nested 10-fold cross-validation (inner loop to determine regularization parameter, ʎ) was done over 100 bootstrap samples (outer loop) drawn from the feature selection set. Each protein received a score that was generated by counting the number of times it was included in the final model from each of the 100 bootstrap samples, that is, the score was between 0 (for proteins that were never selected in the final model) and 100 (for proteins that were selected in the final model in all bootstrap samples). We ranked the proteins based on their score to identify the most informative set of features (i.e. with a higher score) (Supplementary Fig. 1). This was implemented by the use of the R packages caret60 and glmnet61. Proteins selected in the final model in more than 80%, 90%, and 95% of the bootstrap samples, were tested as predictors and taken forward for parameter optimization by 10-fold cross validation of the model by LASSO regression in the optimization set. Additional models were optimized by LASSO regression, such as a standard patient information-based model using the variables from the Cambridge Diabetes Risk Score (age, sex, family history of diabetes, smoking status, prescription of steroid or antihypertensive medication and BMI)22, a standard clinical model (including the variables from the Cambridge Diabetes risk Score, FG and HbA1c) and a standard clinical plus the selected proteins model. Clinical predictors were forced to be kept in the clinical plus proteins model by setting the penalty factors of these variables to 0. For comparison, ridge regression (which will keep all proteins in the final model) was used to build a prediction model using all the 4979 proteins as predictors.
Performance of the classification models were evaluated in the internal independent validation set, which was never used for training and optimization. The prediction models’ discriminatory power was assessed by computing the area under the receiver operating curve (AUROC). Confidence intervals and p-values (using the deLong method implemented by the R package pROC62) were computed for the comparison between the ROC curves for the standard clinical model and clinical with added proteins model. Additionally, models’ net reclassification index was evaluated using the R package PredictABEL63.
Using an analogous machine learning strategy, we developed models for iIGT discrimination. For these analyses, all individuals with non-isolated IGT (2hPG > 7.8 mmol/L, FPG > 6.1 mmol/L and HbA1c > 42 mmol/mol) were excluded from the cohort (leaving N = 11,281), which was subsequently divided into feature selection (50%, N = 5591), parameter optimization (25%, N=2796) and validation (25%, N=2795). Feature selection, optimization and testing were carried out as described for IGT models. To achieve comparable model performance with the minimal number of predictors, we used recursive feature elimination on the set of proteins selected in >95% of boots during feature selection. As a sensitivity analysis, we performed the same framework described above, that is, feature selection, parameter optimization and validation to assess model performance when using protein data reversing the final normalisation step that is unique to the SomaScan platform. We note that using ‘non-normalised’ proteomic data led to broadly comparable results, which are well in the margins of random variation of protein measurements in general, albeit with some difference in the proteins selected as the most predictive markers in the final models (Supplementary Table 17).
Calibration of the final models was assessed in the internal validation set by computing the calibration slope, which evaluates the spread of the estimated risks and has a target value of one. Calibration slopes less than 1 indicate extreme estimated risks while slopes greater than 1 indicate very moderate risk estimates. Calibration slopes were computed using the R package rms64.
The number needed to screen (NNS) was calculated using a staged screening scenario. Firstly, participants from the Fenland study were stratified by predicted probabilities from the Cambridge T2D risk Score, that is, non-invasive risk factors that could be obtained by interviewing the patient. The threshold used to stratify individuals into “high” and “low” risk strata according to their predicted probabilities was set to optimize a balance between the total number of individuals that would be needed to screen and sensitivity (as would be appropriate for such a screening setting), which was achieved at 0.7, regardless of specificity. On second instance, participants within the high-risk group were further stratified by HbA1c levels, using IEC cut-offs (normoglycaemic : HbA1c < 42 mmol/mol, prediabetic criteria: HbA1c >= 42 mmol/mol and < 48 mmol/mol, T2D criteria : HbA1c >= 48 mmol/mol)51. On third instance, participants whose HbA1c did not meet the criteria for T2D or prediabetes (that is, normoglycaemic as defined aboved), were further stratified according to the clinical + 3- iIGT protein model. Similarly, a threshold that optimized testing as few individuals as possible while retaining good sensitivity of 0.7 was set for this model (Supplementary Table 10). We estimated the NNS within this stratum compared to the NNS within the full set of individuals with HbA1c in the normoglycaemic range. The NNS was calculated as the total number of individuals within the group divided by the number iIGT cases within the same group and refers to the number of OGTTs that would need to be done to identify one iIGT case within the group of interest. We additionally estimated the NNS in the test set only, as a sensitivity analysis.
IGT/iIGT model validation and follow-up analyses in the WHII study
The Whitehall II study is a longitudinal, prospective cohort study39 that was approved by the joint University College London / University College London Hospital’s Committees on the Ethics of Human Research. Proteomic profiling of fasting EDTA-plasma samples was done for all individuals at phase 5 (from 1997 - 1999) with the SomaScan v4.1 proteomic assay. We performed validation of the IGT and iIGT clinical + protein models at phase 5 (from 1997 - 1999) of the study, were proteomic profiling and OGTT values were available. Since HbA1c was not measured at phase 5 of the study, we defined iIGT as 2hPG > 7.8 mmol/L and FPG > 6.1 mmol/L. We used the weights from the models trained in Fenland to evaluate their performance in WHII phase 5 (total sample size = 5058, NIGT= 693, NiIGT=617) for the baseline clinical model (Cambridge T2D risk score + FG) and the baseline clinical + protein iIGT and IGT models (3 and 8 proteins respectively).
For the association between top discriminatory proteins and incident T2D in the Whitehall II study individuals were selected as a nested case-control study design in which proteomic profiling of fasting EDTA-plasma samples was done at phase 5 (from 1997 - 1999) with the SomaScan v4 proteomic assay. Incident T2D occurrence was assessed in repeated clinical examinations in 1997-1999, 2002-2004, 2007-2009, 2012-2013, and 2015-2016, based on FPG above 7 mmol/L, HbA1c>6.5%, use of diabetes medication, or reported physician diagnosed diabetes, excluding prevalent T2D cases at baseline from the analysis. Additionally, participants with impaired kidney function (eGFR < 30 mL/min/1.73m2), incident cardiovascular diseases or missing data on T2D at follow-up were excluded. The final sample comprised of 521 cases and 971 controls.
Association between fasting candidate proteins and incident T2D was assessed using Cox-proportional hazards regression adjusting for the baseline confounders age, sex and BMI. We tested a second model adjusting for additional baseline confounders including FG, triglycerides, HDL-cholesterol and lipid lowering medication on top of age, sex and BMI to determine whether the association persisted in a more refined model.
Effect of fasting status on plasma levels of IGT and iIGT discriminatory proteins
Fourteen adult participants were recruited to participate in the study and provided informed consent appropriately. Participants were asked to fast overnight for at least 12 hours prior to reporting to the study site. Fasting blood samples were collected from each participant, after which they were given a moderate fat meal consisting of 5-8 ounces of Cheerios with 6 ounces of 2% milk, one egg, one slice of bacon, one slice of toast with margarine, and 4 ounces of orange juice (calories: 450, 16.9 grams of fat, 16 grams of protein, and 59 grams of carbohydrates)65.
The time for each participant to complete the meal ranged from 7 to 19 minutes (average of 16 minutes). Post prandial blood samples were collected at 0.5, 1, and 3 hours following completion of the meal. Since each participant consumed their meals at different rates, the actual blood collection times post meal does vary between participants. Participants were not allowed to eat or drink any further caloric items until after the last blood collection. Twelve participants (6 male and 6 female) completed the study. Two participants were excluded due to unmet fasting requirements and an adverse reaction during the first blood draw.
Blood samples were processed to obtain EDTA-plasma by centrifugation and frozen at -80°C until delivered to SomaLogic Sample Management for proteomic profiling using the SomaScan v4 assay. The effect of fasting status on 9 unique SOMAmer reagents included in the final clinical + protein models for IGT or iIGT, was tested by repeated measures ANOVA. Proteins with ANOVA p-values < 0.0055 (according to Bonferroni adjustment for 9 comparisons) were deemed to be significantly affected by fasting status.
Functional annotation of IGT and iIGT-protein signatures
Functional annotation of the 65-IGT and 68-iIGT protein signatures was performed using modified Fisher’s exact tests as implemented by the Database for Annotation, Visualization and Integrated Discovery (DAVID, version 6.8) and enrichment of biological process GO terms (GOTERM_BP_DIRECT) was analysed, setting the full list of proteins evaluated by the SomaLogic platform as the background.
Variance explained in top discriminatory protein levels by clinical, biochemical, anthropometric and behavioural risk factors
The proportion of variance explained in candidate protein levels by several variables was evaluated in the Fenland cohort using the variancePartition R package66. Analogously, the proportion of variance explained in the first principal component of the 65-IGT and 68-iIGT discriminatory protein signatures was evaluated. Briefly, this package fits a linear mixed model to assess the effect of each variable on the outcome while correcting for all other variables. Variables evaluated were age, sex, IGT, IPCH, FPG, 2hPG, FI, 2hPI, HbA1c, total triglycerides, total cholesterol, HDL-cholesterol, LDL-cholesterol, ALT, ALP, a liver score, BMI, waist-to-hip ratio (WHR), amount of subcutaneous fat, amount of visceral fat, CRP, estimated glomerular filtration rate (eGFR) and intake of statins or antihypertensive medication. FPG, 2hPG, FI, 2hPI, HbA1c, total triglycerides, ALT, ALP, CRP, subcutaneous fat and visceral fat were natural log-transformed due to skewed distribution of these variables. We fit separate models for each of the variables evaluated adjusting only for age and sex in the entire Fenland cohort (N=11,546) to avoid bias due to strong collinearity among variables tested. For each of the models, participants with missing data were excluded.
Protein quantitative trait loci (pQTLs) for candidate proteins
Genetic variants associated with candidate proteins (protein quantitative trait loci or pQTLs) were taken from our genome-wide association studies across all aptamers as described in Pietzner et al, 202155.
Percentage of variance explained in protein levels by cis and trans pQTL scores
Polygenic scores were constructed for pQTLs within the cis (within ±500 kb of the protein-encoding gene) and trans regions. Cis-pQTL scores were built using conditionally independent variants. The percentage of variance explained in protein levels by the cis and trans-scores was computed as described in the above section adjusting for age and sex.
Association between top discriminatory proteins and fasting and 2-hour plasma glucose and insulin
Observational associations between the top selected IGT and iIGT discriminatory proteins and FPG, FI, 2hPG and 2hPI were assessed in the entire Fenland cohort at baseline (N=10,259 without missing data) by linear regression models adjusting for age, sex, BMI and test site from the study. The models for 2hPG and 2hPI were additionally adjusted by FPG and FPG + FI, respectively. Protein levels were log10-transformed and standardized, and 2hPG and 2hPI values were log-transformed for these analyses. Proteins were considered significant at a Bonferroni threshold (p-values < 0.001, accounting for comparisons between the number of protein and number of traits, as for all further association analyses).
Association between polygenic risk scores for glycaemic traits and top discriminatory proteins
T2D36, fasting glucose (FG)34, fasting insulin34 (FI score), 2hPG34 (2hPG score) and BMI35 polygenic scores, weighted by genetic effect sizes of previously reported genome-wide significant variants, were computed for 7,973 Fenland participants genotyped with the same array (Affymetrix UK Biobank Axiom Array). Variants not available, with low imputation quality scores < 0.6, or with strand ambiguous alleles were excluded from the scores. Each polygenic score was tested for associations with the plasma abundancies of top IGT and iIGT discriminatory proteins by linear regression models adjusting for age, sex, BMI, the first 10 genetic principal components and test site of the study.
Association between iIGT scores with incident cardiometabolic diseases in a sub-cohort of the EPIC-Norfolk study
The EPIC-Norfolk study is a cohort of 25,639 middle-aged, individuals from the general population of Norfolk a county in Eastern England which is a component of EPIC37. The EPIC-Norfolk study was approved by the Norfolk Research Ethics Committee (ref. 05/Q0101/191); all participants gave their informed written consent before entering the study. All participants were flagged for mortality at the UK Office of National Statistics and vital status was ascertained for the entire cohort. Death certificates were coded by trained nosologists according to the International Statistical Classification of Diseases and Related Health Problems, 10th Revision (ICD-10). Hospitalization data were obtained using National Health Service numbers through linkage with NHS Digital. Participants were identified as having experienced an event if the corresponding ICD-10 code was registered on the death certificate (as the underlying cause of death or as a contributing factor) or as the cause of hospitalization (Supplementary Table 15). Since the long-term follow-up of EPIC-Norfolk comprised the ICD-9 and ICD-10 coding system, codes were consolidated. The current study is based on follow-up to 31 March 2016. Information on lifestyle factors and medical history was obtained from questionnaires as reported previously37. The current analysis is based on a random sub-cohort (N=875) of the whole EPIC-Norfolk study population that was selected excluding known prevalent case subjects of diabetes at baseline was using the same definitions as used in the InterAct Project67; in which proteomic profiling was done at health check 1 using the SOMAscan v4 platform from citrate-plasma samples stored in liquid nitrogen since the baseline visit.
Participants with missing data for any of the variables included in the final prediction models developed in the Fenland study were excluded. The final sample comprised of 753 individuals for which characteristics are presented in Supplementary Table 16.
Final prediction models trained and optimized for iIGT in the Fenland study were used to calculate the predicted probability of iIGT for each participant at health check 1 in this sub-cohort of the EPIC-Norfolk study. Models tested included: the clinical + 3-proteins iIGT model, 3-protein iIGT model (95% feature selection protein set model), 68-protein iIGT model (80% feature selection protein set model) and the clinical model as a baseline comparison. We then tested the association of the predicted iIGT probability with 8 incident cardiometabolic diseases (or associated T2D comorbidities) including type 2 diabetes, coronary heart disease, heart failure, peripheral artery disease, cerebral stroke, liver disease, renal disease and cataracts using cox proportional hazards models adjusting by age at baseline and sex (except for the clinical + 3 protein model, which already accounted for these risk factors within the score). Associations were deemed significant at an 5% FDR accounting for comparison between 8 diseases.
We aimed for cross-platform validation in a separate random sub-cohort of the prospective EPIC-Norfolk study (N=771), in which proteomic measures were done with the Olink Explore panel40 from serum samples. Participants with missing data for any of the variables included in the final prediction models developed in the Fenland study (expect HbA1c which was excluded from the models as it was unavailable in a large proportion of participants from this sub-cohort) were excluded. The final sample comprised of 602 individuals for which characteristics are presented in Supplementary Table 18.
Final prediction models trained and optimized for iIGT in the Fenland study (using SomaScan) were used to calculate the predicted probability of iIGT for each participant at health check 1 in this sub-cohort of the EPIC-Norfolk study, using the Olink measures for the proteins. Models tested included: the clinical + 3-proteins iIGT model, 3-protein iIGT model (95% feature selection protein set model) and the Cambridge T2D risk Score. We then tested the association of the predicted iIGT probability with the same Cox-model setting and set of disease as in the sub-cohort with available SomaLogic measurements except for liver disease (Supplementary Table 19). Associations were deemed significant at an 5% FDR accounting for comparison between 7 diseases.
All statistical analyses were performed using R language, and environment for statistical computing (version 3.6.1 and 4.1.0, R Core Team).
Extended Data
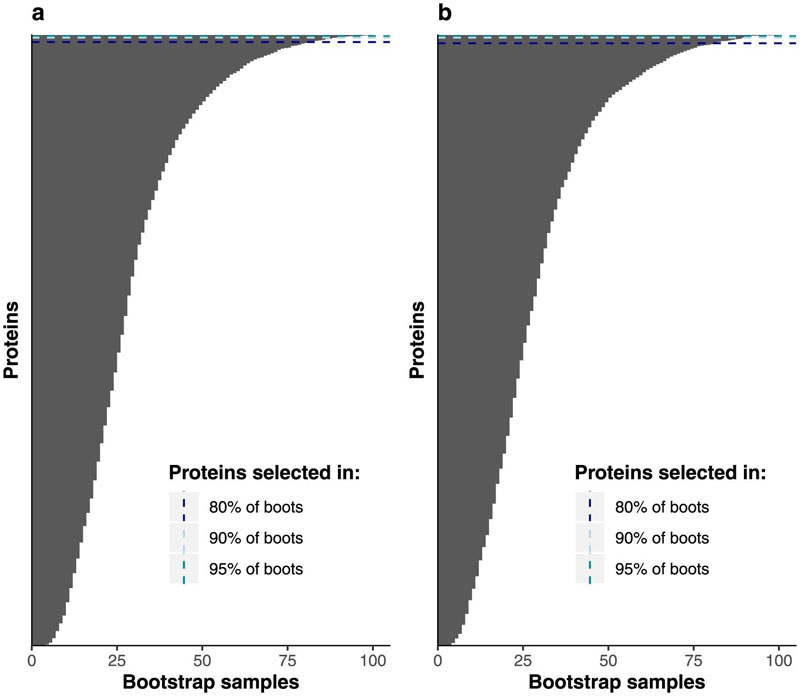
Extended Data Fig. 1. Feature selection ranking of proteins for postprandial glycaemia prediction.
Protein ranking based on the number of times selected over bootstrap resampling during feature selection for impaired glucose tolerance (IGT) (a) and isolated impaired glucose tolerance (iIGT) (b). Dashed lines represent thresholds for proteins selected in more than 80%, 90% or 95% of bootstrap samples to be taken forward to parameter optimization step.
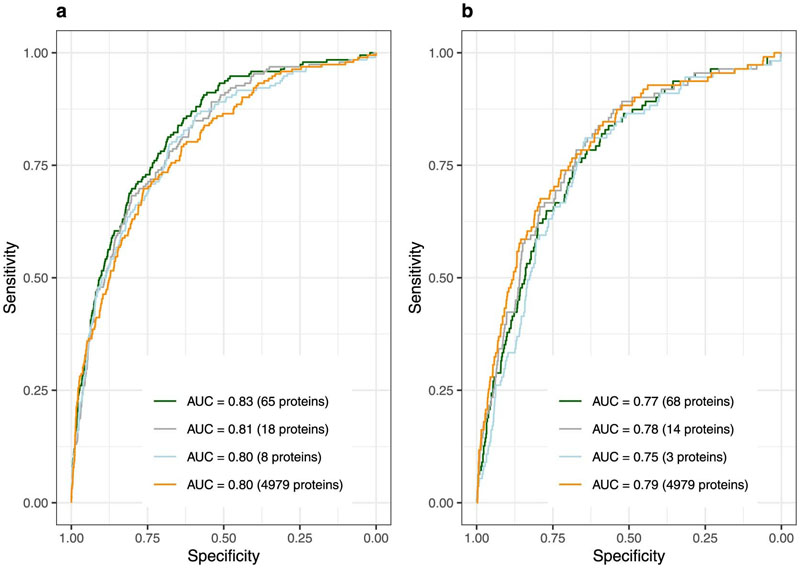
Extended Data Fig. 2. Performance of LASSO trained protein-only models for IGT (a) and iIGT (b) discrimination in the internal validation test set.
a, Impaired glucose tolerance (IGT) discrimination was evaluated in the independent internal validation test set (N = 2881, 192 IGT individuals) for models based on proteins selected in more than 80% (65 proteins), 90% (18 proteins) or 95% (8 proteins) and kept after model optimization step or based on all proteins (4979 proteins). b, isolated impaired glucose tolerance (iIGT) discrimination was evaluated in the independent internal validation test set (N = 2819, 135 iIGT individuals) for models based on proteins selected in more than 80% (73 proteins), 90% (17 proteins) or 95% (3 proteins) and kept after model optimization step or based on all proteins (4979 proteins).
Extended Data Fig. 3. Performance of the T2D genetic risk score (T2D-GRS) for IGT (a) and iIGT (b) discrimination in the internal validation test set.
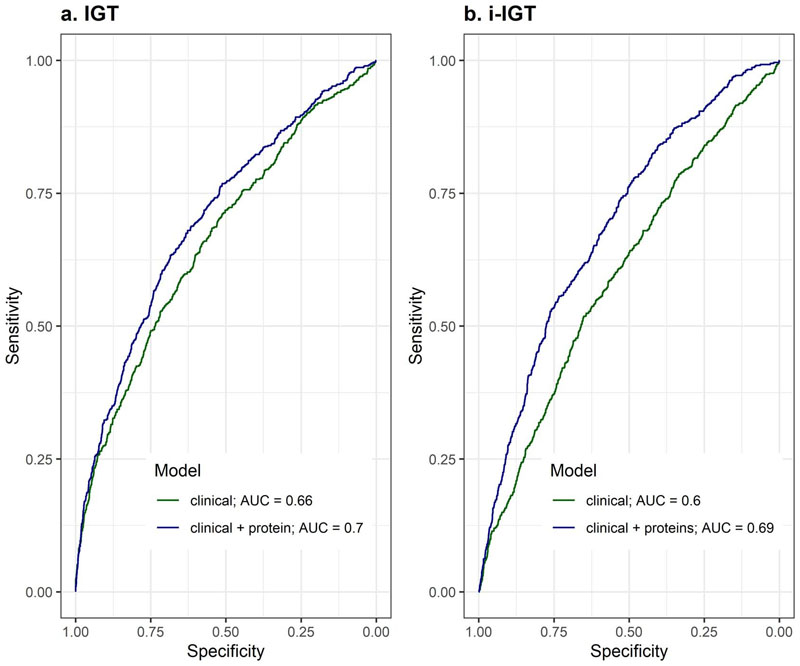
Extended Data Fig. 4. Validation of the clinical and clinical + protein models for IGT (a) and iIGT (b) in the independent WHII study.
The clinical + protein model significantly outperformed the clinical model (p-valueIGT = 5.26 × 10⁻⁵; p-valueiIGT = 1.5 × 10⁻¹⁷). The improvement was of similar magnitude than that observed in the Fenland study, although with overall lower AUROCs (clinical models: AUROCIGT = 0.66 (0.64–0.69), and AUROCiIGT = 0.60 (0.57–0.62); clinical + protein models: AUROCIGT = 0.70 (0.68–0.72) and AUROCiIGT = 0.69 (0.67–0.71)). Significant differences between the AUROCs were asses by the Delong method. This might be best explained by differences in the characteristics of the study population, the design and the lack of HbA1c to define iIGT (see Methods).
Extended Data Fig. 4. Performance of LASSO trained models for isolated impaired glucose tolerance discrimination in the internal validation test set having excluded the top 3 selected proteins.
Isolated impaired glucose tolerance (iIGT) discrimination performance in the independent internal validation test set (N = 2795, 111 iIGT individuals) for the standard clinical model, a 68-protein model (selected in >80% of bootstrap samples and kept during optimization), and a clinical + 7 protein model (selected in >95% of bootstrap samples).
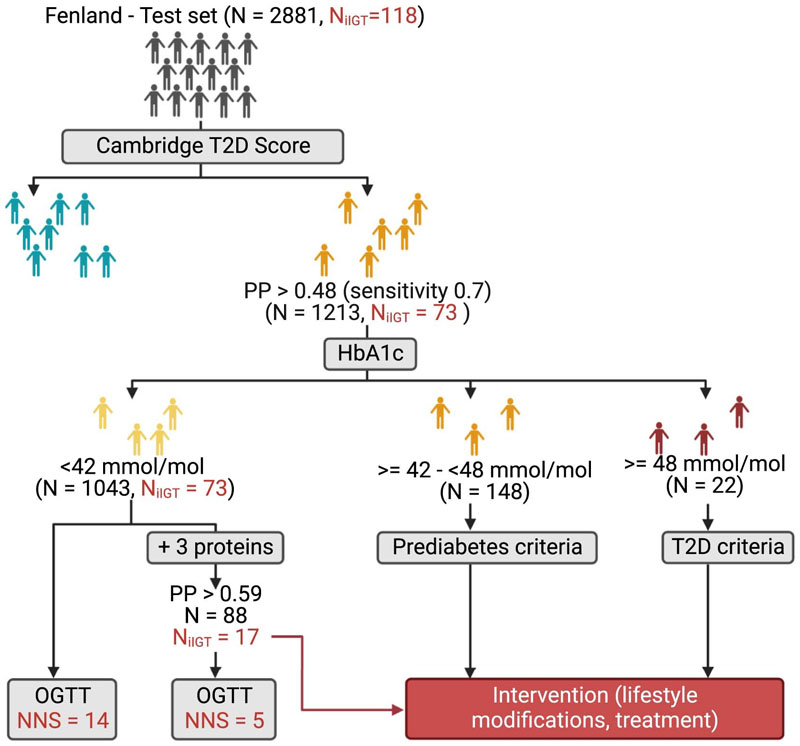
Extended Data Fig. 6. Internal validation of proposed 3-stage screening strategy in the test set only.
In the first stage, individuals in the Fenland test set were divided into low and high risk according to the Cambridge T2D risk score. The high risk group would undergo a second stage involving measurement of HbA1c and of the 3 iIGT proteins. Individuals with HbA1c levels within the T2D or prediabetic range would be referred for intervention and lifestyle modifications. Individuals with HbA1c below the prediabetic range, would further stratified using the final clinical + 3 iIGT protein model to identify a high risk group, which on a third stage would be taken forward for OGTT testing to identify iIGT cases that would have been otherwise by current screening guidelines. The NNS in the strata of individuals at high predicted risk based on the patient-derived information model, but HbA1c levels below cut-offs for prediabetes (N = 1043) was 14, while by additionally applying the clinical + 3-protein iIGT model the NNS was of only 5 (N = 88 at high-risk). Figure was designed with biorender.com.
Extended Data Fig. 7. Comparison of protein ranking during feature selection over bootstrap resampling for isolated impaired glucose tolerance (iIGT) and impaired glucose tolerance (IGT).
Comparison is shown for proteins that were selected in more 80% of bootstrap samples (shown by the red line) for either IGT (N = 2881, 192 IGT individuals) or iIGT (N = 2795, 111 iIGT individuals).
Extended Data Fig. 7. Percentage of variance explained in impaired glucose tolerance and isolated impaired glucose tolerance top discriminatory protein levels by clinical, biochemical, anthropometric and lifestyle risk factors.
Linear mixed models were fitted for each of the 24 clinical, biochemical, anthropometric, genetic and lifestyle risk factor variables adjusting by age and sex to estimate the percentage of explained variance in plasma abundances of discriminatory proteins as well as for the principal component of the 65-IGT and 68-iIGT protein signatures. Cis and trans scores with missing values represent proteins for which no protein quantitative trait loci could be identified.
Extended Data Fig. 9. Association of iIGT protein scores using Olink explore proteomics measures with incident cardiometabolic diseases.
Association of iIGT prediction scores (left panel; red: Cambridge T2D risk score, orange: Cambridge T2D risk score variable + fasting glucose + 3 protein iIGT prediction model, darkblue: 3-protein iIGT prediction model) and individual top iIGT proteins (right panel) with 7 cardiometabolic disease outcomes in a sub-cohort the EPIC-Norfolk study (N = 602 individuals). 95% confidence intervals of hazard ratios (HR) are shown.
Supplementary Material
Acknowledgements
The Fenland Study (10.22025/2017.10.101.00001) is funded by the Medical Research Council (MC_UU_12015/1). We are grateful to all the volunteers and to the General Practitioners and practice staff for assistance with recruitment. We thank the Fenland Study Investigators, Fenland Study Co-ordination team and the Epidemiology Field, Data and Laboratory teams. We further acknowledge support for genomics from the Medical Research Council (MC_PC_13046). Proteomic measurements were supported and governed by a collaboration agreement between the University of Cambridge and SomaLogic. We thank Ira von Carlowitz and Kaitlin Soucie for their contributions to the fasting proteome analysis. JCZS is supported by a 4-year Wellcome Trust PhD Studentship and the Cambridge Trust, CL, EW, and NJW are funded by the Medical Research Council (MC_UU_12015/1). NJW is a NIHR Senior Investigator. The Whitehall II study and MK are supported by grants from the Wellcome Trust (221854/Z/20/Z); UK Medical Research Council (R024227); and NIA, NIH (R01AG056477). JVL was supported by Academy of Finland (311492 and 339568) and Helsinki Institute of Life Science (H970) grants paid to employer. The funders had no role in study design, data collection and analysis, decision to publish or preparation of the manuscript.
Footnotes
Competing Interests
MS, MW, DD, RO and SAW are employees of SomaLogic. EW and EO are now employees at AstraZeneca. The remaining authors declare no competing interests.
Author contributions
JCZS, MP, NJW and CL designed the analysis and drafted the manuscript. JCZS analysed the data, JVL did the replication analyses in Whitehall II study. MS and MW did the analysis for assessing the effect of fasting status on protein levels. NJW is PI of the Fenland cohort and MK is PI of the Whitehall II study. All authors contributed to the interpretation of the results and critically reviewed the manuscript.
Data Availability
Data access for the Fenland and EPIC studies can be requested by bona fide researchers for specified scientific purposes through a simple application process via the study websites below. Data will either be shared through an institutional data sharing agreement or arrangements will be made for analyses to be conducted remotely without the necessity for data transfer.
Fenland: https://www.mrc-epid.cam.ac.uk/research/studies/fenland/information-for-researchers
EPIC-Norfolk: https://www.mrc-epid.cam.ac.uk/research/studies/epic-norfolk
Code availability
The code employed for the machine learning developed framework has been deposited in the following repository: https://github.com/MRC-Epid/iigt_prediction_proteomics.
References
- 1.American Diabetes, A. 2. Classification and Diagnosis of Diabetes: Standards of Medical Care in Diabetes-2018. Diabetes Care. 2018;41:S13–S27. doi: 10.2337/dc18-S002. [DOI] [PubMed] [Google Scholar]
- 2.International Expert, C. International Expert Committee report on the role of the A1C assay in the diagnosis of diabetes. Diabetes Care. 2009;32:1327–1334. doi: 10.2337/dc09-9033. [DOI] [PMC free article] [PubMed] [Google Scholar]
- 3.Saeedi P, et al. Global and regional diabetes prevalence estimates for 2019 and projections for 2030 and 2045: Results from the International Diabetes Federation Diabetes Atlas, 9(th) edition. Diabetes Res Clin Pract. 2019;157:107843. doi: 10.1016/j.diabres.2019.107843. [DOI] [PubMed] [Google Scholar]
- 4.Meisinger C, et al. Prevalence of undiagnosed diabetes and impaired glucose regulation in 35-59-year-old individuals in Southern Germany: the KORA F4 Study. Diabet Med. 2010;27:360–362. doi: 10.1111/j.1464-5491.2009.02905.x. [DOI] [PubMed] [Google Scholar]
- 5.Cheng YJ, et al. Prevalence of Diabetes by Race and Ethnicity in the United States, 2011-2016. JAMA. 2019;322:2389–2398. doi: 10.1001/jama.2019.19365. [DOI] [PMC free article] [PubMed] [Google Scholar]
- 6.Richter B, Hemmingsen B, Metzendorf MI, Takwoingi Y. Development of type 2 diabetes mellitus in people with intermediate hyperglycaemia. Cochrane Database Syst Rev. 2018;10:CD012661. doi: 10.1002/14651858.CD012661.pub2. [DOI] [PMC free article] [PubMed] [Google Scholar]
- 7.Yip WCY, Sequeira IR, Plank LD, Poppitt SD. Prevalence of Pre-Diabetes across Ethnicities: A Review of Impaired Fasting Glucose (IFG) and Impaired Glucose Tolerance (IGT) for Classification of Dysglycaemia. Nutrients. 2017;9 doi: 10.3390/nu9111273. [DOI] [PMC free article] [PubMed] [Google Scholar]
- 8.Campbell MD, et al. Benefit of lifestyle-based T2DM prevention is influenced by prediabetes phenotype. Nat Rev Endocrinol. 2020;16:395–400. doi: 10.1038/s41574-019-0316-1. [DOI] [PubMed] [Google Scholar]
- 9.Nichols GA, Arondekar B, Herman WH. Complications of dysglycemia and medical costs associated with nondiabetic hyperglycemia. The American journal of managed care. 2008;14:791–798. [PubMed] [Google Scholar]
- 10.Cowie CC, et al. Prevalence of diabetes and high risk for diabetes using A1C criteria in the U.S. population in 1988-2006. Diabetes Care. 2010;33:562–568. doi: 10.2337/dc09-1524. [DOI] [PMC free article] [PubMed] [Google Scholar]
- 11.Cederberg H, et al. Postchallenge glucose, A1C, and fasting glucose as predictors of type 2 diabetes and cardiovascular disease: a 10-year prospective cohort study. Diabetes Care. 2010;33:2077–2083. doi: 10.2337/dc10-0262. [DOI] [PMC free article] [PubMed] [Google Scholar]
- 12.Balkau B. The DECODE study. Diabetes epidemiology: collaborative analysis of diagnostic criteria in Europe. Diabetes Metab. 2000;26:282–286. [PubMed] [Google Scholar]
- 13.Gerstein HC, et al. Annual incidence and relative risk of diabetes in people with various categories of dysglycemia: a systematic overview and meta-analysis of prospective studies. Diabetes Res Clin Pract. 2007;78:305–312. doi: 10.1016/j.diabres.2007.05.004. [DOI] [PubMed] [Google Scholar]
- 14.Chen Y, et al. Associations of progression to diabetes and regression to normal glucose tolerance with development of cardiovascular and microvascular disease among people with impaired glucose tolerance: a secondary analysis of the 30 year Da Qing Diabetes Prevention Outcome Study. Diabetologia. 2021;64:1279–1287. doi: 10.1007/s00125-021-05401-x. [DOI] [PubMed] [Google Scholar]
- 15.Shaw JE, Hodge AM, de Courten M, Chitson P, Zimmet PZ. Isolated post-challenge hyperglycaemia confirmed as a risk factor for mortality. Diabetologia. 1999;42:1050–1054. doi: 10.1007/s001250051269. [DOI] [PubMed] [Google Scholar]
- 16.Silbernagel G, et al. Isolated post-challenge hyperglycaemia predicts increased cardiovascular mortality. Atherosclerosis. 2012;225:194–199. doi: 10.1016/j.atherosclerosis.2012.08.008. [DOI] [PubMed] [Google Scholar]
- 17.Zhou W, et al. Longitudinal multi-omics of host-microbe dynamics in prediabetes. Nature. 2019;569:663–671. doi: 10.1038/s41586-019-1236-x. [DOI] [PMC free article] [PubMed] [Google Scholar]
- 18.Williams SA, et al. Plasma protein patterns as comprehensive indicators of health. Nat Med. 2019;25:1851–1857. doi: 10.1038/s41591-019-0665-2. [DOI] [PMC free article] [PubMed] [Google Scholar]
- 19.Schussler-Fiorenza Rose SM, et al. A longitudinal big data approach for precision health. Nat Med. 2019;25:792–804. doi: 10.1038/s41591-019-0414-6. [DOI] [PMC free article] [PubMed] [Google Scholar]
- 20.Gold L, et al. Aptamer-based multiplexed proteomic technology for biomarker discovery. PLoS One. 2010;5:e15004. doi: 10.1371/journal.pone.0015004. [DOI] [PMC free article] [PubMed] [Google Scholar]
- 21.Lindsay T, et al. Descriptive epidemiology of physical activity energy expenditure in UK adults (The Fenland study) International Journalof Behavioral Nutritionand Physical Activity. 2019;16:126. doi: 10.1186/s12966-019-0882-6. [DOI] [PMC free article] [PubMed] [Google Scholar]
- 22.Rahman M, Simmons RK, Harding AH, Wareham NJ, Griffin SJ. A simple risk score identifies individuals at high risk of developing Type 2 diabetes: a prospective cohort study. Fam Pract. 2008;25:191–196. doi: 10.1093/fampra/cmn024. [DOI] [PubMed] [Google Scholar]
- 23.Deora AB, Kreitzer G, Jacovina AT, Hajjar KA. An annexin 2 phosphorylation switch mediates p11-dependent translocation of annexin 2 to the cell surface. J Biol Chem. 2004;279:43411–43418. doi: 10.1074/jbc.M408078200. [DOI] [PubMed] [Google Scholar]
- 24.Guevara-Aguirre J, et al. Growth hormone receptor deficiency is associated with a major reduction in pro-aging signaling, cancer, and diabetes in humans. Sci Transl Med. 2011;3:70ra13. doi: 10.1126/scitranslmed.3001845. [DOI] [PMC free article] [PubMed] [Google Scholar]
- 25.Tiaden AN, et al. Novel Function of Serine Protease HTRA1 in Inhibiting Adipogenic Differentiation of Human Mesenchymal Stem Cells via MAP Kinase-Mediated MMP Upregulation. Stem Cells. 2016;34:1601–1614. doi: 10.1002/stem.2297. [DOI] [PubMed] [Google Scholar]
- 26.Haddad Y, Couture R. Kininase 1 As a Preclinical Therapeutic Target for Kinin B1 Receptor in Insulin Resistance. Front Pharmacol. 2017;8:509. doi: 10.3389/fphar.2017.00509. [DOI] [PMC free article] [PubMed] [Google Scholar]
- 27.Klement J, et al. Oxytocin Improves beta-Cell Responsivity and Glucose Tolerance in Healthy Men. Diabetes. 2017;66:264–271. doi: 10.2337/db16-0569. [DOI] [PubMed] [Google Scholar]
- 28.Zhong C, et al. Cbln1 and Cbln4 Are Structurally Similar but Differ in GluD2 Binding Interactions. Cell Rep. 2017;20:2328–2340. doi: 10.1016/j.celrep.2017.08.031. [DOI] [PubMed] [Google Scholar]
- 29.Weingarten MFJ, et al. Circulating Oxytocin Is Genetically Determined and Associated With Obesity and Impaired Glucose Tolerance. J Clin Endocrinol Metab. 2019;104:5621–5632. doi: 10.1210/jc.2019-00643. [DOI] [PubMed] [Google Scholar]
- 30.Wu T, et al. CILP-2 is a novel secreted protein and associated with insulin resistance. J Mol Cell Biol. 2019;11:1083–1094. doi: 10.1093/jmcb/mjz016. [DOI] [PMC free article] [PubMed] [Google Scholar]
- 31.Slieker RC, et al. Novel biomarkers for glycaemic deterioration in type 2 diabetes: an IMI RHAPSODY study. medRxiv. 2021:2021.2004.2022.21255625 [Google Scholar]
- 32.Shen Z, Gantcheva S, Mansson B, Heinegard D, Sommarin Y. Chondroadherin expression changes in skeletal development. Biochem J. 1998;330(Pt 1):549–557. doi: 10.1042/bj3300549. [DOI] [PMC free article] [PubMed] [Google Scholar]
- 33.Hessle L, et al. The skeletal phenotype of chondroadherin deficient mice. PLoS One. 2014;8:e63080. doi: 10.1371/journal.pone.0063080. [DOI] [PMC free article] [PubMed] [Google Scholar]
- 34.Scott RA, et al. Large-scale association analyses identify new loci influencing glycemic traits and provide insight into the underlying biological pathways. Nat Genet. 2012;44:991–1005. doi: 10.1038/ng.2385. [DOI] [PMC free article] [PubMed] [Google Scholar]
- 35.Lotta LA, et al. Association of Genetic Variants Related to Gluteofemoral vs Abdominal Fat Distribution With Type 2 Diabetes, Coronary Disease, and Cardiovascular Risk Factors. JAMA. 2018;320:2553–2563. doi: 10.1001/jama.2018.19329. [DOI] [PMC free article] [PubMed] [Google Scholar]
- 36.Mahajan A, et al. Fine-mapping type 2 diabetes loci to single-variant resolution using high-density imputation and islet-specific epigenome maps. Nat Genet. 2018;50:1505–1513. doi: 10.1038/s41588-018-0241-6. [DOI] [PMC free article] [PubMed] [Google Scholar]
- 37.Day N, et al. EPIC-Norfolk: study design and characteristics of the cohort. European Prospective Investigation of Cancer. Br J Cancer. 1999;80(Suppl 1):95–103. [PubMed] [Google Scholar]
- 38.Pietzner M, et al. Plasma metabolites to profile pathways in noncommunicable disease multimorbidity. Nat Med. 2021;27:471–479. doi: 10.1038/s41591-021-01266-0. [DOI] [PMC free article] [PubMed] [Google Scholar]
- 39.Marmot M, Brunner E. Cohort Profile: the Whitehall II study. Int J Epidemiol. 2005;34:251–256. doi: 10.1093/ije/dyh372. [DOI] [PubMed] [Google Scholar]
- 40.Zhong W, et al. Next generation plasma proteome profiling to monitor health and disease. Nat Commun. 2021;12:2493. doi: 10.1038/s41467-021-22767-z. [DOI] [PMC free article] [PubMed] [Google Scholar]
- 41.Gong Q, et al. Morbidity and mortality after lifestyle intervention for people with impaired glucose tolerance: 30-year results of the Da Qing Diabetes Prevention Outcome Study. Lancet Diabetes Endocrinol. 2019;7:452–461. doi: 10.1016/S2213-8587(19)30093-2. [DOI] [PMC free article] [PubMed] [Google Scholar]
- 42.Barron E, Clark R, Hewings R, Smith J, Valabhji J. Progress of the Healthier You: NHS Diabetes Prevention Programme: referrals, uptake and participant characteristics. Diabet Med. 2018;35:513–518. doi: 10.1111/dme.13562. [DOI] [PMC free article] [PubMed] [Google Scholar]
- 43.Gong Q, et al. Efficacy of lifestyle intervention in adults with impaired glucose tolerance with and without impaired fasting plasma glucose: A post hoc analysis of Da Qing Diabetes Prevention Outcome Study. Diabetes Obes Metab. 2021;23:2385–2394. doi: 10.1111/dom.14481. [DOI] [PMC free article] [PubMed] [Google Scholar]
- 44.Knowler WC, et al. Reduction in the incidence of type 2 diabetes with lifestyle intervention or metformin. N Engl J Med. 2002;346:393–403. doi: 10.1056/NEJMoa012512. [DOI] [PMC free article] [PubMed] [Google Scholar]
- 45.Bergman M, et al. Lessons learned from the 1-hour post-load glucose level during OGTT: Current screening recommendations for dysglycaemia should be revised. Diabetes Metab Res Rev. 2018;34:e2992. doi: 10.1002/dmrr.2992. [DOI] [PubMed] [Google Scholar]
- 46.Pham CT. Neutrophil serine proteases: specific regulators of inflammation. Nat Rev Immunol. 2006;6:541–550. doi: 10.1038/nri1841. [DOI] [PubMed] [Google Scholar]
- 47.Wiedow O, Meyer-Hoffert U. Neutrophil serine proteases: potential key regulators of cell signalling during inflammation. J Intern Med. 2005;257:319–328. doi: 10.1111/j.1365-2796.2005.01476.x. [DOI] [PubMed] [Google Scholar]
- 48.Donath MY, Shoelson SE. Type 2 diabetes as an inflammatory disease. Nat Rev Immunol. 2011;11:98–107. doi: 10.1038/nri2925. [DOI] [PubMed] [Google Scholar]
- 49.de Vries MA, et al. Glucose-dependent leukocyte activation in patients with type 2 diabetes mellitus, familial combined hyperlipidemia and healthy controls. Metabolism. 2015;64:213–217. doi: 10.1016/j.metabol.2014.10.011. [DOI] [PubMed] [Google Scholar]
- 50.Pietzner M, et al. Synergistic insights into human health from aptamer- and antibody-based proteomic profiling. Nat Commun. 2021;12:6822. doi: 10.1038/s41467-021-27164-0. [DOI] [PMC free article] [PubMed] [Google Scholar]
- 51.Lee CMY, et al. Comparing different definitions of prediabetes with subsequent risk of diabetes: an individual participant data meta-analysis involving 76 513 individuals and 8208 cases of incident diabetes. BMJ Open Diabetes Res Care. 2019;7:e000794. doi: 10.1136/bmjdrc-2019-000794. [DOI] [PMC free article] [PubMed] [Google Scholar]
- 52.Fukagawa NK, et al. Insulin-mediated reduction of whole body protein breakdown. Dose response effects on leucine metabolism in postabsorptive men. J Clin Invest. 1985;76:2306–2311. doi: 10.1172/JCI112240. [DOI] [PMC free article] [PubMed] [Google Scholar]
- 53.Inker LA, et al. Estimating glomerular filtration rate from serum creatinine and cystatin C. The New England journal of medicine. 2012;367:20–29. doi: 10.1056/NEJMoa1114248. [DOI] [PMC free article] [PubMed] [Google Scholar]
- 54.Mehta SR, Thomas EL, Bell JD, Johnston DG, Taylor-Robinson SD. Non-invasive means of measuring hepatic fat content. World J Gastroenterol. 2008;14:3476–3483. doi: 10.3748/wjg.14.3476. [DOI] [PMC free article] [PubMed] [Google Scholar]
- 55.Pietzner M, et al. Mapping the proteo-genomic convergence of human diseases. Science. 2021:eabj1541. doi: 10.1126/science.abj1541. [DOI] [PMC free article] [PubMed] [Google Scholar]
- 56.Rohloff JC, et al. Nucleic Acid Ligands With Protein-like Side Chains: Modified Aptamers and Their Use as Diagnostic and Therapeutic Agents. Mol Ther Nucleic Acids. 2014;3:e201. doi: 10.1038/mtna.2014.49. [DOI] [PMC free article] [PubMed] [Google Scholar]
- 57.McCarthy S, et al. A reference panel of 64,976 haplotypes for genotype imputation. Nat Genet. 2016;48:1279–1283. doi: 10.1038/ng.3643. [DOI] [PMC free article] [PubMed] [Google Scholar]
- 58.Huang J, et al. Improved imputation of low-frequency and rare variants using the UK10K haplotype reference panel. Nat Commun. 2015;6:8111. doi: 10.1038/ncomms9111. [DOI] [PMC free article] [PubMed] [Google Scholar]
- 59.Nicola Lunardon GM. Nicola Torelli. ROSE: a Package for Binary Imbalanced Learning. The R Journal. 2014;6:79–89. [Google Scholar]
- 60.Kuhn M. Building Predictive Models in R Using the caret Package. J Stat Softw. 2008;28:1–26. [Google Scholar]
- 61.Friedman J, Hastie T, Tibshirani R. Regularization Paths for Generalized Linear Models via Coordinate Descent. J Stat Softw. 2010;33:1–22. [PMC free article] [PubMed] [Google Scholar]
- 62.Robin X, et al. pROC: an open-source package for R and S+ to analyze and compare ROC curves. BMC Bioinformatics. 2011;12:77. doi: 10.1186/1471-2105-12-77. [DOI] [PMC free article] [PubMed] [Google Scholar]
- 63.Kundu S, Aulchenko YS, van Duijn CM, Janssens AC. PredictABEL: an R package for the assessment of risk prediction models. European journal of epidemiology. 2011;26:261–264. doi: 10.1007/s10654-011-9567-4. [DOI] [PMC free article] [PubMed] [Google Scholar]
- 64.F EH. rms: Regression Modeling Strategies R package version 5.1-1. 2017.
- 65.Pharmacokinetics in Drug Development: Clinical Study Design and Analysis. American Association of Pharmaceutical Scientists; Arlington: 2004. [Google Scholar]
- 66.Hoffman GE, Schadt EE. variancePartition: interpreting drivers of variation in complex gene expression studies. BMC Bioinformatics. 2016;17:483. doi: 10.1186/s12859-016-1323-z. [DOI] [PMC free article] [PubMed] [Google Scholar]
- 67.InterAct C, et al. Design and cohort description of the InterAct Project: an examination of the interaction of genetic and lifestyle factors on the incidence of type 2 diabetes in the EPIC Study. Diabetologia. 2011;54:2272–2282. doi: 10.1007/s00125-011-2182-9. [DOI] [PMC free article] [PubMed] [Google Scholar]
Associated Data
This section collects any data citations, data availability statements, or supplementary materials included in this article.
Supplementary Materials
Data Availability Statement
Data access for the Fenland and EPIC studies can be requested by bona fide researchers for specified scientific purposes through a simple application process via the study websites below. Data will either be shared through an institutional data sharing agreement or arrangements will be made for analyses to be conducted remotely without the necessity for data transfer.
Fenland: https://www.mrc-epid.cam.ac.uk/research/studies/fenland/information-for-researchers
EPIC-Norfolk: https://www.mrc-epid.cam.ac.uk/research/studies/epic-norfolk
The code employed for the machine learning developed framework has been deposited in the following repository: https://github.com/MRC-Epid/iigt_prediction_proteomics.


