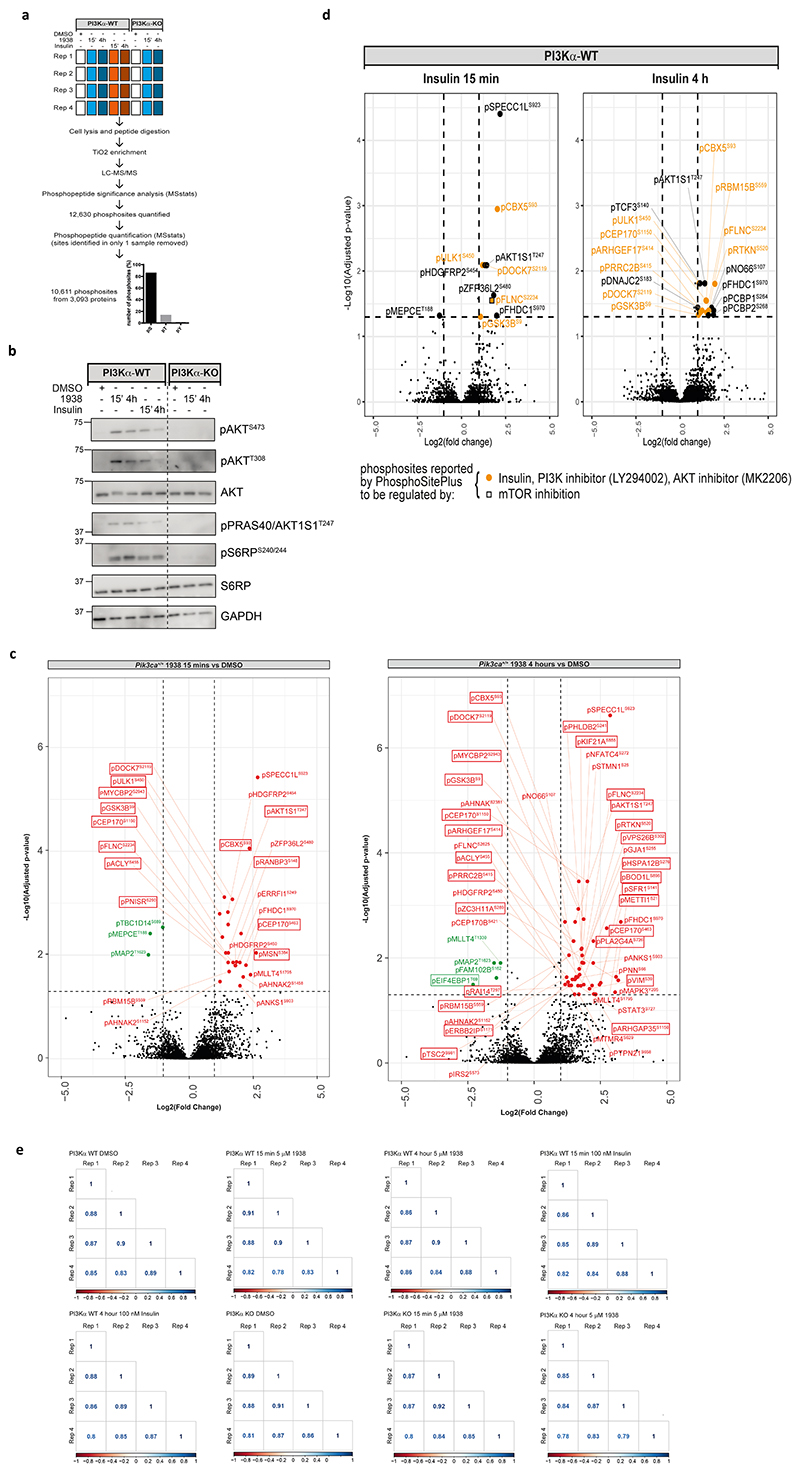
Extended Data Fig. 7. Phosphoproteomics experimental set-up and control data.
a, Experimental design and workflow of phosphoproteomics experiment. PI3Kα-WT and PI3Kα-KO MEFs were serum-starved overnight, stimulated with DMSO, 1938 (5 μM) or insulin (100 nM) for 15 min or 4 h and processed for phosphoproteomics analysis. 10,611 phosphosites fom 3,093 proteins were analysed by MSstats, the majority of which were pSer and pThr residues. b, Validation of phosphoproteomics conditions. PI3Kα-WT and PI3Kα-KO MEFs were serum-starved overnight and stimulated with DMSO, 1938 (5 μM) or insulin (100 nM) for 15 min or 4 h as indicated. Lysates were immunoblotted with antibodies to pAKTS473, pAKTT308, total AKT, pPRAS40/AKT1S1T247, pS6RPS240/244, S6RP or GAPDH. Samples were from a representative phosphoproteomics experiment. Representative of n=2 independent experiments. c, Volcano plot of phosphosites differentially regulated by 1938 (5 μM) relative to DMSO in PI3Kα-WT MEFs. Note, these data are reproduced, enlarged and labelled from Fig. 4b. Red, upregulated phosphosites, Green, downregulated phospho-sites. Boxed phosphosites have been previously reported to be regulated by PI3K signalling (PhosphoSitePlus). d, Insulin stimulation induces phosphorylation of expected PI3K targets in PI3Kα-WT MEFs. Volcano plot of Log2(fold change) versus -log10(adjusted p-value) for phosphosites differentially regulated by (right) 15 min or (left) 4 h 100 nM insulin treatment in PI3Kα-WT MEFs relative to DMSO-treated cells. e, High experimental reproducibility of phosphoproteomics experiment. Quantified phosphopeptides were analysed within the model-based statistical framework MSstats. Data were log2 transformed, quantile normalised, and a linear mixed-effects model was fitted to the data. The group comparison function was employed to test for differential abundance between conditions. p-values were adjusted to control the FDR using the Benjamini-Hochberg procedure. Multi-scatter plot of the Log2(intensity) of signals obtained from each replicate against the Log2(intensity) of the same sample from all other replicates. Numbers indicate the Pearson correlation coefficient for each pair.

