Abstract
Signals from sympathetic neurons and immune cells regulate adipocytes contributing to fat tissue biology. Interactions between the nervous and immune systems have recently emerged as major regulators of host defence and inflammation1–4. Nevertheless, whether neuronal and immune cells cooperate in brain-body axes to orchestrate metabolism and obesity remains elusive. Here we report a novel neuro-mesenchyme unit that controls group 2 innate lymphoid cells (ILC2), adipose tissue physiology, metabolism and obesity via a brain-adipose circuit. We found that sympathetic nerve terminals act on neighbouring adipose mesenchymal cells via the beta-2 adrenergic receptor to control the expression of the glial-derived neurotrophic factor (GDNF) and the activity of ILC2 in gonadal fat. Accordingly, ILC2-autonomous manipulation of the GDNF receptor machinery led to altered ILC2 function, energy expenditure, insulin resistance and propensity to obesity. Retrograde tracing, chemical, surgical and chemogenetic manipulations identified a sympathetic aorticorenal circuit that modulates gonadal fat ILC2 and connects to high-order brain areas, including the paraventricular nucleus of the hypothalamus (PVH). Our work decodes a neuro-mesenchymal unit that translates long-range neuronal circuitry cues into adipose-resident ILC2 function, shaping the host metabolism and obesity.
Obesity results from an excessive accumulation of lipid depots, while these fat reservoirs can be used as high-energy sources during periods of dietary deprivation. Sympathetic neuronal activity drives lipolysis5–7, while group 2 innate lymphoid cells (ILC2) contribute to visceral adipose tissue metabolism via type 2 innate cytokines and Met-Enkephalin (Met-Enk)8–13. This raises the hypothesis that the nervous system and ILC2 cooperate to drive adipose physiology via higher-order brain-body interfaces.
Neuro-mesenchyme units control fat ILC2
Analysis of the main white visceral fat depot in mice, the gonadal adipose tissue (GAT), revealed the presence of a dense network of sympathetic neuronal fibres characterised by tyrosine hydroxylase (TH) expression (Fig.1a). To test whether adrenergic cues impact local ILC2, we eliminated peripheral catecholaminergic neurons using 6-hydroxydopamine (6-OHDA). Ablation of these neurons resulted in a pronounced reduction of ILC2-derived interleukin (IL-) 5, IL-13 and Met-Enk (Fig.1b; Extended Data Fig.1 and Extended Data Fig.2a-e). Sequentially, we selectively ablated peripheral sympathetic neurons by breeding ROSA26.DTR to Th-Cre (R26/DTRTh) mice followed by administration of pegylated diphtheria toxin to the resulting R26/DTRTh animals. Selective ablation of peripheral sympathetic neurons resulted in impaired ILC2 activity (Fig.1c). In contrast, systemic activation of the beta-2 adrenergic receptor (ADRB2) with clenbuterol led to increased ILC2-derived cytokines in the GAT (Fig.1d and Extended Data Fig.2f,g). In agreement, neuronal chemogenetic activation in mice carrying designer receptor exclusively activated by designer drugs (DREADD) on sympathetic neurons (R26/3DTh) led to increased ILC2 function (Fig.1e and Extended Data Fig.2h). To examine how the sympathetic tone regulates fat ILC2, Adrb2 was deleted in lymphoid cells by breeding Il7ra-Cre mice to Adrb2fl/fl mice (Adrb2ΔIl7ra). Adipose ILC2 function was unperturbed in Adrb2ΔIl7ra mice (Fig.1f), suggesting that sympathetic cues regulate adipose ILC2 indirectly. Supporting this hypothesis, 6-OHDA administration to Adrb2ΔIl7ra mice efficiently impaired ILC2 cytokine production (Fig.1g). To elucidate the cellular link between sympathetic neuronal cues and ILC2 activity, we studied the expression of Adrb2 in non-immune cell types of the GAT. Mesenchymal stromal cells (MSC) that express platelet-derived growth factor receptor alpha (PDGFRA) displayed the highest level of Adrb2 followed by glial cells, endothelial cells, adipocytes and other mesenchymal counterparts (Fig.1h and Extended Data Fig.2i,j). Interestingly, we found that glial cells and MSC are in close proximity to GAT sympathetic axons (Fig.1i,j). Thus, we interfered with the expression of ADRB2 in glial cells and MSC by breeding Gfap- or Pdgfra-Cre mice to Adrb2fl/fl mice (Adrb2ΔGfap and Adrb2ΔPdgfra, respectively). While mice with a glial-autonomous deletion of ADRB2 had unperturbed ILC2 function, Adrb2ΔPdgfra mice displayed reduced fat ILC2-derived cytokines when compared to their littermate controls (Fig.1k,l). Taken together, these data indicate that neuro-mesenchyme signals regulate GAT ILC2.
Figure 1. Sympathetic-mesenchyme interactions control ILC2 in the GAT.
a, GAT. Red: sympathetic nerve fibres (TH). Green: endothelial cells (CD31). Scale bar: 300μm. b, ILC2 function after 6-OHDA administration. n=5. c, ILC2 cytokines after PegDT-treatment. n=4. d, ILC2 function after Clenbuterol administration. n=5. e, ILC2 cytokines after CNO administration. R26/3Dfl n=5, R26/3DΔTh n=4. f, GAT ILC2. Adrb2WT n=7, Adrb2ΔIl7ra n=8. g, ILC2 function after 6-OHDA administration. Adrb2WT n=13, Adrb2ΔII7ra n=15. h, GAT cell populations. n=6. i, Green: sympathetic nerve fibres (TH). Red: glial cells (GFAP). Blue: cell nuclei (DAPI). Scale bar: 50μm. j. Green: sympathetic nerve fibres (TH). Red: MSCs (PDGFRA). Scale bar: 20μm. k, GAT ILC2. Adrb2fl n=6, Adrb2ΔGfap n=8. l, GAT ILC2. Adrb2fl n=10, Adrb2ΔPdgfra n=8. Data are representative of 3 independent experiments. n represents biologically independent animals. Data are presented as mean values and error bars: SEM. Two-tailed unpaired Welch's t-test (b-g, k, l). Ordinary one-way ANOVA with Dunnett's multiple comparisons test (h). *P<0.05; **P<0.01; ***P<0.005; ****p<0.001; ns not significant.
Mesenchyme-derived GDNF controls ILC2
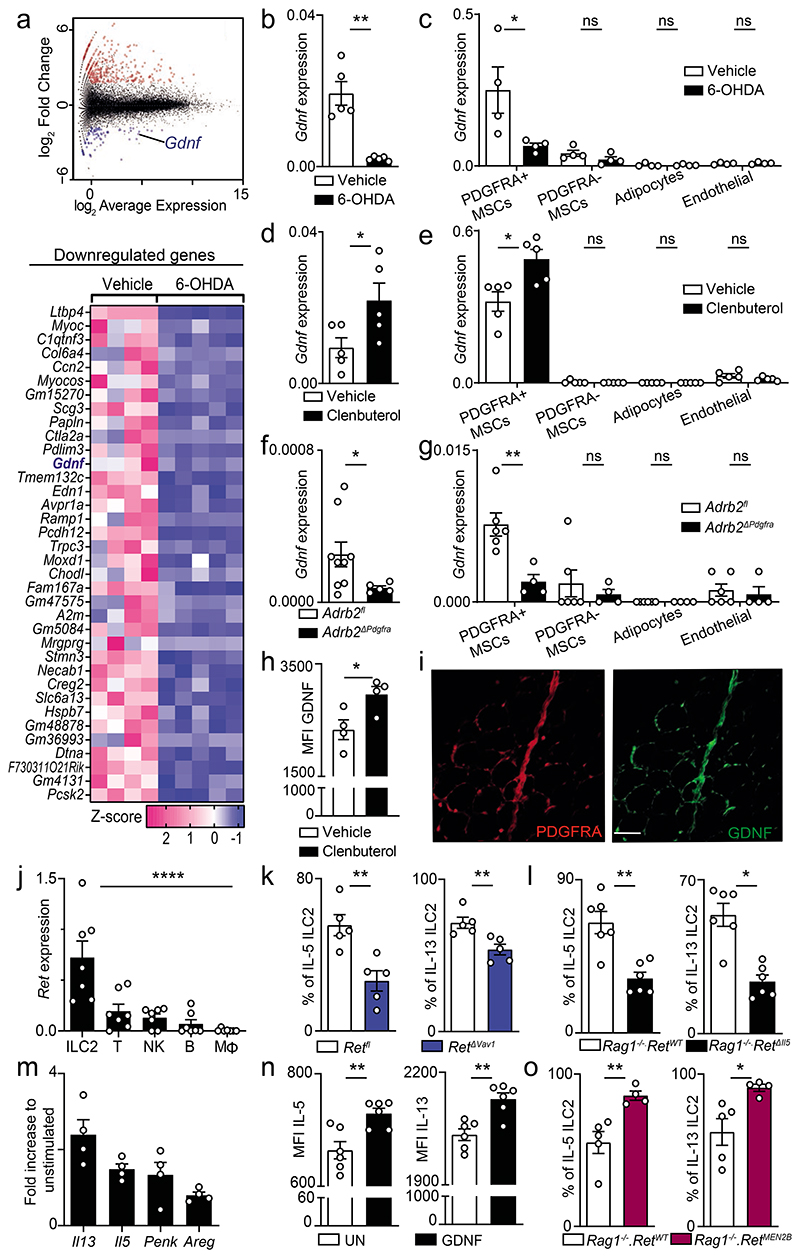
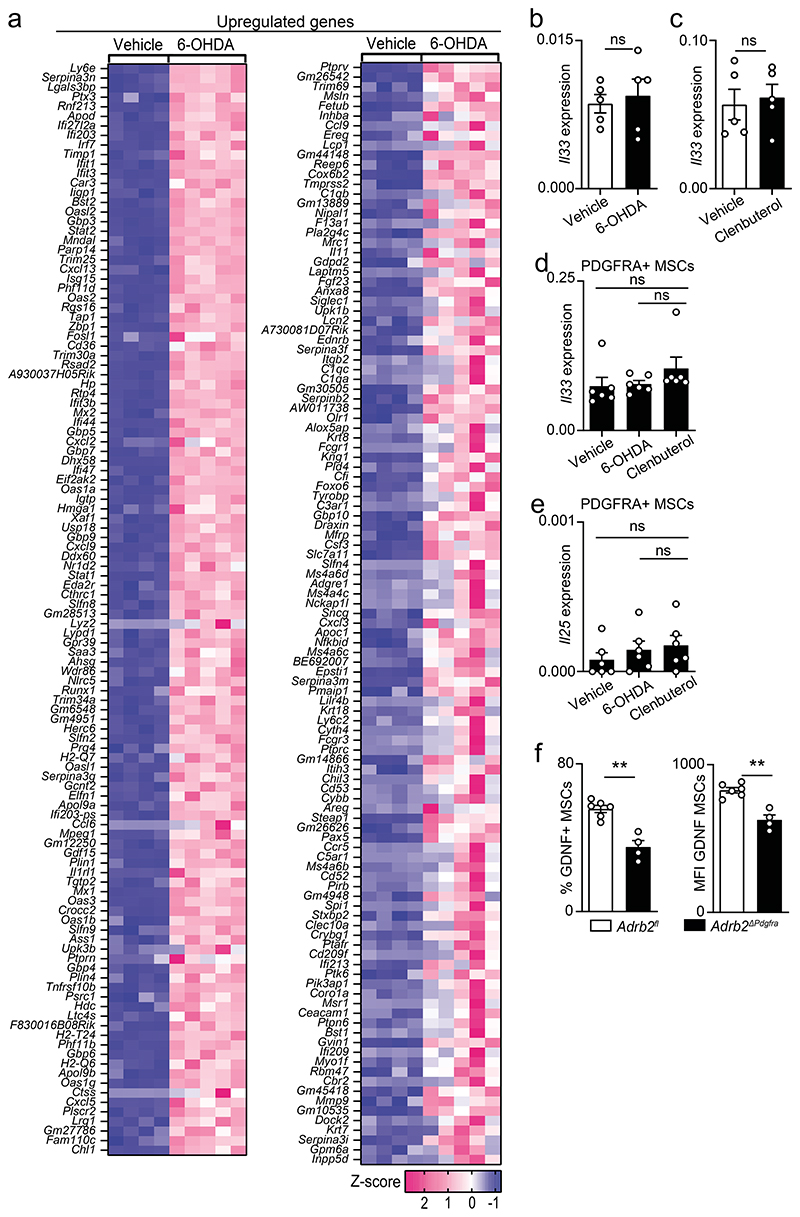
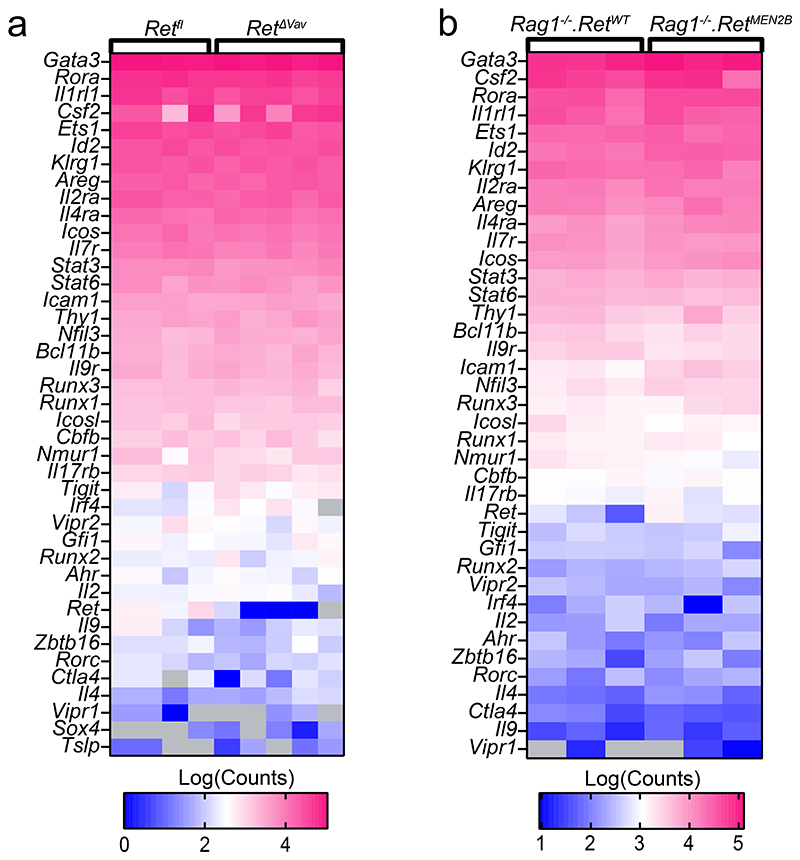
To examine how neuro-mesenchyme interactions lead to activation of GAT-resident ILC2, we initially employed genome-wide transcriptional profiling of PDGFRA positive MSC from 6-OHDA treated mice and their littermate controls. This analysis revealed 227 modulated transcripts of which 36 were downregulated (Fig.2a and Extended Data Fig.3a). Importantly, expression of the ILC2-activating alarmins IL-33 and IL-25 was unperturbed in mice treated with either 6-OHDA or clenbuterol (Fig.2a and Extended Data Fig.3a-e). Amongst the altered genes, the glial-derived neurotrophic factor (GDNF) was highly expressed by PDGFRA positive MSC, and 6-OHDA treatment significantly reduced its expression (Fig.2a). Importantly, chemical sympathetic ablation or ADRB2 stimulation led to Gdnf modulation in the GAT, notably in PDGFRA+ MSC, while Gdnf expression was unperturbed in other mesenchymal cells, adipocytes and endothelial cells (Fig.2b-e). In agreement, GAT and MSC purified from Adrb2ΔPdgfra had reduced GDNF expression (Fig.2f,g and Extended Data Fig.3f). In line with these findings, stimulation of ADRB2 in purified MSC led to increased MSC-derived GDNF and PDGFRA+ GAT cells colocalised with GDNF14,15 (Fig.2h,i). GDNF family ligands and their preferred coreceptors (GFRα) have been shown to activate the tyrosine kinase receptor RET in the nervous system, kidney and subsets of haematopoietic cells15–19. Analysis of GAT immune cell subsets revealed that GAT ILC2 express relative high levels of Ret (Fig.2j). To explore the role of this receptor tyrosine kinase in adipose ILC2, initially we deleted Ret in haematopoietic cells by breeding Vav1-Cre to Retfl/fl mice (RetΔVav1). RetΔVav1 mice displayed reduced ILC2-derived IL-5, and IL-13 in the GAT, while the genetic signature associated with ILC2 identity demonstrated that those genes were unperturbed in GAT ILC2 from RetΔVav1 mice (Fig.2k and Extended Data Fig.4). In line with this finding, analysis of RET co-receptor single knockouts revealed that Gfra1, the preferential GDNF coreceptor, was selectively required for ILC2 function (Extended Data Fig.5a-c). Sequentially, we performed mixed bone marrow (BM) chimaeras by transferring Ret competent (Retfl) or deficient (RetΔVav1) BM against a wild type competitor into alymphoid hosts (Extended Data Fig.5d). Analysis of these chimeric mice suggested that cell intrinsic RET signals are required for innate type 2 cytokines in the GAT (Extended Data Fig.5e). To further confirm ILC2-autonomous effects of RET, we bred Il5-Cre to Retfl/fl mice (RetΔIl5), and RetΔIl5 mice were subsequently bred to Rag1-/- mice to exclude putative T helper cell effects. Analysis of Rag1-/-.RetΔIl5 mice confirmed that RET operates in an ILC2-autonomous manner to control innate type 2 cytokines and Met-Enk in the GAT (Fig.2l and Extended Data Fig.5f-i). In agreement, in vitro activation of purified ILC2 with GDNF family ligands resulted in increased innate cytokine production and analysis of gain-of-function RetMEN2B bone marrow chimaeras revealed increased ILC2-derived IL-5, IL-13 and Met-Enk (Fig.2m-o; Extended Data Fig.5j-l). Finally, chemical sympathetic ablation in RetΔIl5 mice resulted in unperturbed ILC2 cytokine production, indicating that ILC2-autonomous RET signals are required to integrate the sympathetic tone (Extended Data Fig.6a). Altogether, these data indicate that neuro-mesenchyme interactions orchestrate fat ILC2 via the neurotrophic factor receptor RET.
Figure 2. Sympathetic cues orchestrate mesenchyme-derived GDNF and innate type 2 cytokines.
6-OHDA treatment (a-c). a, RNAseq of PDGFRA+ MSC. Top: Mean-difference plot of vehicle versus 6-OHDA. Bottom: heatmap of downregulated genes. Vehicle n=4, 6-OHDA n=5. b, Total GAT RNA. n=5. c, GAT cell populations. n=4. (d,e) Clenbuterol administration. d, Total GAT RNA. n=5. e, GAT cell populations. n=5. f, Total GAT RNA. Adrb2fl n=9, Adrb2ΔPdgfra n=5. g, GAT cell populations. Adrb2fl n=6, Adrb2ΔPdgfra n=4. h, GDNF Median Flourescence Intensity (MFI) in MSC. n=4. i, GAT. Green: GDNF. Red: PDGFRA. Scale bar: 50μm. j, ILC2, T cells (T), natural killer cells (NK), B cells (B), macrophages (Mφ). n=7. k, GAT ILC2. n=5. l, GAT ILC2. n=6. (m, n) In vitro stimulation with GDNF. m, GAT ILC2. n=4. n, MFI innate type 2 cytokines. n=6. o, ILC2 from BM chimaeras. Rag1-/-.RetWT n=5, Rag1-/-.RetMEN2B n=4. Data are representative of 3 independent experiments. n represents biologically independent animals. Data are presented as mean values and error bars: SEM. Two-tailed unpaired Welch's t-test (b-h, k-o). One-way ANOVA (j). *P<0.05; **P<0.01; ***P<0.005; ns not significant.
ILC2-intrinsic RET cues control obesity
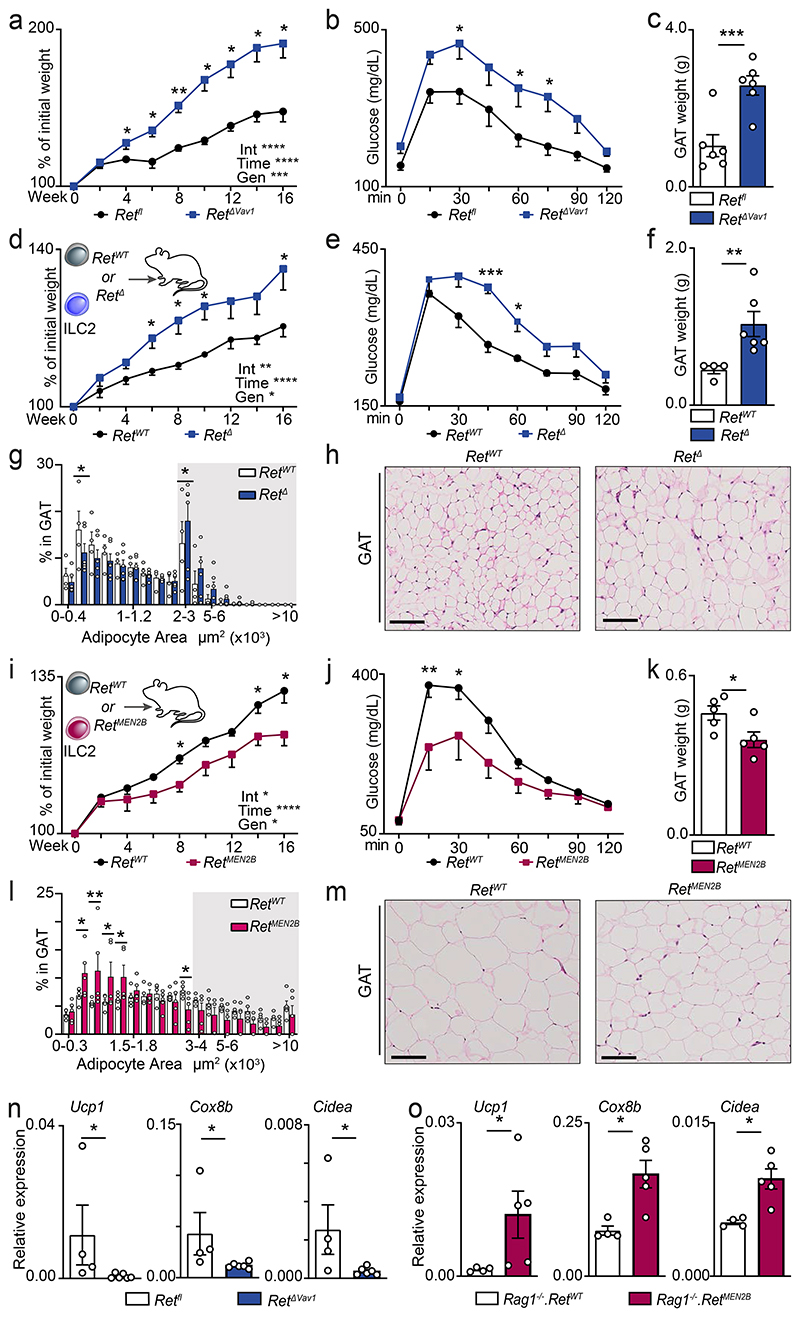
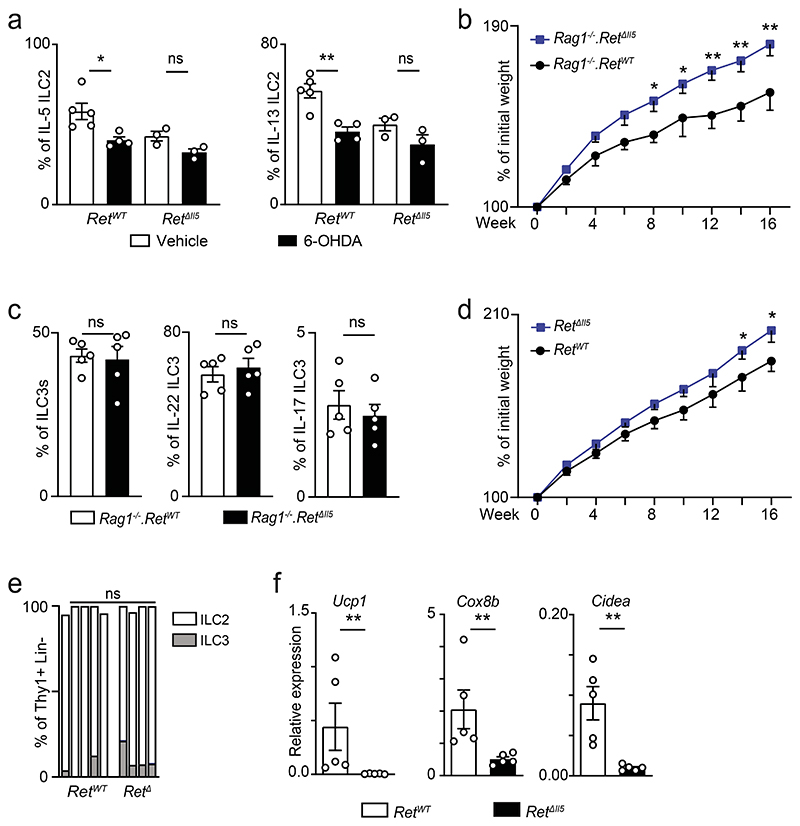
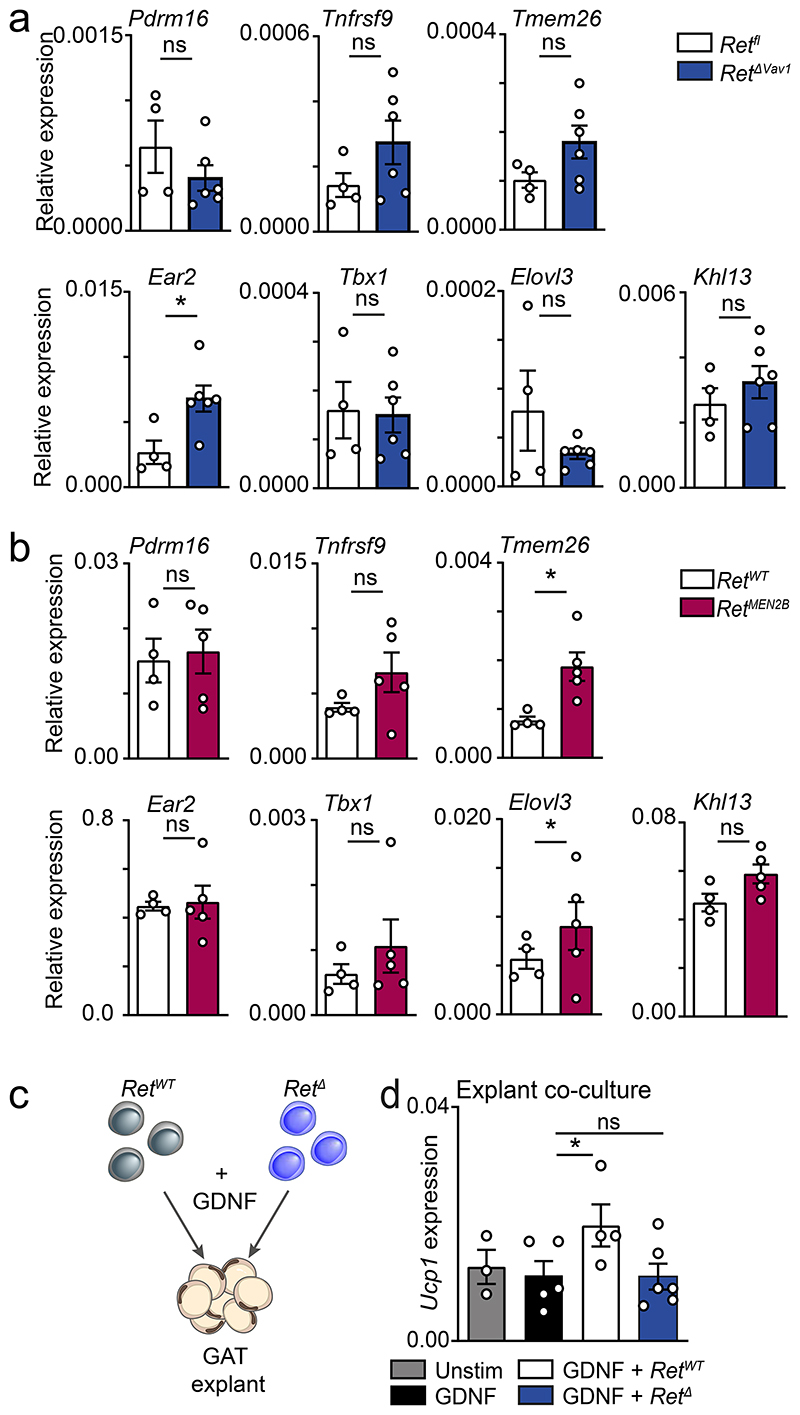
To determine whether ILC2-intrinsic RET signals regulate adipose tissue physiology, we tested how varying degrees of RET signals set the propensity to obesity and associated impaired glucose tolerance20. Initially, RetΔVav1 mice were fed with high-fat diet (HFD). When compared to their littermate controls, RetΔVav1 had increased susceptibility to HFD-induced obesity, decreased glucose tolerance and increased GAT weight (Fig.3a-c). In line with these findings, RetΔI15 and Rag1-/-.RetΔIl5 mice also displayed increased HFD-induced obesity (Extended Data Fig. 6b-d). To further define the link between ILC2, GDNF-RET signalling and propensity to obesity, we generated chimaeras of RET-sufficient and RET-deficient ILC2 in alymphoid host mice. RET-deficient ILC2-chimaeras had increased susceptibility to HFD-induced obesity, decreased glucose tolerance and altered frequencies of adipocyte sizes (Fig.3d-h and Extended Data Fig.6e). In contrast, chimaeras generated with ILC2 from gain-of-function RetMEN2B mice displayed resistance to HFD-induced obesity, improved glucose tolerance and increased frequency of small size adipocytes (Fig.3i-m). Type 2 cytokines and Met-Enk have been shown to promote energy expenditure through adipose tissue “beigeing”9,11,12,21. To define the contribution of ILC2 and neuroregulatory cues in this process, we assessed the expression of adipocyte energy expenditure genes in RET loss- and gain-of-function models. When compared to their littermate controls, RetΔVav1 and RetΔI15 mice had reduced Ucp1, Cox8b and Cidea expression in the GAT, while RetMEN2B BM chimaeras displayed increased levels of these genes (Fig.3n,o; Extended Data Fig.6f and Extended Data Fig.7a,b). Further evidence that ILC2-autonomous GDNF-RET cues are required for energy expenditure gene expression was provided by ILC2 complementation of GAT explant cultures from Rag1-/-.Il2rg-/- mice (Extended Data Fig.7c). Notably, addition of GDNF to GAT explant/ILC2 co-cultures efficiently induced Ucp1 expression in a RET dependent manner (Extended Data Fig.7d). In aggregate, these data indicate that ILC2-intrinsic neurotrophic factor cues are required to control adipose homeostasis and obesity.
Figure 3. ILC2-intrinsic RET cues control adipose tissue physiology and obesity.
16 weeks of HFD regimen (a-m). a, Weight gain. n=6. b, Glucose tolerance test. n=6. c, GAT weight. n=6. ILC2 chimaeras: (d-h) ILC2 RetWT or RetΔ transplants; (i-m) ILC2 RetWT or RetMEN2B transplants. d, Weight gain. RetWT n=5, RetΔ n=6. e, Glucose tolerance test. RetWT n=4, RetΔ n=6. f, GAT weight. RetWT n=4, RetΔ n=6. g, Adipocyte area. Background: white 200μm2 range intervals; grey 1000μm2 range intervals. RetWT n=4, RetΔ n=6. h, GAT. Scale bar: 100μm. i, GAT weight. n=5. j, Glucose tolerance test. n=5. k, GAT weight. n=5. l, Adipocyte area. Background: white 300μm2 range intervals; grey 1000μm2 range intervals. n=5. m, GAT. Scale bar: 100μm. n, GAT. Retfl n=4, RetΔVav1 n=6. o, GAT. Rag1-/-.RetMEN2B BM chimaeras. Rag1-/-.RetWT n=4, Rag1-/-.RetMEN2B n=5. Data are representative of 3 independent experiments. n represents biologically independent animals. Data are presented as mean values and error bars: SEM. Two-sided two-way repeated measures ANOVA (a,b,d,e,i,j), corrected for multiple comparisons Benjamini, Krieger and Yekutieli procedure with tests for interaction (Int), time and genotype (Gen) reported (a,d,i), and corrected for multiple comparisons with Sidak's multiple comparisons test (b,e,j). Two-tailed unpaired Welch's t-test (c,f,k). Twotailed unpaired Student t-test, one per range interval (g,l). Two-sided Mann-Whitney test (n, o). *P<0.05; **P<0.01; ***P<0.005; ****p<0.001; ns not significant.
A brain-connected circuit controls ILC2
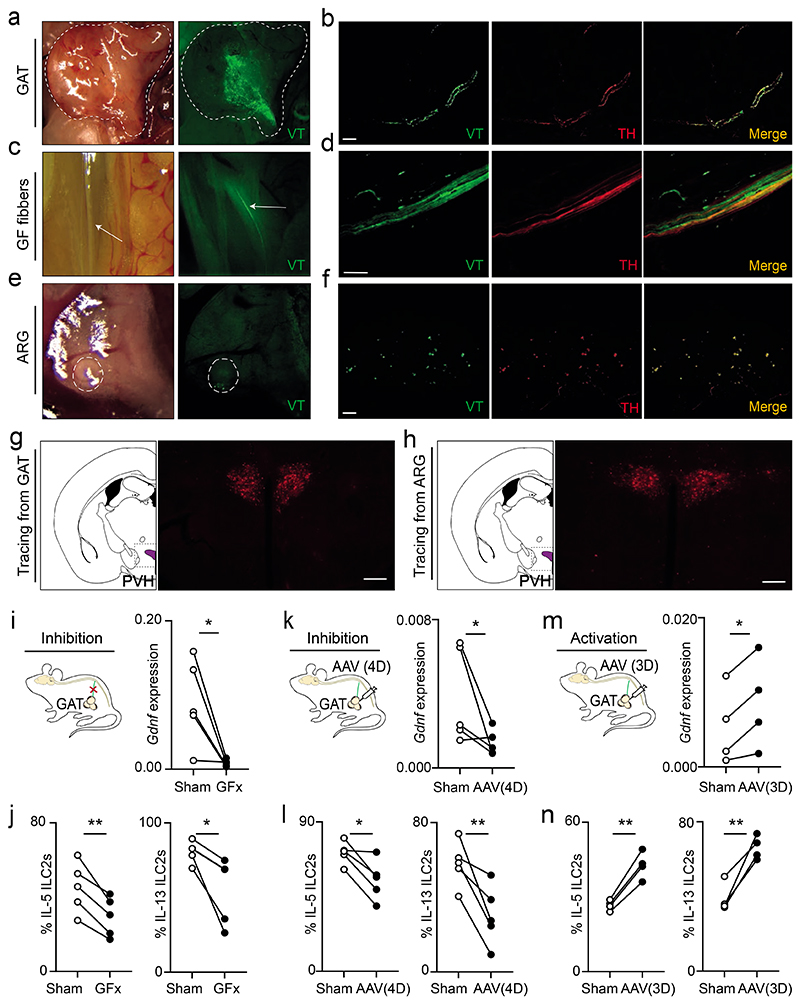
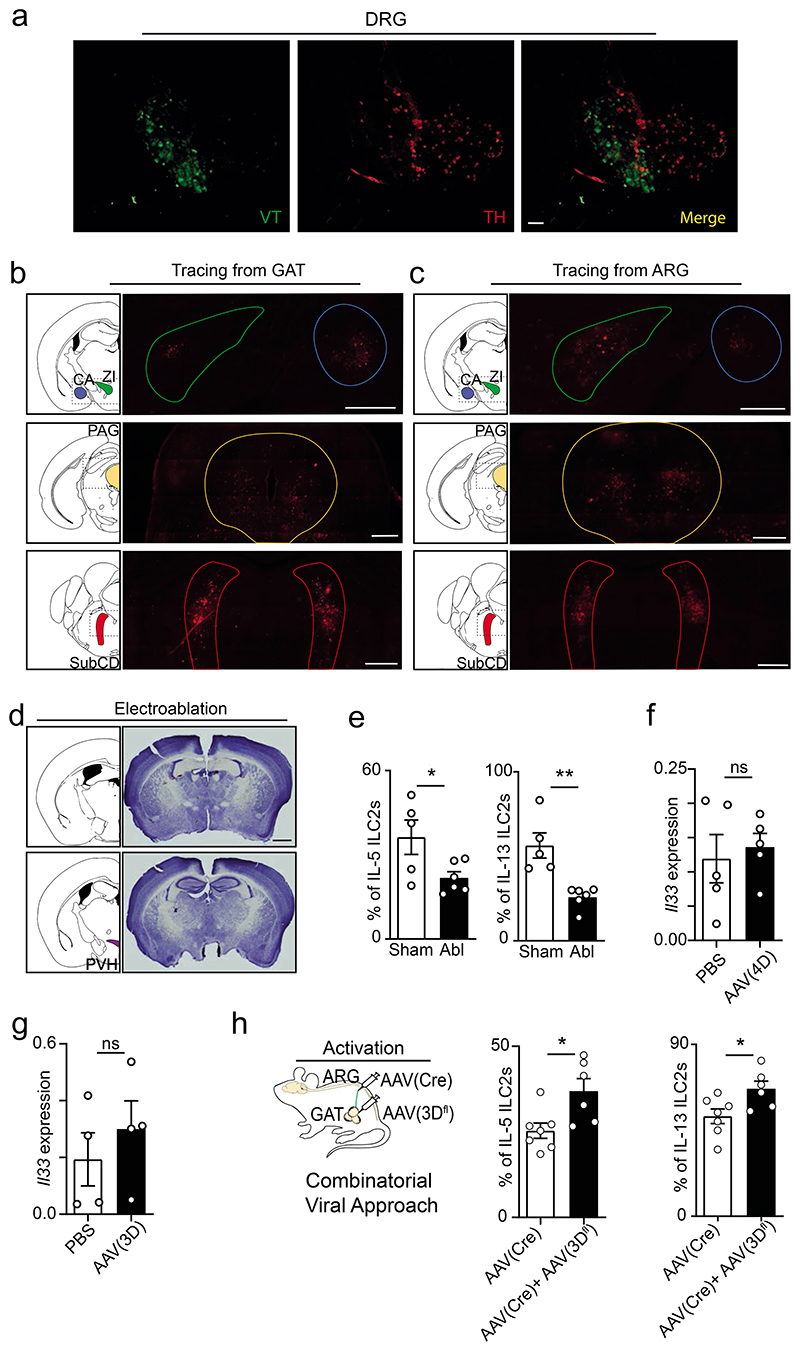
To examine how local sympathetic fibres integrate regional and higher-order circuits, we sought to characterize the connections of GAT neurons. Initially, we performed viral tracing (VT) by injecting retrograde green fluorescent protein (GFP)-labelled adeno-associated virus (AAV) into the GAT. Analysis of such mice revealed the infection of tyrosine hydroxylase (TH) positive neurons in the adipose tissue and sympathetic TH positive fibres of the genitofemoral nerve running longitudinally to the ventral side of the psoas muscle (Fig.4a-d). Importantly, discrete neuronal cell bodies were traced to the prevertebral aorticorenal ganglion (ARG) and dorsal root ganglia (DRG) (Fig.4e,f and Extended Data Fig.8a). Nevertheless, while GFP labelled cell bodies in the aorticorenal ganglia were TH positive neurons, their DRG counterparts were TH negative, indicating that the renal ganglion contains cell bodies of the efferent sympathetic innervation of the GAT (Fig.4e,f and Extended Data Fig.8a). To interrogate if the GAT-aorticorenal axis connects to high-order circuits, we performed polysynaptic tracing using fluorescent protein-producing pseudorabies virus (PRV). Retrograde tracing with PRV from the GAT or from the aorticorenal ganglion revealed polysynaptic connections to overlapping discrete brain areas in the brain stem, midbrain, amygdala and hypothalamus (Fig.4g,h and Extended Data Fig.8b,c). Noteworthy, the paraventricular nucleus of the hypothalamus (PVH) was consistently traced from the GAT and from the aorticorenal ganglion, indicating that the GAT connects polysynaptically to this hypothalamic nucleus (Fig.4g,h). Interestingly, the PVH was previously reported to regulate the brain sympathetic outflow to peripheral body tissues22,23, which is consistent with impaired adipose innate type 2 cytokines observed in mice with surgical stereotaxic PVH ablation (Extended Data Fig.8d,e).
Figure 4. An aorticorenal-adipose circuit connects to the brain and regulates ILC2.
(a-f) Green: Viral tracing (VT). Red: TH. Scale bar: 50μm. a, GAT. b, GAT sympathetic (TH) fibres. c, Genitofemoral nerve (arrows). d, TH positive fibres of the genitofemoral nerve. e, Aorticorenal ganglion (circled). f, TH positive neuronal cell bodies in the aorticorenal ganglion. g, Left: Brain atlas scheme of coronal section. Right: PRV-RFP viral tracing from the GAT corresponding to the highlighted area on the left. h, Left: Brain atlas scheme of coronal section. Right: PRV-RFP viral tracing from the aorticorenal ganglion (ARG) corresponding to the highlighted area on the left. Scale bar 200μm (g,h). i, Left: surgical GF ablation scheme. Right: GAT Gdnf. n=5. j, GAT ILC2. n=5. k, Left: chemogenetic inhibition scheme. Right: GAT Gdnf. n=5. l, GAT ILC2. n=5. m, Left: chemogenetic activation scheme. Right: GAT Gdnf. n=4. n, GAT ILC2. n=4. Data are representative of 3 independent experiments. n represents biologically independent animals. Data are presented as mean values and error bars: SEM. Two-tailed paired Student t-test. *P<0.05; **P<0.01; ***P<0.005; ns not significant.
To further dissect the impact of the aorticorenal neuronal circuit on GAT ILC2, we performed unilateral surgical ablations of the genitofemoral nerve (GFx). When compared to the sham contralateral controls, the GFx GAT harboured ILC2 with impaired function that associated with decreased GDNF expression (Fig.4i,j). To better define the link between GAT innervating aorticorenal neurons and ILC2 function, we modulated the activity of these neurons using chemogenetic approaches. Thus, inhibitor or activator DREADD-carrying adeno-associated virus (AAV) (AAV(4D) and AAV(3D), respectively) were injected unilaterally in the GAT. Sequentially, we administrated the designer drug (Clozapine-N-oxide (CNO)) that leads to neuronal inhibition or stimulation of DREADD-carrying neurons. When compared to their respective sham contralateral controls, inhibition of AAV(4D)-expressing neurons led to reduced Gdnf and innate type 2 cytokines, while activations of AAV(3D)-carrying neurons resulted in increased Gdnf and ILC2 function (Fig.4k-n and Extended Data Fig.8f-h). Taken together, these data reveal a novel aorticorenal-adipose circuit that connects to discrete brain areas and controls GAT ILC2 function.
Discussion
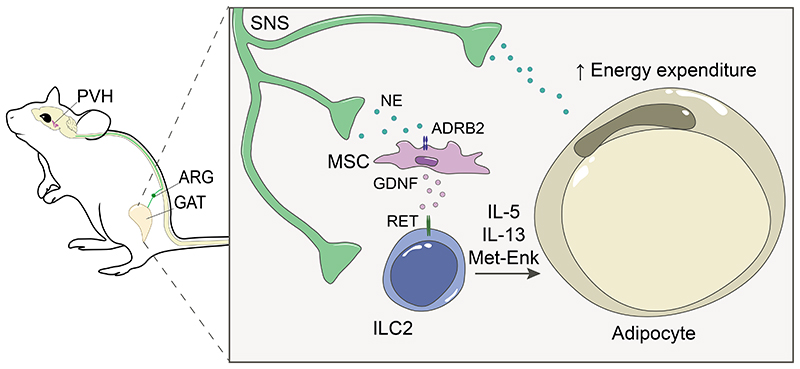
Defining whether neuronal circuits and immune cells cooperate to drive inter-organ communication is critical to understand organismic physiology and systemic diseases. Our work establishes an unappreciated inter-organ and multi-tissue communication circuitry that integrates neuronal- and mesenchymal-derived signals to orchestrate ILC2 function and obesity. We found that a brain-body axis conveys to a sympathetic aorticorenal-adipose interface that regulates ILC2. Notably, neuro-mesenchyme units translate the sympathetic tone into neurotrophic factor expression in the GAT. In turn, neurotrophic factors control adipose ILC2 function via the neuroregulatory receptor RET, shaping energy expenditure, the host metabolism and obesity (Extended Data Fig.9).
Mesenchymal cells were shown to regulate immune cell homeostasis in the visceral fat via IL-3324–26, and this alarmin was shown to be modulated by sympathetic inputs in subcutaneous fat27. Here we show that visceral fat mesenchymal cells link sympathetic cues to ILC2 function via the GDNF/RET axis, suggesting that visceral and subcutaneous adipose tissue may integrate adrenergic signals distinctively. While sympathetic cues were shown to directly inhibit pulmonary ILC2 during infection28, we found that adrenergic signals indirectly activate GAT ILC2, indicating that sympathetic signals may encompass dual mechanisms to activate or repress ILC2 in a context- and organ-dependent manner.
Neuronal sympathetic cues directly mediate fat breakdown in the context of neuro-adipose connections7. Our work indicates that sympathetic cues indirectly regulate energy expenditure via neuro-mesenchyme interactions that lead to ILC2-derived cytokine production. As such, coupling these direct and indirect sympathetic effects to regulate energy homeostasis may have ensured efficient and integrated multi-tissue responses to dietary challenges. Given the importance of the brain PVH in integrating systemic metabolic cues23, in modulating sympathetic outflow22,23, and its connection to the aorticorenal-adipose circuit (Fig.4g,h and Extended Data Fig.9), it is tempting to hypothesise that the PVH acts as a central hub that translates metabolic body states into peripheral immune functions that ensure energy homeostasis. Finally, our data may also grant better knowledge on how abnormal neuronal and immune functions associate with obesity and metabolic disorders in humans9,29,30.
Methods
Mice
C57BL/6J mice were purchased from Charles River and bred with C57BL/6J Ly5.1 in order to obtain C57BL/6 Ly5.1/Ly5.2 (CD45.1/CD45.2). Gfap-Cre31, Pdgfra-Cre32, Vav1-Cre33, Il7ra-Cre34, Il5-Cre35, Th-Cre36, Adrb2fl/fl 37, Rag1-/- 38, Il2rg-/- 39, RetMEN2B 40, ROSA26.RFP41, ROSA26.3D42, ROSA26.DTR43, Retfl/fl 44, Gfra1-/- 45, Gfra2-/- 46, and Gfra3-/- 41, were in a full C57BL/6J background. Mice were bred and maintained at the Champalimaud Centre for the Unknown animal facilities under specific pathogen free conditions in 12/12hour light/dark cycles, at 21°C and 50% humidity. Mice were systematically compared with co-housed littermate controls unless stated otherwise. 8-9-week-old females were used in this study. Power analysis was performed to estimate the number of experimental mice. Based on previous studies48, this analysis estimated a group size of 4 to obtain an effect size with a power of >0.95. All animal experiments were approved by national and institutional ethical committees, respectively, Direção Geral de Veterinária and CCU ethical committees. Randomisation and blinding were not used unless stated otherwise.
Cell isolation
For the isolation of adipose tissue cells, tissue was collected into PBS, cut into small pieces and incubated with Liberase TM (2.5μg/ml, Roche) and DNase I (20U/ml; Roche) for 1h at 37°C under gentle agitation. A single cell suspension was obtained by passage through a 100μm cell strainer (Thermo Fisher Scientific) and centrifugation was used to separate the stromal vascular fraction from the adipocyte fraction. Erythrocytes were lysed with red blood cell lysis buffer (eBioscience) and removed by centrifugation.
Flow cytometry and cell sorting
For cytokine analysis ex vivo, cells were incubated with PMA (50ng/ml), ionomycin (500ng/ml) (Sigma) and brefeldin A (eBioscience) in complete RPMI (supplemented with 10% foetal bovine serum (FBS), 1% HEPES, sodium pyruvate, glutamine, streptomycin and penicillin (Corning)) for 4 hours prior to intracellular staining, unless stated otherwise. Intracellular staining was performed using IC fixation/ permeabilization kit (eBioscience). Cell suspensions were stained with anti-CD45 (30-F11; 1:200); anti-NK1.1 (PK136; 1:100); anti-CD3ɛ (eBio500A2; 1:200); anti-KLRG1 (2F1/KLRG1; 1:200); anti-CD16/CD32 (93; 1:50); anti-gp38 (eBio8.1.1; 1:100); anti-F4/80 (BM8; 1:200); anti-IL-22 (1H8PWSR; 1:200); anti-NKp46 (29A1.4; 1:200); LIVE/DEAD Fixable Aqua Dead Cell Stain Kit (1:50) and anti-IL-13 (eBio13A; 1:200) were purchased from Invitrogen. Anti-PDGFRA (APA5; 1:400); anti-CD45.1 (A20; 1:200); anti-CD45.2 (104; 1:200); anti-CD11c (N418; 1:200); anti-NK1.1 (PK136; 1:100); anti-CD11b (M1/70; 1:400); anti-CD8α (53-6.7; 1:200); anti-CD19 (eBio1D3; 1:200); anti-TER119 (TER-119; 1:200); anti-Gr1 (RB6-8C5; 1:400); anti-CD4 (RM4-5; 1:200); anti-CD90.2 (Thy-1.2; 53-2.1; 1:200); anti-CD3ɛ (C8.8; 1:200); anti-TCRβ (H57-597; 1:200); anti-TCRγδ (GL3; 1:200); anti-B220 (RA3-6B2; 1:200); anti-Ly-6A/E (Sca-1; D7; 1:200); anti-IL-17 (TC11-18H10.1; 1:200) and anti-CD31 (MEC13.3; 1:200) from Biolegend. Anti-RORγt (Q31-378; 1:200); anti-IL-5 (TRFK5; 1:200) and from BD Biosciences. Anti-GDNF (B-8; 1:100) was purchased from Santa Cruz biotechnology. Anti-Met-Enk (bs-1759R-A680; 1:400) from Bioss. Cell populations were gated on live cells and defined as ILC2: CD45+Lin−Thy1.2+Sca-1+KLRG1+, ILC3: CD45+Lin-Thy1.2highRORγt+, lineage was composed by CD3ε, CD8α, TCRβ, TCRγδ, CD19, Gr1, CD11c, CD11b and TER119; glial cells: CD45-CD31-GFAP+, PDGFRA+ MSCs: CD45-CD31- PDGFRA+gp38+SCa-1+, or PDGFRA- MSCs: CD45-CD31-PDGFRA-gp38+ endothelial cells: CD45-CD31+. Flow cytometry analysis and cell sorting were performed using FACSFusion, LSRFortessa and LSRFortessa X-20 (BD Biosciences). Sorted populations were >95% pure. Data analysis was done using FlowJo v10 software (Tristar).
Sympathetic manipulation
Chemical sympathetic ablation was performed by injecting 200mg/kg 6-OHDA (Sigma) intraperitonially, 3 days and 1 day before analysis. Control mice were injected on the same days with the PBS 0.4% ascorbic acid (Sigma) used as a vehicle for 6-OHDA. To elucidate the impact of 6-OHDA in motor activity, mice were analysed in an open field test system as previously described49. Mice were recorded for 9 minutes and recordings were analysed using Bonsai 2.6 (available at https://bonsai-rx.org/). Sympathetic ablation was also performed by administering pegylated diphtheria toxin to R26/DTRTh mice as previously described50. For activation of ADRB2, its agonist clenbuterol (Sigma) was administered in the drinking water with 4% sucrose to a final concentration of 10mg/kg/day, for 8 days. Control animals were given water with 4% sucrose for 8 days. For chemogenetic activation of sympathetic neurons in R26/3DTh mice, 4mg/kg CNO (Sigma) were administered daily for 3 days, 2mg/kg in the drinking water with 4% sucrose, and 2mg/kg intraperitonially in PBS51, and animals were analysed at day 4.
Quantitative RT-PCR
Total RNA from sorted or cultured cells was extracted using RNeasy micro kit or RNeasy mini kit (Qiagen) according to the manufacturer’s protocol. When indicated, total adipose tissue or adipocyte fraction was collected to Trizol (Invitrogen) followed by chloroform and isopropanol RNA extraction, according to the manufacturer’s protocol. RNA concentration was determined using Nanodrop Spectrophotometer (Nanodrop Technologies). Quantitative real-time PCR was performed in StepOne and QuantStudio 5 real-time PCR systems (Applied Biosystems) with Hprt and Gapdh as housekeeping genes. Briefly, High-Capacity RNA-to-cDNA Kit (Applied Biosystems) were used to retro-transcribe RNA, followed by a pre-amplification PCR using TaqMan PreAmp Master Mix (Applied Biosystems). TaqMan Gene Expression Master Mix (Applied Biosystems) was used in the real-time PCR. TaqMan Gene Expression Assays (Applied Biosystems) were the following: Hprt Mm00446968_m1; Gapdh Mm99999915_g1; Il5 Mm00439646_m1; Il13 Mm00434204_m1; Areg Mm01354339_m1; Penk Mm01212875_m1; Ret Mm00436304_m1; Gdnf Mm00599849_m1; Adrb2 Mm02524224_s1; Il25 Mm00499822_m1; Il33 Mm00505403_m1; Ucp1 Mm01244861_m1; Cidea Mm00432554_m1; Cox8b Mm00432648_m1; Tmem26 Mm01173641_m1; Elovl3 Mm00468164_m1; Klhl13 Mm00470674_m1; Ear2 Mm04207376_gH; Tbx1 Mm00448949_m1; Tnfrsf9 Mm00441899_m1; Pdrm16 Mm00712556_m1. Analysis was obtained with QuantStudio Design and Analysis Software v1.4.2 (Applied Biosystems) and performed using the comparative CT method (2−ΔCT). When comparison or fold change between samples was required, the comparative ΔCT method (2−ΔΔCT) was applied.
RNA sequencing and data analysis
PDGFRA+ MSCs from mice treated with 6-OHDA or vehicle and GAT ILC2 from RetΔVav1, RetMEN2B and their littermate controls were isolated, and RNA was extracted and purified. RNA quality was assessed using an Agilent 2100 Bioanalyzer (Agilent Technologies) and raw data with adapter sequences or low-quality sequences was filtered. For the MSCs, sequencing was performed on an HiSeq4000 platform (PE100, Illumina). Global quality of FASTQ files with raw RNA-sequencing reads was analysed using FastQC (version 0.11.9)52. Trimmomatic-0.39 was used to remove the first 10 base pairs (HEADCROP=10)53. Aligning and read processing were performed using STAR 2.7.3a (https://github.com/alexdobin/STAR/releases)54, sequences were aligned to the reference file of Mus musculus genome assembly GRCm38.p6 and the corresponding genome annotation file (http://www.ensembl.org/Mus_musculus/Info/Index). Volcano plot of differentially expressed genes was obtained using EdgeR (version 3.30.3) (https://bioconductor.org/packages/release/bioc/html/edgeR.html)55. DeSeq2 (version 1.28.1) (https://bioconductor.org/packages/release/bioc/html/DESeq2.html) was used to obtain the statistics of all genes56. Genes with lower than 10 average reads, false discovery rate (FDR) above 0.05, and a log2 (difference between groups) above -2 and below 2, were excluded from further analysis. For the MSC data, a list of differentially expressed genes was thus obtained comprising 227 upregulated genes and 36 downregulated genes, in the 6-OHDA group. The heat maps of modulated genes in MSCs were obtained by plotting the z-scores (normalized read counts per gene). For GAT ILC2, samples were sequenced in a DNBSEQ-G400 instrument, with PE100 sequencing length. SOAPnuke software (filter parameters: remove reads with more than 25% adapters, remove if 50% bases having a quality value lower than 20, delete reads with >5%) was used for a series of data processing to remove contamination and obtain clean reads. Clean reads were aligned to the Mus musculus reference genome (GCF_000001635.26_GRCm38.p6) using HISAT and Bowtie2 was used to align the clean reads to the reference genes. To perform differential expression of count data we used EdgeR (Galaxy Version 3.34.0+galaxy1) to normalize the read counts and determine any differentially expressed genes. Heatmaps of Log (Normalized counts) were made for ILC2-related genes described previously57. Heatmaps were obtained using the GraphPad Prism software (GraphPad Software, La Jolla, Calif).
In vitro and in vivo MSC activation
For in vitro experiments, purified GAT PDGFRA+ MSCs were cultured in complete DMEM (supplemented with 10% FBS, 1% HEPES, sodium pyruvate, glutamine, streptomycin and penicillin (Corning)) at 37°C. After 2 hours of rest in complete DMEM without FBS, MSCs were stimulated for 16 hours with 10μg/ml clenbuterol. For RNA analysis, MSCs were lysed using RLT buffer (Qiagen). For GDNF protein analysis, MSCs were incubated with brefeldin A (eBioscience) during clenbuterol or dobutamine (50μM, Sigma) stimulation prior to intracellular staining.
In vitro and in vivo ILC2 activation
For in vitro experiments, purified GAT ILC2 were cultured in complete RPMI at 37°C. After 2 hours of rest in RPMI without FBS, ILC2 were stimulated for 3 hours with 50ng/ml of GDNF family ligands (R&D Systems). For RNA analysis, ILC2 were lysed using RLT buffer (Qiagen). For cytokine protein analysis ex vivo, stimulated ILC2 were incubated with PMA (50ng/mL), ionomycin (500ng/mL) (Sigma) and brefeldin A (eBioscience) for 4 hours prior to intracellular staining.
Bone marrow and foetal liver chimeras
Bone marrow cells extracted from femurs and tibiae of Rag1-/-.RetMEN2B, RetΔVav1 and RetΔIl5 mice and their respective littermate controls. Foetal livers were obtained from E13.0 Gfra1-/- mice and their respective littermate controls. Bone marrow and foetal liver cells were CD3-depleted using Dynabeads Biotin Binder (Invitrogen) according to the manufacturer’s instructions. 106 cells of each genotype (CD45.2) were injected intravenously alone or in direct competition with a third-party WT competitor (CD45.1/CD45.2), in a 1:1 ratio, into non-lethally irradiated (3Gy) Rag1-/-Il2rg-/- mice (CD45.1). Mice were analysed at 10-12 weeks after transplantation.
High fat diet
Animals were placed on HFD (60Kj% fat (Lard) E15742-3407, Ssniff GMbH) for 16 weeks, unless stated otherwise. Glucose tolerance test was performed at 14 weeks after the start of HFD administration. Glucose (Sigma) in PBS was administered at 2mg/kg in mice fasted for 8 hours and glucose was measured using an ACCU-CHECK Aviva glucometer (Roche).
ILC2 adoptive transfer
ILC2 from RetMEN2B, RetΔ mice and their respective littermate controls were purified from visceral adipose tissue for adoptive transfer. Purified ILC2 were expanded in vitro in supplemented RPMI in the presence of recombinant mouse IL-2, IL-7 (10ng/mL; Peprotech) and IL-33 (10ng/mL; R&D Systems) for 8 days. 2x10⁵ ILC2 were injected intraperitonially into Rag1-/-Il2rg-/- recipients. Mice were placed on HFD two weeks after adoptive transfer.
Explant cultures
GAT was obtained from Rag1-/-Il2rg-/-, cut into 2mm pieces and incubated for 4 hours in complete RPMI at 37°C. Approximately 104 isolated GAT ILC2 from RetWT or RetΔ mice were then co-cultured with GAT explants and 50ng/mL GDNF family ligands for 16 hours. Explants were collected to Trizol (Invitrogen) and disrupted by sonication for RNA analysis.
Virus administration
Viral tracing experiments were performed using a Hamilton(R) syringe (Hamilton) by injecting 10μl of pseudorabies virus (PRV)-614 (PRV-Bartha containing the CMV-mRFP reporter gene cassette inserted into the gG locus of the viral genome) or retroAAV-CAG-GFP (produced in house) into the gonadal fat pads. Aorticorenal ganglion injections of 1 μl (PRV)-614-RFP were performed using a Nanoject III Programmable Nanoliter Injector (Drummond Scentific). Brains were collected 6 days post-PRV injection, after perfusion with PBS and 4% PFA for fixation and further processing. For AAV tracing, GAT and aorticorenal ganglion were collected 3 weeks post-injection and fixed in 4% PFA for further processing. For neuronal function manipulation, retroAAV-PGK-hM3DqDREADD (AAV(3D)) or retroAAV-PGK-hM4DiDREADD (AAV(4D)) (cloned into pAAV-hSyn-hM3(Gq)-mCherry (Addgene #50474) and pAAV-hSyn-hM4(Gi)-mCherry (Addgene #50475), replacing the hSyn promoter, followed by in-house production of AAV particles58,59) were injected in one gonadal fat pad while the contralateral fat pad was injected with PBS and used as a contralateral control. For the double injection procedure, retroAAV-Ef1α-mCherry-IRES-Cre (Addgene viral prep # 55632-AAVrg) was injected into the ARG and after 3 weeks, AAV-hSyn-DIO-HA-hM3D(Gq)-IRES-mCitrine (Addgene viral prep # 50454-AAV8) was injected in both gonadal fat pads. 4mg/kg CNO (Sigma) were administered daily for 3 days, 2mg/kg in the drinking water with 4% sucrose, and 2mg/kg intraperitonially in PBS, and animals were analysed at day 4. For activation of local neurons CNO was administered 4 weeks post-injection; for inactivation of local neurons CNO was administered 6 weeks post-injection.
PVH electroablation
Bilateral ablation of the PVH was performed in 9-12-week-old C57BL/6J mice by electrolytic lesion using stereotaxic brain surgery, as described previously48. Mice were kept under deep anaesthesia using a mixture of isoflurane and oxygen (1-3% isoflurane at 1l/min). Surgeries were performed using a stereotaxic device (Kopf). After identification of the bregma, a hole was drilled through which the lesion electrode was inserted into the brain. Electrodes were made by isolating a 0.25mm stainless steel insect pin with a heat shrink polyester tubing, except for 0.5mm at the tip. The electrode tip was aimed at the paraventricular hypothalamic nucleus, -0.35mm anterior to bregma, 0.25mm lateral to the midline, and 5.8mm ventral to the skull top (Paxinos Mouse Brain Atlas, Franklin 2001). Bilateral lesions were made by passing 0.75mA current through the electrode for the duration of 3 seconds, in the left and right side separately. Sham-lesioned mice underwent the same procedure, but no current was passed through the electrode. After surgery animals were housed individually with food and water ad libitum and were allowed to recover for 1 week. Successful lesioned mice were selected based on histopathology analysis. Mice were analysed after 10-12 weeks.
Immunofluorescence and microscopy
Brains from animals injected with PRV-614-RFP were cut into 50μm slices using a microtome, and mounted in Mowiol (Sigma). Brain images and H&E staining adipose tissue images were obtained in a Zeiss AxioScan Z1 slide scanner (20x Plan Apochromat dry 0.80 0.55 objective). Gonadal adipose tissue was obtained from R26/RFPΔGfap, R26/RFPΔPdgfra and C57BL/6J mice. For ultramicroscopy imaging, whole gonadal fat pads were collected and for confocal imaging pieces of approximately 1x1mm were obtained from tissue fixed with 4% PFA at 4°C overnight. Samples were blocked and permeabilized with PBS containing 0.6% Triton X-100 (Sigma) and 2% BSA (Sigma) and incubated for 1-2 days at room temperature with the following antibodies: anti-TH (P40101; Pel-Freez; 1:500); anti-GDNF (B-8; Santa-Cruz; 1:100) and CD31 (390, FITC, Invitrogen; 1:100). Alexa Fluor 568 goat anti-rabbit (1:500) and Alexa Fluor 488 goat anti-rabbit (1:500) (Invitrogen) were used as secondary antibodies overnight at room temperature. Clearing of the gonadal tissue was done after staining starting with dehydration in a sequence of ethanol solutions of increasing concentrations for 24h each (20%, 40%, 60%, 80% and 100%) followed by immersion in Ethyl cinnamate60. For cleared whole tissue imaging, samples were mounted in Ethyl cinnamate and acquired in a LightSheet Zeiss Z.1 (Plan Apochromat 20x/1.0, 2.4 objective). For confocal imaging, samples were mounted in Mowiol and acquired on a Zeiss LSM710 confocal microscope using Pl-Apochromat 25x/0.8 M27 immersion objective and Pl-Apochromat 63x/1.4 oil immersion objectives. For viral tracing infection confirmation, a Leica M205 stereomicroscope coupled to a Leica DFC7000 T camera (Leica Microsystems, Wetzlar, Germany) was used. Images were processed using ImageJ 1.53 (NIH), Zen Blue 3.0 (Zeiss) and Imaris 9.6 (Oxford Instruments).
Statistics
Results are shown as mean ± s.e.m. Statistical analysis was performed with GraphPad Prism software (GraphPad Software, La Jolla, Calif). Student t-test was performed on homoscedastic populations. Welch’s corrected t-test was applied on samples with different variances, unless stated otherwise. Paired t-test was applied to contralateral control samples. Mann Whitney test was used when data were not normally distributed. Repeated-measures ANOVA were performed on body weights, and glucose tolerance test measurements with Sidak correction for multiple comparisons. Results were considered statistically significant at P<0.05.
Extended Data
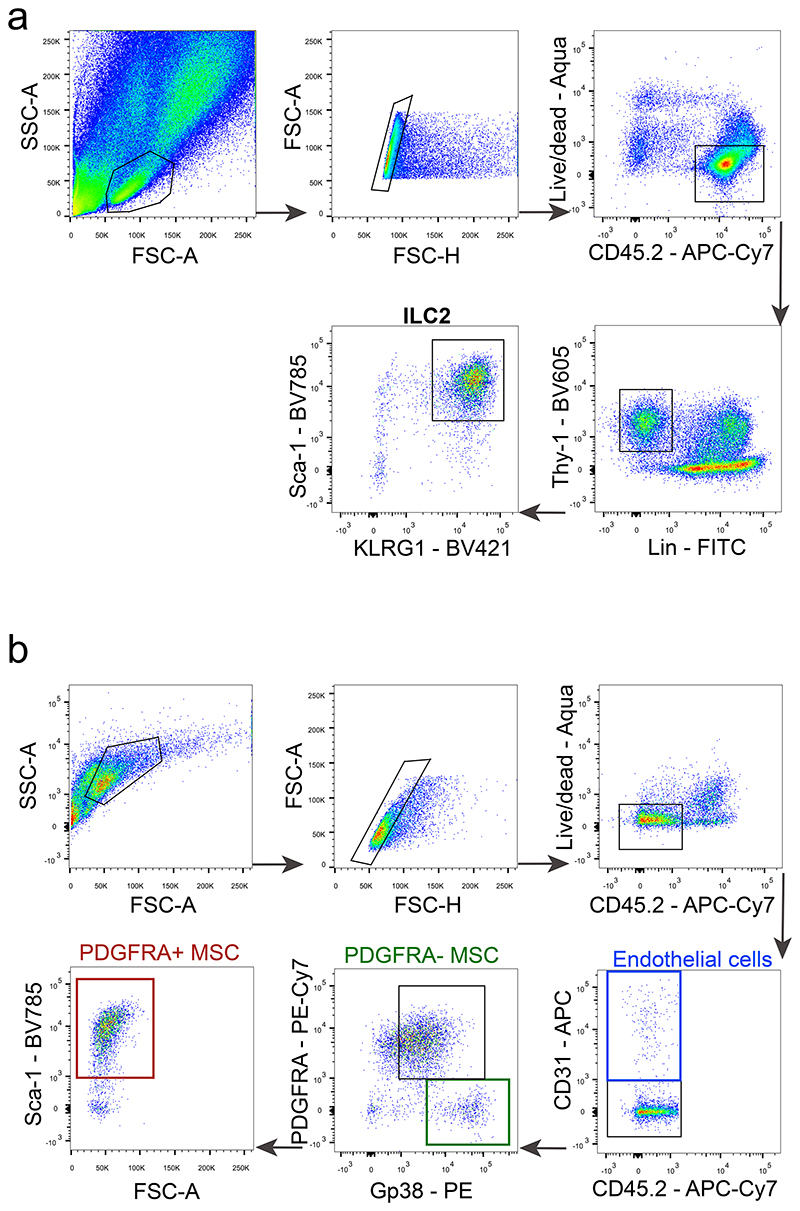
Extended Data Figure 1. Gating strategy for ILC2 and MSC.
a, ILC2s were defined as: live CD45+Lin-Thy1.2+Sca-1+KLRG1+, lineage was composed by CD3ε, CD8α, TCRβ, TCRyδ, CD19, Gr1, CD11c, CD11b and TER119. b, Stroma cells were defined as: live PDGFRA+ MSCs: CD45-CD31-PDGFRA+gp38+SCa-1+, PDGFRA- MSCs: CD45- CD31-PDGFRA-gp38+, and endothelial cells: CD45-CD31+.
Extended Data Figure 2. Sympathetic nervous system in the GAT and ILC2 function.
a, GAT. Red: sympathetic nerve fibres (TH). Green: endothelial cells (CD31). Scale bar: 300μm. b, GAT ILC2-derived Met-Enk after 6-OHDA administration. n=5. c, CD4 T cells and TH positive CD4 T cells after 6-OHDA administration. n=4. d,e, Distance covered by mice in the open field test n=3. Scale bar=10cm. f, GAT ILC2-derived Met-Enk after Clenbuterol administration. n=5. g, Heatmap of Adrb1, Adrb2, and Adrb3, read counts (FPKM) on ILC2s, n=4. h, GAT ILC2 after CNO administration. R26/3Dfl n=4, R26Th n=4, and R26/3DTh n=5. i, Heatmap of Adrb1, Adrb2, and Adrb3, read counts (TPM) on MSCs, n=4. j, Gdnf expression after in vitro stimulation of MSCs, n=3. Data are representative of 3 independent experiments. n represents biologically independent animals. Data are presented as mean values and error bars: SEM. Two-tailed unpaired Welch's t-test. *P<0.05; ***P<0.005.
Extended Data Figure 3. Sympathetic regulation of GAT MSC.
a, heatmap of upregulated genes in MSC upon 6-OHDA administration. Vehicle n=4, 6-OHDA n=5. b, GAT Il33 expression after 6-OHDA treatment. n=5. c, GAT Il33 expression after Clenbuterol administration. n=5. d, MSC-derived Il33 after 6-OHDA and Clenbuterol administration. n=6. e, MSC-derived Il25 after 6-OHDA and Clenbuterol administration. n=6. f, GDNF on MSCs. Adrb2fl n=6, Adrb2ΔPdgfra n=4. Data are representative of 3 independent experiments. n represents biologically independent animals. Data are presented as mean values and error bars: SEM. Two-tailed unpaired Welch's t-test. ns not significant.
Extended Data Figure 4. RET signals do not impact ILC2 differentiation and activation genes.
Heatmap Log(CPM) of ILC2-related genes in ILC2s from a, Retfl n=4 and RetΔVav1 n=5; and b, Rag1-/-.RetWT n=3, Rag1-/-.RetMEN2B n=3.
Extended Data Figure 5. ILC2-autonomous RET signals control type 2 innate cytokines in the GAT.
GAT ILC2 function (a-c). a, Gfra1-/- foetal liver chimaeras. n=5; b, Gfra2+/+, n=10; Gfra2-/- n=5. c, Gfra+/+ n=8; Gfra3-/-. n=8. d, RetΔIl5 mixed BM chimaeras scheme. e, GAT ILC2 from RetΔIl5 mixed BM chimaeras. Retfl n=6; RetΔIl5 n=7. f, ILC2 from Rag1-/-.RetWT n=6, Rag1-/-.RetΔIl5 n=6. g, ILC2 from RetWT n=10, RetΔIl5 n=8. h, RetΔI15 mixed BM chimaeras scheme. i, GAT ILC2 from RetΔI15 mixed BM chimaeras. RetWTn=4; RetΔI15 n=4. j, GAT ILC2 in Rag1-/-.RetMEN2B BM chimaeras. Rag1-/-.RetWT n=5, Rag1-/-.RetMEN2B n=6. k, RetMEN2B mixed BM chimaeras scheme. l, Mixed BM chimaeras. Rag1-/-.RetWT n=6, Rag1-/-.RetMEN2B n=7. Data are representative of 3 independent experiments. n represents biologically independent animals. Data are presented as mean values and error bars: SEM. Two-tailed unpaired Welch's t-test. *P<0.05; **P<0.01; ***P<0.005; ns not significant.
Extended Data Figure 6. ILC2-intrinsic RET signalling is sufficient to control adipocyte physiology and obesity.
a, GAT ILC2 after 6-OHDA administration. RetWT n=8 and RetΔIl5 n=7. b, Weight gain during 16 weeks of HFD regimen. Rag1-/-.RetWT n=4, Rag1-/-.RetΔIl5 n=5. c, Intestinal lamina propria ILC3s. Rag1-/-.RetWT n=5; Rag1-/-.RetΔIl5 n=5. d, Weight gain during 16 weeks of HFD regimen. RetWT n=5, RetΔIl5 n=5. e, Frequency of ILC2 and ILC3 in Thy+ Lin- lymphocytes from ILC2-chimaeric mice after HFD. Each bar represents one individual mouse. n=4. f, Total GAT RNA expression of Ucp1, Cox8b and Cidea. n=5. Data are presented as mean values and error bars: SEM. Two-tailed: unpaired Welch's t-test (a, c, e); repeated measures ANOVA corrected for multiple comparisons with the Benjamini, Krieger and Yekutieli procedure (b,d); and Mann Whitney test (f). *P<0.05; **P<0.01; ns not significant.
Extended Data Figure 7. RET signals control adipose tissue energy expenditure.
Total GAT RNA expression of adipose tissue related genes. a, Retfl n=4; RetΔVav1 n=6. b, Rag1-/-.RetWT n=4; Rag1-/-.RetMEN2B n=5. c, GAT co-cultures scheme. d, GAT co-cultures with ILC2 and GDNF. Data are presented as mean values and error bars: SEM. Two-sided Mann Whitney test. *P<0.05; ns not significant.
Extended Data Figure 8. An aorticorenal-adipose circuit connects to the brain.
a, DRG T13. Green: Viral tracing (VT). Red: TH. Scale bar: 100μm. b, Left: Brain atlas scheme of coronal section. Right: Polysynaptic tracing from the GAT corresponding to the highlighted area on the left. c, Left: Brain atlas scheme of coronal section. Right: Polysynaptic tracing from the Aorticorenal ganglion (ARG) corresponding to the highlighted area on the left. (b,c) Central amigdala (CA), Zona Incerta (ZI), Periaquedutal Gray (PAG) and Subcoeruleus Nucleus (SubCD). Scale bar 200μm. d, Electrolytic lesion of the PVH. Scale bar 500μm. e, GAT ILC2 in PVH ablated mice. Sham n=5; PVH ablated n=6. f, GAT Il33 expression in AAV (4D) compared to contralateral control after CNO administration. n=5. g, GAT Il33 expression in AAV (3D) compared to contralateral control after CNO administration. n=4. h, Scheme of combinatorial viral approach. The aorticorenal ganglion was injected with an adeno-associated virus carrying a Cre construct (AAV-Cre). Next, the GAT was injected with a Cre-inducible AAV(3Dfl). AAV(Cre) n=7 and AAV(Cre)+AAV(3Dfl) n=6. Data are representative of 3 independent experiments. n represents biologically independent animals. Data are presented as mean values and error bars: SEM. Two-tailed unpaired t-test (e). Two-tailed Mann Whitney test (f, g). Two-tailed: unpaired Welch's t-test (h). *P<0.05; **P<0.01; ns not significant.
Extended Data Figure 9. A sympathetic aorticorenal-adipose circuit connects to the brain and regulates ILC2.
GAT neuro-mesenchyme units translate sympathetic cues into neurotrophic factor expression. In turn, neurotrophic factors control adipose ILC2 function via the neuroregulatory receptor RET, shaping the host metabolism, energy expenditure and obesity. PVH-Paraventricular nucleus of the hypothalamus; SNS- Sympathetic nervous system; ARG- Aorticorenal ganglion.
Acknowledgements
We thank the Vivarium, Flow Cytometry, Histopathology, Molecular Biology and Hardware platforms at the Champalimaud Centre for the Unknown. We thank Congento LISBOA-01-0145-FEDER-022170, co-financed by FCT (Portugal) and Lisboa2020, under the PORTUGAL2020 agreement (European Regional Development Fund). pAAV-Ef1a-mCherry-IRES-Cre was a gift from Karl Deisseroth. PRV-614 (PRV-Bartha) was a kind gift of Prof. Lynn Enquist and Dr. Esteban Engel. F.C., C.G.-S., and R.G.D. were supported by Fundação para a Ciência e Tecnologia (FCT), Portugal. R.G.J.W. is supported by a Marie Skłodowska-Curie Individual fellowship (European Commission, 799810-TOPNIN), a Cancer Research Institute/Irvington Postdoctoral Fellowship and a Postdoctoral Junior Leader fellowship la Caixa Foundation, ID100010434; LCF/BQ/PR20/11770004. H.V.-F. by ERC (647274), EU, The Paul G. Allen Frontiers Group, US, and FCT, Portugal.
Footnotes
Author contribution.
F.C. designed, performed and analysed the experiments shown in Figs. 1–4 and Extended Data Figs.1–9. R.G.J.W. performed the clearing and imaging in Fig. 1a, viral tracing and manipulation experiments in Fig.4 and Extended Data Fig.8. C.G.-S. and R.G.D. performed the electroablation surgeries in Extended Data Fig.8. H.R. provided assistance for the experiments shown in Figs.1–4. A.I.D. and I. M. provided technical help for the experiment shown in Fig.1c. J. A. S. provided help for the experiment in Extended Data Fig. 2 d,e. H.V.-F. supervised the work, planned the experiments and wrote the manuscript.
Author information.
Reprints and permissions information is available at http://www.nature.com/ reprints. The authors declare no competing financial interests.
Data availability
Source data for quantifications shown in all graphs plotted in figures and extended data figures are available in the online version of the paper. The data sets generated in this study are also available from the corresponding author upon reasonable request. RNA–seq datasets analysed are publicly available in Gene Expression Omnibus repository with the accession number GSE179546 and GSE179551, for MSC and ILC2, respectively.
References
- 1.Godinho-Silva C, Cardoso F, Veiga-Fernandes H. Neuro-Immune Cell Units: A New Paradigm in Physiology. Annu Rev Immunol. 2019;37:19–46. doi: 10.1146/annurev-immunol-042718-041812. [DOI] [PubMed] [Google Scholar]
- 2.Huh JR, Veiga-Fernandes H. Neuroimmune circuits in inter-organ communication. Nat Rev Immunol. 2020;20:217–228. doi: 10.1038/s41577-019-0247-z. [DOI] [PubMed] [Google Scholar]
- 3.Veiga-Fernandes H, Artis D. Neuronal-immune system cross-talk in homeostasis. Science. 2018;359:1465–1466. doi: 10.1126/science.aap9598. [DOI] [PubMed] [Google Scholar]
- 4.Chu C, Artis D, Chiu IM. Neuro-immune Interactions in the Tissues. Immunity. 2020;52:464–474. doi: 10.1016/j.immuni.2020.02.017. [DOI] [PMC free article] [PubMed] [Google Scholar]
- 5.Bartness TJ, Vaughan CH, Song CK. Sympathetic and sensory innervation of brown adipose tissue. Int J Obes (Lond) 2010;34(Suppl 1):S36-42. doi: 10.1038/ijo.2010.182. [DOI] [PMC free article] [PubMed] [Google Scholar]
- 6.Morrison SF. Central neural control of thermoregulation and brown adipose tissue. Auton Neurosci. 2016;196:14–24. doi: 10.1016/j.autneu.2016.02.010. [DOI] [PMC free article] [PubMed] [Google Scholar]
- 7.Zeng W, et al. Sympathetic neuro-adipose connections mediate leptin-driven lipolysis. Cell. 2015;163:84–94. doi: 10.1016/j.cell.2015.08.055. [DOI] [PMC free article] [PubMed] [Google Scholar]
- 8.Moro K, et al. Innate production of TH2 cytokines by adipose tissue-associated c-Kit+Sca-1+ lymphoid cells. Nature. 2010;463:540–544. doi: 10.1038/nature08636. [DOI] [PubMed] [Google Scholar]
- 9.Brestoff JR, et al. Group 2 innate lymphoid cells promote beiging of white adipose tissue and limit obesity. Nature. 2015;519:242–246. doi: 10.1038/nature14115. [DOI] [PMC free article] [PubMed] [Google Scholar]
- 10.Hams E, et al. The helminth T2 RNase omega1 promotes metabolic homeostasis in an IL-33- and group 2 innate lymphoid cell-dependent mechanism. FASEB J. 2016;30:824–835. doi: 10.1096/fj.15-277822. [DOI] [PMC free article] [PubMed] [Google Scholar]
- 11.Lee MW, et al. Activated type 2 innate lymphoid cells regulate beige fat biogenesis. Cell. 2015;160:74–87. doi: 10.1016/j.cell.2014.12.011. [DOI] [PMC free article] [PubMed] [Google Scholar]
- 12.Molofsky AB, et al. Innate lymphoid type 2 cells sustain visceral adipose tissue eosinophils and alternatively activated macrophages. The Journal of experimental medicine. 2013;210:535–549. doi: 10.1084/jem.20121964. [DOI] [PMC free article] [PubMed] [Google Scholar]
- 13.Vivier E, et al. Innate Lymphoid Cells: 10 Years On. Cell. 2018;174:1054–1066. doi: 10.1016/j.cell.2018.07.017. [DOI] [PubMed] [Google Scholar]
- 14.Arighi E, Borrello MG, Sariola H. RET tyrosine kinase signaling in development and cancer. Cytokine Growth Factor Rev. 2005;16:441–467. doi: 10.1016/j.cytogfr.2005.05.010. [DOI] [PubMed] [Google Scholar]
- 15.Mulligan LM. RET revisited: expanding the oncogenic portfolio. Nat Rev Cancer. 2014;14:173–186. doi: 10.1038/nrc3680. [DOI] [PubMed] [Google Scholar]
- 16.Fonseca-Pereira D, et al. The neurotrophic factor receptor RET drives haematopoietic stem cell survival and function. Nature. 2014;514:98–101. doi: 10.1038/nature13498. [DOI] [PubMed] [Google Scholar]
- 17.Ibiza S, et al. Glial-cell-derived neuroregulators control type 3 innate lymphoid cells and gut defence. Nature. 2016;535:440–443. doi: 10.1038/nature18644. [DOI] [PMC free article] [PubMed] [Google Scholar]
- 18.Patel A, et al. Differential RET signaling pathways drive development of the enteric lymphoid and nervous systems. Sci Signal. 2012;5:ra55. doi: 10.1126/scisignal.2002734. [DOI] [PubMed] [Google Scholar]
- 19.Veiga-Fernandes H, et al. Tyrosine kinase receptor RET is a key regulator of Peyer’s Patch organogenesis. Nature. 2007;446:547–551. doi: 10.1038/nature05597. [DOI] [PubMed] [Google Scholar]
- 20.Kahn BB, Flier JS. Obesity and insulin resistance. The Journal of clinical investigation. 2000;106:473–481. doi: 10.1172/JCI10842. [DOI] [PMC free article] [PubMed] [Google Scholar]
- 21.Qiu Y, et al. Eosinophils and type 2 cytokine signaling in macrophages orchestrate development of functional beige fat. Cell. 2014;157:1292–1308. doi: 10.1016/j.cell.2014.03.066. [DOI] [PMC free article] [PubMed] [Google Scholar]
- 22.Morrison SF, Madden CJ, Tupone D. Central neural regulation of brown adipose tissue thermogenesis and energy expenditure. Cell Metab. 2014;19:741–756. doi: 10.1016/j.cmet.2014.02.007. [DOI] [PMC free article] [PubMed] [Google Scholar]
- 23.Sutton AK, Myers MG, Jr, Olson DP. The Role of PVH Circuits in Leptin Action and Energy Balance. Annu Rev Physiol. 2016;78:207–221. doi: 10.1146/annurev-physiol-021115-105347. [DOI] [PMC free article] [PubMed] [Google Scholar]
- 24.Mahlakoiv T, et al. Stromal cells maintain immune cell homeostasis in adipose tissue via production of interleukin-33. Sci Immunol. 2019;4 doi: 10.1126/sciimmunol.aax0416. [DOI] [PMC free article] [PubMed] [Google Scholar]
- 25.Rana BMJ, et al. A stromal cell niche sustains ILC2-mediated type-2 conditioning in adipose tissue. The Journal of experimental medicine. 2019;216:1999–2009. doi: 10.1084/jem.20190689. [DOI] [PMC free article] [PubMed] [Google Scholar]
- 26.Spallanzani RG, et al. Distinct immunocyte-promoting and adipocytegenerating stromal components coordinate adipose tissue immune and metabolic tenors. Sci Immunol. 2019;4 doi: 10.1126/sciimmunol.aaw3658. [DOI] [PMC free article] [PubMed] [Google Scholar]
- 27.Ding X, et al. IL-33-driven ILC2/eosinophil axis in fat is induced by sympathetic tone and suppressed by obesity. J Endocrinol. 2016;231:35–48. doi: 10.1530/JOE-16-0229. [DOI] [PMC free article] [PubMed] [Google Scholar]
- 28.Moriyama S, et al. beta2-adrenergic receptor-mediated negative regulation of group 2 innate lymphoid cell responses. Science. 2018;359:1056–1061. doi: 10.1126/science.aan4829. [DOI] [PubMed] [Google Scholar]
- 29.Andersen CJ, Murphy KE, Fernandez ML. Impact of Obesity and Metabolic Syndrome on Immunity. Adv Nutr. 2016;7:66–75. doi: 10.3945/an.115.010207. [DOI] [PMC free article] [PubMed] [Google Scholar]
- 30.Guilherme A, Henriques F, Bedard AH, Czech MP. Molecular pathways linking adipose innervation to insulin action in obesity and diabetes mellitus. Nat Rev Endocrinol. 2019;15:207–225. doi: 10.1038/s41574-019-0165-y. [DOI] [PMC free article] [PubMed] [Google Scholar]
- 31.Zhuo L, et al. hGFAP-cre transgenic mice for manipulation of glial and neuronal function in vivo. Genesis. 2001;31:85–94. doi: 10.1002/gene.10008. [DOI] [PubMed] [Google Scholar]
- 32.Roesch K, et al. The transcriptome of retinal Muller glial cells. J Comp Neurol. 2008;509:225–238. doi: 10.1002/cne.21730. [DOI] [PMC free article] [PubMed] [Google Scholar]
- 33.de Boer J, et al. Transgenic mice with hematopoietic and lymphoid specific expression of Cre. Eur J Immunol. 2003;33:314–325. doi: 10.1002/immu.200310005. [DOI] [PubMed] [Google Scholar]
- 34.Schlenner SM, et al. Fate mapping reveals separate origins of T cells and myeloid lineages in the thymus. Immunity. 2010;32:426–436. doi: 10.1016/j.immuni.2010.03.005. [DOI] [PubMed] [Google Scholar]
- 35.Nussbaum JC, et al. Type 2 innate lymphoid cells control eosinophil homeostasis. Nature. 2013;502:245–248. doi: 10.1038/nature12526. [DOI] [PMC free article] [PubMed] [Google Scholar]
- 36.Savitt JM, Jang SS, Mu W, Dawson VL, Dawson TM. Bcl-x is required for proper development of the mouse substantia nigra. The Journal of neuroscience : the official journal of the Society for Neuroscience. 2005;25:6721–6728. doi: 10.1523/JNEUROSCI.0760-05.2005. [DOI] [PMC free article] [PubMed] [Google Scholar]
- 37.Hinoi E, et al. The sympathetic tone mediates leptin’s inhibition of insulin secretion by modulating osteocalcin bioactivity. J Cell Biol. 2008;183:1235–1242. doi: 10.1083/jcb.200809113. [DOI] [PMC free article] [PubMed] [Google Scholar]
- 38.Mombaerts P, et al. RAG-1-deficient mice have no mature B and T lymphocytes. Cell. 1992;68:869–877. doi: 10.1016/0092-8674(92)90030-g. [DOI] [PubMed] [Google Scholar]
- 39.Cao X, et al. Defective lymphoid development in mice lacking expression of the common cytokine receptor gamma chain. Immunity. 1995;2:223–238. doi: 10.1016/1074-7613(95)90047-0. [DOI] [PubMed] [Google Scholar]
- 40.Smith-Hicks CL, Sizer KC, Powers JF, Tischler AS, Costantini F. C-cell hyperplasia, pheochromocytoma and sympathoadrenal malformation in a mouse model of multiple endocrine neoplasia type 2B. Embo J. 2000;19:612–622. doi: 10.1093/emboj/19.4.612. [DOI] [PMC free article] [PubMed] [Google Scholar]
- 41.Madisen L, et al. A robust and high-throughput Cre reporting and characterization system for the whole mouse brain. Nature neuroscience. 2010;13:133–140. doi: 10.1038/nn.2467. [DOI] [PMC free article] [PubMed] [Google Scholar]
- 42.Sciolino NR, et al. Recombinase-Dependent Mouse Lines for Chemogenetic Activation of Genetically Defined Cell Types. Cell Rep. 2016;15:2563–2573. doi: 10.1016/j.celrep.2016.05.034. [DOI] [PMC free article] [PubMed] [Google Scholar]
- 43.Buch T, et al. A Cre-inducible diphtheria toxin receptor mediates cell lineage ablation after toxin administration. Nature methods. 2005;2:419–426. doi: 10.1038/nmeth762. [DOI] [PubMed] [Google Scholar]
- 44.Almeida AR, et al. RET/GFRalpha signals are dispensable for thymic T cell development in vivo. PLoS One. 2012;7:e52949. doi: 10.1371/journal.pone.0052949. [DOI] [PMC free article] [PubMed] [Google Scholar]
- 45.Enomoto H, et al. GFR alpha1-deficient mice have deficits in the enteric nervous system and kidneys. Neuron. 1998;21:317–324. doi: 10.1016/s0896-6273(00)80541-3. [DOI] [PubMed] [Google Scholar]
- 46.Rossi J, et al. Retarded growth and deficits in the enteric and parasympathetic nervous system in mice lacking GFR alpha2, a functional neurturin receptor. Neuron. 1999;22:243–252. doi: 10.1016/s0896-6273(00)81086-7. [DOI] [PubMed] [Google Scholar]
- 47.Nishino J, et al. GFR alpha3, a component of the artemin receptor, is required for migration and survival of the superior cervical ganglion. Neuron. 1999;23:725–736. doi: 10.1016/s0896-6273(01)80031-3. [DOI] [PubMed] [Google Scholar]
- 48.Godinho-Silva C, et al. Light-entrained and brain-tuned circadian circuits regulate ILC3s and gut homeostasis. Nature. 2019;574:254–258. doi: 10.1038/s41586-019-1579-3. [DOI] [PMC free article] [PubMed] [Google Scholar]
- 49.Botta P, et al. An Amygdala Circuit Mediates Experience-Dependent Momentary Arrests during Exploration. Cell. 2020;183:605–619.:e622. doi: 10.1016/j.cell.2020.09.023. [DOI] [PMC free article] [PubMed] [Google Scholar]
- 50.Pereira MM, et al. A brain-sparing diphtheria toxin for chemical genetic ablation of peripheral cell lineages. Nat Commun. 2017;8:14967. doi: 10.1038/ncomms14967. [DOI] [PMC free article] [PubMed] [Google Scholar]
- 51.Zhu H, Roth BL. Silencing synapses with DREADDs. Neuron. 2014;82:723–725. doi: 10.1016/j.neuron.2014.05.002. [DOI] [PMC free article] [PubMed] [Google Scholar]
- 52.Leggett RM, Ramirez-Gonzalez RH, Clavijo BJ, Waite D, Davey RP. Sequencing quality assessment tools to enable data-driven informatics for high throughput genomics. Front Genet. 2013;4:288. doi: 10.3389/fgene.2013.00288. [DOI] [PMC free article] [PubMed] [Google Scholar]
- 53.Bolger AM, Lohse M, Usadel B. Trimmomatic: a flexible trimmer for Illumina sequence data. Bioinformatics. 2014;30:2114–2120. doi: 10.1093/bioinformatics/btu170. [DOI] [PMC free article] [PubMed] [Google Scholar]
- 54.Dobin A, et al. STAR: ultrafast universal RNA-seq aligner. Bioinformatics. 2013;29:15–21. doi: 10.1093/bioinformatics/bts635. [DOI] [PMC free article] [PubMed] [Google Scholar]
- 55.McCarthy DJ, Chen Y, Smyth GK. Differential expression analysis of multifactor RNA-Seq experiments with respect to biological variation. Nucleic Acids Res. 2012;40:4288–4297. doi: 10.1093/nar/gks042. [DOI] [PMC free article] [PubMed] [Google Scholar]
- 56.Love MI, Huber W, Anders S. Moderated estimation of fold change and dispersion for RNA-seq data with DESeq2. Genome Biol. 2014;15:550. doi: 10.1186/s13059-014-0550-8. [DOI] [PMC free article] [PubMed] [Google Scholar]
- 57.Ebihara T, Taniuchi I. Transcription Factors in the Development and Function of Group 2 Innate Lymphoid Cells. Int J Mol Sci. 2019;20 doi: 10.3390/ijms20061377. [DOI] [PMC free article] [PubMed] [Google Scholar]
- 58.Grieger JC, Choi VW, Samulski RJ. Production and characterization of adeno-associated viral vectors. Nature protocols. 2006;1:1412–1428. doi: 10.1038/nprot.2006.207. [DOI] [PubMed] [Google Scholar]
- 59.Huang X, et al. AAV2 production with optimized N/P ratio and PEI-mediated transfection results in low toxicity and high titer for in vitro and in vivo applications. J Virol Methods. 2013;193:270–277. doi: 10.1016/j.jviromet.2013.06.008. [DOI] [PMC free article] [PubMed] [Google Scholar]
- 60.Huang J, et al. A cationic near infrared fluorescent agent and ethyl-cinnamate tissue clearing protocol for vascular staining and imaging. Sci Rep. 2019;9 doi: 10.1038/s41598-018-36741-1. 521. [DOI] [PMC free article] [PubMed] [Google Scholar]
Associated Data
This section collects any data citations, data availability statements, or supplementary materials included in this article.
Data Availability Statement
Source data for quantifications shown in all graphs plotted in figures and extended data figures are available in the online version of the paper. The data sets generated in this study are also available from the corresponding author upon reasonable request. RNA–seq datasets analysed are publicly available in Gene Expression Omnibus repository with the accession number GSE179546 and GSE179551, for MSC and ILC2, respectively.


