Abstract
How the epigenetic landscape is established in development is still being elucidated. Here, we uncover Developmental Pluripotency Associated 2 and 4 (Dppa2/4) as epigenetic priming factors that establish a permissive epigenetic landscape at a subset of developmentally important bivalent promoters characterised by low expression and poised RNA-polymerase. Differentiation assays reveal that Dppa2/4 double knockout mouse embryonic stem cells fail to exit pluripotency and differentiate efficiently. Dppa2/4 bind both H3K4me3-marked and bivalent gene promoters and associate with COMPASS and Polycomb bound chromatin. Comparing knockout and inducible knockdown systems we find that acute depletion of Dppa2/4 results in rapid loss of H3K4me3 from important bivalent genes whilst H3K27me3 is initially more stable but lost following extended culture. Consequently, upon Dppa2/4 depletion these promoters gain DNA methylation and are unable to be activated upon differentiation. Our findings uncover a novel epigenetic priming mechanism at developmental promoters, poising them for future lineage-specific activation.
Introduction
Epigenetic priming describes the establishment of a competent epigenetic landscape that facilitates efficient transcriptional responses at a future point in time. This temporal uncoupling of molecular events is especially fitting in the context of early development where genes that are not yet expressed need to avoid permanent silencing prevalent in the peri-implantation embryo. Perhaps the best understood example of epigenetic priming is bivalent chromatin. This co-occurrence of active associated trimenthylation of lysine 4 on histone H3 (H3K4me3) and repressive associated trimethylation of lysine 27 on histone H3 (H3K27me3) histone modifications is catalysed by Mll2, part of the COMPASS complex 1,2 and Ezh2, part of the Polycomb Repressive 2 (PRC2) complex, respectively (reviewed in 3). In pluripotent cells, bivalent chromatin is found at important developmental gene promoters, poising them for future activation or silencing 4,5. However, it is largely unclear how these epigenetically primed states are established specifically at these promoters 6. Furthermore, it is unknown what effect removal of both H3K4me3 and H3K27me3 at bivalent genes has on development as designing a clean experimental system targeting both without altering the rest of the epigenome is challenging. Consequently, our understanding of the precise regulation and functional importance of bivalent chromatin is lacking 6.
Recently, we and others revealed a role for the small heterodimerising nuclear proteins Developmental Pluripotency Associated 2 and 4 (hereafter Dppa2, Dppa4 or, when referring to both, Dppa2/4), in regulating zygotic genome activation (ZGA)-associated transcripts 7–9. In addition, Dppa2/4 also bind non-ZGA gene promoters, including bivalent promoters 7,10–12, however the significance of this is unknown. Intriguingly, single and double zygotic knockout mice survive early embryogenesis only to succumb to lung and skeletal defects shortly after birth, despite these proteins not being expressed in these, or any other adult somatic tissue, uncoupling their presence from their developmental phenotype 13,14. Here we provide comprehensive molecular and functional evidence supporting Dppa2/4 as novel epigenetic priming factors. Dppa2/4 are required to maintain both H3K4me3 and H3K27me3 at a set of developmentally important bivalent promoters characterised in pluripotent cells by low H3K4me3 levels and initiating but not elongating RNA polymerase II. As a consequence of losing bivalency, these genes gain DNA methylation and can no longer be effectively activated during differentiation. These epigenetic changes are reversible upon reintroduction of Dppa2/4 suggesting that Dppa2/4 are required to actively target and maintain the epigenetic landscape at these developmental genes in pluripotent cells. Our results provide a plausible molecular explanation of the perplexing phenotype of Dppa2/4 knockout mice, endorsing Dppa2/4 as key developmental epigenetic priming factors.
Results
Dppa2/4 bind bivalent and active chromatin and facilitate multi-lineage commitment
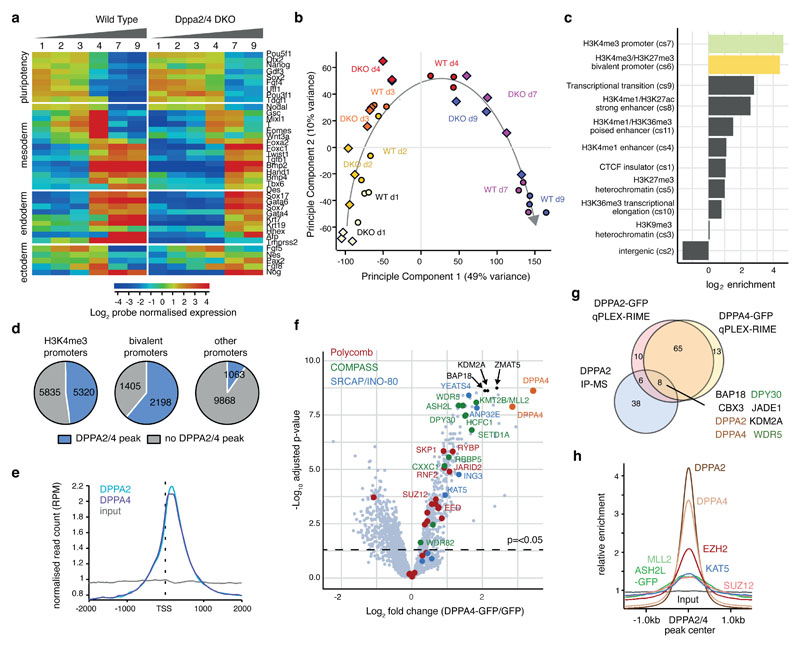
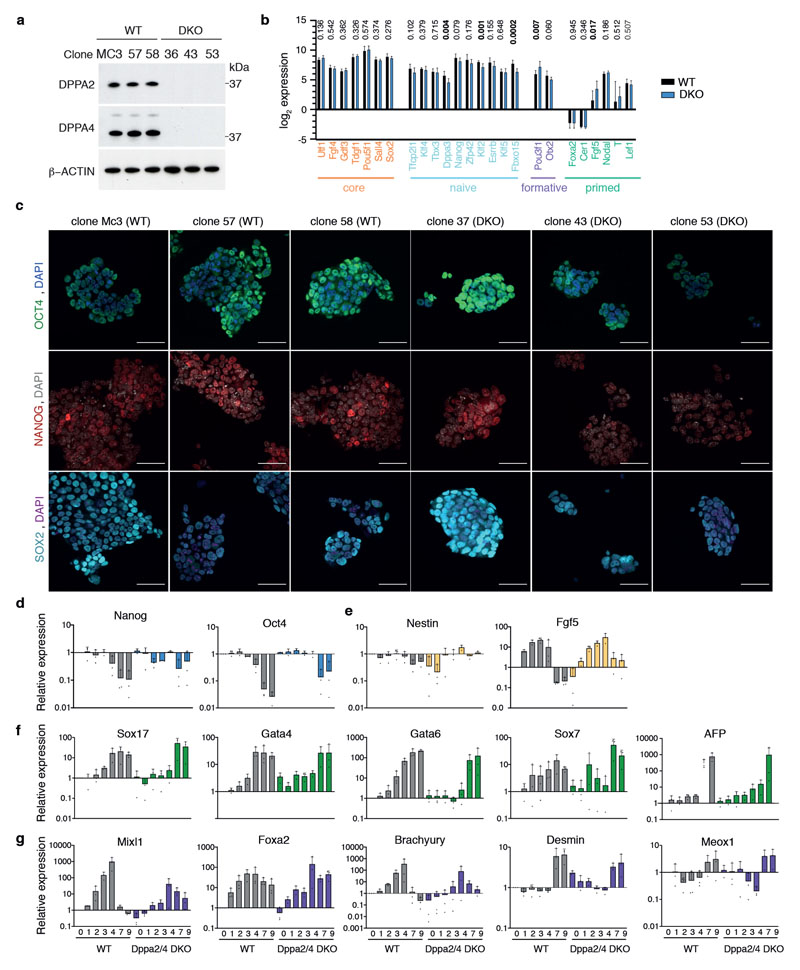
Dppa2/4 are frequently used as markers of pluripotent cells, yet their absence has little effect on expression of pluripotency markers in knockout cells including double knockout (DKO) mouse embryonic stem cells (mESCs) 7,13,14 (Extended Data Fig.1A-C). To test their role in differentiation, we performed embryoid body assays for both WT and DKO ESCs over 9 days from serum/LIF cultures. Importantly, Dppa2/4 DKO cells were delayed in downregulating pluripotency markers and upregulating markers of all three germ layers (Fig. 1A, Extended Data Fig.1D-G, Supplementary Table 1). Supporting this, principal component analysis revealed that the transcriptome of DKO cells at day 7 and 9 of differentiation more closely resembled WT cells at day 4 of differentiation, confirming an overall defect in exiting pluripotency and multi-lineage commitment in these cells (Fig. 1B).
Figure 1. Dppa2/4 are required for differentiation and bind developmental bivalent promoters.
(A) Per gene normalised heatmap showing expression of pluripotency, endoderm, mesoderm and ectoderm genes across 9 days of embryoid body differentiation in WT and Dppa2/4 DKO cells as measured by RNA-sequencing. The plot shows pooled data from three differentiation timecourses ran on different days using 1 WT and 1 DKO clone. (B) Principle component analysis of embryoid body time course RNAseq gene expression depicting WT (circles) and Dppa2/4 DKO (diamonds). Developmental trajectory is shown by the arrow. (C) Log2 enrichment of Dppa2/4 peaks amongst 12 chromatin states (cs1-12) defined using ChromHMM models (see Materials and Methods). Chromatin state 12, which represents low signal/repetitive elements contained no peaks and is not shown. (D) Proportion of H3K4me3 bound (left), bivalent (middle) and other (right) promoters containing a Dppa2/4 peak (blue). (E) Relative average read density for DPPA2 (blue) and DPPA4 (purple) ChIP-seq data across a 3kb region centred around the transcription start site (TSS). Input (grey) is shown as a control. Data reanalysed from 10 [GSE117173]. (F) qPLEX-RIME results showing log2fold change between Dppa4-GFP and GFP control versus -log10(adjusted p-value). Dotted line represents cut off of p<0.05 or -log10 adjusted p-value of 1.30 as determined by qPLEXanalyzer 18. DPPA2 and DPPA4 are shown in orange. Top 3 interactors are shown in black. Members of Polycomb (red), COMPASS (green) and SRCAP/INO-80 (blue) complexes are highlighted. n = 2 WT, Dppa2 and Dppa4-GFP clones each in triplicate where replicates were harvested on different days separated by at least once cell passage. The Scatter plot is of pooled data from the two clones and three replicates. (G) Overlap between DPPA2 and DPPA4 qPLEX RIME results with co-immunoprecipitation mass spectrometry results for endogenous DPPA2 from 10 [GSE117173]. (H) Probe trend plot showing relative enrichment across DPPA2/4 peaks. Input, DPPA2 and DPPA4 ChIP data reanalysed from 10 [GSE117173], ASH2L-GFP data from 1 [GSE52071], MLL2 data from 31 [GSE48172], EZH2 and SUZ12 data from 32 [GSE48435] and KAT5/TIP60 data from 33 [GSE69671].
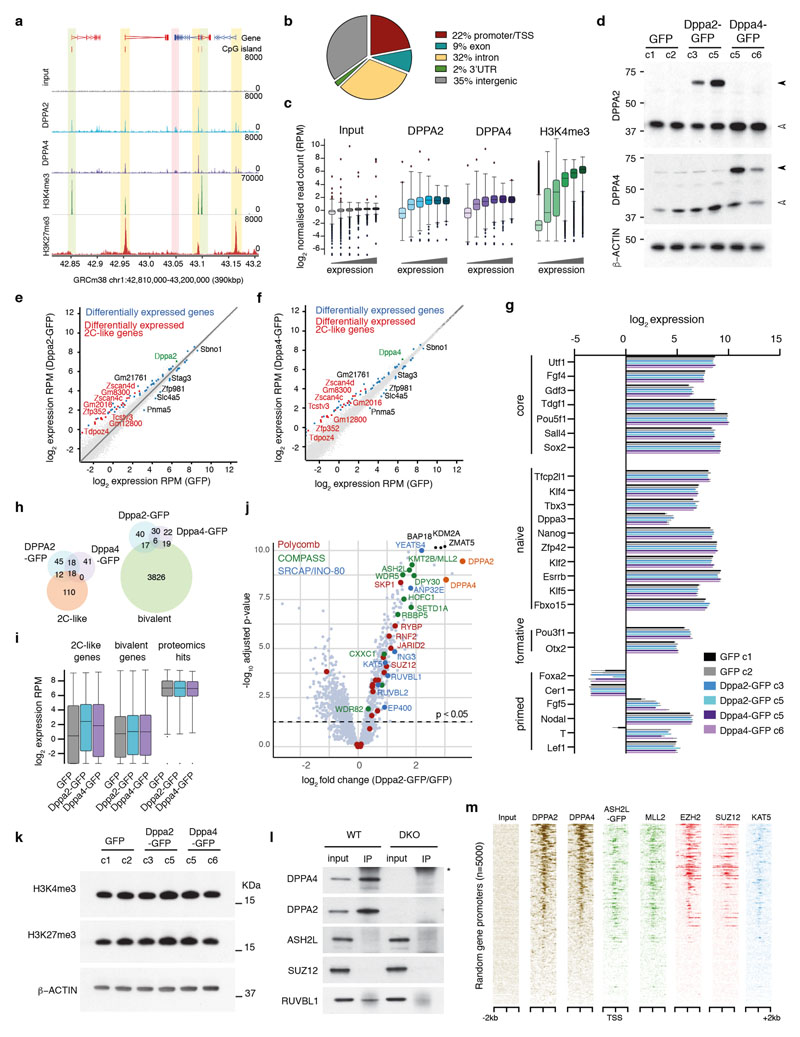
To understand molecularly how Dppa2/4 may be affecting cell differentiation, we analysed their genome-wide binding profiles and chromatin-based interactome in pluripotent cells. By reanalysing published ChIP-seq data for endogenous Dppa2 and Dppa4 10, we assigned Dppa2/4 peaks to one of 12 chromatin states previously defined by ChromHMM (see Materials and Methods), revealing a dramatic enrichment at both H3K4me3 and H3K4me3/H3K27me3 bivalent promoters (Fig. 1C), consistent with previous reports 7,8,10–12 (Extended Data Fig.2A). Indeed, nearly half of H3K4me3 promoters and over 60% of bivalent promoters defined previously by sequential ChIP-seq experiments 15 contained a Dppa2/4 peak, in contrast to just 9.7% of all other protein-coding promoters (Fig. 1D). Stringent peak calling revealed that 22% of Dppa2/4 peaks occur within 1kb of transcription start sites (TSS) (Extended Data Fig.2B) of both highly and lowly expressed genes (Extended Data Fig.2C), with a clear enrichment of both Dppa2 and Dppa4 at the +1 nucleosome position (Fig. 1E).
Dppa2/4 proteins contain both a SAP DNA binding and C-terminal histone binding domain but have no known enzymatic function 16,17, thus we reasoned they may act in cooperation with other epigenetic regulators. To quantitatively identify Dppa2/4 protein interctors in a chromatin context, we performed qPLEX-RIME 18, which has the advantage of a cross-linking step and thus will also detect proteins enriched at chromatin bound by, but not necessarily directly interacting with, Dppa2/4. We generated stable cell lines expressing Dppa2-GFP or Dppa4-GFP at similar levels to the endogenous proteins (Extended Data Fig.2D) which importantly, showed minimal changes in gene expression including at pluripotency genes, with most of the transcriptional changes occurring at zygotic genome activation (ZGA) associated transcripts, (Extended Data Fig.2E-I, Supplementary Table 2). qPLEX-RIME experiments identified 94 and 90 proteins enriched with Dppa2 and Dppa4 bound chromatin respectively when compared against GFP control (adjusted p-value <0.05, log2fold change >1) (Fig. 1F, Extended Data Fig. 2J, Supplementary Table 3), of which 78 were in common to both and 14 overlapped with a recent Dppa2 IP-mass spec study 10 (Fig. 1G). Dppa2 interacted with Dppa4 and vice versa, consistent with the proteins functioning as a heterodimer 14. Excitingly, Dppa2/4 associated proteins were enriched for members of both the COMPASS and Polycomb complexes responsible for H3K4me3 and H3K27me3 deposition respectively (Fig. 1F-G, S2J). We also detected members in common to the SRCAP and INO80 remodelling complexes, the former of which incorporates the histone variant H2A.Z into nucleosomes. Also of interest were interactions with proteins implicated in zygotic genome activation including Zscan4 and SUMO family proteins (Supplementary Table 2), consistent with ours and others recent findings that Dppa2/4 also regulate ZGA transcriptional networks 7,8,19.
Importantly, mRNA levels of these and other proteomics hits were not significantly different between WT and DKO cell lines (Extended Data Fig.2I), nor were global levels of the catalytic products of the COMPASS and Polycomb complexes altered in the cell lines used (Extended Data Fig.2K). We were able to confirm a direct interaction between Dppa4 and Ruvbl1 of the SRCAP/INO80 chromatin remodelling complex (Extended Data Fig.2L), consistent with mass spec studies revealing interactions between Dppa2 and Ruvb1, Ruvb2 and Dmap1 10, and Dppa2/4 with H2A.Z 20. While we did not reveal a direct strong interaction between Dppa4 and Ash2l or Suz12 in the absence of chromatin (Extended Data Fig.2L), others have recently shown a direct interaction between Dppa2 and Suz12 10, Wdr5 and Dpy30 10. This suggests that interactions between Dppa2/4 and the Polycomb and Trithorax machinery may be transient, substoichiometric or facilitated by a chromatin template. To validate our chromatin-based proteomic analysis, we analysed published ChIP-seq datasets from mouse ESCs, verifying these complexes bind the same promoters as Dppa2/4 and are enriched at Dppa2/4 peaks (Fig. 1H, Extended Data Fig. 2M). Together our genome-wide DNA binding and chromatin-based interactome analyses support a role for Dppa2/4 at active and bivalent gene promoters, potentially facilitating the recruitment and/or stabilisation of COMPASS, Polycomb and SRCAP/INO-80 chromatin complexes at these loci in pluripotent cells.
Loss of both H3K4me3 and H3K27me3 at a subset of bivalent genes in the absence of Dppa2/4
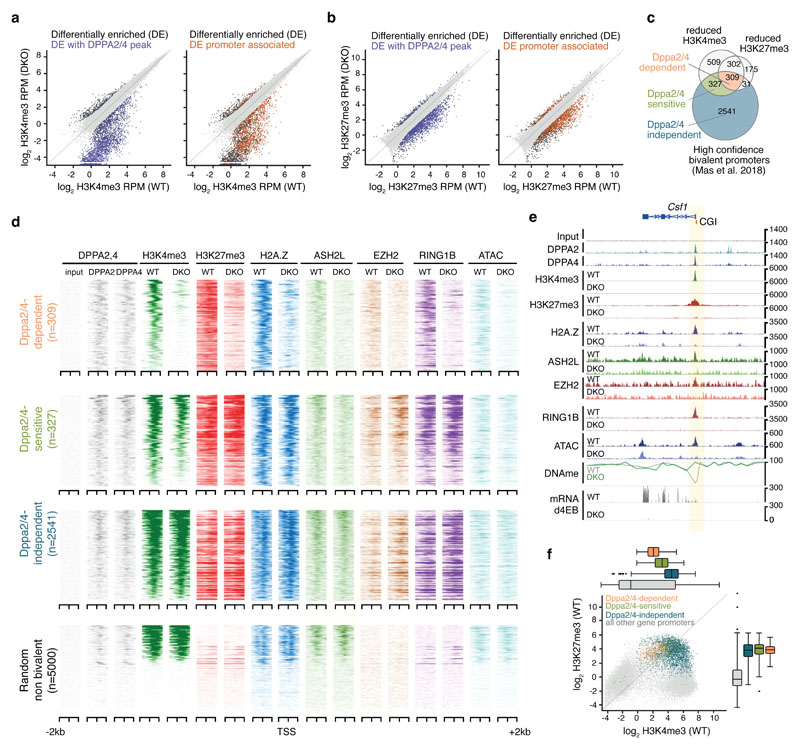
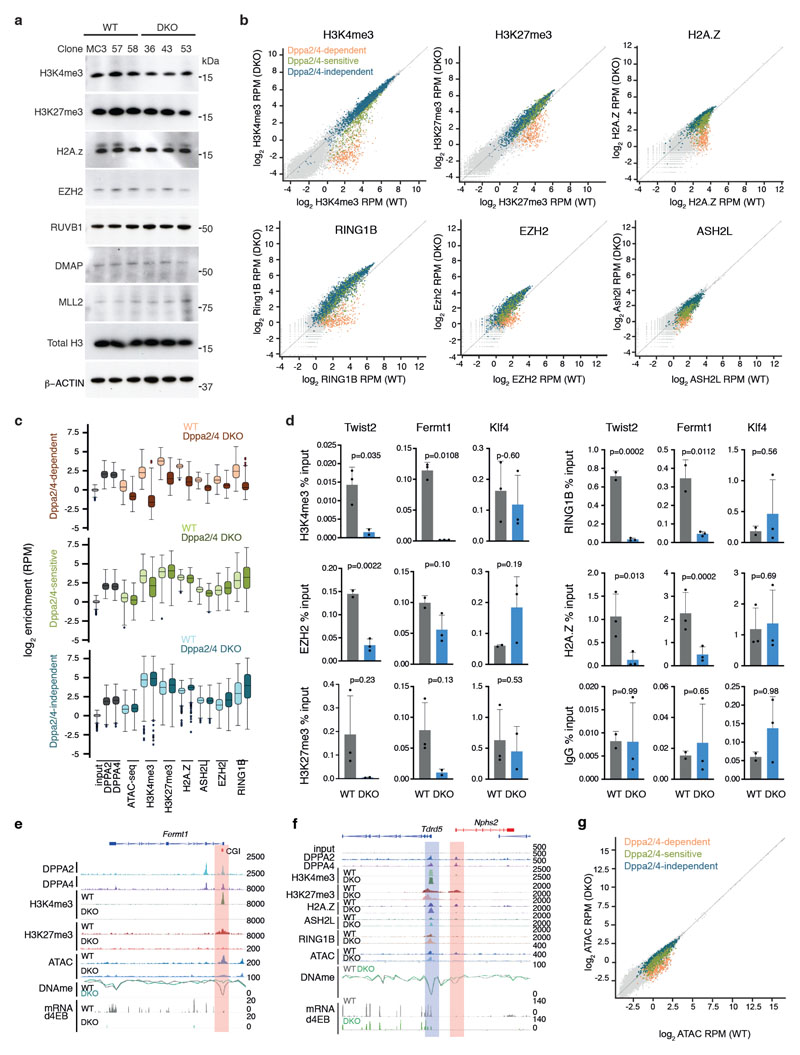
Given their localisation at H3K4me3 marked and bivalent gene promoters and chromatin-based association with COMPASS and Polycomb complex members, we next determined the effect of removing Dppa2/4 on the epigenetic landscape. We first performed ChIP-seq for H3K4me3 and H3K27me3 in WT and Dppa2/4 DKO ESCs. Globally, levels of H3K4me3 and H3K27me3 were largely unchanged (Extended Data Fig.3A). Interestingly, 3,179 of 20,897 (15.2%) H3K4me3 and 2,162 of 31,041 (7.0%) H3K27me3 peaks were reduced in Dppa2/4 DKO cells which were predominantly bound by Dppa2/4 and mostly overlapped with gene promoters (Fig. 2A-B). In total, 1,447 and 817 promoters in Dppa2/4 DKO cells had a significant lower enrichment of H3K4me3 and H3K27me3, respectively (Fig. 2C, Supplementary Table 4). Of these, 611 overlapped, suggesting that bivalent domains may be affected. We therefore focused our analyses on a set of high confidence bivalent promoters defined by ChIP-reChIP experiments in ESCs 15. From this, we identified a subset of 309 (9.6%) out of 3,208 bivalent promoters that had lost both H3K4me3 and H3K27me3, and another 327 (10.2%) that had lost only H3K4me3 (Fig. 2C).
Figure 2. Dppa2/4 are required to maintain bivalent chromatin at a subset of developmental genes.
(A) Scatter plots showing H3K4me3 enrichment as log2 RPM at H3K4me3 peaks in WT and Dppa2/4 DKO cells. Differentially enriched peaks (DESeq2 adjusted p-value <0.05 with >2-fold change are shown in dark grey with those overlapping Dppa2/4 peaks (purple) or promoters (orange) highlighted. Scatter plots show pooled data from three independent cellular clones. (B) similar to A but showing H3K27me3 peaks. (C) Overlap between promoters (TSS +/-1kb) with reduced H3K4me3 or H3K27me3 enrichment in Dppa2/4 DKO cells (this study) with bivalent gene promoters as defined by 15. (D) Aligned probe plots of wild type (WT) and Dppa2/4 double knockout (DKO) ESCs showing DPPA2 and DPPA4 (grey), H3K4me3 (dark green), H3K27me3 (dark red), H2A.Z (blue), ASH2L (light green), EZH2 (orange) and RING1b (purple) at transcriptional start site (TSS) +/- 2kb of Dppa2/4-dependent (top) and Dppa2/4-independent (middle) promoters versus a random subset of not bivalent promoters (bottom). Chromatin accessibility measured by ATACseq is shown in light blue. All data from this study. (E) Genome browser view of a Dppa2/4-dependent gene locus Csf1 showing different chromatin marks, chromatin accessibility (ATAC-seq), DNA methylation (DNAme) and transcription at day 4 of embryoid body differentiation for wild type (WT) and Dppa2/4 double knockout (DKO) ESCs. Promoter region is highlighted in pale yellow, CpG island (CGI) denoted by orange box. (F) Scatterplot showing levels of H3K4me3 and H3K27me3 in wild type cells at gene promoters using ChIP-seq data from 3 independent cellular clones, highlighting Dppa2/4-dependent (apricot), -sensitive (green) and -independent (teal) promoters. Box plots of are shown on top (H3K4me3) and right (H3K27me3) where the central line denotes the median, the yellow box the 25th and 75th percentile of the data and the black whiskers the median +/- the interquartile range (25-75%) multipled by 2. Circles represent single promoters that fall outside this range. Dppa2/4 dependent n = 309 promoters; Dppa2/4 sensitive n = 327 promoters; Dppa2/4 independent n = 2,541 promoters.
We termed those bivalent promoters that had lost both H3K4me3 and H3K27me3 “Dppa2/4-dependent”, and those that had lost just H3K4me3 “Dppa2/4-sensitive” to distinguish them from “Dppa2/4-independent” bivalent promoters which remained unaltered (Fig. 2C-D). Consistent with their epigenetic changes, in knockout cells Dppa2/4-dependent promoters failed to recruit COMPASS member Ash2l, and the Polycomb members Ring1B and Ezh2, while Dppa2/4-sensitive promoters had reduced Ash2l levels and slightly increased Ring1B and Ezh2 levels (Fig. 2D-E, Extended Data Fig. 3B-F), potentially indicating that polycomb components are redistributed upon Dppa2/4 knockout. Chromatin accessibility was substantially reduced at Dppa2/4-dependent promoters and partially impaired at Dppa2/4-sensitive promoters, whilst the remaining bivalent promoters remained largely unaffected (Fig. 2D-E, Extended Data Fig. 3C, E-G). Consistent with the association between Dppa2/4 and the SRCAP complex, Dppa2/4-dependent promoters also exhibited lower H2A.Z enrichment (Fig. 2D-E, Extended Data Fig. 3B-F). Interestingly, the response of a gene to Dppa2/4 loss was correlated with the levels of H3K4me3 in WT cells, with Dppa2/4-dependent genes having the lowest, Dppa2/4-sensitive genes intermediate and Dppa2/4-independent genes moderate-to-high H3K4me3 levels. H3K27me3 levels were not indicative of the gene’s response (Fig. 2D, F). Together, these findings support a role for Dppa2/4 in recruiting and/or stabilising Polycomb and COMPASS complexes at a subset of promoters to maintain a bivalent chromatin structure.
Dppa2/4-dependent bivalent genes are characterised by low H3K4me3, low expression and initiating but not elongating RNA polymerase II
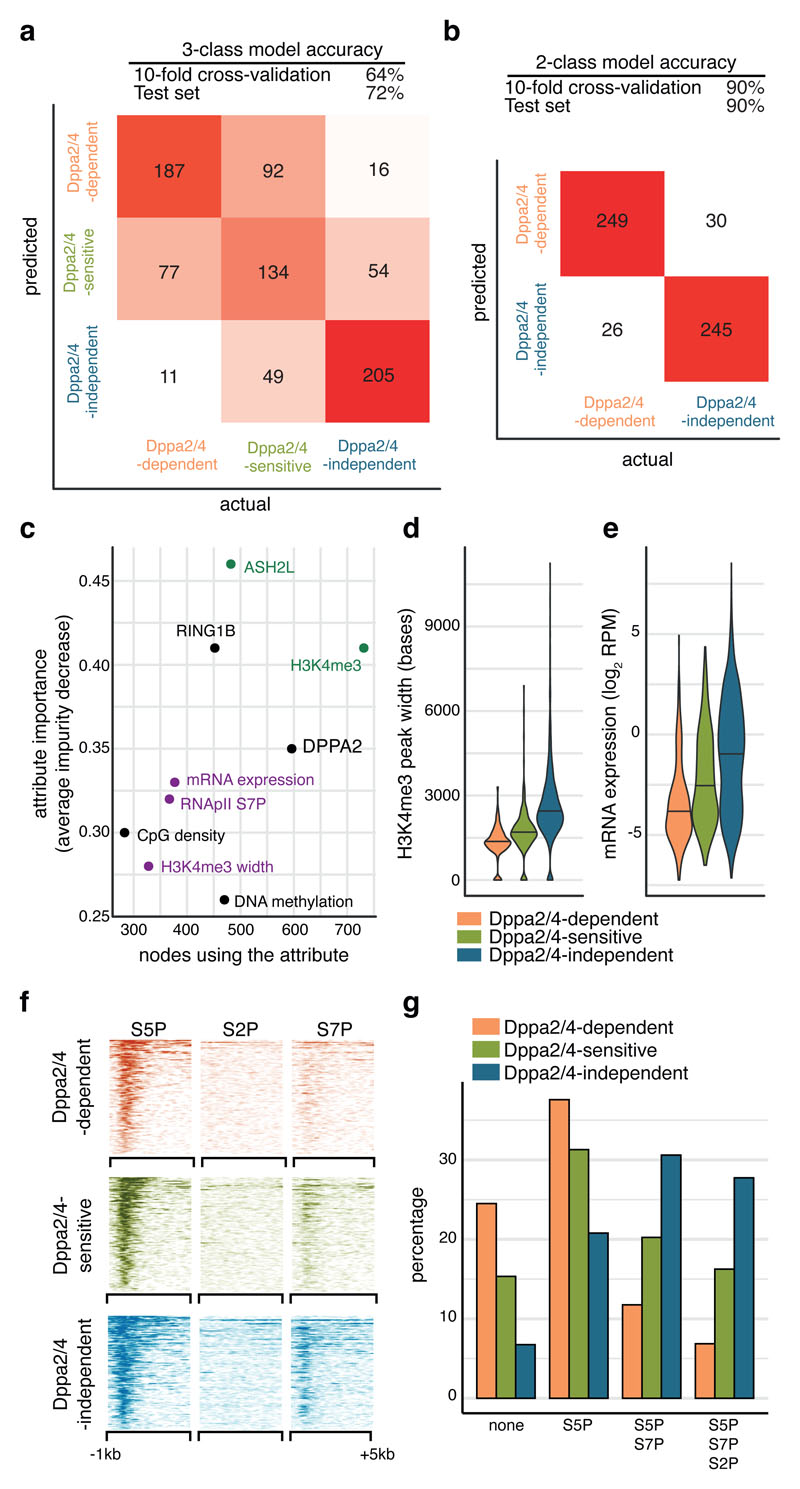
Next, focusing on the bivalent genes, we sought to understand what distinguished Dppa2/4-dependent from -sensitive and -independent bivalent genes. We took an unbiased approach and used machine learning algorithms to develop models that could predict based on genomic and epigenomic features (Supplementary Table 5) the epigenetic effect of losing Dppa2/4. The initial 3-class Random Forest classification model had an overall accuracy of 72% and was able to classify Dppa2/4-dependent and Dppa2/4-independent genes. However Dppa2/4-sensitive genes were frequently misclassified, likely due to their high similarity to Dppa2/4-dependent promoters (Fig. 3A). We therefore focused on the two extreme categories (Dppa2/4-dependent and -independent), generating a 2-class Random Forest Classification model with 90% accuracy (Fig. 3B).
Figure 3. Dppa2/4-dependent bivalent genes characterised by low H3K4me3, low expression and initiating but not elongating RNA polymerase II.
(A, B) Overall accuracy and confusion matrices for Random Forest promoter classification predicting either three (A) or two classes (B). The heatmap shows numbers of correctly and incorrectly classified promoters from a class balanced training set. (C) Ranking of the most predictive attributes in the 2-class Random Forest model showing average impurity decrease and number of nodes using each attribute. Those related to COMPASS are shown in green, those related to gene expression in purple. (D) H3K4me3 peak width at promoters in wild type ESCs (pooled ChIP-seq from 3 cellular clones) where the central line represents the median. (E) Expression of genes in WT ESCs (pooled RNA-seq from 3 cell clones). Dppa2/4 dependent n = 309 promoters; Dppa2/4 sensitive n = 327 promoters; Dppa2/4 independent n = 2,541 promoters. (F) Aligned probe plots showing enrichment of different RNA polymerase II modifications at gene transcription start sites from 1kb upstream to 5kb downstream of TSS. Data reanalysed from 22 [GSE34520]. (G) Percentage genes with different combinations of RNApII modifications. Data reanalysed from 22 [GSE34520].
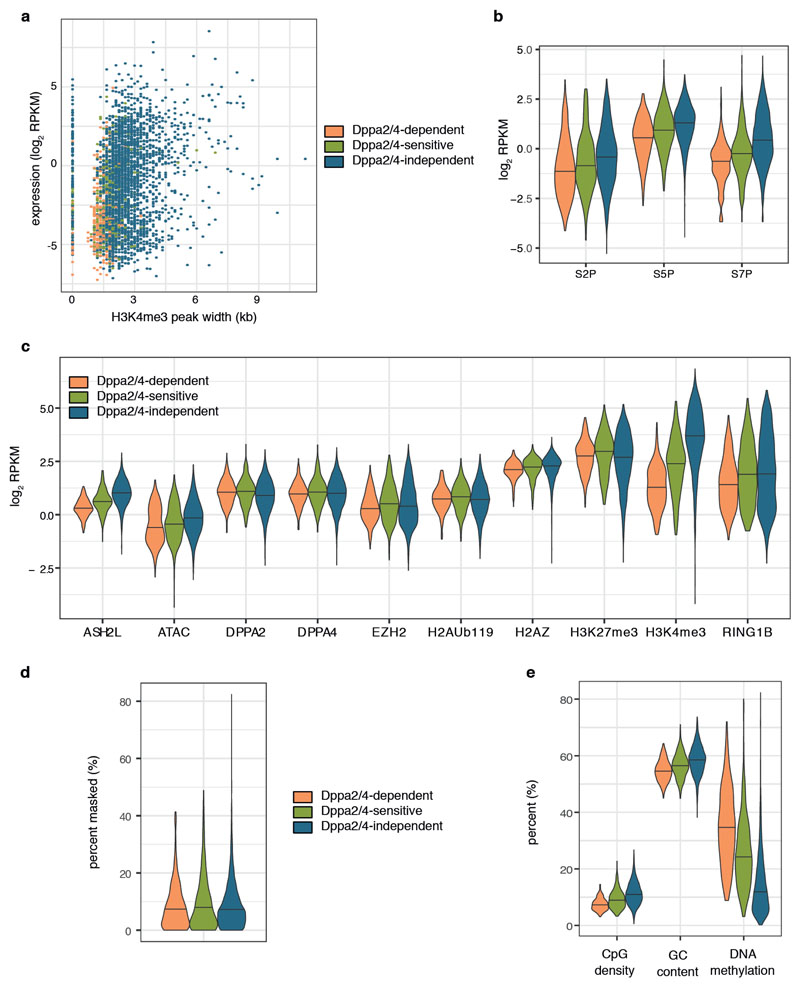
Reassuringly, the top ranking attributes were directly related to levels of H3K4me3 (Fig. 3C), a feature we had already noticed was correlated with the response of a gene to loss of Dppa2/4 (Fig. 2D, F). Notably, the next group of attributes predictive of a gene’s response to loss of Dppa2/4 was directly linked to the transcriptional status of the gene (Fig 3C, Supplementary Table 5). Dppa2/4-independent promoters had larger H3K4me3 peak width (Fig. 3D), a feature associated with increased transcriptional consistency yet independent of overall levels of gene expression 21 (Extended Data Fig.4A). Moreover, levels of gene expression (Fig. 3E) were higher for Dppa2/4-independent promoters than -dependent promoters. Also amongst the top scoring attributes was phosphorylation of Serine 7 in the C-terminal domain (CTD) of RNApolymerase II (RNApII) (Fig. 3C). RNApII CTD phosphorylation status changes as it progresses through the transcriptional cycle: Serine 5 phosphorylation (S5P) correlates with initiating RNApII, while Serine 7 phosphorylation (S7P) is associated with active promoters and coding regions, and Serine 2 phosphorylation (S2P) with elongating RNApII 22. Strikingly, whilst both Dppa2/4-dependent and -independent promoters had initiating RNApII, the Dppa2/4-independent promoters had mostly progressed to actively elongating RNApII (Fig. 3F-G, Extended Data Fig. 4B).
None of the other attributes, including Dppa2/4, Polycomb complexes or the Polycomb catalysed histone modifications H3K27me3 and H2AUb119 (Extended Data Fig.4C) showed large differences between Dppa2/4-dependent, -sensitive and -independent genes. We also examined genetic features of Dppa2/4-dependent and -independent promoters. There were no large differences in repeat composition (Extended Data Fig.4D), nor were there any motifs consistently enriched in either group of promoters (data not shown). Consistent with their lower expression, Dppa2/4-dependent promoters had fewer CpG islands and slightly reduced CpG density and content, which corresponded to higher levels of DNA methylation (Extended Data Fig.4E), reflective of the transcriptional status of the genes. In summary, our analyses highlight the variable dependency of bivalent gene promoters on Dppa2/4, with those characterised by low levels of H3K4me3, initiating but not elongating RNApII and low expression losing their bivalent chromatin structure in the absence of Dppa2/4.
Dppa2/4-dependent bivalent promoters gain DNA methylation and can no longer be activated upon differentiation
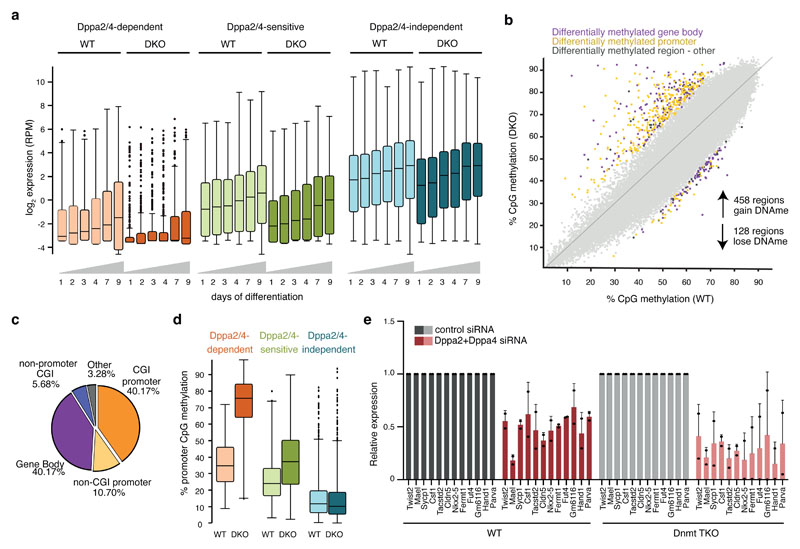
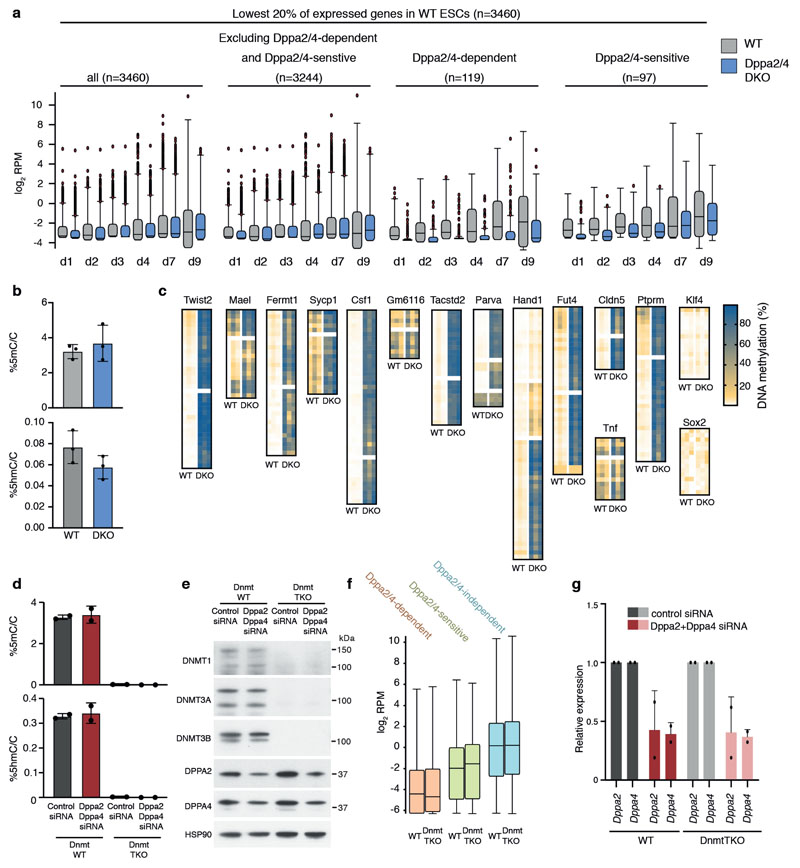
The bivalent genes affected by loss of Dppa2/4 include many important developmental genes. Of those 309 Dppa2/4-dependent genes for which knockout mice have been generated and characterised, 65 (21%) have either complete or partial lethality, often at postnatal/preweaning stages. Similar to the Dppa2/4 zygotic knockout mouse phenotype 13,14, 15 (5%) of those are associated with lung defects and 31 (10%) with skeletal defects (www.informatics.jax.org). Therefore, the precise temporal regulation of these genes is crucial for proper development. To probe the relationship of bivalency in early development and subsequent functional readout, we analysed the functional and mechanistic consequences of altering chromatin bivalency at Dppa2/4-dependent and -sensitive genes during embryoid body differentiation. Normally, in WT cells, Dppa2/4-dependent, -sensitive and -independent bivalent promoters increase in expression over 9 days (Fig. 4A). However, in Dppa2/4 DKO cells, Dppa2/4-sensitive genes are upregulated to a lesser degree whilst the Dppa2/4-dependent bivalent genes are not transcribed and remain silent (Fig. 4A). This was not simply due to their low expression in ESCs as other lowly expressed genes were still able to be effectively upregulated (Extended Data Fig.5A). To understand why these genes are repressed in the absence of Dppa2/4, we profiled DNA methylation, an epigenetic layer associated with promoter silencing. Global DNA methylation levels were similar between WT and DKO cells (Fig. 4B, Extended Data Fig. 5B), however we observed that a subset of regions enriched for promoters and gene bodies gained DNA methylation in the DKO cells (Fig. 4B-C, Extended Data Fig. 5C). Remarkably, these regions corresponded to Dppa2/4-dependent and -sensitive promoters which gained high and intermediate levels of DNA methylation in Dppa2/4 DKO cells respectively, whereas Dppa2/4-independent promoters were unaffected (Fig. 4D, Extended Data Fig. 5C). This expands previous findings revealing increased promoter DNA methylation and H3K9me3 at four promoters, including the Dppa2/4-dependent gene Nkx2-5, in ESCs lacking Dppa2 14. This likely explains why Dppa2/4-dependent promoters can no longer be activated upon differentiation.
Figure 4. Dppa2/4-dependent promoters gain DNA methylation and fail to be upregulated during differentiation.
(A) Expression of Dppa2/4-dependent (apricot), -sensitive (green) and -independent (blue) genes between WT (light) and Dppa2/4 DKO (dark) cells during 9 days of embryoid body differentiation. The plots show pooled data from three differentiation timecourses ran on different days using 1 WT and 1 DKO clone. The central line denotes the median, the coloured box the 25th and 75th percentile of the data and the black whiskers the median +/- the interquartile range (25-75%) multipled by 2. Circles represent single promoters that fall outside this range. Dppa2/4 dependent promoters n = 309; Dppa2/4 sensitive n = 327; Dppa2/4 independent n = 2,541. (B) Scatterplot showing DNA methylation levels in 100 CpG running windows between WT and Dppa2/4 DKO cells highlighting differentially methylated gene bodies (purple), promoters (yellow) and other regions (dark grey). Scatterplot shows bisulfite-sequencing data from 1 WT and 1 DKO cellular clone. (C) Genome features associated with hypermethylated probes. (D) Boxplots (as in A) showing DNA methylation levels at Dppa2/4-dependent (apricot), -sensitive (green) and -independent (blue) gene promoters between WT (light) and Dppa2/4 DKO (dark) cells. The bisulfite-sequencing data used is from 1 WT and 1 DKO cellular clone. (E) Expression of Dppa2/4-dependent genes following control (grey) or Dppa2/4 (red) siRNA treatment in WT (left, dark) and Dnmt TKO (right, light) cells for 4 days. Relative expression is normalised to the level of control siRNA (dark bars) for WT and DNMT TKO cells. Dots represent individual values and bars averages plus standard deviation of two independent experiments.
Next, we sought to understand whether Dppa2/4-dependent genes first lost bivalency then gained DNA methylation or vice versa. We separated the two molecular events by knocking down Dppa2/4 in ESCs lacking the three DNA methyltransferases (DNMT TKO cells) and consequently have no detectable 5-methylcytosine or 5-hydroxymethylcytosine 23 (Extended Data Fig.5D-E). Remarkably, whilst similarly expressed in untreated WT and DNMT TKO cells (Extended Data Fig.5F), siRNA knockdown of Dppa2/4 (Extended Data Fig.5E, G) led to a downregulation of Dppa2/4-dependent genes in both WT and DNMT TKO cells (Fig. 4E), revealing that DNA methylation is not required for their downregulation. This suggests that DNA methylation is a consequence, not a cause of bivalency loss at these regions.
Dppa2/4 are required to target H3K4me3 and prevent DNA methylation at a subset of bivalent genes
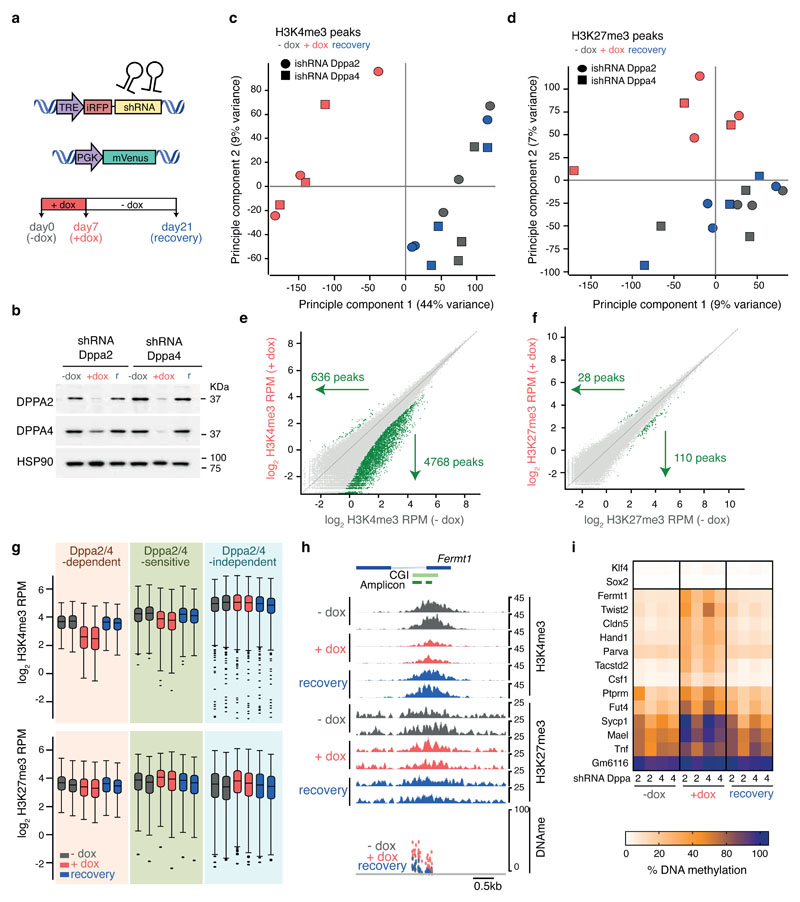
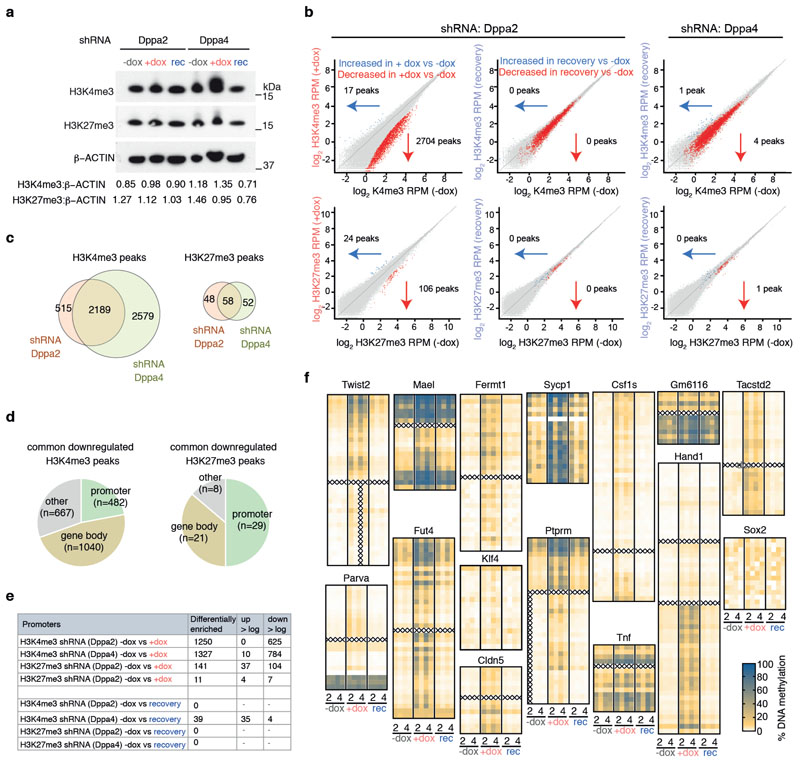
Lastly, we designed an inducible shRNA knockdown system to tease apart the molecular hierarchy of epigenetic changes occurring at Dppa2/4-dependent genes. Doxycycline (Dox) inducible shRNA hairpins against either Dppa2 or Dppa4 were stably into wild type ESCs (Fig. 5A). Following 7 days of Dox treatment, which corresponds to several cell cycles, levels of both Dppa2 and Dppa4 protein were depleted using either hairpin, an effect also seen with short term siRNA knockdowns 7. Importantly, protein levels of both Dppa2 and Dppa4 were restored after washing out Dox for 2 weeks (Fig. 5B).
Figure 5. Dppa2/4 are required to target H3K4me3 and prevent DNA methylation at a subset of bivalent genes.
(A) Schematic of inducible shRNA system. (B) Western Blotting showing knockdown and recovery of Dppa2 (top) and Dppa4 (middle) protein with inducible shRNA against Dppa2 (left three) and Dppa4 (right three). Hsp90 is shown as loading control. Uncropped blot images are available as Source Data online. (C, D) Principle Component Analysis of H3K4me3 (C) and H3K27me3 (D) peaks for -dox (grey), +dox (red) and recovery (blue) samples. Circles and squares denote samples with inducible shRNA against Dppa2 and Dppa4 respectively (for each ChIP n=3 samples generated on different days using the same bulk inducible shRNA lines). (E, F) Scatter plots of H3K4me3 (E) and H3K27me3 (F) peaks between -dox (y-axis) and +dox (x-axis) samples for inducible shRNA against Dppa4. Statistically significant differentially enriched peaks (calculated using DESeq2 with a p-value cut off of 0.05 and a >2-fold change) are highlighted in green. (G) Box whisker plots showing H3K4me3 (top) and H3K27me3 (bottom) enrichment at Dppa2/4-dependent (left set, apricot background, n=309), -sensitive (middle set, green background, n=327) and -independent (right set, blue background, n=2,541) genes between -dox (grey), +dox (red) and recovery (blue) samples for inducible shRNA against Dppa2 (left of each pair) and Dppa4 (right of each pair). Values for each gene are the mean of n=3 ChIP-seq samples generated on different days. The central line denotes the median, the coloured box the 25th and 75th percentile of the data and the black whiskers the median +/- the interquartile range (25-75%) multipled by 2. Circles represent single promoters that fall outside this range. (H) Genome browser view of Fermt1 promoter region showing H3K4me3 (top 6) and H3K27me3 (middle 6) enrichment for inducible shRNA against Dppa2 (top of each pair) and Dppa4 (bottom of each pair). DNA methylation analysis (bottom row) for -dox (grey), +dox (red) and recovery (blue) samples are shown, each CpG is represented by two dots, one for each hairpin. (I) Amplicon bisulfite-sequencing analysis showing average DNA methylation levels of analysed CpGs of promoter regions for control genes (Klf4, Sox2, top two rows) and Dppa2/4-dependent genes (remaining rows) in -dox (first 4 columns), +dox (middle 4 columns) and recovery (last 4 columns) samples. Two replicates per inducible shRNA (from the same bulk inducible shRNA line but induced and harvested on different days), are included and denoted below.
We first profiled H3K4me3 and H3K27me3 levels by ChIP-seq in untreated (-dox), treated (+dox) and cells at the end of the 2 week recovery period (recovery). Globally, levels of H3K4me3 and H3K27me3 were not substantially changed (Extended Data Fig.6A). Principal component analysis of H3K4me3 peaks revealed that the +dox samples were clearly distinct from -dox samples suggesting the cells had undergone epigenetic alterations (Fig. 5C). Importantly, this was reversible, as the recovery samples clustered with the untreated -dox samples (Fig. 5C). A much weaker effect was observed for H3K27me3 peaks (Fig. 5D), explaining much less of the variance in the data (44% by PC1 for H3K4me3 versus 7% by PC2 for H3K27me3). The epigenetic changes in the Dppa2/4 depleted samples were predominantly due to loss rather than gain of H3K4me3: several thousand H3K4me3 peaks (2704 and 4768 for shRNA against Dppa2 and Dppa4 respectively) had reduced enrichment following dox treatment. H3K27me3 was largely unchanged, with only a hundred or so H3K27me peaks (106 and 110 for shRNA against Dppa2 and Dppa4 respectively) significantly diminished in the +dox treated cells (Fig. 5E-F, Extended Data Fig. 6B-C, Supplementary Table 6). Most of the H3K4me3 or H3K27me3 changes occurred at promoters or gene bodies (Extended Data Fig.6D-E). In particular, Dppa2/4-dependent, but not -independent, promoters were most significantly affected, losing H3K4me3 in +dox treated cells, then regaining it once Dppa2/4 levels returned to normal (Fig. 5G-H). In contrast, H3K27me3 levels were modestly reduced at Dppa2/4-dependent promoters in +dox treated cells, but this was not statistically significant (Fig. 5G-H). This is despite the several cell divisions that would have taken place which would be sufficient to dilute H3K27me3, although we cannot rule out the very low levels of Dppa2/4 in the shRNA experiments may be sufficient to retain H3K27me3 at these genes. Therefore, depleting Dppa2/4 in ESCs leads to dramatic locus-specific changes in H3K4me3 (but not H3K27me3) which are restored upon reintroducing Dppa2/4, suggesting that Dppa2/4 are required both to target and maintain H3K4me3 at these regions including Dppa2/4-dependent bivalent promoters.
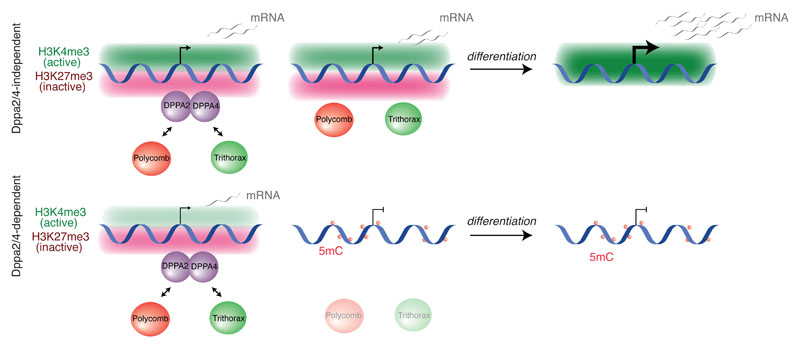
Figure 6. Dppa2/4 prime the epigenetic landscape at bivalent genes facilitating cell differentiation.
Summary of epigenetic features and transcriptional consequences of Dppa2/4 loss at Dppa2/4- dependent and Dppa2/4-independent bivalent promoters. Dppa2/4-independent promoters (top left) have higher levels of H3K4me3 and transcription than Dppa2/4-dependent promoters (bottom left) in WT cells. Upon Dppa2/4 knockout, Dppa2/4-independent genes can maintain their bivalent state (top middle) whilst -dependent genes (bottom middle) lose H3K4me3 and H3K27me3, accumulating DNA methylation. As a result of this disrupted bivalency, Dppa2/4-dependent genes cannot be properly transcriped upon differentiation of DKO cells (bottom, right).
Lastly, we investigated how DNA methylation changed upon short term depletion of Dppa2/4. We adapted an amplicon-BS-seq method 24 (see materials and methods) to profile Dppa2/4-dependent promoters at high coverage (median 4485-fold) in -dox, +dox and recovery cells (Fig. 5I, Extended Data Fig. 6F, Supplementary Table 7). Strikingly, 12 out of 13 regions analysed gained DNA methylation across the entire amplicon following 7 days of Dppa2/4 depletion (Fig. 5H-I, Extended Data Fig. 6F). This DNA hypermethylation was subsequently lost again following restoration of Dppa2/4 in the cells, whilst both control regions remained unmethylated throughout the timecourse experiment (Fig. 5H-I, Extended Data Fig. 6F). This was despite H3K27me3 levels remaining largely unchanged at these loci suggesting that H3K27me3 itself is not sufficient to prevent DNA methylation at these sites. Together, our results suggest a molecular hierarchy by which Dppa2/4 are required to actively target and maintain H3K4me3 at lowly expressed gene promoters, preventing DNA hypermethylation and ensuring these genes are able to be activated upon differentiation.
Discussion
It is currently unclear how different epigenetic states, such as bivalent chromatin, are established at specific gene promoters in pluripotent cells, and the functional significance of this for development. We reveal that the heterodimerising proteins Dppa2 and Dppa4 function as epigenetic priming factors in part by regulating the epigenetic landscape at over 600 bivalent promoters in ESCs. Regions that lose the bivalent H3K4me3 and H3K27me3 modifications subsequently gain repressive DNA methylation and fail to become active upon differentiation (Fig. 6). Importantly, our study reveals a targeting principle for bivalent chromatin to a set of important developmental gene promoters, and the signficiance losing this structure has on cell fate acquisition.
Intriguingly, despite Dppa2/4 being bound at over a third of gene promoters, in particular active and bivalent promoters, there is a wide range of responses to loss of Dppa2/4 in ESCs. Through machine learning approaches we revealed that Dppa2/4-dependent bivalent promoters that lose both H3K4me3 and H3K27me3 are characterised by lower H3K4me3 enrichment and breadth, reduced gene expression and absence of elongating RNA polymerase II in WT cells. These transcriptionally inert promoters may require continuous targeting of Polycomb and COMPASS machinery by Dppa2/4 to maintain the primed bivalent chromatin state. In contrast, positive feedback loops at actively transcribed Dppa2/4-independent genes may reinforce their bivalent epigenetic structure, rendering them immune to loss of Dppa2/4. The slightly higher expression and H3K4me3 levels at Dppa2/4-sensitive bivalent promoters which lose just H3K4me3 likely explains why these are not as affected as Dppa2/4-dependent promoters in Dppa2/4 DKO cells. Mechanistically this could reflect some level of heterogenity between individual cells at Dppa2/4-sensitive genes where, depending on cellular context (e.g. concentration of chromatin modifiers or transcription factors), there are some cases where bivalency is maintained and other cases where it is not. In bulk data heterogeneity at such genes would appear as an intermediate phenotype. Our results also raise the possibility that bivalent promoters differ in their stability, with Dppa2/4-dependent promoters being potentially less robust, consistent with the suggestion that bivalent chromatin operates as a bistable system switching rapidly between active and silent states 25.
We observed differences in the epigenetic changes between long-term absence in Dppa2/4 knockout clones and short term depletion using our inducible shRNA system, in that only the former had significantly altered H3K27me3 changes at Dppa2/4-dependent genes. By comparing these two systems we can begin to elucidate the molecular hierarchy of events that take place both in the establishment and maintenance of the epigenetic landscape at Dppa2/4-dependent genes. Both H3K4me3 and DNA methylation are similarly affected in both systems and the changes are reversible upon reexpression of Dppa2/4, revealing that Dppa2/4 are necessary both to target and to maintain H3K4me3/DNA hypomethylation at these regions. H3K4me3 loss would be expected to result in de novo DNA methylation 26, and consistently our experiments in DNMT TKO cells which lack DNA methylation suggest that it is the H3K4me3 loss which results in de novo DNA methylation and not vice versa. Intriguingly, despite the hypermethylation observed following Dppa2/4 depletion, H3K27me3 is still retained, suggesting that DNA methylation is not sufficient to block H3K27me3 deposition, at least at these regions and in the timeframe of the experiment.
Importantly, Dppa2/4 associates with chromatin bound by COMPASS and Polycomb in addition to the SRCAP complex that deposits H2A.Z. Our chromatin-based proteomics analyses does not necessarily imply a direct physical interaction between these complexes, instead interactions between Dppa2/4 and Polycomb/COMPASS may likely be transient and sub-stoichiometric, rather than existing as stable members of these complexes. Dppa2/4 also directly interacts with the SRCAP complex that deposits H2A.Z which also been shown to associate with MLL and Polycomb complexes 27–30, suggesting another mechanism by which Dppa2/4 may target the bivalent chromatin machinery in ESCs. Alternatively, Dppa2/4 may have more of a biophysical role, establishing a permissive chromatin platform that facilitates the binding and stabilisation of these complexes to their target loci. This would be crucial at lowly expressed genes, which without Dppa2/4 present lose the ability to effectively recruit these chromatin complexes, whilst we propose that the active transcription at highly expressed genes could provide a self-reinforcing feedback loop at their promoters ensuring they remain primed even in the absence of Dppa2/4.
Our study identifies Dppa2/4 as epigenetic priming factors which function by establishing a permissive epigenetic landscape in pluripotent cells enabling appropriate activation of gene expression programmes at future stages of development. Dppa2/4 DKO ESCs fail to efficiently differentiate, likely due to the loss of bivalent chromatin and gain in DNA methylation at important developmental promoters. Consistently, zygotic knockouts for Dppa2/4 survive embryogenesis only to succumb shortly after birth from defects in tissues in which these proteins are not expressed 13,14, although maternal stores of Dppa2/4 may be masking more severe developmental defects in gastrulating embryos. Dppa2/4 have additional roles in regulating the zygotic transcriptional programme in vitro 7,8,19, and enhance iPSC reprogramming 10 suggesting their roles as epigenetic priming factors may extend more generally to processes that encompass cell fate transitions. It will be exciting to determine whether other proteins, similar to Dppa2/4, act as epigenetic priming factors, establishing a permissive chromatin landscape at important developmental genes in pluripotent cells, enabling their effective and timely activation at later temporal stages.
Materials and Methods
Cell culture and flow cytometry
E14 mouse ESCs (a generous gift from A. Smith) were grown using standard serum/LIF culture conditions (DMEM, 4,500 mg/L glucose, 4 mM L-glutamine, 110 mg/L sodium pyruvate, 15% fetal bovine serum, 1 U/mL penicillin, 1 mg/mL streptomycin, 0.1 mM nonessential amino acids, 50 mM b-mercaptoethanol, 103 U/mL LIF) at 37 degrees Celsius in normal oxygen, feeder-free on gelatin coated plates. They were tested regularly for mycoplasma contamination using the MycoAlert Mycoplasma Detection Kit (Lonza LT07-218) and always found to be negative. Cells were not authenticated. Stable overexpression cell lines were generated by transfecting GFP, Dppa2-GFP or Dppa4-GFP constructs previously described 7 using Lipofectamine 2000 on preplated cells and resistant cells selected with appropriate antibiotics for at least 1 week. Resistant cells were sorted as single cells into 96 well plates by flow cytometry using a BD Aria III or BD Influx high-speed cell sorter, and clonal expansion. Overexpression was validated by qPCR and Western Blotting. siRNA transfections were performed by transfecting Dharmacon siRNA ON-TARGETplus siRNA SMARTpool at a final concentration of 50 nM with Lipofectamine. CRISPR double knockout ESC line (clone 43) was described previously 7, and additional CRISPR double knockout ESC lines (clone 37 and clone 53) generated as previously described 7. WT and DNMT TKO cell lines were described in 34. For embryoid bodies, 2x10⁶ mESCs were cultured on 10cm low-attachment dishes in standard ESC medium containing all described components except LIF. Embryoid body experiments were performed using WT clone 58 and Dppa2/4 DKO clone 43 and performed in biological triplicate on three separate occasions.
RNA isolation, qPCR and RNA-seq
Total RNA was isolated using TriReagent (Sigma) or RNA-DNA allprep columns (Qiagen) 0.5-1μg DNAse treated (Thermo Fisher EN0525) RNA was converted to cDNA using random priming (Thermo RevertAid K1622). qRT-PCR was performed using Brilliant II or II SYBR master mix (Agilent Technologies) and relative quantification performed using the comparative CT method with normalisation to CycloB1 levels. Primer sequences available upon request. Opposite strand-specific polyA RNA libraries were made using 1 μg of DNase- treated RNA at the Sanger Institute Illumina bespoke pipeline and sequenced using the Illumina HiSeq2 platform. EB RNA-seq raw FastQ data were trimmed with Trim Galore (version 0.4.4, default parameters) and mapped to the mouse GRCm38 genome assembly using Hisat2 version 2.1.0. Stable overexpression clone data used Trim Galore v0.5.0_dev and HiSat2 v2.1.0.
Chromatin immunoprecipitation
Ten million cells were fixed in 1% formaldehyde (Fisher Scientific 28906) in DMEM (Invitrogen 41966-052) for 10 minutes, quenched in 0.125M glycine, and scraped off cell culture dishes using cell scrapers. Cells were lysed with buffers LB1 (50mM Hepes-KOH (pH 7.5), 140mM NaCl, 1mM EDTA, 10% Glycerol, 0.5% Igepal CA-630, 0.25% Triton-X 100), LB2 (10mM Tris-HCl (pH 8.0), 200mM NaCl, 1mM EDTA, 0.5mM EGTA), and LB3 (10mM Tris-HCl (pH 8.0), 100mM NaCl, 1mM EDTA, 0.5mM EGTA, 0.1% Na-Deoxycholate, 0.5% N-lauroylsarcosine, 1x Protease Inhibitors (Roche)) consecutively, before fragmenting chromatin by sonicating for 30 cycles of 30s ON high /30s OFF (Diagenode Bioruptor). For each ChIP, 5μg antibody (anti-Ash2l Bethyl Labs A300-489, anti-Ezh2 CST D2C9, anti-H2A.Z Abcam ab4174, anti-H3K4me3 Abcam ab8580, anti-H3K27me3 Active Motif AM39155, anti-IgG Abcam ab125938, anti-Ring1b CST D22F2) was pre-bound to protein G dynabeads (Invitrogen) and blocked with 0.5% BSA in PBS. Sonicated DNA was added to antibody-bound beads with 10% Triton-X 100 and incubated overnight at 4°C on a rotator. Beads and DNA were washed 6 times with RIPA buffer (50mM HEPES-KOH (pH 7.6), 1mM EDTA, 0.7% Na-Deoxycholate, 1% Igepal CA-630, 0.5M LiCl), followed by one wash in 1x TBS and overnight incubation at 65°C with elution buffer (50 mM Tris- HCl, pH 8; 10 mM EDTA; 1% SDS). For precipitation of chromatin, samples were treated with RNase A and Proteinase K. DNA was purified using MinElute PCR purification columns (Qiagen 28006) and eluted in 30μL of TE. DNA was quantified using HS DNA Qubit (ThermoFisher) or PicoGreen (ThermoFisher) assays and analysed using qPCR (Twist2-F GGAGCGGTTGTCAAAACGTC, Twist2-R CTTGAACGCCCTAGCATCCA, Fermt1-F AGCGGGTCCAGTGATGTTG, Fermt1-R CCTTCTCCTACTCGGAGCGA, Klf4-F GAAAGTCCTGCCACGGGAA, Klf4-R CTGGATGAGTCACGCGGATAA) or libraries generated using MicroPlex Library Preparation Kit (Diagenode) following the manufacturer’s instructions. Libraries were quality controlled using bioanalyser HS DNA chips (Agilent) and single-end 50bp reads sequenced using the Illumina HiSeq2 sequencing platform. Raw FastQ data were trimmed with Trim Galore v0.6.1 and aligned to mouse GRCm38 genome using Bowtie 2 v 2.3.2.
ATAC-seq
ATAC-seq libraries were performed as previously described 35 with the following modification to use on 10,000 cells: initial transposition reaction was performed with 10,000 cells, 10μl 2x TD buffer, 0.5μl Tn5 enzyme and 9.5μl H2O for 30minutes at 37 degrees Celsius. A total of 15 cycles of amplification were used. Two technical replicates were performed per clone, with 3 WT and 3 Dppa2/4 DKO clones used (total of 12 samples). 75bp paired-end reads were sequenced using the Illumina HiSeq2 platform. Raw FastQ data were trimmed with Trim Galore (v0.5.0_dev) using standard parameters and aligned using Bowtie 2 v2.3.2. Data was analysed using Seqmonk, graphing and statistics was performed using Excel, RStudio or Graphpad Prism8.
DNA methylation analyses
Genomic DNA quantified using picogreen assay (Invitrogen) was digested using DNA Degradase plus (Zymo Research) overnight at 37 degrees and analysed by liquid chromatography-tandem mass spectrometry on a LTQ Orbitrap Velos mass spectrometer (Thermo Scientific) fitted with a nanoelectrospray ion-source (Proxeon, Odense, Denmark). Mass spectral data for cytosine, 5-methylcytosine and 5-hydroxymethylcytosine were acquired as previously described 36. Whole genome bisulfite libraries were generated using NOME-seq kit from Active Motif (103946) according to manufacturer’s instructions with 6 cycles of amplification for 2 WT clones (clones 57 and 58) and 1 Dppa2/4 DKO clone (clone 43). Unfortunately, the GC methyltransferase reaction did not work adequately so only DNA methylation (and not accessibility) information was analysed. Raw fastQ data were trimmed using Trim Galore version 0.4.4 using standard parameters, reads aligned using Bismark v0.18.2 37 and data analysed using Seqmonk software.
Amplicon bisulfite-sequencing
Amplicon bisulfite libraries were designed and generated targeting control and Dppa2/4-dependent promoters based on a previous method 24. Briefly, Genomic DNA was isolated using the DNeasy Blood and Tissue Kit (Qiagen) or the AllPrep DNA/RNA Micro Kit (Qiagen) according to manufacturer’s instructions and eluted into TE buffer or H2O. 1μg of genomic DNA was bisulfite converted using the EZ DNA methylation Gold kit (Zymo Research) according to manufacturer’s instructions with either magnetic bead or column clean-up and eluted/resuspended in elution buffer. Amplicons of interest were amplified using 2x KAPA HiFi Uracil+ ReadyMix using primers containing UMI for deduplication and PCR adapters for a second round of PCR to adapt sample-specific barcodes and adapters for Illumina Sequencing. Primer sequences are available upon request. Libraries were sequenced using the Illumina MiSeq platform with a 10% PhIX spike-in and paired-end 250bp reads.
Immunofluorescence
Cells were grown on gelatin-coated glass coverslips, fixed in 4% formaldehyde (Polysciences, Inc. Cat #18814) for 20-30 minutes and permeabilised in 0.5% Triton X-100 in PBS for 15-20 minutes at room temperature. Coverslips were blocked in 3% BSA for 1-3 hours at room temperature or overnight at 4 degrees. Primary antibodies were used at the following dilutions: anti-Oct4 (abcam ab19857) 1:100; anti-Nanog (abcam ab80892) 1:100; anti-Sox2 (abcam ab97959) 1:100. Fluorescently labelled (Alexa488 or Alexa647) secondary antibodies were used at 1:1000 for 30-60 minutes at room temperature, coverslips counterstained with DAPI and mounted in ProLong Gold Antifade mounting medium (Invitrogen P36934). Images were acquired using a Zeiss 780 confocal microscope system with 40x or 63x oil immersion lenses. Image processing was performed using Zeiss ZEN or FUJI software.
Western Blotting
Protein lysates were generated by resuspending cells in Laemmli buffer (62.5 mM Tris-HCl pH 6.8, 2% SDS, 5% β-mercaptoethanol, 10% glycerol) without dye, boiling for 3-5 minutes at 98°C and immediately storing at -80°C. Protein quantification was performed using a Bradford Assay (Bio-Rad). Samples were boiled prior to loading onto NuPAGE Bis-Tris gels (Invitrogen NP0322BOX) together with NuPAGE MES SDS (Invitrogen NP0002) or MOPS SDS running buffer (Invitrogen NP0001) and blotted on PVDF membranes. Following blocking in 5% skimmed milk/0.01%Tween/PBS, membranes were incubated with primary antibodies overnight (anti-β-Actin Abcam ab6276 1:20,000; anti-Ash2l Bethyl A300-489A 1:2,000; anti-Dmap CST 13326 1:1,000; anti-Dppa2 R&D MAB4356 1:500; anti-Dppa4 Santa Cruz sc-74614 1:200; anti-Ezh2 CST D2C9 1:1,000; anti-H2A.Z Abcam ab4174 1:1,000; anti-H3 Abcam ab1791 1:1000; anti-H3K4me3 Diagenode C15410003 1:1,000; anti-H3K27me3 Millipore 07-449 1:1000; anti-Hsp90 Abcam ab13492 1:5,000; anti-Mll2 CST D6X2E #63735 1:1000, anti-Ruvbl1 Abcam ab51500 1:100; anti-Suz12 CST D39F6 1:1,000). After extensive washing in PBS/0.01% Tween, horseradish peroxidase-conjugated secondary antibodies (anti-mouse – Santa Cruz sc-2005, 1:5000; anti-rabbit – Biorad 170-6515, 1:5000) were added for 1 h at room temperature, before further washing and detection, which was carried out with enhanced chemiluminescence (ECL) reagent (GE Healthcare, RPN2209).
Co-immunoprecipitation
Cells were washed extensively in cold PBS and collected by adding 500μL of Co-IP Lysis Buffer A (10mM Hepes-KOH, pH7.9, 1.5mM MgCl2, 10mM KCl, 0.5mM DTT, 0.05% NP-40, 250u/μL Benzonaze +_C0mplete protease inhibitors (Roche)) directly to a 15cm tissue culture plate before scraping and transferring to falcon tubes. After incubating on ice for 10 minutes, lysed cells were collected by centrifugation at 3,000rpm for 10 minutes at 4°C. The pellet was suspended in 374μL of Co-IP Lysis Buffer B (5mM Hepes-KOH, pH7.9, 1.5mM MgCl2, 0.2mM EDTA, 0.5mM DTT, 26% glycerol (v/v), 250u/μL Benzonase +C0mplete protease inhibitors (Roche) and a further 26μL of 4.6M NaCl was added to lyse nuclear membranes. The resulting nuclear lysates were dounce homogonised (20 strokes) to further lyse membranes and shear DNA before a further 30-minute incubation on ice. Lysates were centrifuged at 24,000g for 20 minutes at 4°C and the supernatant collected and protein concentration quantified by Bradford assay (Bio-Rad). For immunoprecipitation, 50μL of protein G dynabeads (Invitrogen) were washed in IP wash buffer (10mM Tris-HCl pH7.5, 150mM NaCl, 0.5mM EDTA) and 5μg of anti-Dppa4 antibody (R&D AF3730) added before incubating at 4°C for 1 hour. Beads were washed 3 times in IP wash buffer to remove unbound antibody and 250μg of nuclear lysate was added, before further incubation at 4°C for 1 hour. Beads were washed 5 times in IP wash buffer to remove unbound protein before bound proteins were eluted from the beads by adding 50μL of 1x Laemmli buffer and boiling at 70°C for 10 minutes. Inputs were prepared by taking 25μg of nuclear lysate and adding an appropriate volume of 5x Laemmli buffer. Samples and inputs were analysed by western blotting as described above.
Inducible shRNA experiments
For inducible knockdown experiments, miR30 based shRNAs were expressed using a tetracycline-inducible PiggyBac transposon system (pCLLI-i-iRFP-shRNA-pGK-mVenus), built upon the previously reported pCLLIP-i 38. Briefly, the puromycin resistant gene was replace by PCR-amplified mVenus. Then, PCR amplified iRFP and miR30 cassettes were inserted under the control of TRE3G, where the iRFP fragment acts as a stuffer allowing for efficient processing of the short hairpin. The PCR template (iRFP-N1) for iRFP amplification was a gift from Michael Davidson (Addgene plasmid # 54787). Guide sequences against Dppa2 (TAGACCTCAACTTTCTTGCCAT) or Dppa4 (TTAAACACTAACAACACACTAC) were cloned into this vector. Stable cell lines were generated by transfecting E14 ESCs with the shRNA vectors along with transposase, waiting for 2 weeks until transposase control transfection had lost its fluorescence, then sorting on the mVenus, collecting the top 30% of mVenus positive cells as a bulk population for further experiments. Cells were treated with 2μg/ml doxycyclin (Dox) for 7 days.
qPLEX-RIME
For qPLEX-RIME experiments 50 million cells were fixed, lysed and immunoprecipitated as described for Chromatin immunoprecipitation (see above). Following immunoprecipitation using 5μg of anti-GFP antibody (Abcam ab290), beads were washed 10 times in RIPA buffer and 2 times in 100mM ammonium bicarbonate (AMBIC) solution. Samples were prepared as described previously 18. In brief, after on bead tryptic digestion, C18 cleaned peptides were labelled with the TMT-10plex reagents (Thermo Scientific) for 1 hour. Samples were mixed and fractionated with Reversed-Phase cartridges at high pH (Pierce #84868). Nine fractions were collected using different elution solutions in the range of 5–50% ACN.
Peptide fractions were reconstituted in 0.1% formic acid and analysed on a Dionex Ultimate 3000 UHPLC system coupled with the nano-ESI Fusion Lumos mass spectrometer (Thermo Fisher Scientific, San Jose, CA). Samples were loaded on the Acclaim PepMap 100, 100 μm × 2 cm C18, 5 μm, 100 Å trapping column with the ulPickUp injection method using the loading pump at 5 μL/min flow rate for 10 min. For the peptide separation the EASY-Spray analytical column 75 μm × 25 cm, C18, 2 μm, 100 Å column was used for multi-step gradient elution at a flow rate of 300 nl/min. Mobile phase (A) was composed of 2% acetonitrile, 0.1% formic acid and mobile phase (B) was composed of 80% acetonitrile, 0.1% formic acid. Peptides were eluted using a gradient as follows: 0 - 10 min, 5 % mobile phase B; 10 – 90 min, 5 – 38% mobile phase B; 90 -100 min, 38% - 95% B; 100 - 105 min, 95% B; 105 – 110min, 95% - 5% B; 110 – 120 min, 5% B.
Data-dependent acquisition began with a MS survey scan in the Orbitrap (380 – 1500 m/z, resolution 120,000 FWHM, automatic gain control (AGC) target 3E5, maximum injection time 100 ms). MS2 analysis consisted of collision-induced dissociation (CID), quadrupole ion trap analysis, automatic gain control (AGC) target 1E4, NCE (normalized collision energy) 35, q-value 0.25, maximum injection time 50 ms, an isolation window at 0.7, and a dynamic exclusion duration of 45s. MS2–MS3 was conducted using sequential precursor selection (SPS) methodology with the top10 setting. HCD-MS3 analysis with MS2 isolation window 2.0 Th. The HCD collision energy was set at 65% and the detection was performed with Orbitrap resolution 50,000 FWHM and in the scan range 100–400 m/z. AGC target 1E5, with the maximum injection time of 105ms.
qPLEX-RIME data processing
The Proteome Discoverer 2.1. (Thermo Scientific) was used for the processing of CID tandem mass spectra. The SequestHT search engine was used and all the spectra searched against the Uniprot Mus musculus FASTA database (taxon ID 10090 - Version November 2018). All searches were performed using as a static modification TMT6plex (+229.163 Da) at any N-terminus and on lysines and Methylthio at Cysteines (+45.988Da). Methionine oxidation (+15.9949Da) and Deamidation on Asparagine and Glutamine (+0.984) were included as dynamic modifications. Mass spectra were searched using precursor ion tolerance 20 ppm and fragment ion tolerance 0.5 Da. For peptide confidence, 1% FDR was applied and peptides uniquely matched to a protein were used for quantification.
Data processing, normalisation and statistical analysis were carried out using qPLEXanalyzer 18 package from Bioconductor. Peptide intensities were normalised using median scaling and protein level quantification was obtained by the summation of the normalized peptide intensities. A statistical analysis of differentially-regulated proteins was carried out using the limma method 39. Multiple testing correction of p-values was applied using the Benjamini-Hochberg method 40 control the false discovery rate (FDR).
Next generation sequencing data processing and mapping
Aligned read (bam) files were imported into Seqmonk software (http://www.bioinformatics.babraham.ac.uk/projects/seqmonk) for all downstream analysis using standard parameters. ChIPseq reads were extended by 250bp.
RNA-sequencing analysis
For RNA-seq analysis, data was quantified at the mRNA level using strand-specific quantification of mRNA probes using the RNA-seq quantification pipeline in Seqmonk. Differentially expressed genes were determined using both EdgeR (p-value of 0.05 with multiple testing correction) and intensity difference filter (p-value 0.05 with multiple testing correction), with the intersection between the two lists giving the high confidence differentially expressed genes.
ChIP-seq analysis
For ChIP-seq analysis, data was analysed using Seqmonk software. Peaks were called using MACS (p-value cutoff 1.0E-5, sonicated fragment size 300bp), and for Dppa2 and Dppa4 peaks, filtered further to retain peaks that had values above the 95% value of input (0.008) and a 2-fold change over input to retain 36 901 and 21 509 high confidence peaks for Dppa2 and Dppa4 respectively, or 39 218 peaks in total. Dppa2/4 ChIP-seq data was reanalysed from 10 and peak calling verified in separate datasets 11,12. For histone ChIP-seq analysis peaks were called using MACS (p-value cutoff 1.0E-5, sonicated fragment size 300bp) and differentially enriched peaks determined using DESeq2 (p-value 0.05, multiple testing correction). Unless otherwise specified, promoters were defined as the region covering 1kb up and 1kb downstream of the gene start or transcription start site (TSS).
Whole genome bisulfite sequencing analysis
Genome wide DNA methylation analysis was performed using 100 CpG running window probes and differentially methylated regions calculated using a binomial F/R filter with minimum 15% difference threshold, p-value <0.05. For promoter analysis, probes 1kb up and 1kb downstream of TSS were generated and methylation values calculated with a minimum count of 2 per position and at least 10 observations per feature, and combined using the mean.
Amplicon bisulfite sequencing analysis
As first step in the processing, the first 8 bp of Read 2 were removed and written into the readID of both reads as an in-line barcode, or UMI (Unique Molecular Identifier). This UMI was then later used during the de-duplication step with “deduplicate bismark --barcode mapped_file.bam”. Raw sequence reads were then trimmed to remove both poor quality calls and adapters using Trim Galore (v0.6.5 www.bioinformatics.babraham.ac.uk/projects/trim_galore/, Cutadapt version 2.3, parameters: --paired). Trimmed reads were aligned to the mouse reference genome in paired-end mode. Alignments were carried out with Bismark v0.22.3 41 CpG methylation calls were extracted from the mapping output using the Bismark methylation extractor (v0.22.3). Deduplication was then carried out with deduplicate_bismark, using the --bacode option to take UMIs into account (see above).
Analysis of chromatin states
Published mouse ES cell chromatin states were used to annotate the GRCm38 genome 42. The states were generated using ChromHMM 43 and more information on the annotation can be found at https://github.com/guifengwei/ChromHMM_mESC_mm10/blob/master/README.md. Dppa2/4 peaks were annotated with the chromatin state that overlaps its centre. The percentage of Dppa2/4 peaks falling into each of the states was determined, and enrichment of the chromatin state over its genomic representation was calculated.
Machine learning on Dppa2/4 dependent and independent promoters
As an input for machine learning analyses, 20 chromatin and sequence features of bivalent promoters as specified in Supplementary Table 5 were collated. Random Forest classification was used to predict Dppa2/4 dependency of bivalent promoters. A random set of 10 % of all bivalent promoters was set aside to provide an independent test set for performance evaluation, and training sets of bivalent promoters were class-balanced (n=825 for 3-class prediction, n=550 for 2-class prediction). Before Random Forest model generation, attributes were selected using Correlation-based Feature Subset Selection, retaining 4/9 (3-class/2-class) out of the 20 attributes. Performance was evaluated using 10-fold cross-validation and the independent test set. Learning parameters: weka.classifiers.meta.AttributeSelectedClassifier -E "weka.attributeSelection.CfsSubsetEval -P 1 -E 1" -S "weka.attributeSelection.BestFirst -D 0 -N 5" -Wweka.classifiers.trees.RandomForest -- -P 100 - attribute-importance -I 100 -num-slots 1 -K 0 -M 1.0 - V 0.001 -S 1
Software
Data was analysed using Seqmonk software (http://www.bioinformatics.babraham.ac.uk/projects/seqmonk), graphing and statistics was performed using Excel, RStudio (http://www.rstudio.com/), R (https://www.R-project.org/) or Graphpad Prism8. Weka 44 was used for machine learning.
Statistics
For qPLEX-RIME data, statistical analysis were carried out using the qPLEXanalyzer 18 package from Bioconductor. A statistical analysis of differentially-regulated proteins was carried out using the limma method 39. Multiple testing correction of p-values was applied using the Benjamini-Hochberg method 40 control the false discovery rate (FDR). To identify differentially enriched peaks in ChIP-seq, ATAC-seq and bisulfite-seq data DESeq2 was used within SeqMonk (http://www.bioinformatics.babraham.ac.uk/projects/seqmonk) to identify promoters with a >2-fold difference in enrichement and a p-value of <0.05 after Benjamimi and Hochberg correction. To identify differentially expressed genes from RNA-seq data we used DESeq2 (threshold of p<0.05 after Benjamimi and Hochberg correction) and the intensity difference filter within SeqMonk (http://www.bioinformatics.babraham.ac.uk/projects/seqmonk) with default settings. To identifty statistically significant differences between WT and DKO cells in ChIP-qPCR data we performed unpaired two-tailed t-tests for each target locus individually.
Extended Data
Supplementary Material
Reporting Summary Statement.
Further information on experimental design is available in the Nature Research Reporting Summary linked to this article.
Acknowledgements
We thank all members of the Reik laboratory for helpful discussions. We also thank Federico di Tullio for help generating overexpression cell lines, Felix Krueger for processing sequencing data and general bioformatics support, Steven Wingett for bioinformatic assistance and Simon Andrews for bioinformatic advice. We thank Bethan Hussey and Elizabeth Easthope at Sanger Institute and Kristina Tabbada at Babraham Institute for assistance with high-throughput sequencing, Rachael Walker for assistance with flow cytometry, Judith Webster and David Oxley for mass spectrometry. DNMT TKO cells were a kind gift from Dirk Schübeler (FMI). M.E.-M. is supported by a BBSRC Discovery Fellowship (BB/T009713/1) and was supported by an EMBO Fellowship (ALTF938-2014) and a Marie Sklodowska-Curie Individual Fellowship. A.P. is supported by Sir Henry Wellcome Fellowship (215912/Z/19/Z). M.B. was supported by an Erasmus Grant. M.N. and Y.I. were supported by Cancer Research UK Cambridge Institute Core Grant [C9545/A29580]. Research in the Reik laboratory is supported by the Biotechnology and Biological Sciences Research Council (BB/K010867/1), Wellcome Trust (095645/Z/11/Z), and European Union Epigenesys.
Footnotes
Author contributions:
M.A.E.-M. and W.R. conceived, designed and supervised the study. M.A.E.-M. performed experiments, analysed data and wrote the paper. A.P. helped perform ChIP-qPCR, ChIP-seq, Co-IP and Western blotting experiments, prepared cells for proteomics and analysed proteomic and ChIP-seq data. M.B. performed embryoid body differentiation assays and qPCRs. C.K. analysed chomatin state association of Dppa2/4 and generated the Random Forest Model for Dppa2/4 dependency based on promoter features. V.N.R.F. and C.D’S. performed qPLEX-RIME experiments. Y.I. and M. N. designed inducible shRNA vectors.
Competing Interests
W.R. is a consultant and shareholder of Cambridge Epigenetix. The remaining authors declare no competing financial interests.
Data availability
All sequencing data generated in this study has been submitted to GEO under accession number GSE135841. The mass spectrometry proteomics data have been deposited to the ProteomeXchange Consortium via the PRIDE 45 partner repository with the data set identifier PXD014981. DPPA2 and DPPA4 ChIP data was reanalysed from 10 [GSE117173], RNA polymerase II ChIP was reanalysed from 22 [GSE34520], EZH2 and SUZ12 ChIP data in Figure 2 was reanalysed from 46 [GSE49435], ASH2L-GFP ChIP data in Figure 2 reanalysed from 1 [GSE52071], MLL2 ChIP data in Figure 2 reanalysed from 31 [GSE48172], TIP60/KAT5 ChIP data reanalysed from 33 [GSE69671], high confidence bivalent gene list from 15, DNMT TKO ESC RNAseq data from 34 [GSE67867], 2C-like ZGA gene list from 47. Uncropped images of immunoblots presented in Figure 5b are provided as Source Data.
References
- 1.Denissov S, et al. Mll2 is required for H3K4 trimethylation on bivalent promoters in embryonic stem cells, whereas Mll1 is redundant. Dev. 2014;141:526–537. doi: 10.1242/dev.102681. [DOI] [PubMed] [Google Scholar]
- 2.Hu D, et al. The Mll2 branch of the COMPASS family regulates bivalent promoters in mouse embryonic stem cells. Nat Struct Mol Biol. 2013;20:1093–1097. doi: 10.1038/nsmb.2653. [DOI] [PMC free article] [PubMed] [Google Scholar]
- 3.Voigt P, Tee W-W, Reinberg D. A double take on bivalent promoters. Genes Dev. 2013;27:1318–38. doi: 10.1101/gad.219626.113. [DOI] [PMC free article] [PubMed] [Google Scholar]
- 4.Bernstein BE, et al. A Bivalent Chromatin Structure Marks Key Developmental Genes in Embryonic Stem Cells. Cell. 2006;125:315–326. doi: 10.1016/j.cell.2006.02.041. [DOI] [PubMed] [Google Scholar]
- 5.Azuara V, et al. Chromatin signatures of pluripotent cell lines. Nat Cell Biol. 2006;8:532–538. doi: 10.1038/ncb1403. [DOI] [PubMed] [Google Scholar]
- 6.Voigt P, Tee W-W, Reinberg D. A double take on bivalent promoters. Genes Dev. 2013;27:1318–38. doi: 10.1101/gad.219626.113. [DOI] [PMC free article] [PubMed] [Google Scholar]
- 7.Eckersley-Maslin M, et al. Dppa2 and Dppa4 directly regulate the Dux-driven zygotic transcriptional program. Genes Dev. 2019;33:194–208. doi: 10.1101/gad.321174.118. [DOI] [PMC free article] [PubMed] [Google Scholar]
- 8.De Iaco A, Coudray A, Duc J, Trono D. DPPA2 and DPPA4 are necessary to establish a 2C-like state in mouse embryonic stem cells. EMBO Rep. 2019:e47382. doi: 10.15252/embr.201847382. [DOI] [PMC free article] [PubMed] [Google Scholar]
- 9.Yan Y-L, et al. DPPA2/4 and SUMO E3 ligase PIAS4 opposingly regulate zygotic transcriptional program. PLOS Biol. 2019;17:e3000324. doi: 10.1371/journal.pbio.3000324. [DOI] [PMC free article] [PubMed] [Google Scholar]
- 10.Hernandez C, et al. Dppa2/4 Facilitate Epigenetic Remodeling during Reprogramming to Pluripotency. Cell Stem Cell. 2018;23:396–411.:e8. doi: 10.1016/j.stem.2018.08.001. [DOI] [PMC free article] [PubMed] [Google Scholar]
- 11.Klein RH, Tung P-Y, Somanath P, Fehling HJ, Knoepfler PS. Genomic functions of developmental pluripotency associated factor 4 (Dppa4) in pluripotent stem cells and cancer. Stem Cell Res. 2018;31:83–94. doi: 10.1016/j.scr.2018.07.009. [DOI] [PMC free article] [PubMed] [Google Scholar]
- 12.Engelen E, et al. Proteins that bind regulatory regions identified by histone modification chromatin immunoprecipitations and mass spectrometry. Nat Commun. 2015;6:7155. doi: 10.1038/ncomms8155. [DOI] [PMC free article] [PubMed] [Google Scholar]
- 13.Madan B, et al. The pluripotency-associated gene Dppa4 is dispensable for embryonic stem cell identity and germ cell development but essential for embryogenesis. Mol Cell Biol. 2009;29:3186–203. doi: 10.1128/MCB.01970-08. [DOI] [PMC free article] [PubMed] [Google Scholar]
- 14.Nakamura T, Nakagawa M, Ichisaka T, Shiota A, Yamanaka S. Essential Roles of ECAT15-2/Dppa2 in Functional Lung Development †. Mol Cell Biol. 2011;31:4366–4378. doi: 10.1128/MCB.05701-11. [DOI] [PMC free article] [PubMed] [Google Scholar]
- 15.Mas G, et al. Promoter bivalency favors an open chromatin architecture in embryonic stem cells. Nat Genet. 2018;50:1452–1462. doi: 10.1038/s41588-018-0218-5. [DOI] [PubMed] [Google Scholar]
- 16.Maldonado-Saldivia J, et al. Dppa2 and Dppa4 Are Closely Linked SAP Motif Genes Restricted to Pluripotent Cells and the Germ Line. Stem Cells. 2007;25:19–28. doi: 10.1634/stemcells.2006-0269. [DOI] [PubMed] [Google Scholar]
- 17.Masaki H, Nishida T, Sakasai R, Teraoka H. DPPA4 modulates chromatin structure via association with DNA and core histone H3 in mouse embryonic stem cells. Genes to Cells. 2010;15:327–337. doi: 10.1111/j.1365-2443.2010.01382.x. [DOI] [PubMed] [Google Scholar]
- 18.Papachristou EK, et al. A quantitative mass spectrometry-based approach to monitor the dynamics of endogenous chromatin-associated protein complexes. Nat Commun. 2018;9:2311. doi: 10.1038/s41467-018-04619-5. [DOI] [PMC free article] [PubMed] [Google Scholar]
- 19.Yan Y-L, et al. DPPA2/4 and SUMO E3 ligase PIAS4 opposingly regulate zygotic transcriptional program. PLOS Biol. 2019;17:e3000324. doi: 10.1371/journal.pbio.3000324. [DOI] [PMC free article] [PubMed] [Google Scholar]
- 20.Surface LE, et al. H2A.Z.1 Monoubiquitylation Antagonizes BRD2 to Maintain Poised Chromatin in ESCs. Cell Rep. 2016;14:1142–1155. doi: 10.1016/j.celrep.2015.12.100. [DOI] [PMC free article] [PubMed] [Google Scholar]
- 21.Benayoun BA, et al. H3K4me3 breadth is linked to cell identity and transcriptional consistency. Cell. 2014;158:673–88. doi: 10.1016/j.cell.2014.06.027. [DOI] [PMC free article] [PubMed] [Google Scholar]
- 22.Brookes E, et al. Polycomb Associates Genome-wide with a Specific RNA Polymerase II Variant, and Regulates Metabolic Genes in ESCs. Cell Stem Cell. 2012;10:157–170. doi: 10.1016/j.stem.2011.12.017. [DOI] [PMC free article] [PubMed] [Google Scholar]
- 23.Domcke S, et al. Competition between DNA methylation and transcription factors determines binding of NRF1. Nature. 2015;528:575–579. doi: 10.1038/nature16462. [DOI] [PubMed] [Google Scholar]
- 24.Klobucar T, et al. IMPLICON: an ultra-deep sequencing method to uncover DNA methylation at imprinted regions. bioRxiv. 2020:2020.03.21.000042. doi: 10.1101/2020.03.21.000042. [DOI] [PMC free article] [PubMed] [Google Scholar]
- 25.Sneppen K, Ringrose L. Theoretical analysis of Polycomb-Trithorax systems predicts that poised chromatin is bistable and not bivalent. Nat Commun. 2019;10:2133. doi: 10.1038/s41467-019-10130-2. [DOI] [PMC free article] [PubMed] [Google Scholar]
- 26.Ooi SKT, et al. DNMT3L connects unmethylated lysine 4 of histone H3 to de novo methylation of DNA. Nature. 2007;448:714–717. doi: 10.1038/nature05987. [DOI] [PMC free article] [PubMed] [Google Scholar]
- 27.Creyghton MP, et al. The histone variant H2AZ is enriched at Polycomb group target genes in ES cells and is necessary for proper execution of developmental programs. Cell. 2008;135:649. doi: 10.1016/j.cell.2008.09.056. [DOI] [PMC free article] [PubMed] [Google Scholar]
- 28.Ku M, et al. H2A.Z landscapes and dual modifications in pluripotent and multipotent stem cells underlie complex genome regulatory functions. Genome Biol. 2012;13:R85. doi: 10.1186/gb-2012-13-10-r85. [DOI] [PMC free article] [PubMed] [Google Scholar]
- 29.Wang Y, et al. Histone variants H2A.Z and H3.3 coordinately regulate PRC2-dependent H3K27me3 deposition and gene expression regulation in mES cells. BMC Biol. 2018;16:107. doi: 10.1186/s12915-018-0568-6. [DOI] [PMC free article] [PubMed] [Google Scholar]
- 30.Hu G, et al. H2A.Z facilitates access of active and repressive complexes to chromatin in embryonic stem cell self-renewal and differentiation. Cell Stem Cell. 2013;12:180–92. doi: 10.1016/j.stem.2012.11.003. [DOI] [PMC free article] [PubMed] [Google Scholar]
- 31.Hu D, et al. The Mll2 branch of the COMPASS family regulates bivalent promoters in mouse embryonic stem cells. Nat Struct Mol Biol. 2013;20:1093–1097. doi: 10.1038/nsmb.2653. [DOI] [PMC free article] [PubMed] [Google Scholar]
- 32.Kaneko S, Son J, Shen SS, Reinberg D, Bonasio R. PRC2 binds active promoters and contacts nascent RNAs in embryonic stem cells. Nat Struct Mol Biol. 2013;20:1258–1264. doi: 10.1038/nsmb.2700. [DOI] [PMC free article] [PubMed] [Google Scholar]
- 33.Ravens S, Yu C, Ye T, Stierle M, Tora L. Tip60 complex binds to active Pol II promoters and a subset of enhancers and co-regulates the c-Myc network in mouse embryonic stem cells. Epigenetics and Chromatin. 2015;8:1–16. doi: 10.1186/s13072-015-0039-z. [DOI] [PMC free article] [PubMed] [Google Scholar]
- 34.Domcke S, et al. Competition between DNA methylation and transcription factors determines binding of NRF1. Nature. 2015;528:575–579. doi: 10.1038/nature16462. [DOI] [PubMed] [Google Scholar]
- 35.Buenrostro JD, Wu B, Chang HY, Greenleaf WJ. ATAC-seq: A Method for Assaying Chromatin Accessibility Genome-Wide. Curr Protoc Mol Biol. 2015;109:21.29.1–9. doi: 10.1002/0471142727.mb2129s109. [DOI] [PMC free article] [PubMed] [Google Scholar]
- 36.Ficz G, et al. FGF signaling inhibition in ESCs drives rapid genome-wide demethylation to the epigenetic ground state of pluripotency. Cell Stem Cell. 2013;13:351–9. doi: 10.1016/j.stem.2013.06.004. [DOI] [PMC free article] [PubMed] [Google Scholar]
- 37.Krueger F, Andrews SR. Bismark: a flexible aligner and methylation caller for Bisulfite-Seq applications. Bioinformatics. 2011;27:1571–1572. doi: 10.1093/bioinformatics/btr167. [DOI] [PMC free article] [PubMed] [Google Scholar]
- 38.Kirschner K, et al. Phenotype Specific Analyses Reveal Distinct Regulatory Mechanism for Chronically Activated p53. PLoS Genet. 2015;11:1–28. doi: 10.1371/journal.pgen.1005053. [DOI] [PMC free article] [PubMed] [Google Scholar]
- 39.Ritchie ME, et al. limma powers differential expression analyses for RNA-sequencing and microarray studies. Nucleic Acids Res. 2015;43:e47–e47. doi: 10.1093/nar/gkv007. [DOI] [PMC free article] [PubMed] [Google Scholar]
- 40.Benjamini Y, Hochberg Y. Controlling the False Discovery Rate: A Practical and Powerful Approach to Multiple Testing. J R Stat Soc Ser B. 1995;57:289–300. [Google Scholar]
- 41.Krueger F, Andrews SR. Bismark: a flexible aligner and methylation caller for Bisulfite-Seq applications. Bioinformatics. 2011;27:1571–1572. doi: 10.1093/bioinformatics/btr167. [DOI] [PMC free article] [PubMed] [Google Scholar]
- 42.Pintacuda G, et al. hnRNPK Recruits PCGF3/5-PRC1 to the Xist RNA B-Repeat to Establish Polycomb-Mediated Chromosomal Silencing. Mol Cell. 2017;68:955–969.:e10. doi: 10.1016/j.molcel.2017.11.013. [DOI] [PMC free article] [PubMed] [Google Scholar]
- 43.Ernst J, Kellis M. Chromatin-state discovery and genome annotation with ChromHMM. Nat Protoc. 2017;12:2478–2492. doi: 10.1038/nprot.2017.124. [DOI] [PMC free article] [PubMed] [Google Scholar]
- 44.Witten IH, Ian H, Frank E, Hall MA, Mark A, Pal CJ. Data mining: practical machine learning tools and techniques [Google Scholar]
- 45.Vizcaíno JA, et al. 2016 update of the PRIDE database and its related tools. Nucleic Acids Res. 2016;44:11033. doi: 10.1093/nar/gkw880. [DOI] [PMC free article] [PubMed] [Google Scholar]
- 46.Kaneko S, Son J, Shen SS, Reinberg D, Bonasio R. PRC2 binds active promoters and contacts nascent RNAs in embryonic stem cells. Nat Struct Mol Biol. 2013;20:1258–1264. doi: 10.1038/nsmb.2700. [DOI] [PMC free article] [PubMed] [Google Scholar]
- 47.Eckersley-Maslin MA, et al. MERVL/Zscan4 Network Activation Results in Transient Genome-wide DNA Demethylation of mESCs. Cell Rep. 2016;17:179–192. doi: 10.1016/j.celrep.2016.08.087. [DOI] [PMC free article] [PubMed] [Google Scholar]
Associated Data
This section collects any data citations, data availability statements, or supplementary materials included in this article.
Supplementary Materials
Data Availability Statement
All sequencing data generated in this study has been submitted to GEO under accession number GSE135841. The mass spectrometry proteomics data have been deposited to the ProteomeXchange Consortium via the PRIDE 45 partner repository with the data set identifier PXD014981. DPPA2 and DPPA4 ChIP data was reanalysed from 10 [GSE117173], RNA polymerase II ChIP was reanalysed from 22 [GSE34520], EZH2 and SUZ12 ChIP data in Figure 2 was reanalysed from 46 [GSE49435], ASH2L-GFP ChIP data in Figure 2 reanalysed from 1 [GSE52071], MLL2 ChIP data in Figure 2 reanalysed from 31 [GSE48172], TIP60/KAT5 ChIP data reanalysed from 33 [GSE69671], high confidence bivalent gene list from 15, DNMT TKO ESC RNAseq data from 34 [GSE67867], 2C-like ZGA gene list from 47. Uncropped images of immunoblots presented in Figure 5b are provided as Source Data.


