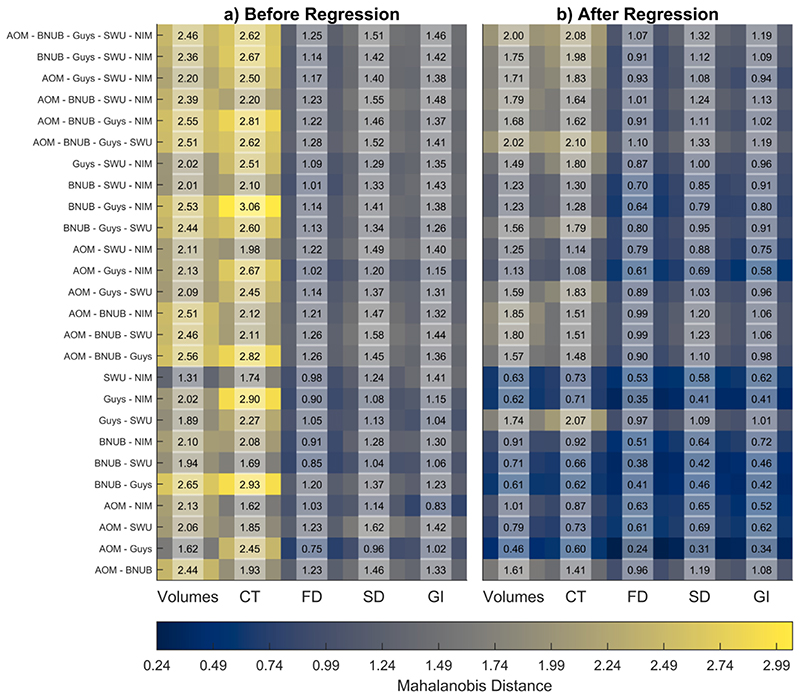
Fig. 7.
Average Mahalanobis distances between combinations of sites before and after regression of age, TIV, and sex for raw data; for any site combination, we first created a reference distribution using the overall mean and the pooled covariance; then, we calculated the distances of each site from this reference distribution and summarized it as the overall average; the x-axes indicate the different feature categories − gray matter volumes, cortical thickness (CT), fractal dimension (FD), sulcal depth (SD), and gyrification index (GI). Note that the AOMIC dataset has been abbreviated to “AOM,” BNUBeijing dataset has been abbreviated to “BNUB”, and the NIMHANS dataset has been abbreviated to “NIM”. [color version of this figure is available online].

