Abstract
The non-genetic mechanisms required to sustain malignant tumor state are poorly understood. During the transition from benign tumors to malignant carcinoma, tumor cells need to repress differentiation and acquire invasive features. Using transcriptional profiling of cancer stem cells (CSC) from benign tumors and malignant skin squamous cell carcinoma (SCC), we identified the nuclear receptor NR2F2 as uniquely expressed in malignant SCC. Using genetic gain- and loss-of-function in vivo, we show that NR2F2 is essential for promoting the malignant tumor state by controlling tumor stemness and maintenance in mouse and human SCC. We demonstrate that NR2F2 promotes tumor cell proliferation, epithelial-mesenchymal transition (EMT) and invasive features, while repressing tumor differentiation and immune cell infiltration by regulating a common transcriptional program in mouse and human SCCs. Altogether, we identify NR2F2 as a key regulator of malignant CSC functions that promotes tumor renewal and restricts differentiation to sustain malignant tumor state.
Introduction
The progression from benign to malignant tumors requires tumor cells to sustain their renewal capacity, impair their differentiation, and remodel the extracellular matrix (ECM) allowing invasion. Genetic and non-genetic mechanisms have been proposed to regulate malignant transition. However, the non-genetic mechanisms that regulate malignant tumor state remain poorly understood.
Squamous Cell Carcinomas (SCC) are very frequent cancers that arise in different body locations such as skin, oral cavity, head and neck, esophagus and lung; some are associated with poor clinical prognosis1,2. Mouse skin SCC present the same histology and a very similar mutational landscape as their human counterpart, providing an ideal model to study tumor initiation and progression3,4. Carcinogen-induced skin SCC are among the most extensively used mouse models for the study of tumorigenesis. In this model, topical application of 9,10-dimethyl-1,2-benzanthracene (DMBA), a potent mutagen, is followed by 12-O-Tetradecanoylphorbol-13-acetate (TPA) treatment, which stimulates proliferation and inflammation. This treatment leads to the appearance of benign tumors called papillomas that keep the normal differentiation of the skin epidermis, with a proliferative layer of basal tumor cells and several layers of terminally differentiated, non-proliferative cells expressing K1/K10. Following TPA administration, a fraction (about 10-20%) of benign papillomas progress to invasive carcinomas, which loose K1/K10 expression, disrupt the basal lamina and can invade the underlying mesenchyme giving rise to distant lymph node and lung metastases5,6.
Cancer stem cells (CSC) are a subpopulation of cells presenting long-term self-renewing capacities that can sustain tumor growth7. The most common assay to study CSC consists in the transplantation of limiting dilutions of FACS isolated tumor cells into immunodeficient mice. CSC present higher tumor-propagating cell capacity, leading to the formation of secondary tumors upon transplantation of limiting dilution of tumor cells and greater long-term self-renewal capacity, as assessed by serial transplantation8. In skin SCC, CSC have been identified based on their high level of basal integrin and CD34 expression9–12. Molecular characterization of these CSC has uncovered different transcription factors (TFs) such as Sox2, Twist1 and Pitx1 that regulate the renewal of CSC in both benign papillomas and malignant SCC13–16. The mechanisms specifically regulating malignant CSC remain unknown.
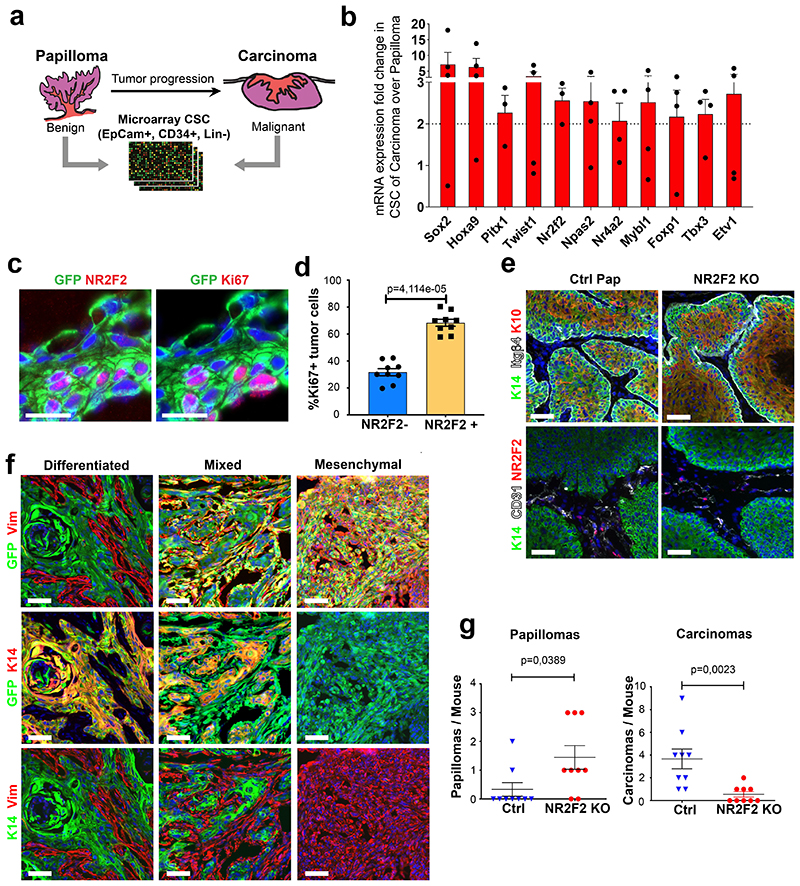
To identify the mechanisms that regulate malignant CSC in skin squamous tumors, we compared the transcriptional profile of CD34+ Epcam+ tumor cells in well-differentiated papillomas and malignant SCC14. Among the TFs that were differentially regulated between these two populations, we found that at the protein level the nuclear receptor NR2F2 was exclusively expressed in malignant tumor cells, in contrast to the other TFs such as Sox2, Twist1 and Pitx1 that were expressed in both benign and malignant skin tumors13–16 (Fig. 1a, Extended Data Fig. 1a, b). NR2F2, a TF of an orphan nuclear receptor family, is expressed during embryonic development in the mesenchymal part of various organs17,18. As embryonic development proceeds, NR2F2 expression is restricted in adult tissues to some endothelial cells and the uterine mesenchyme18. In cancer, NR2F2 was initially reported to regulate tumorigenesis in a non-cellular autonomous manner by regulating the tumor microenvironment, in particular neo-angiogenesis. Conditional ablation of NR2F2 in all tissues using Rosa-CreER decreases neo-angiogenesis and tumor growth upon transplantation of mouse tumor cell lines and in spontaneous mammary and pancreatic tumors19–21. In addition to its expression in tumor microenvironment, NR2F2 is expressed in various human cancers including breast, prostate, colorectal, pancreatic, and ovarian cancers22–24. Conflicting studies showed that NR2F2 expression in tumors could be associated with either good or poor prognosis23–29. In a prostate mouse cancer model, conditional deletion of NR2F2 and PTEN in prostate epithelial cells delayed the progression toward high-grade tumors; conversely NR2F2 overexpression in the same model accelerated tumor progression30. However, the role and the mechanisms by which NR2F2 regulates malignant tumor states, tumor stemness and maintenance are currently unknown.
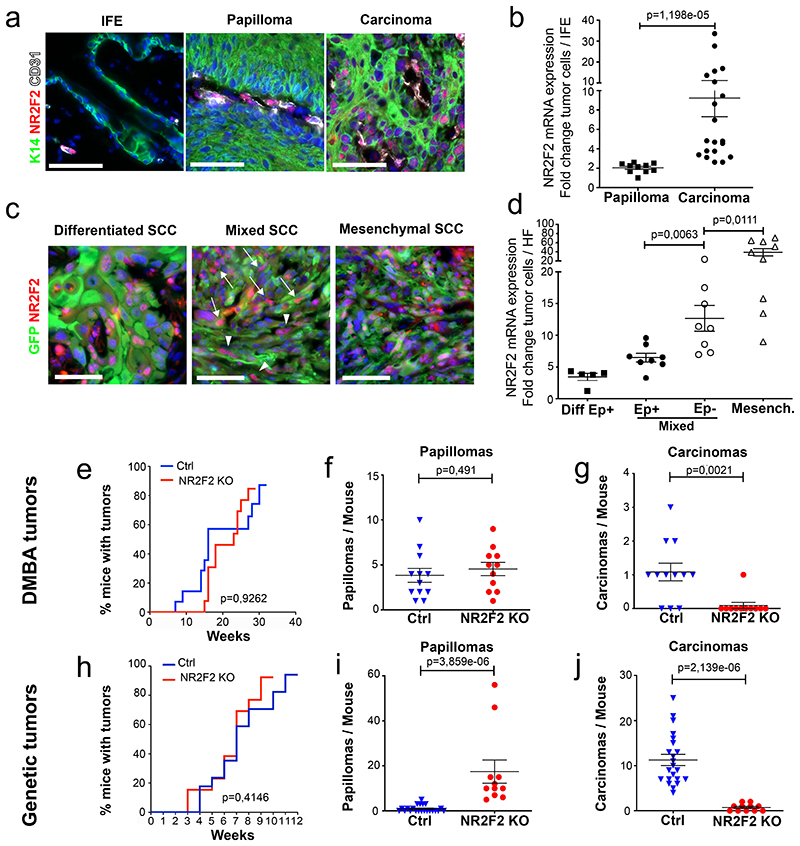
Figure 1. NR2F2 loss of function prevents malignant transition.
a, b: Expression of NR2F2 in DMBA/TPA induced tumors. a: Immunostaining for K14 (epithelial cells), CD31 (endothelial cells) and NR2F2 in interfollicular epidermis (IFE), benign tumors (Papillomas) and malignant SCC. Representative images of at least 10 independent biological replicates. b: qRT-PCR for NR2F2 in tumor cells from benign papillomas and malignant carcinomas. The mRNA expression is normalized to normal IFE. (n=10 Papillomas and 20 Carcinomas).
c, d: Expression of NR2F2 in Lgr5CreER/KRasG12D/p53cKO/RosaYFP derived SCCs. GFP+/Epcam+ population represents epithelial tumor cells, whereas GFP+/Epcam-population represents tumor cells that underwent EMT in genetically induced skin SCCs. c: Immunostaining for NR2F2 and YFP in differentiated, mixed (arrowheads indicate Ep+ and arrows Ep-tumor cells) and mesenchymal SCCs. Representative images of at least 5 independent biological replicates. d: qRT-PCR for NR2F2 in tumor cells isolated from differentiated, mixed (Epcam+ and Epcam-subpopulations isolated from the same tumor) and mesenchymal genetic tumors. Expression is normalized to normal hair follicle (HF) cells. (n=5 differentiated, 8 mixed and 9 mesenchymal tumors).
e, f, g: Effect of NR2F2 deletion in DMBA/TPA induced tumors. e: Percentage of mice bearing tumors over time after DMBA/TPA treatment in WT and NR2F2 KO mice. f: Number of benign tumors (papillomas) per mouse in Ctrl and NR2F2 KO. g: Number of malignant SCC per mouse in Ctrl and NR2F2 KO (n=12 Ctrl and 11 NR2F2 KO mice).
h, i, j: Effect of NR2F2 deletion in Lgr5CreER/KRasG12D/p53cKO/RosaYFP derived SCCs. h: Percentage of mice bearing tumors over time after KRasG12D expression and p53 deletion. i: Number of benign tumors (papillomas) per mouse in Ctrl and NR2F2 KO. j: Number of malignant SCC per mouse in Ctrl and NR2F2 KO (n=20 Ctrl and 11 NR2F2 KO mice).
Scale bar=50μm. Data in b, d, f, g, i, j are represented as mean ± SEM. The p-values are calculated using a two-tailed Mann-Whitney test. In e and h, we used Long-Rank-Mantel-Cox test.
Here, using genetic gain- and loss-of-function in mice and human SCC, we uncover an essential role of NR2F2 in promoting malignant tumor state and regulating tumor differentiation. Molecular profiling and in situ characterization following gain and loss of NR2F2 reveal that NR2F2 regulates different key tumor functions, promoting tumor proliferation, EMT, migration and stemness, while restraining differentiation and immune cell infiltration. Altogether, our study uncovers an essential role for NR2F2 in promoting malignant tumor state and tumor stemness in SCC by regulating the balance between CSC renewal and differentiation.
Results
NR2F2 loss-of-function prevents malignant transition
To identify the intrinsic factors that regulate the balance between self-renewal and differentiation during the transition from benign to malignant skin squamous tumors, we performed transcriptional profiling of FACS-isolated CD34+ CSC from benign and malignant carcinogen-induced skin tumors (Extended Data Fig. 1a)14. We identified Sox2, Twist1, Pitx1, Hoxa9, and the orphan nuclear receptor NR2F2 among the most upregulated TFs in malignant CD34+ CSC compared to papilloma CD34+ CSCs (Extended Data Fig. 1b). Sox2, Twist1 and Pitx1, although expressed at higher level in malignant SCCs, are also expressed in benign tumors and regulate benign tumor formation13–16. To validate the results of our microarray analysis, we analyzed NR2F2 expression by RT-qPCR and immunofluorescence during the different stages of carcinogenesis in two different SCC models. In chemically induced (DMBA/TPA) skin SCC, we found that NR2F2 expression was absent in normal skin and benign papillomas, and began to be expressed in malignant SCCs (Fig. 1a, b). NR2F2 was preferentially expressed by CD34+ CSC and proliferative basal cells in DMBA/TPA SCC (Extended Data Fig. 1b-d). We then assessed NR2F2 expression in a genetic model where skin SCC are induced by the expression of KRasG12D and p53 deletion in the hair follicle (HF) lineages using Lgr5CreER, which leads to the formation of skin SCC characterized by different degrees of EMT ranging from well-differentiated epithelial tumors, mixed (containing epithelial and mesenchymal tumor cells) tumors, to fully EMT tumors31. In these tumors, NR2F2 expression was higher and broader in SCC that presented EMT (Fig. 1c, d and Extended Data Fig. 1f). The increase of expression of NR2F2 in invasive SCCs could be related to different factors. The somatic mutations, including those activating the Ras pathway, are found in both papillomas and SCCs32. The main genetic difference between papillomas and carcinomas is the presence of aneuploidy in SCCs, whereas no chromosomal amplifications or deletions are found in papillomas. It is thus possible that aneuploidy contributes to the expression of NR2F2. Also, differences in the tumor microenvironment may contribute to the expression of NR2F2 in malignant tumors. Consistent with this notion, NR2F2 is expressed at higher level in tumor cells in direct contact with the stroma (Fig. 1a, c; Extended Data Fig. 1c).
To define the role of NR2F2 in malignant SCC, we first performed conditional deletion of NR2F2 in the skin epidermis and assessed the impact of NR2F2 loss-of-function in skin tumor initiation and progression. Mice homozygous for NR2F2 floxed alleles and carrying a K14-Cre (referred as NR2F2 KO), which leads to the deletion of NR2F2 in all the cells of the epidermis starting during embryonic development, were born at Mendelian ratio and did not present pathological phenotypes. Following DMBA/TPA administration, tumorigenesis developed at the same rate in NR2F2 KO and control mice, giving rise to comparable numbers of benign papillomas (Fig. 1e-f), which presented the same histology, expression of markers of differentiation (K10), and tumor angiogenesis (CD31) (Extended Data Fig. 1e). Strikingly, while around 20% of benign papillomas eventually progressed to malignant SCCs in control mice, the benign tumors did not progress to malignant tumors in NR2F2 KO mice even one year after tumor onset (Fig. 1g), demonstrating the essential role of NR2F2 in promoting malignant transition in skin SCCs. Conditional deletion of NR2F2 in two distinct genetic models of skin SCCs (Lgr5-CreER/KRasG12Dflox/p53flox/NR2F2flox and K14-CreER/KRasG12Dflox/p53flox/NR2F2flox), which give rise to skin tumors that invariably progress to malignant carcinomas33,34, did not significantly alter tumor initiation as the number of tumors per mice (papillomas and carcinomas) and the tumor latency were not affected by NR2F2 deletion. However, upon NR2F2 deletion, all tumors consisted of benign papillomas even after 12-14 weeks following tumor appearance, whereas in the absence of NR2F2 deletion all tumors consisted of malignant carcinomas, showing that NR2F2 deletion completely prevents malignant progression (Fig.1h-j and Extended Data Fig. 1g). Altogether, these data indicate that NR2F2 is essential for malignant progression in different mouse models of skin SCCs.
NR2F2 gain of function promotes malignant tumor state
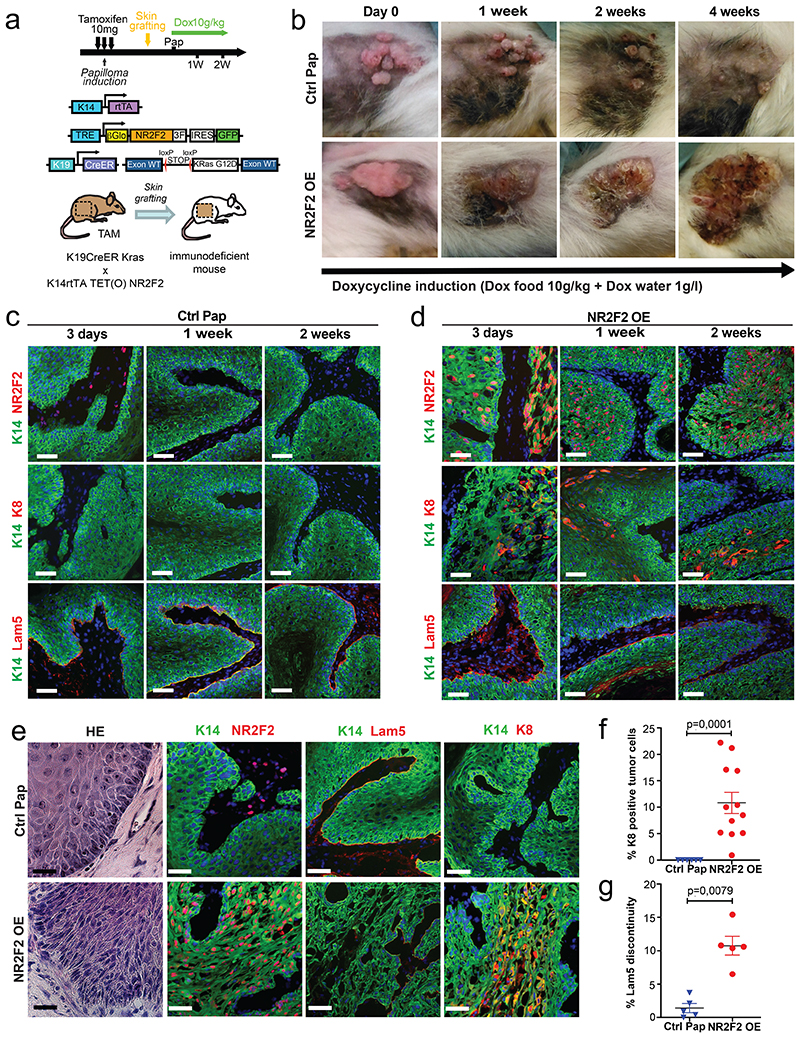
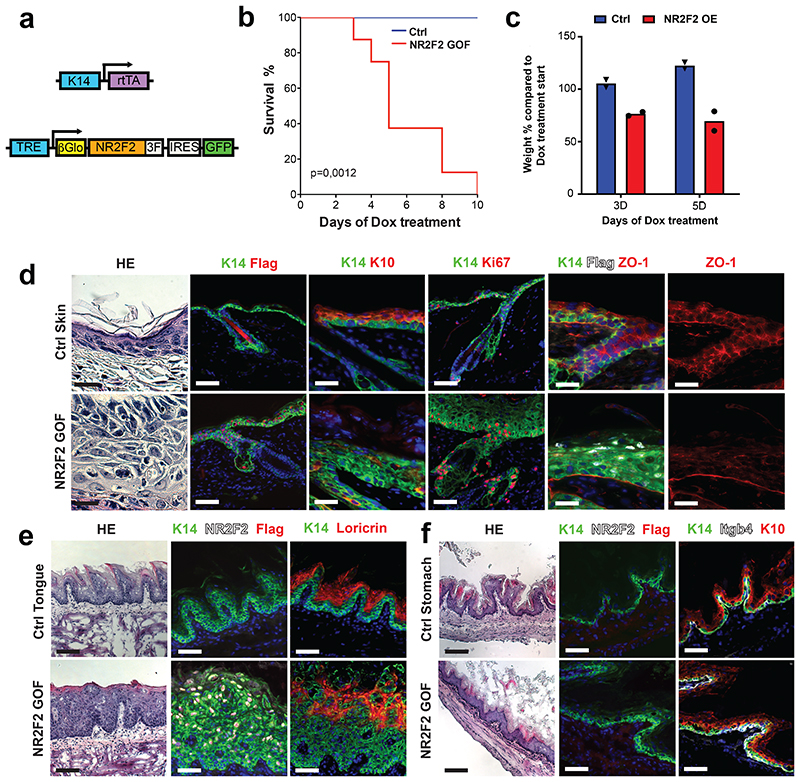
As NR2F2 is required for the progression of benign papillomas to malignant SCCs in vivo, we then assessed whether NR2F2 ectopic expression in benign tumors is sufficient to alter tumor differentiation and promote malignant transition. For this purpose, we generated K14-rtTA/TRE-NR2F2-IRES-GFP mice allowing doxycycline-inducible overexpression of NR2F2 in all squamous epithelia. Ectopic expression of NR2F2 in adult squamous epithelia induced epidermal hypertrophy and dyskeratosis that ultimately led to the death of the animals, presumably due to dehydration secondary to barrier dysfunction (Extended Data Fig. 2a-f). To circumvent this problem, we grafted a fragment of skin from K19CreER/KRasG12Dflox/K14-rtTA/TRE-NR2F2-IRES-GFP mice onto the back of immunodeficient mice, where the formation of benign papillomas is induced after tamoxifen administration33,34 (Fig. 2a). KRasG12D expression without p53 deletion in this mouse model induces the formation of benign papillomas that do not progress spontaneously to malignant SCC10,33,34. When papillomas started developing, we induced NR2F2 ectopic expression in papilloma and its adjacent skin by administrating doxycycline (Fig. 2a). NR2F2 overexpression in papillomas led progressively to the disruption of normal differentiation and the induction of features of malignant progression, characterized by changes in the shape and adhesion of tumor cells, the expression of K8, a marker of malignant progression in skin SCC35, and ultimately the discontinuation of the basal lamina, a key feature of malignant progression (Fig. 2b-g). 30-40 days following NR2F2 overexpression, the grafted tumors had increased in size and presented macroscopic features of SCC, sometimes with ulceration of the tumors (Fig. 2b), which required terminating the experiments.
Figure 2. NR2F2 gain of function promotes malignant tumor state.
a: Strategy used to overexpress NR2F2 in papillomas after grafting in immunodeficient mice.
b: Representative pictures of the evolution of Ctrl and NR2F2 OE papillomas upon doxycycline administration, from day 0 (start of doxycycline treatment) until 4 weeks of treatment. Representative images of at least 5 independent biological replicates each in Ctrl and NR2F2 OE.
c: Immunostaining for K14 (epithelial tumor cells), NR2F2, K8 (progression marker), Lam5 (basal lamina) at 3 days, 1 week and 2 weeks after beginning of doxycycline induction in Ctrl papillomas. Representative images of at least 5 independent biological replicates per condition.
d: Immunostaining for K14 (epithelial tumor cells), NR2F2, K8 (progression marker), Lam5 (basal lamina) at 3 days, 1 week and 2 weeks after beginning of doxycycline induction in NR2F2 OE papillomas. Representative images of at least 5 independent biological replicates per condition.
e: HE and immunostaining for K14 (tumor cells), NR2F2, Flag (ectopic NR2F2), Lam5 (basal lamina), K8 (malignant progression) in control and NR2F2 gain of function papillomas 4 weeks after beginning of doxycycline induction, showing that NR2F2 overexpression in papillomas induces malignant progression. Representative images of at least 5 independent biological replicates per condition.
f: Quantification of K8 positive tumor cells in NR2F2 OE papillomas (n=6 Ctrl and 12 NR2F2 OE tumors).
g: Quantification of basal lamina discontinuity based on Laminin 5 staining in NR2F2 OE papillomas (n=5 Ctrl and 5 NR2F2 OE papillomas)
Scale bar=50μm. Data in f and g are represented as mean ± SEM. The p-values are calculated using a two-tailed Mann-Whitney test.
NR2F2 promotes tumor stemness in mouse and human SCC
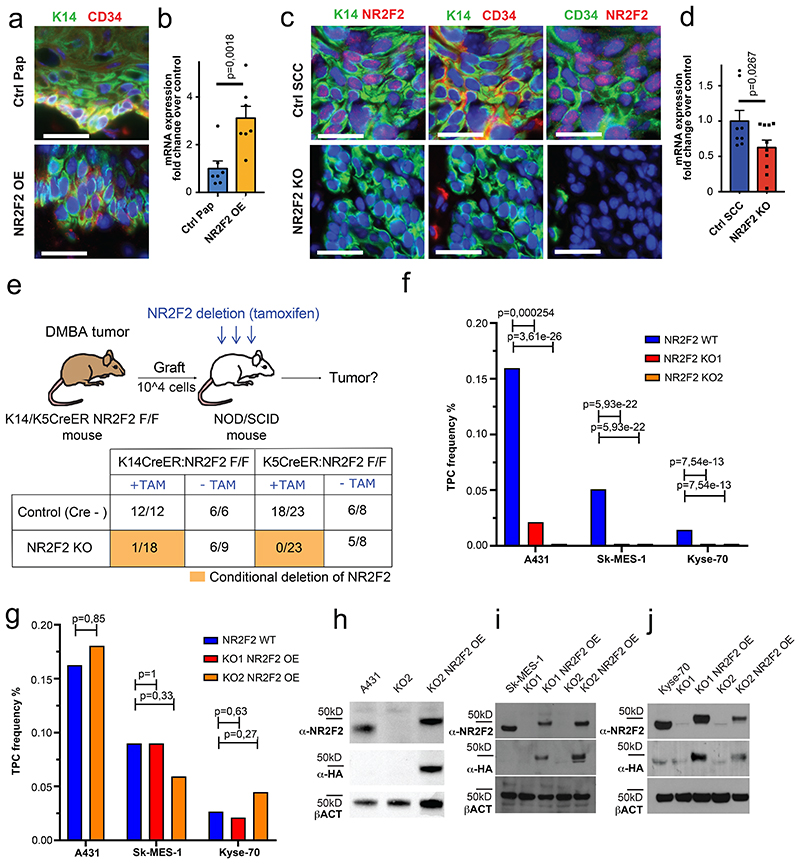
As NR2F2 is preferentially expressed by malignant CD34+ CSC, we assessed the impact of NR2F2 gain- and loss-of-function on CD34+ CSC. Overexpression of NR2F2 in papillomas caused the expansion of CD34 expressing tumor cells and CD34 level of expression in tumor cells (Fig. 3a, b). Conversely, conditional deletion of NR2F2 in malignant SCC drastically reduced the expression of CD34 in tumor cells (Fig. 3c, d). Because CD34+ CSC present increased tumor propagating cells frequency and long-term self-renewal capacities upon serial transplantation into immunodeficient mice, functional properties referred as tumor stemness10,11, we tested whether NR2F2 deletion in malignant SCC impacts mouse and human tumor propagating capacity. To evaluate the role of NR2F2 in mouse tumor stemness, we isolated tumor cells from chemically induced primary SCC from K5CreER/NR2F2flox or K14CreER/NR2F2flox mice and transplanted 104 cells subcutaneously into NOD/SCID immunodeficient mice, a number of cells that gives rise to secondary tumors in almost 100% of cases10. Two days after transplantation, we administered tamoxifen to the recipient mice to induce NR2F2 deletion, and examined the impact on the frequency of secondary tumor formation (Fig. 3e). Tamoxifen treatment of mice carrying NR2F2 floxed alleles and inducible CreER completely abrogated the ability of tumor cells to form secondary tumors, while tumor propagating capacity was unaffected in control mice, demonstrating the essential role of NR2F2 in controlling tumor propagation of malignant mouse SCC.
Figure 3. NR2F2 promotes tumor stemness in mouse and human SCC.
a: immunostaining for K14 (tumor cells), and CD34 (CSC marker) in control and NR2F2 gain of function papillomas showing that NR2F2 overexpression in papillomas induces CD34 expression. Representative images of at least 5 independent biological replicates each for Ctrl and NR2F2 OE. b: qRT-PCR for CD34 in tumor cells from control and NR2F2 OE papillomas. The mRNA expression is normalized to non-induced controls. (n=7 Ctrl and NR2F2 OE tumors) c: immunostaining for K14 (tumor cells), NR2F2, CD34 (CSC marker) in control and NR2F2 KO SCC, showing that NR2F2 deletion in carcinomas decreases CD34 expression. Representative images of at least 5 independent biological replicates each for Ctrl and NR2F2 KO. d: qRT-PCR for CD34 in tumor cells from control and NR2F2 KO SCC. The mRNA expression is normalized to controls. (n=8 Ctrl and 10 NR2F2 KO tumors).
e: Scheme of the experimental strategy and the proportion of secondary tumors following the transplantation of 104 WT and NR2F2 KO mouse tumor cells, expressed as fraction of growing secondary tumors/total of grafted points (n=3 primary tumors per genotype used for the FACS isolation of tumor cells for grafting; n=6-23 tumor grafts per condition as specified in the table). f: Tumor propagating cell (TPC) frequency calculated using the extreme limiting dilution analysis (ELDA) for A431 (skin SCC), SK-MES1 (lung SCC) and Kyse-70 (esophagus SCC) WT and NR2F2 KO human SCC cell lines. The graph shows the TPC calculated based on the ELDA exact value using n=3-5 mice per cell line and condition and 2 grafts per mouse. p-value is calculated using chi-square test. g: Proportion of secondary tumor formation and tumor propagating cell frequency calculated by using the extreme limiting dilution analysis (ELDA) for A431, SK-MES-1 and Kyse-70 parental SCC cell lines and NR2F2 KO rescue clones carrying the NR2F2-3HA transgene (NR2F2 OE). p-value is calculated using chi-square test. The graph shows the TPC calculated based on the ELDA exact value using n=3-5 mice per cell line and condition and 2 grafts per mouse. h: WB for NR2F2, HA tag and actin in parental A431 cells, NR2F2 KO or NR2F2 rescue by OE. i: WB for NR2F2, HA tag and actin in parental SK-MES1 cells, NR2F2 KO or NR2F2 rescue by OE. j: WB for NR2F2, HA tag and actin in parental Kyse-70 cells, NR2F2 KO or NR2F2 rescue by OE. Scale bar in a and c=50μm. Data in b and d are represented as mean ± SEM. The p-values in b and d are calculated using the one-tailed t-test. WB are representative of two independent experiments with similar results in h, and three independent experiments with similar results in i and j.
To assess whether NR2F2 is also essential for tumor stemness in human cancers, we used the CRISPR-Cas9 system to induce NR2F2 deletion in human SCC cell lines of various origins including skin (A431), lung (SK-MES-1) and esophagus (Kyse-70) SCC, and assessed their tumor propagating capacity upon grafting of limiting dilution of tumor cells into immunodeficient mice. The validation of KO clones was assessed by PCR, sequencing and western-blot (Fig. 3h-j). The tumor propagating capacity of human SCC cells was strongly reduced (A431) or completely abolished (SK-MES-1 and Kyse-70) upon NR2F2 KO (Fig. 3f and Extended Data Fig. 3a). HA tagged NR2F2 re-expression using lentiviral transduction of SK-MES-1, A431 and Kyse-70 NR2F2 KO clones rescued tumor propagating capacity to the same levels as the parental cell lines (Fig. 3g-j and Extended Data Fig. 3b).
Overall, these data demonstrate that NR2F2 is essential for tumor propagation/stemness in mouse and human SCC from different origins.
NR2F2 is essential for the maintenance of malignant SCCs
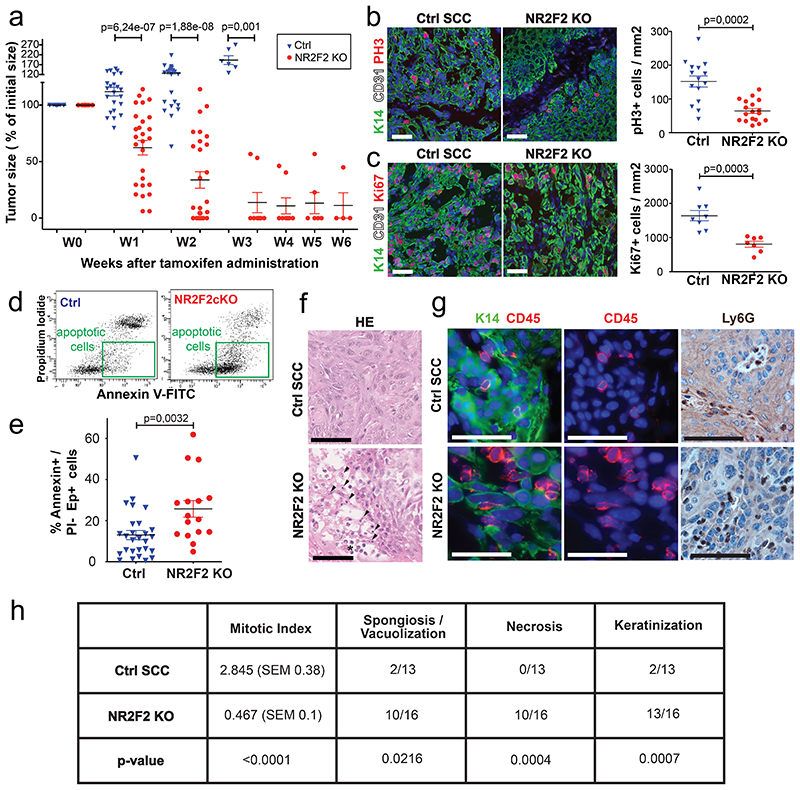
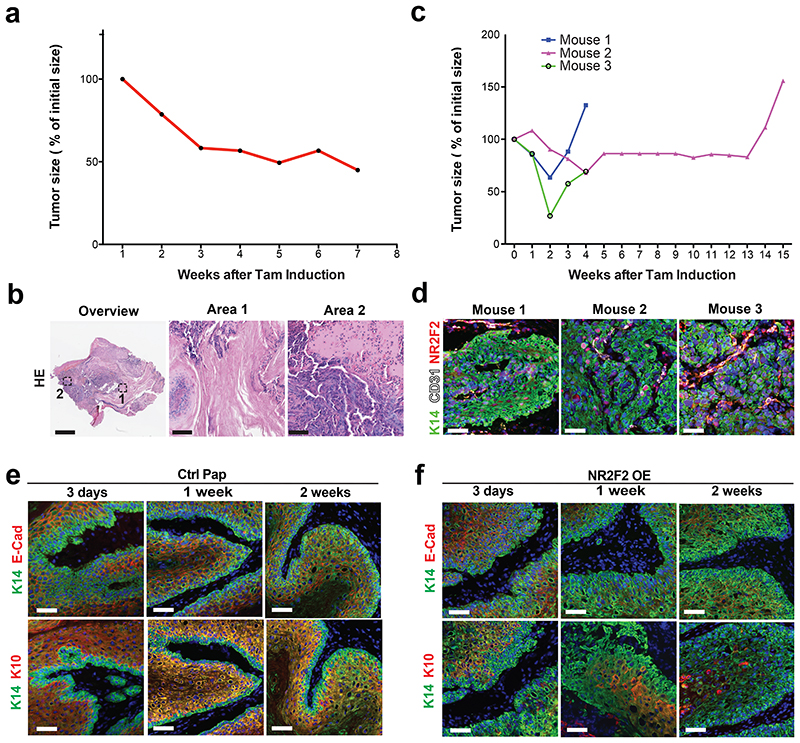
To define the role of NR2F2 in the maintenance of malignant tumor state, we assessed the impact of NR2F2 acute deletion in pre-existing mouse skin SCC. For this purpose, we generated K5CreER/NR2F2flox (NR2F2 inducible KO) mice and treated them with DMBA/TPA to induce SCC formation. Once macroscopic malignant tumors appeared, we administered tamoxifen to induce acute NR2F2 deletion in skin SCC. Tamoxifen administration in mice that did not express the CreER had no effect on tumor growth. However, upon NR2F2 deletion in K5CreER/NR2F2flox mice, tumors rapidly shrunk, disappearing completely and permanently (Fig. 4a). The rare tumors that did not completely disappear were formed almost exclusively of keratinized or fibrotic tissue, with no residual tumor cells (Extended Data Fig. 4a, b). In the few cases where tumors relapsed after tamoxifen induction, NR2F2 was expressed in tumor cells (Extended Data Fig. 4c, d), showing that tumor relapse was mediated by the tumor cells that escaped NR2F2 deletion.
Figure 4. NR2F2 is essential for the maintenance of malignant SCCs.
a: Percentage of initial tumor size over time following tamoxifen induced NR2F2 deletion (n=21 Ctrl and 28 NR2F2 KO tumors).
b: Immunostaining (left) for pH3 (mitotic cells) and K14 (Tumor cells) and quantification (right) of pH3+ cells/mm2 (n=15 Ctrl and 18 NR2F2 KO tumors).
c: Immunostaining (left) for Ki67 (proliferating cells) and K14 (Tumor cells) and quantification (right) of Ki67+ cells/mm2 (n=8 Ctrl and 7 NR2F2 KO tumors).
d: FACS plot of tumor cells stained with AnnexinV and PI. e: Quantification of AnnexinV+/PI- Epcam+ cells (early cell death) in Ctrl and NR2F2 KO tumors (n=27 Ctrl and 16 NR2F2 KO tumors). f: HE of Ctrl and NR2F2 KO SCC. NR2F2 KO tumors display necrotic areas with picnotic nuclei (arrowheads) and polymorphonuclear cells recruitment (asterisk).
g: Immunostaining for CD45 (immune cells) and K14 (tumor cells) and IHC for Ly6G (neutrophils) showing immune cell infiltration of the tumor following NR2F2 deletion. Representative images of at least 5 independent biological replicates per condition.
h: Summary table of the histopathological analysis of Ctrl and NR2F2 KO tumors, considering mitotic index (per high-power field), necrosis, spongiosis/vacuolisation and keratinization. (n=13 Ctrl and 16 NR2F2 KO tumors).
Scale bar = 50μm. Data in a, b, c, e are represented as mean ± SEM. The p-values are calculated using a two-tailed Mann-Whitney test. For the table h, we used a two-tailed Mann-Whitney test for the mitotic index, two-tailed Fisher’s exact test in all other cases.
To determine the cellular mechanisms by which NR2F2 controls the maintenance of malignant tumor states, we assessed cell proliferation, cell death and tumor histology 5 days after tamoxifen administration in mice presenting SCC. Upon NR2F2 deletion, proliferation of tumor cells was decreased as shown by the reduction of phospho-histone H3 (PH3) and Ki67 positive cells (Fig. 4b, c). In addition, NR2F2 deletion in malignant SCC promoted cell death as shown by the increase of Annexin V positive/Propidium Iodide negative cells after tamoxifen administration (Fig. 4d, e). Histological analysis of these tumors revealed the presence of necrotic areas and immune cell infiltration mostly composed of neutrophils (Fig. 4f, g). A detailed histopathological analysis confirmed the presence of extensive cell vacuolization, necrosis, keratinization and reduction of the mitotic index in NR2F2 KO tumors (Fig. 4h).
Altogether, these data reveal that NR2F2 controls tumor maintenance by promoting tumor cells proliferation, restricting tumor cell death and immune cell infiltration.
NR2F2 deletion promotes tumor differentiation
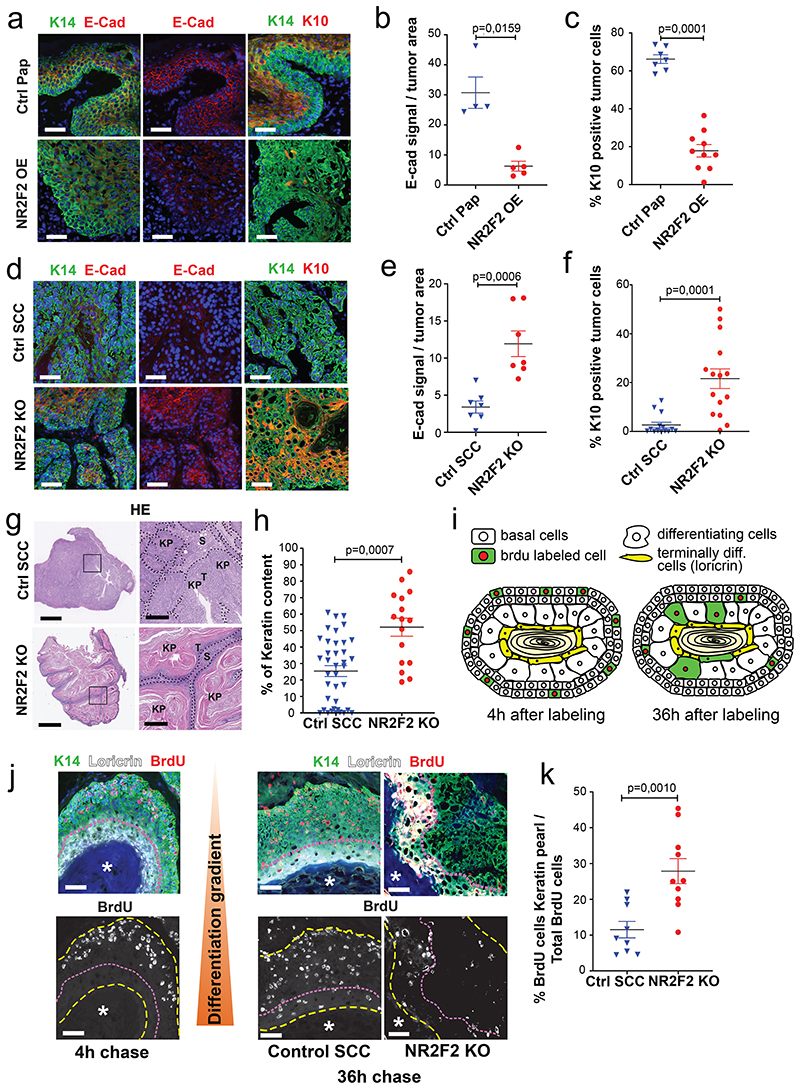
The progression of benign papillomas to malignant carcinomas is associated with a block of differentiation and the disappearance of differentiation markers such as K1/K10. As NR2F2 deletion blocks malignant transition (Fig. 1e-j), while its ectopic expression in benign papillomas promotes malignant features (Fig. 2b-g), we assessed whether NR2F2 controls tumor differentiation. To this end, we examined the impact of NR2F2 overexpression on the differentiation of skin papillomas. NR2F2 overexpression in papillomas induced a reduction of E-Cadherin and K10 expression (Fig. 5a-c and Extended Data Fig. 4e, f), indicating that NR2F2 blocks the differentiation of benign tumor cells. We then determined whether NR2F2 prevents tumor differentiation in malignant SCC. Already 5 days after NR2F2 deletion in malignant SCCs, NR2F2 KO tumors presented a strong increase in E-Cadherin and K10 expression (Fig. 5d-f). The increase of tumor differentiation was also apparent by the extended presence of keratinized areas in the center of the tumors 5 days after NR2F2 deletion (Fig. 5g, h). These data show that NR2F2 restricts tumor differentiation in malignant SCC.
Figure 5. NR2F2 deletion promotes CSC differentiation.
a, b, c: Evaluation of the impact of NR2F2 ectopic expression on papilloma differentiation. a: Immunostaining for K14 (tumor cells), E-Cad and K10 in Ctrl and NR2F2 overexpression (OE) in papilloma. Representative images of minimum 4 independent biological replicates each for Ctrl and NR2F2 OE. b: Quantification of E-Cad signal in Ctrl and NR2F2 overexpression papillomas (n=4 Ctrl and 5 NR2F2 OE Papillomas). c: Quantification of K10 expression in Ctrl and NR2F2 overexpression papillomas (n=7 Ctrl and 10 NR2F2 OE Papillomas).
d, e, f: Consequences of NR2F2 deletion on carcinoma differentiation. d: Immunostaining for K14 (tumor cells), E-Cad and K10 in Ctrl and NR2F2 KO SCC. Representative images of minimum 7 independent biological replicates. e: Quantification of E-Cad signal in Ctrl and NR2F2 KO carcinomas (n=7 Ctrl and 7 NR2F2 KO SCC). f: Quantification of K10 expression in Ctrl and NR2F2 KO carcinomas (n=14 Ctrl and 15 NR2F2 KO SCC).
g: HE showing the extensive keratinization of NR2F2 KO tumors compared to controls. KP=Keratin Pearl. T=Tumor cells. S=Stroma. Representative images of minimum 16 independent biological replicates each for NR2F2 KO and Ctrl tumors. h: quantification of keratinized areas within tumors (n=38 Ctrl and 16 NR2F2 KO areas).
i: Scheme of BrdU pulse chase experiment following NR2F2 deletion. j: Representative images of immunostainings for BrdU labelled cells, K14 (tumor cells) and Loricrin (terminally differentiated area) after 4h (left panels) and 36h (right) of chase in Control and NR2F2 KO tumors. Asterisk = terminally differentiated area. k: Quantification of BrdU+ tumor cells within the terminally differentiated area (n=9 Ctrl and 10 NR2F2 KO tumors).
Scale bar = 50μm; Panel g: 1mm in the left panels, 250μm in the right panels. Data in b, c, e, f, h and k are represented as mean ± SEM. The p-values are calculated using a two-tailed Mann-Whitney test.
To substantiate the notion that NR2F2 restricts tumor differentiation, we performed short-term lineage tracing using BrdU pulse/chase experiments to trace the fate of proliferating tumor cells in this model. A pulse of BrdU administration labeled proliferative cells, and was followed by a chase of 36 hours, allowing the differentiating tumor cells to move towards the differentiated keratin pearls (Loricrin positive, Fig. 5i). NR2F2 KO tumors displayed a significant increase in the proportion of BrdU/Loricrin double positive differentiated tumor cells (Fig. 5j, k), showing that NR2F2 deletion dramatically accelerated tumor differentiation.
NR2F2 target genes regulate distinct tumor functions
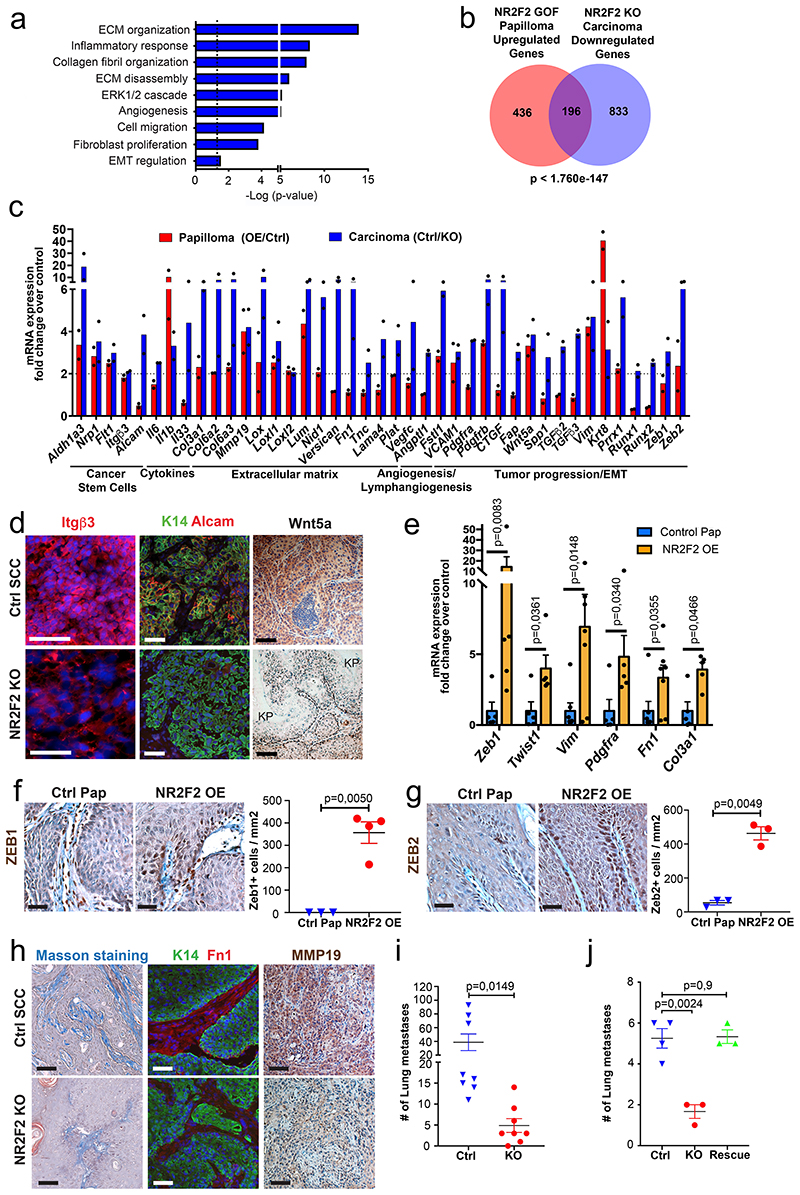
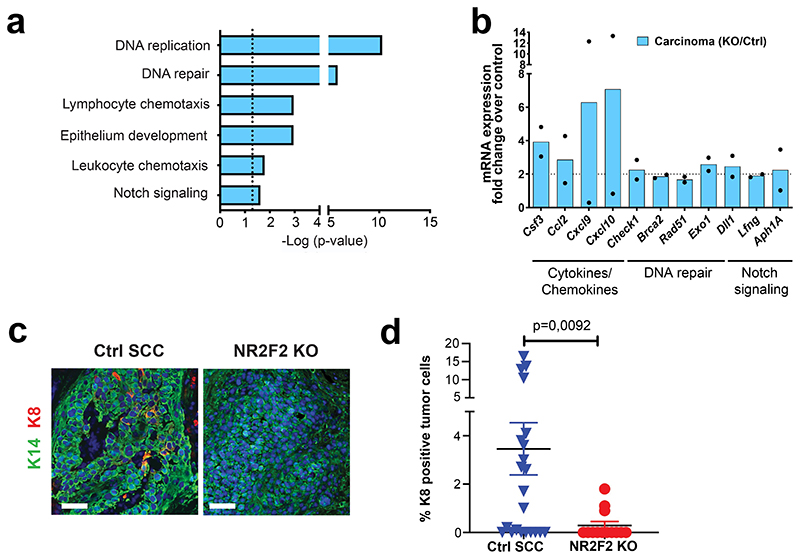
To gain further insights into the molecular mechanism by which NR2F2 regulates tumor maintenance in SCC, we performed transcriptional profiling of FACS isolated tumor cells 7 days after NR2F2 overexpression in benign papillomas, when the phenotypic changes become fully penetrant, and 5 days after NR2F2 deletion in malignant SCC, when NR2F2 protein is completely lost (Fig. 2c, d). Unbiased gene ontology analysis of the genes downregulated following NR2F2 deletion in malignant mouse skin tumors and upregulated in benign papillomas upon NR2F2 overexpression showed that these genes are enriched for factors involved in ECM remodeling, collagen fibers organization, cell migration, EMT and angiogenesis (Fig. 6a). The genes upregulated following NR2F2 deletion in malignant tumors showed significant enrichment for genes controlling DNA replication and repair, differentiation and immune cell chemotaxis (Extended Data Fig. 5a, b). The common genes that were downregulated upon NR2F2 deletion in malignant tumor cells and upregulated upon NR2F2 overexpression in benign papillomas included many ECM components and ECM remodeling factors (e.g. Mmp19, Nid1, Loxl1/2), adhesion molecules (e.g. Itgß3 and Vcam1), coagulation factors and cytokines (e.g. Plat1, Il1b and Il6), EMT markers (e.g. Pdfrb, Vimentin, Krt8, Zeb1/2 and Prrx1), signaling molecules (e.g. Wnt5a, Fstl1) and CSC markers (e.g. Aldh1a3, Nrp1, Flt1)9,36,37 (Fig. 6b, c). In addition to the common molecular signature between papillomas and SCCs, other genes were regulated only in SCCs, including EMT associated factors (e.g. TGF-ß2/3, Runx1/2), ECM factors (e.g. Mmp2, Fn1), secreted factors involved in the regulation of lymphangiogenesis, angiogenesis, and tumor progression (e.g. Vegfc, Angptl1, Spp1) and surface molecules expressed during tumor progression (e.g. Alcam) (Fig. 6c).
Figure 6. NR2F2 target genes regulate distinct tumor functions.
a: Gene ontology analysis of the genes that are downregulated in NR2F2 KO carcinomas and upregulated in NR2F2 GOF papillomas, showing categories that are significantly enriched (dotted line p=0,05). The p-value is calculated according to the Benjamini-Hochberg method for multiple hypothesis testing.
b: Venn diagram showing the overlap between the genes upregulated in NR2F2 overexpression papillomas and downregulated in NR2F2 KO carcinomas. (Fold change>2 overexpression/control in papillomas; control/KO in carcinomas; p-value is calculated using Two-sided hypergeometric test). c: Bar graph representation of selected genes that are upregulated in NR2F2 OE papillomas and downregulated in NR2F2 KO tumors, grouped by their respective function (Fold change overexpression/control in papillomas; control/KO in carcinomas; n=2 Ctrl and NR2F2 OE papillomas; n=2 Ctrl and NR2F2 KO carcinomas, independent biological replicates).
d: Immunostaining validation of selected genes from the microarray analysis in SCC following NR2F2 deletion. Immunostaining for Itgū3, K14 (Tumor cells) and Alcam and IHC for Wnt5a in WT and NR2F2 KO tumors (KP=keratin pearl). Representative images of minimum 5 independent biological replicates each per condition.
e: qRT-PCR for selected EMT markers in tumor cells from NR2F2 OE papillomas. The mRNA expression is normalized to non-induced controls. (n=5 Ctrl and NR2F2 OE papillomas).
f, g: Upregulation of Zeb1 and Zeb2 in NR2F2 OE papillomas. f: Immunohistochemistry of Zeb1 and quantification of expression in Ctrl and NR2F2 OE (n=3 and 4 papillomas respectively). g: Immunohistochemistry of Zeb2 and quantification of expression in Ctrl and NR2F2 OE (n=3 and 4 papillomas respectively).
h: Staining for collagen fibers (Masson staining), immunofluorescence for K14 (tumor cells) and Fibronectin1 and immunohistochemistry for MMP19 in Ctrl and NR2F2 KO SCC. Representative images of minimum 5 independent biological replicates each per condition.
i: Quantification of the number of lung metastasis one month after intravenous injection of 5*10^4 K5CreER NR2F2flox cells and subsequent administration of tamoxifen (KO) or no treatment (Ctrl). N=3 matched replicates of KO/Ctrl with cells isolated from 3 primary tumors independently.
j: Quantification of the number of lung metastasis one month after intravenous injection of SK-MES-1 cells (Ctrl), NR2F2 KO cells (KO) and the respective NR2F2 rescue cell line (Rescue). N=4 independent experiments for SK-MES-1, 3 for NR2F2 KO and Rescue.
Scale bar = 50μm. Data in e, f, g, i, and j are represented as mean ± SEM. The p-values are calculated using a two-tailed Welch’s t-test for e, f and g, two-way Anova for i and unpaired t-test for j.
To validate our transcriptional analysis, we assessed the expression of differentially regulated genes at the protein level following NR2F2 deletion in skin SCC. Integrinβ3/CD61, that has been implicated as CSC marker in breast cancer and identified as one of the markers expressed during EMT transition states in skin SCC38,39; the adhesion molecule Alcam, which has been proposed as a marker of tumor progression and CSC40,41; and the non-canonical Wnt ligand Wnt5a that promotes tumor aggressiveness42 were all strongly decreased following NR2F2 deletion in SCC (Fig. 6d).
NR2F2 overexpression in papillomas led to the upregulation of several EMT genes such as Zeb1/2, Twist1, Vim, Fn1, and Col3a1 (Fig. 6e-g) and the expression of K8, a marker of carcinoma progression43 (Fig. 2c-f). Conversely, NR2F2 deletion in carcinomas decreased the expression of K8 (Extended Data Fig. 5c, d). These data suggest that NR2F2 acts upstream of canonical EMT TFs to promote tumor invasion. During cancer progression, tumor cells need to remodel the ECM allowing tumor invasion. In accordance with our transcriptional profiling, NR2F2 deletion in SCC decreased collagen fiber deposition, as shown by Masson’s staining (Fig. 6h). The expression of Fibronectin-1 and MMP19, which promotes ECM degradation, were both substantially decreased after NR2F2 deletion (Fig. 6h). Overall, these data show NR2F2 acts upstream of key EMT regulators and promotes tumor progression by regulating ECM remodeling. To assess the functional relevance of these findings, we assessed whether NR2F2 deletion decreased metastasis. To this end, we performed tail vein injection of mouse and human tumor cells after NR2F2 deletion. Strikingly, NR2F2 deletion dramatically decreased lung metastasis in both mouse and human SCCs (Fig. 6i, j).
Altogether, our molecular profiling and in situ characterization following NR2F2 gain- and loss-of-function show that NR2F2 controls a transcriptional program that regulates different tumor functions including tumor stemness, EMT, and ECM remodeling, promoting malignant tumor state and metastasis.
NR2F2 functions in human SCCs
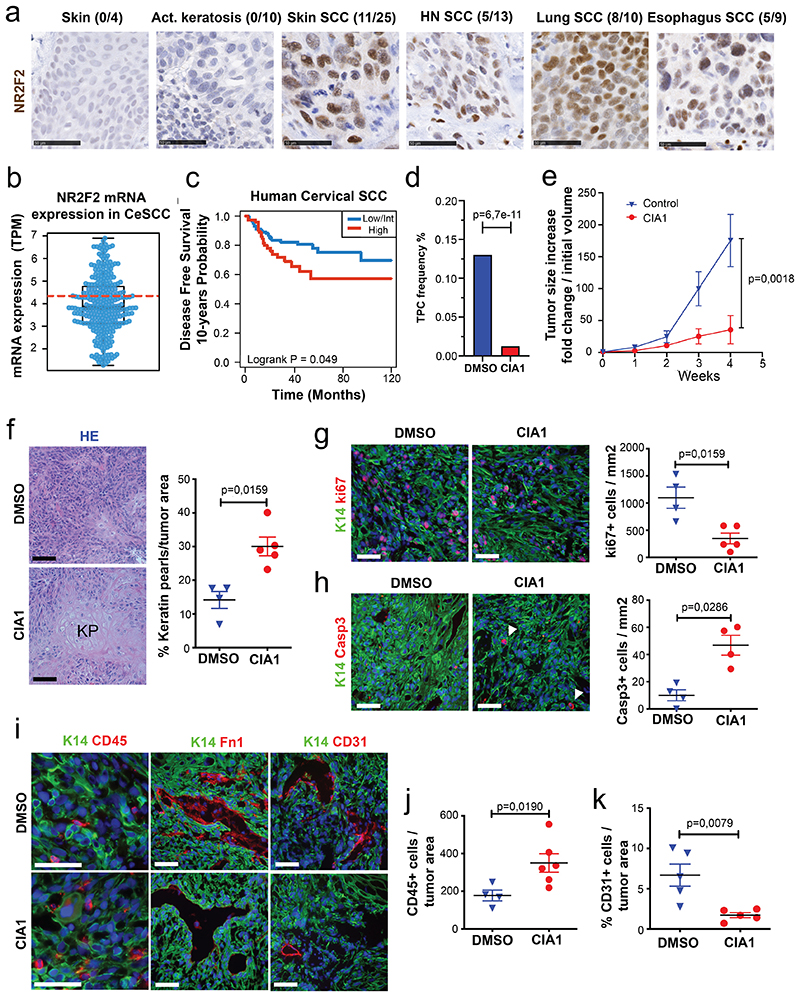
To assess the human relevance of our findings, we assessed NR2F2 expression in human SCC (hSCC) from different anatomical locations. Similar to what we found in mouse SCC, NR2F2 was not expressed in normal human skin and pre-malignant lesions such as actinic keratosis, and was expressed in a heterogeneous manner in skin, head and neck, lung and oesophagus SCC (Fig. 7a).
Figure 7. Targeting NR2F2 function in human SCCs.
a: IHC for NR2F2 in human skin, benign lesions (actinic keratosis) and various SCC types. Above each panel the fraction of positive samples is indicated. Scale bar= 50μm. Representative images from independent replicates as indicated above each panel (n= 4 skin, 10 act.keratosis, 25 skin SCC, 13 HN SCC, 10 lung SCC and 9 esophagus SCC).
b: Box plot of NR2F2 mRNA expression measured in Transcript Per Million in biopsies of human Cervical SCC. Boundaries of the box indicate the first and third quartiles of the NR2F2 mRNA expression value. The bold black horizontal line indicates the median and the two external horizontal black lines shows the minimum and maximum values. The bold dotted red line represents the top-tertile. The dots represent all data points. N=304 biologically independent samples.
c: Disease-free survival (DFS) of patients with Cervical SCC stratified by the level of NR2F2 expression (Top-tertile cut-point) (p=Log-Rank-Mantel-Cox test). N=304 biologically independent samples described in panel b.
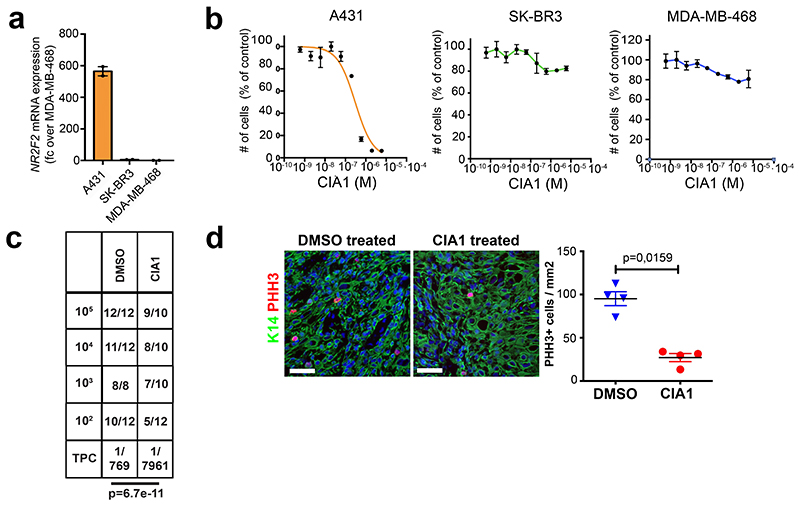
d, e: Targeting NR2F2 with small molecule inhibitor in human SCC. d: Tumor propagating cell frequency calculated by using the extreme limiting dilution analysis (ELDA) of human skin A431 cells following CIA1 treatment. p-value is calculated using chi-square test. The graph shows the TPC calculated based on the ELDA exact value using per condition n=4-6 mice for the DMSO treatment and n=5-6 mice for the CIA1 treatment and 2 grafts per mouse. e: Increase in grafted A431 tumor volume compared to initial volume at the beginning of CIA1 treatment. p-value is calculated using mixed effect Anova (n=7 tumors for DMSO control, 10 for CIA1 treatment).
f-k: Histology of CIA1 treated xenograft tumors. f: HE of control and CIA1 treated tumors displaying increased presence of keratin pearls (KP) and quantification of KP per tumor area (n=4 DMSO control and 5 CIA1 treated tumors). g: Immunostaining (left) for Ki67 (proliferating cells) and K14 (Tumor cells) and quantification (right) of Ki67+ cells/mm2 (n=4 Ctrl and 5 CIA1 treated tumors). h: Immunostaining (left) for cleaved Caspase 3 (apoptotic cells, arrowheads) and K14 (Tumor cells) and quantification (right) of Casp3+ cells/mm2 (n=4 Ctrl and 5 CIA1 treated tumors). i: Immunostaining of control and CIA1 treated tumors for K14 (tumor cells) and CD45 (immune cells), Fibronectin-1 and CD31 (endothelial cells). j: quantification of CD45+ cells/tumor area (n=4 Ctrl and 6 CIA1 treated tumors). k: quantification of the percentage of CD31+ cells/tumor area (n=5 Ctrl and 5 CIA1 treated tumors). All images are representative of minimum 4 independent biological replicates each per condition.
Scale bar = 50μm. Data are represented as mean ± SEM. The p-value is calculated using a two-tailed Mann-Whitney test.
To determine whether the level of NR2F2 expression was associated with clinical outcome in human cancers, we analysed the correlation between NR2F2 expression and disease-free survival in human SCC. In cervix SCC, NR2F2 expression was very heterogeneous across the different patients, and the level of NR2F2 expression correlated with poor disease-free survival (Fig. 7b, c). To further assess the clinical relevance of our findings, we evaluated the effect of the administration of a small molecule inhibitor targeting NR2F2 on A431, a human skin SCC cell line, in vitro and in vivo. Very recently, a small molecule inhibitor targeting NR2F2 and their effect in inhibiting the growth of prostate cancer cell lines was described44. Similarly to what has been reported in that study44, CIA1 inhibited the growth of human A431 human skin SCC cells in vitro whereas it did not inhibit the growth of other human cancer cell lines that do not express NR2F2 (Extended Data Fig. 6a, b). In addition, CIA1 treatment inhibited the tumor propagating capacity of human A431 (Fig. 7d and Extended Data Fig. 6c), as well as the growth of established human A431 tumors grafted into immunodeficient mice (Fig. 7e). Histological analysis of the treated tumors showed that administration of the NR2F2 antagonist inhibited tumor cell proliferation, ECM deposition and tumor neo-angiogenesis, and promoted tumor cell death, tumor differentiation, and immune cell infiltration, mimicking the functional consequences of NR2F2 deletion in mouse skin SCC (Fig. 7f-k and Extended Data Fig. 6d). These data provide the proof of principle demonstrating that targeting NR2F2 efficiently inhibits the growth of human SCCs.
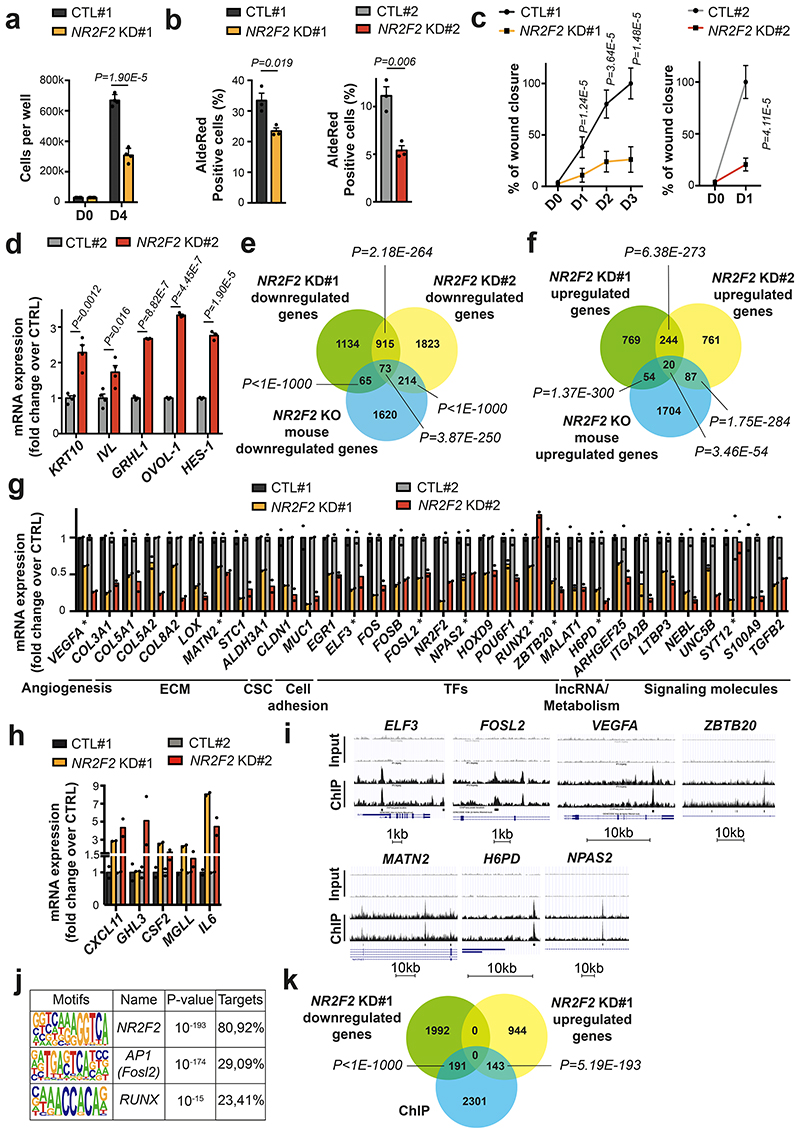
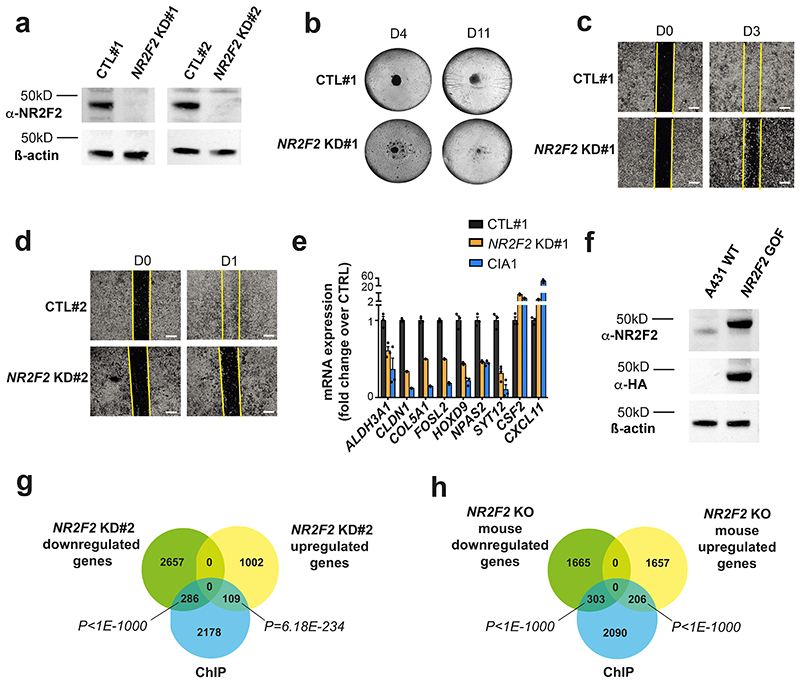
To assess whether NR2F2 controls similar functions across different human tumors, we generated two independent doxycycline inducible shRNA lines against NR2F2 in A431 human SCC cells (NR2F2 KD#1 and #2 - Extended Data Fig. 7a), allowing to perform an acute knockdown (KD) of NR2F2 in tumor cells similarly as in mouse experiments. Acute shRNA KD of NR2F2 decreased the proliferation of A431 cells as well as their ability to grow as a tumor sphere, consistent with the importance of NR2F2 in regulating proliferation and stemness (Fig. 8a and Extended Data Fig. 7b). Assays measuring ALDH activity such as AldeRed or AldeFluor, have been widely used to characterize CSC-like cells in different tumor models45,46. NR2F2 shRNA KD decreased the proportion of AldeRed positive cells in both NR2F2 KD cell lines, supporting the notion that NR2F2 controls tumor stemness in mouse and human SCCs (Fig. 8b). NR2F2 shRNA KD decreased cell migration in wound scratch assays in cells in both NR2F2 KD A431 cell lines (Fig. 8c and Extended Data Fig. 7c, d). Finally, we tested whether NR2F2 loss-of-function promotes tumor differentiation in A431 cell line. To this end, we cultured these cells in high calcium, which stimulates the differentiation of squamous epithelial cells47,48, and induced NR2F2 shRNA KD by administrating doxycycline. NR2F2 shRNA KD stimulated squamous differentiation as shown by the important upregulation of terminal differentiation markers such as KRT10 and IVL, as well as TFs mediating squamous differentiation such as HES1, OVOL1 and GRHL1 (Fig. 8d). Altogether these data show that acute NR2F2 shRNA KD in human SCC cell lines recapitulates all the key features of the phenotype found upon NR2F2 deletion in mouse SCC including decrease in proliferation, stemness, migration, and increase in differentiation.
Figure 8. Conservation of NR2F2 function in human SCCs.
a: Quantification of cell number in A431 control and NR2F2 shRNA KD#1 (n=4 biological replicates).
b: ALDH activity in A431 control and NR2F2 shRNA KD #1 and #2 cell lines. (n=3 biological replicates).
c: Wound healing assay in A431 control and NR2F2 shRNA KD #1 and #2 cell lines (n=3 biological replicates, 3-4 pictures per well).
d: mRNA (qPCR) expression of differentiation genes in calcium switch induced A431 cells control and NR2F2 shRNA KD (n=4 for KRT10 and IVL, n=3 for GRHL1, OVOL-1, HES-1).
e, f: Venn diagram of the genes downregulated (e) and upregulated (f) upon NR2F2 KD in human SCC cell lines (A431 control and NR2F2 shRNA KD #1 and #2 cell lines) and in NR2F2 KO mouse SCC. (p-values are calculated using Two-sided hypergeometric test).
g, h: mRNA expression (RNA-seq) of downregulated (g) and upregulated (h) genes following NR2F2 KD in human SCC cell lines. ECM, extracellular matrix; CSC, cancer stem cells; TF, transcription factor; IncRNA, long-noncoding RNA. ChIP-identified NR2F2 direct targets were highlighted using (*) label (n=2 biological replicates).
i: A431 NR2F2 ChIP-seq profiles at selected gene loci, including Input on top. j: Transcription factor motifs enriched in the ChIP-seq for NR2F2 peaks that were enriched in A431 cells overexpressing NR2F2 compared to input as determined by Homer analysis using known motif search.
k: Overlap of the A431 NR2F2 ChIP-seq peaks with the downregulated and upregulated genes in the NR2F2-knockdown #1 human cell line (p-values are calculated using Two-sided hypergeometric test).
Data in a, b, c, d, g, h are represented as mean ± SEM. The p-values are calculated using the Mann-Whitney test in c, two-tailed t-test in the other cases.
To assess the transcriptional program controlled by NR2F2 in human skin SCC tumors, we performed RNA-seq of WT and NR2F2 shRNA KD#1 and #2 cells 72h following doxycycline addition, which allows the complete disappearance of NR2F2 at the protein level (Extended Data Fig. 7a). We analyzed the genes expressed at more than 5 reads per million that were up-and downregulated by more than 1.5 fold in biological duplicates. NR2F2 KD induced the downregulation of a similar transcriptional program between the two NR2F2 KD cell lines (45% overlap among the downregulated genes, and 24% overlap among the upregulated genes). The slight difference in the strength of the phenotype and gene expression observed between the two different SCC cell lines is likely to come from the distinct puromycin selection history that these two cell lines had experienced and the basal level and the fold change of NR2F2 downregulation following shRNA KD (higher in cell line KD#1).
A lower but nevertheless highly significant fraction of these downregulated and upregulated genes were commonly deregulated in mouse SCCs following acute NR2F2 deletion, with a greater overlap between mouse skin SCC and NR2F2 KD cell line #2 (12% of the downregulated mouse genes) than between mouse skin SCC and NR2F2 KD cell line #1 (7% of the downregulated mouse genes) (Fig. 8e, f). The common deregulated genes between mouse SCC and human skin SCC comprised many ECM molecules (COL3A1, COL5A1, COL5A2, COL8A2, LOX, MATN2), stemness markers (ALDH3A1), adhesion molecules (CLDN1, MUC1), TFs (ELF3, FOSL2, NR2F2, NPAS2, HOXD9, POU6F1), lncRNA (MALAT1), regulators of metabolism (H6PD), signaling molecules (TGFß2, S100A9, ARHGEF25, NEBL) promoting tumor progression, migration and invasion (Fig. 8g). Similarly, the upregulated genes between mouse and human SCC comprised genes involve the recruitment of immune/inflammatory cells (CXCL11), and squamous differentiation (GRHL3) (Fig. 8h). Altogether, these data demonstrate that NR2F2 controls a common and tumor-specific transcriptional program, which is conserved between mouse and human skin SCCs.
To identify the direct versus indirect NR2F2 target genes, we performed NR2F2 ChIP-seq in vitro in duplicate biological samples with NR2F2 gain-of-function (GOF) A431 cells bearing an N-ter 3HA tag (Extended Data Fig. 7f). This ChIP-seq uncovered about 2635 NR2F2 binding sites found in duplicate samples (Fig. 8i). Motif discovery analysis retrieved NR2F2 canonical binding sites (AAAGGTCA) as the most highly significant enriched TF motifs present in more than 80% of the peaks (pvalue=10-193) (Fig. 8j). In addition, the enhancers bound by NR2F2 presented enrichment for AP1 and RUNX TF motifs, which are TFs factors that are well known to regulate skin cancer development and cancer49,50, suggesting that NR2F2 regulates gene expression together with AP1 and RUNX (Fig. 8j). About 10% of the genes downregulated and upregulated following acute KD of NR2F2 in the A431 human skin SCC cell line NR2F2 KD#1 but also in the KD#2 were directly overlapping with the ChIP-seq identified peaks, demonstrating that NR2F2 is directly regulating a significant fraction of the transcriptional targets identified upon loss of function (Fig. 8k and Extended Data Fig. 7g, h). Interestingly, NR2F2 directly regulated the expression of key TFs that promote tumorigenesis in different cancers including FOSL2, a member of AP1, NPAS2, ZBTB20 (in all experimental conditions), RUNX2 and ELF3 (Fig. 8g, i). In addition, NR2F2 directly regulated the expression of genes regulating key tumor functions including metabolism (H6GP), ECM (MATN2), or angiogenesis (VEGFA) (Fig. 8g, i).
Discussion
In this study, we identified NR2F2 as an essential regulator of malignant tumor state through the promotion of tumor self-renewal, invasion, and the restriction of tumor differentiation.
In contrast with other TFs regulating skin tumor stemness such as Sox2, Twist1 and Pitx1, which are important for the maintenance of benign and malignant squamous skin tumors, NR2F2 is only expressed by and controls malignant tumor cells13–16. Whereas NR2F2 knockdown has been shown to decrease cancer cell lines proliferation in vitro 23,30,51,52, no study has assessed the impact of NR2F2 acute deletion in established tumors in vivo, mimicking the impact that the administration of NR2F2 inhibitors might have in a therapeutic setting. Our results revealed that acute inhibition of NR2F2 leads to complete regression of established SCC. These results demonstrate the essential role of NR2F2 in sustaining malignant tumor state maintenance.
The disappearance of the SCCs following NR2F2 deletion is accompanied by histological signs of tumor differentiation, necrosis and immune infiltration. Our molecular profiling following NR2F2 gain- and loss-of-function uncovered the gene signature controlled by NR2F2, that regulates essential tumor functions including EMT, ECM remodeling, immune cells infiltration and tumor differentiation.
NR2F2 regulates the expression of several components of the ECM associated with malignant tumor states, such as Fibronectin 1 (Fn1), Nidogen 1 (Nid1), several collagens and lysyl oxidases responsible for collagen fibers crosslinking, which are contributing to tumor invasion, EMT and metastasis53–56. Our in vivo study shows as well that NR2F2 acts upstream of Zeb1/2 and Prrx1, all key TFs that promote EMT and metastasis 57–59.
Tumor regression following acute NR2F2 deletion is associated with increased differentiation and the expression of K1/K10 in non-proliferative terminally differentiated tumor cells, mirroring the differentiation pattern observed in normal skin and benign papillomas. Importantly, our experiments in human SCC cells using a NR2F2 inhibitor or inducible shRNA confirmed that a similar function is conserved in human tumors. In particular, we showed that NR2F2 directly regulates a transcriptional program regulating tumor progression and microenvironment remodeling as well as repressing tumor differentiation. Drug-induced tumor differentiation has been shown to be a very efficient treatment with little side effects for some types of leukemia60. Retinoic Acid, which induces the differentiation of leukemic cells into terminally differentiated granulocytes without much side effects, is now a first line therapy in combination with Arsenic trioxide, leading very frequently to complete remission of this previously incurable disease60,61. Whereas this demonstrated that inducing tumor differentiation could be a safe and very efficient way to treat cancer, very few other examples have been provided in the last decades, in particular in solid tumors. Only recently, thanks to a better understanding of the mechanisms promoting tumor stemness, the proof of principle that pharmacological induction of tumor differentiation can be used in solid tumors has been provided. In a fraction of colorectal cancers presenting PTPRK-RSPO3 gene fusion, the administration of a RSPO3 blocking antibody promotes tumor regression by inducing the differentiation of CSC into terminally differentiated goblet cells62. More recently, it has also been shown that anti-Smoothened inhibitor promotes basal cell carcinoma regression through tumor cells differentiation63,64. Many small molecule inhibitors and activators targeting nuclear receptors such as NR2F2 are used routinely in clinics in different therapeutic indications, such as anti-estrogen for breast cancer. The development of NR2F2 inhibitors for anti-cancer therapy appears to be a very promising strategy, as NR2F2 is expressed in a wide range of aggressive human cancers for which there is an unmet clinical need. Moreover, NR2F2 inhibition in vivo has no apparent side effects on normal adult tissues20, and promotes tumor differentiation, inhibits neo-angiogenesis19, invasion and tumor stemness, all essential hallmarks of cancer functions, demonstrating the promise of targeting NR2F2 in cancer.
Methods
Compliance with ethical regulations
Mouse colonies were maintained in a certified animal facility in accordance with the European guidelines. All the experiments were approved by the corresponding ethical committee (Commission d’éthique et du bien être animal CEBEA, Faculty of Medicine, Université Libre de Bruxelles). CEBEA follows the European Convention for the Protection of Vertebrate Animals used for Experimental and other Scientific Purposes (ETS No.123). The project proposal was submitted to the Ethical Committee for Animal Experimentation for evaluation and approval. The committee consists of internal and external members with expertise regarding ethics, alternative methods to animal experiments, animal health and welfare as well as research techniques, experimental design and statistical analysis. The ULB ERASME Ethical Committee for Animal Experimentation is responsible for evaluating and approving or rejecting all projects involving animal experiments, as an independent body under Belgian legislation (Royal Decree regarding the protection of laboratory animals of 29 May, 2013) and European directive (2010/63/EU). For every project proposal, the Ethical Committee for Animal Experimentation takes the so-called 3R principle (see Replacing, Reducing, Refining) as its guiding principle and in accordance with the European Guidelines. The project authorization was approved under the number 665N from the ULB ERASME Ethical Committee for Animal Experimentation. The mice were checked every day and were euthanized when the tumor reach the end-point size (1 cm in diameter for all experiments; 2 cm in diameter for the experiments described in Fig. 7e) or if the tumor was ulcerated independently of its size, if the mouse lost >20% of the initial weight or any other sign of distress appeared (based on the general health status and spontaneous activity). None of the experiments performed in this study surpassed the size limit of the tumors. All the experiments strictly complied with the protocols approved by the ethical committee.
Mouse strains
K14Cre, K14CreER, Lgr5CreER, K5CreER, KRasLSL-G12D and p53fl/fl mice have been imported from the NCI mouse repository and the Jackson Laboratories. NOD/SCID, NOD/SCID IL2 and Swiss Nude mice were purchased from Charles River. K14rtta-NR2F2-IRES-GFP mice were generated in house. NR2F2f/f mice were a generous gift of Prof. Sophia Tsai (Baylor College of Medicine, Houston, USA). All mice used in this study were males and females with mixed genetic background. Sex-specific differences were minimized by including similar numbers of male and female animals in all cases.
DMBA/TPA induced skin tumors
Mice were treated with DMBA and TPA according to standard protocols5,10.
KRasLSL-G12D p53fl/fl driven skin tumors
Tamoxifen was diluted at 25 mg/ml in sunflower seed oil (Sigma). A daily intraperitoneal injection (IP) dose of 2,5 mg of Tamoxifen was administered 4 days in a row starting at P28 as previously described to Lgr5CreER/KrasLSLG12D/p53fl/fl/NR2F2fl/fl and 2 IP injection doses of 2,5 mg of Tamoxifen were administrated to K14CreER/KrasLSL-G12D/p53fl/fl/NR2F2fl/fl. Tumor appearance and size were followed up by daily observation and palpation. Mice were euthanized when tumor size reached a maximum size of 1cm, or when mice presented signs of distress.
Collection of human samples
The samples were provided by Erasme Biobank and originate from adult patients that developed head and neck, lung, skin or esophagus SCC or actinic keratosis, as well as the corresponding normal skin controls. There was no restriction of age (except that only adult patients were included) or gender, and no pre-treated tumors were included. The analyzed samples were harvested from the surgically removed material, not directly from patients. All the samples belong to the Erasme Biobank (B406201525681). The goal of the study was to examine the expression and the localization of NR2F2 in different contexts. There was no intention of correlation with histopathology tumor grade or tumor aggressiveness. The human collection study was approved by the Erasme ethical committee. Reference: P2015/330//B406201525681.
Immunostaining
The stainings were performed on frozen sections or in paraffin-embedded sections according to standardized procedures65. Briefly, for immunostaining on frozen sections, tumor tissues were embedded in OCT (Tissue Tek) for cryopreservation. Blocks were sectioned at 4-5μm sections using CM3050S cryostat (Leica Microsystems GmbH). Fixation was performed using 4% paraformaldehyde. Non-specific antibody binding was blocked with 5% horse serum, 1% BSA and 0.2% Triton X-100 for 1 hour at room temperature. Primary antibodies were incubated overnight at 4°C in blocking buffer. Secondary antibodies diluted in blocking buffer at 1:400 for 1 hour at room temperature. Nuclei were stained with Hoechst (4mM) and slides were mounted using SafeMount (Labonord). For the staining on paraffin sections, 4 μm paraffin sections were deparaffinized and rehydrated. Antigen unmasking was performed in citrate buffer (pH 6) or EDTA buffer (pH 9) at 98°C during 20 min using the PT module. Endogenous peroxydase was blocked using 3% H2O2 (Merck) in methanol (VWR) during 20 min at room temperature. Endogenous avidin and biotin were blocked using the Endogenous Blocking kit (Invitrogen) during 20 min at room temperature. Primary antibodies were incubated overnight at 4°C. Anti-rabbit biotinylated secondary antibodies were used, as well as Standard ABC kit, and ImmPACT DAB (Vector Laboratories) for the detection of HRP activity. Slides were mounted using SafeMount (Labonord).
The complete list of antibodies used in this study is included in the Reporting Summary.
Image acquisition
Image acquisition was performed on a Zeiss Axio Imager M1 (Thornwood) fluorescence microscope with a Zeiss Axiocam MR3 camera using the Axiovision software release 4.6. Brightness, contrast and picture size were adjusted using Adobe Photoshop CS6 without altering any information.
Quantification of IF and HE sections
The quantification of K10+ tumor cells and laminin5 gaps in NR2F2 OE papillomas, K8, E-Cad, pH3, ki67 and BrdU positive tumor cells has been performed on at least 4 different fields per tumor using the ImageJ software (https://imagej.nih.gov/ij/).
For the quantification of the Zeb1 and Zeb2 content in IHC of tumor sections, we have selected random a minimum of 4 representative fields from scans of complete cross-sections of the tumor and used the NDP.view2 software to visualize them (https://www.hamamatsu.com/eu/en/product/type/U12388-01/index.html) and counted the number of Zeb1+ and Zeb2+ epithelial tumor cells vs all epithelial cells
The quantification of K10+ tumor areas in NR2F2 KO tumors and respective controls and of the percentage of keratin content in Fig. 5 and 7 have been performed by using mosaic images of a whole tumor section. In all cases, the areas have been quantified using the ImageJ software. For the quantification of the keratin content in tumor sections, we used scans of complete cross-sections of the tumor and the NDP.view2 software.
Histopathological analysis on NR2F2 KO tumors
In the table in Fig. 4h, the mitotic index has been quantified on 10 fields at 400x and divided by 10 to obtain the value per high power field (HPF), which was used to calculate the mean of the Ctrl and NR2F2 KO groups. The results of the other parameters (spongiosis, necrosis and keratinization) are based on a semi-quantitative analysis that took into account the stratification of samples into negative (presence of the morphological feature in less than 20% of the tumor area) or positive (presence of the morphological feature in more than 20% of the tumor area). To calculate the p-values, we used the Mann-Whitney test for the mitotic index, the Fisher’s exact test in all other cases.
Tumor digestion and FACS staining
Tumors were dissected mechanically, digested with collagenase and stained for cell surface markers according to standard protocols65. Cell sorting was performed with FACS Aria cell sorter (BD Biosciences). The complete list of antibodies used in this study is included in the Reporting Summary.
Annexin V staining
We used the FITC Annexin V Apoptosis Detection Kit I (BD Pharmingen, Cat. 556547). Briefly, after tumor digestion, cells were stained with Ep-CAM/CD326 APC/Cy7 (Biolegend 118218 Clone G8.8) to identify TEC. Subsequently, cells were counted using a Neubauer cell counting chamber. As recommended by the manufacturer, 100.000 cells were used for the FITC AnnexinV / PI staining according to the standard protocol.
Western blot
SDS-PAGE and western blot have been performed according to standard protocols. 5% milk has been used as blocking agent. The complete list of antibodies used in this study is included in the Reporting Summary. As substrate for revelation, we used Western Lightning Plus ECL (Perkin Elmer).
Cell culture
SK-MES-1 (human lung SCC) and A431 (human skin SCC) cells were maintained in EMEM medium supplemented with 2mM Glutamine and 10% FBS. Kyse-70 (human oesophagus SCC) cells were maintained in RPMI 1640 supplemented with 2mM Glutamine and 10% FBS. 293T cells were maintained in DMEM (Gibco) supplemented with 10% FBS, 2mM Glutamine, 100U/ml Pen/Strep solution, MEM Non-Essential Amino Acids Solution and Pyruvate. All cell lines were acquired from the DSMZ-German Collection of Microorganisms and Cell Cultures GmbH.
Generation of NR2F2 OE lines and inducible shRNA lines
The NR2F2 rescue experiments described in Fig. 3 and Extended Data Fig. 3 were performed by cloning the CDS of NR2F2 fused to a C-terminal 3HA tag in the pLX302-EF1a vector (constitutive expression). The ChIP experiments described in Fig. 8 and Extended Data Fig. 7 were performed by cloning the CDS of NR2F2 fused to a N-terminal 3HA tag in the pLVX-TetOne-Puro Vector (doxycycline inducible; Clontech, Cat. # 631849). The shRNA experiments described in Fig. 8 and Extended Data Fig. 7 were performed using the SMARTvector Inducible Human NR2F2 PGK-TurboGFP shRNA construct (doxycycline inducible; Horizon Discovery Biosciences, Cat. #V3SH11252-225716276; sequence included in Extended Data Table 1). For the generation of cell lines with stable integration of the constructs, VSV-G pseudotyped lentivirus was produced by Lipofectamine 2000 transfection (Invitrogen) of HEK293T cells with the vector encoding for full-length NR2F2 or the inducible NR2F2 shRNA vector, and the helper plasmids pMD2-VSVg and pPAX2 (Addgene plasmid 12259 and 12260, respectively). 48h after transfection, we collected the viral supernatant and infected the target cell lines using standard methods. After one week of puromycin selection, cells were tested for NR2F2 expression by western blot. For the inducible constructs, 1uM doxycycline has been used.
Generation of NR2F2 CRISPR/CAS9 Knockout in hSCC cells
We generated the NR2F2 KO cell lines by designing four guide RNAs targeting Exon 2. The most efficient guide RNAs were predicted using the MIT CRISPR design tool (Zhang Lab, MIT 2015, now discontinued). The gRNA sequences were cloned as double stranded oligonucleotides in the pSpCas9n (BB)-2A-GFP (PX461) plasmid (Addgene Plasmid #48140), expressing the Cas9 D10A mutant and EGFP simultaneously. We designed the guides in order to generate a deletion of about 400bp. The sequence of the sgRNAs is available in the Extended Data Table 1. We used transient transfection and FACS to establish single cell clones. As soon as single cell clones were visible, we amplified them, extracted genomic DNA and probed them by PCR with a combination of primers detecting the presence or absence of the deletion. We further validated the deleted clones by sequencing the deletion site using PCR primers flanking the position of the guide RNAs, ensuring that the occurring deletion generated a frame shift in the coding sequence. We also validated the NR2F2 KO clones by western blot.
Tumor transplantation assays
Tumor cells were collected in 4°C medium after FACS, or counted after tumor digestion and collected in PBS plus 2% FBS. For the calculation of tumor propagating capacity, cells at known dilutions were resuspended in Matrigel (E1270, 970 mg/ml; Sigma) and injected subcutaneously into NOD/SCID mice. Secondary tumors were detected by palpation every week and their size monitored until tumor reached a size of 1cm or when mice presented signs of distress. The mice were subsequently sacrificed and the number of secondary tumors was quantified.
Calcium Switch assay
To promote cell differentiation of confluent A431 cells, cells were first incubated overnight in low calcium media containing 10% calcium-free FBS. Next, calcium medium level was raised to the final concentration of [Ca2+] = 1.5mM for 48 hours66.
ALDH activity
To evaluate the ALDH activity, cells cultured in ultra-low adherent plates (n=500.000 cells per test) were collected and processed according to the manufacturer instruction (Aldered™ 588-A, SCR150, Merck).
Wound healing assay
Wound healing assays were performed to evaluate the impact of NR2F2-knockdown on the migration of A431 NR2F2 shRNA #1 and #2 SCC cell lines. The assay was perfomed in 24-well plates (n=3 wells per condition)67. At confluency, cells were serum starved (1% FBS media) for 24h before manually performing the wound with a 200μl tip. Next, cells were washed twice with PBS and reincubated in low containing 1% FBS media. To evaluate wound closure, pictures were processed using the ImageJ software.
CIA1 treatment
CIA1 was obtained from MolPort (molport-002-661-412). All treatments were performed as previously described44. For the cell viability assay, cells were seeded in a 96-well plate with transparent bottom at 3000 cells per well, adding the inhibitor the following day. After 72h of incubation, cell viability was assessed using CellTiter-Glo® Luminescent Cell Viability Assay (G7570, Promega, Madison, WI) according to manufacturer’s instructions.
For the in vivo tumor propagating capacity assay, A431 cells were pre-treated with 4 μM CIA1 for 12 hours before the graft. After grafting, mice were treated for 2 weeks daily with 2.6 mg/kg CIA1 dissolved in 10% (2-hydroxypropyl)-β-cyclodextrin (HP-β-CD, 332593, Sigma-Aldrich, Saint Louis, MO) in sterile saline solution and administered by intraperitoneal injection. The end point of the experiment was at 10 weeks after grafting, unless tumor size reached the limit point before. For the experiments of CIA1 treatment in established tumors, we grafted 10^5 A431 cells into immunodeficient mice. Once tumor size reached a palpable size (diameter of about 0.2-0.3 cm), we started daily treatment with CIA1 as previously described. The tumor size was measured weekly with the caliper during the entire experimental process. Tumor volume was calculated with the formula: V = π x (d2 x D) / 6, where d is the minor tumor axis and D is the major tumor axis. At the end of the experiment, mice were euthanized, and tumor tissue was removed for further examination. DMSO injection was used as control condition.
Metastasis assay
The different FACS isolated tumor cell subpopulations or cultured cell lines were collected in 4°C medium. Cells were resuspended in PBS in 50ul PBS and injected into the tail vein of NOD/SCID/Il2Rγ null mice (50.000 cells per injection for mouse primary SCC cells, 100.000 cells for SK-MES1 and corresponding KO and rescue lines). Mice were sacrificed at 30 days (for mouse SCC cells, Fig. 6j) and 60 days (for lung hSCC cells, Fig. 6k) and the lungs were analyzed to detect the presence of metastasis. The number of metastasis was quantified on 10 cryosections per lungs (separated by 100μm) and presented as number of metastasis per lungs. The metastases were characterized by K14 and Vimentin expression (mouse SCC cells) or Pancytokeratin and Ku80 expression (hSCC cells) by immunofluorescence.
RNA extraction and real-time PCR
RNA extraction from FACS isolated cells was performed using RNeasy micro kit (QIAGEN) according to the manufacturer’s recommendations. qRT-PCR analysis was performed in standard conditions. All primer sequences are provided in Extended Data Table 1.
Microarray analysis
Total RNA was analyzed using the Mouse Genome 430 PM strip arrays from Affymetrix at the Functional Genomics Core of IRB Barcelona microarray facility (transcriptional profiling of NR2F2 OE papillomas and NR2F2 KO carcinomas) or at the VIB MicroArray Facility in Leuven (transcriptional profiling of CD34+ cells from SCC and papilloma). To normalize the data, the Robust Multi-array Average expression (RMA) method from the affy package was used68. Two different biological replicates from Ctrl SCC and NR2F2cKO SCC TECs and for Pap Ctrl and Pap GOF were analysed. Genes having a fold change in linear scale of expression greater or equal than 2 are considered as up-regulated / down-regulated. The analysis yielded a total of 1029 downregulated genes and 991 upregulated genes in LOF SCCs; 632 upregulated and 1559 downregulated genes in the Pap GOF models, respectively. For the CD34+ array, we analysed 4 different biological replicates for SCC and 3 for papillomas. Genes having a fold change in linear scale of expression greater or equal than 2 are considered as regulated. The analysis yielded a total of 184 upregulated genes and 143 downregulated genes in CD34+ cells from SCC as compared to papilloma.
RNA-sequencing
RNA extraction from FACS isolated cells was performed using RNeasy micro kit (QIAGEN) according to the manufacturer’s recommendations. Prior to sequencing the quality of RNA was evaluated by Bioanalyzer 2100 (Agilent).
Indexed cDNA libraries were obtained using the Ovation Solo RNA-seq Systems (NuGen) following manufacturer’s recommendations.
The multiplexed libraries were loaded on flow cells and sequences were produced using a NovaSeq 6000 S2 Reagent Kit (200 cycles from a NovaSeq 6000 System (Illumina). Approximately 19 million of paired-end reads per sample were generated and quality check was done with FastQC (https://www.bioinformatics.babraham.ac.uk/projects/fastqc/). The adapter sequences and low-quality regions were trimmed by Trimmomatic69. Trimmed reads were mapped against the mouse reference genome were mapped against the mouse reference genome (GRCh38/hg38) using STAR software70 to generate read alignments for each sample. Annotations GRCh38.87 was obtained from ftp.Ensembl.org. After transcripts assembling, gene level counts were obtained using HTseq (version 0.11.1)71 and normalized to 20 million of aligned reads. Average expression for each gene for the different tumor cell populations was computed based on at least 2 biological replicates and fold changes were calculated between the subpopulations. For the experiments described in Fig. 8, genes having a fold change of expression greater or equal than 1.5 were considered as up-regulated and those having a fold change of expression lower or equal to 0.66 were considered down-regulated.
ChIP-sequencing
For ChIP-seq, cells were collected after induction of doxycycline (1μg/ml). Cells were fixed with fresh 200mM solution of Di(N-succinimidyl) glutarate (DSG) for 20min and 37% formaldehyde for 8min. Fixed cells were quenched with 100μL of Glycine Stop solution (10x) (Active Motif) for 5 min. Chromatin Shearing was performed using the ChIP-IT Express kit (Active Motif) according to the manufacturer’s recommendations. Chromatin Immunoprecipitation was performed using Dynabeads Protein G (Invitrogen) and HA tag antibody (Abcam, ab9110). Purification was performed using the iPure kit v2 (Diagenode). Sequencing library was constructed by using NEB Next Ultra II DNA library Prep Kit for Illumina (Biolabs) according to manufacturer’s instructions and subsequently sequenced on a Novaseq 6000 platform (Illumina).
ChIP-sequencing analysis
Before starting the alignment and downstream analysis, quality check was done by FastQC (https://www.bioinformatics.babraham.ac.uk/projects/fastqc/). The alignment and peak calling were managed on Consortium des Équipements de Calcul Intensif (CÉCI). Adaptors sequences and low-quality regions were removed with Trimmomatic69 (ver 1.11) paired-end mode using options “HEADCROP:10 CROP:65 ILLUMINACLIP:adaptor.file:2:30:10 LEADING:3 TRAILING:3 SLIDINGWINDOW:4:15 MINLEN:50”. Trimmed reads were then aligned to human reference genome hg38 using Bowtie272 (version 2.3.4.2) using options “-X 2000 -q -p 6 -t --fr --very-sensitive --no-discordant --no-unal - -no-mixed”. Mitochondrial reads, reads from unmapped and random contigs, reads without unique alignment, reads with a mapping quality less than 20 and reads which are not properly mapped were removed using samtools73 (version 1.11). Duplicate reads were removed by Picard Mark Duplicates (http://broadinstitute.github.io/picard/). Peak calling was performed by macs2 74 (version 2.2.5) using options “-f BAMPE -g hs -p 0.01 --nomodel”. Blacklisted regions are filtered out by bedtools75 intersect (version 2.27.1).
The raw count was globally normalized into count per 1 million. Peaks were associated to genes with GREAT76software (version 4.0.4) with the following parameters: 5.0kb in proximal upstream, 1.0kb in proximal downstream and up to 100.0kb in distal.
De novo motif prediction was performed using findMotifsGenome.pl program in HOMER77 (version 4.10) software using parameters “-size −250,250 -S 15 -len 6,8,10,12.”
Gene ontology analysis
The gene ontology analysis based on the datasets from the transcriptional profiling of mouse SCC and of human lung SCC cells has been performed using the Enrichr online software (https://maayanlab.cloud/Enrichr/)78,79.
TCGA data acquisition and analysis
The Cervical Squamous Cell Carcinoma (CESC) dataset, disclosed by Tumor Cancer Genome Atlas (TCGA), was downloaded from the National Cancer Institute portal at https://portal.gdc.cancer.gov. It contains RNA-sequencing raw count data as well as clinical information. Raw counts expression data were normalized by computing log2 transcript per million (TPM) method.
For statistical analysis, gene expression data were stratified into two groups based on NR2F2 expression. Top-tertile cut-point was defined as the third tertile value of NR2F2 distribution. Samples with expression level higher or lower than the selected cut-point threshold were classified as “High” and “Low”, respectively. Statistical significance of the difference in survival was computed using the Cox proportional hazard model and the log-rank test P value reported on Kaplan–Meier survival curves80.
All analyses were performed on the R platform (version 3.4.4). All statistical analyses were performed as two-sided.
For the survival analysis in correlation with NR2F2 signature, the Cervical SCC TCGA dataset with at least 100 patients was downloaded from the National Cancer Institute portal at https://portal.gdc.cancer.gov. Raw counts expression data were normalized by computing log2 transcript per million (TPM) method. Only Primary tumors were kept for the analysis (Metastatic samples were removed from the analysis).
Statistics and reproducibility
The sample size was chosen based on previous experience in the laboratory, for each experiment to yield high power to detect specific effects. No statistical methods were used to predetermine sample size. No data were excluded from the analyses. We didn’t test for normality of the datasets. For in vivo studies on primary mouse models, animals were chosen based on correct genotypes. All animals started the treatment with DMBA/TPA at 6-8 weeks of age or were induced with Tamoxifen at 28-35 days after birth. Sex-specific differences were minimized by including similar numbers of male and female animals in all cases. Investigators were blinded to mouse genotypes during the analysis, imaging and quantifications (histology analysis, quantifications, FACS).
Two-tailed Mann-Whitney, Welch’s t-test, one-tailed t-test, unpaired t-test, Fisher’s exact test, mixed model two-way anova, and tumor onset analysis (Kaplan-Maier) were performed using GraphPad Prism version 8 for Mac,
GraphPad Software, La Jolla California USA, www.graphpad.com. The corresponding tests we used are annotated in the figure legends. The tumor propagating cell frequency was computed using the extreme limiting dilution analysis (ELDA) online software as previously described 81, reporting the stem cells estimate number (Tumor Propagating Capacity - TPC) and the p-value of the chi-square test (http://bioinf.wehi.edu.au/software/elda/). All the statistical analyses are based on biological replicates (that correspond to “n” indicated in the text, Figures or Figure legends). No technical replicates were used for statistical test. All immunostaining experiments reported in the manuscript are representative of at least 4 independent experiments (i.e. 4 control and 4 KO/NR2F2 OE samples). Microarray, RNAseq and ChIPseq experiments were done in duplicate. All western blot images represent results obtained in at least 3 different replicates, unless otherwise specified. The images in Extended Data Fig. 7b-d are representative of 3 independent experiments. Unprocessed western blot images are included in the source data.
Extended Data
Extended Data Fig. 1.
Extended Data Fig. 2.
Extended Data Fig. 3.
Extended Data Fig. 4.
Extended Data Fig. 5.
Extended Data Fig. 6.
Extended Data Fig. 7.
Supplementary Material
Reporting Summary.
Further information on research design is available in the Nature Research Reporting Summary linked to this article.
Footnotes
Author Contributions
C.B., F.M., G.L. and C.S. designed the experiments and performed data analysis. F.M., C.S. and G.L. performed most of the experiments. B.D. started the project. B.D., S.G., I.P., J.B., M.M., A.B., Y.S. and M.R. contributed to the experiments. S.R., J.A. and I.S. provided human SCC samples and performed histological analysis on it. Y.B. and C.S. performed the TCGA data acquisition and analysis. E.N., Mi.R., B.D., V.M. and F.R. provided technical support. C.D. provided technical support for cell sorting. G.L. and J.V. contributed to discussion and to the preparation of the manuscript. C.B. and F.M. wrote the manuscript.
Competing Interest
C.B. is founder and advisor of ChromaCure SA, which develops drugs targeting NR2F2. J.V. and M.M. are employee of ChromaCure. C.B. owns shares of Chromacure. The remaining authors declare no competing interests.
Acknowledgments
We are grateful to the Erasme Hospital Biobank (Brussels, Belgium; BE_BERA1; Biobanque Hôpital Erasme-ULB (BERA); BE_NBWB1; Biothèque Wallonie Bruxelles (BWB); BBMRI-ERIC) for providing a large number of human tumor samples. We thank Prof. Sofia Y Tsai (Department of Molecular and Cellular Biology, Baylor College of Medicine, Houston - USA) for kindly sharing the NR2F2f/f mice. We thank Blanpain lab members for their constructive comments on the manuscript. We thank the animal house facility from the ULB (Erasme campus). C.B. is an investigator of WELBIO. F.M. was supported by FNRS post-doctoral fellowship and by the TELEVIE. G.L. was supported by FNRS post-doctoral fellowship and by the TELEVIE. This work was supported by WELBIO, the FNRS, TELEVIE, the PAI program (P7/03-CanEpi), the ULB fondation, and the Fondation Baillet Latour. The Center for Microscopy and Molecular Imaging is supported by the Fonds Yvonne Boёl, by the European Regional Development Fund and the Walloon Region (Wallonia-biomed; grant no. 411132-957270; “CMMI-ULB”).
Data availability
All the raw microarray and sequencing data have been deposited in the Gene Expression Omnibus under the following accession codes: GSE164605 (reference series of the whole data), GSE175726 (human RNA-seq), GSE164597 (Microarray carcinoma and papilloma cancer stem cells), GSE164602 (Microarray papilloma GOF vs Ctrl and carcinoma LOF vs Ctrl), GSE175724 (ChIP-seq). Source data related to all figures are provided with this paper. All other relevant data are available from the corresponding author upon reasonable request.
References
- 1.Alam M, Ratner D. Cutaneous squamous-cell carcinoma. N Engl J Med. 2001;344:975–983. doi: 10.1056/NEJM200103293441306. [DOI] [PubMed] [Google Scholar]
- 2.Sanchez-Danes A, Blanpain C. Deciphering the cells of origin of squamous cell carcinomas. Nat Rev Cancer. 2018;18:549–561. doi: 10.1038/s41568-018-0024-5. [DOI] [PMC free article] [PubMed] [Google Scholar]
- 3.Owens DM, Watt FM. Contribution of stem cells and differentiated cells to epidermal tumors. Nat Rev Cancer. 2003;3:444–451. doi: 10.1038/nrc1096. [DOI] [PubMed] [Google Scholar]
- 4.Perez-Losada J, Balmain A. Stem-cell hierarchy in skin cancer. Nat Rev Cancer. 2003;3:434–443. doi: 10.1038/nrc1095. [DOI] [PubMed] [Google Scholar]
- 5.Abel EL, Angel JM, Kiguchi K, DiGiovanni J. Multi-stage chemical carcinogenesis in mouse skin: fundamentals and applications. Nat Protoc. 2009;4:1350–1362. doi: 10.1038/nprot.2009.120. [DOI] [PMC free article] [PubMed] [Google Scholar]
- 6.Kemp CJ. Multistep skin cancer in mice as a model to study the evolution of cancer cells. Semin Cancer Biol. 2005;15:460–473. doi: 10.1016/j.semcancer.2005.06.003. [DOI] [PubMed] [Google Scholar]
- 7.Valent P, et al. Cancer stem cell definitions and terminology: the devil is in the details. Nat Rev Cancer. 2012;12:767–775. doi: 10.1038/nrc3368. [DOI] [PubMed] [Google Scholar]
- 8.Beck B, Blanpain C. Unravelling cancer stem cell potential. Nat Rev Cancer. 2013;13:727–738. doi: 10.1038/nrc3597. [DOI] [PubMed] [Google Scholar]
- 9.Beck B, et al. A vascular niche and a VEGF-Nrp1 loop regulate the initiation and stemness of skin tumors. Nature. 2011;478:399–403. doi: 10.1038/nature10525. [DOI] [PubMed] [Google Scholar]
- 10.Lapouge G, et al. Skin squamous cell carcinoma propagating cells increase with tumor progression and invasiveness. EMBO J. 2012;31:4563–4575. doi: 10.1038/emboj.2012.312. [DOI] [PMC free article] [PubMed] [Google Scholar]
- 11.Malanchi I, et al. Cutaneous cancer stem cell maintenance is dependent on beta-catenin signalling. Nature. 2008;452:650–653. doi: 10.1038/nature06835. [DOI] [PubMed] [Google Scholar]
- 12.Schober M, Fuchs E. Tumor-initiating stem cells of squamous cell carcinomas and their control by TGF-beta and integrin/focal adhesion kinase (FAK) signaling. Proc Natl Acad Sci U S A. 2011;108:10544–10549. doi: 10.1073/pnas.1107807108. [DOI] [PMC free article] [PubMed] [Google Scholar]
- 13.Beck B, et al. Different levels of Twist1 regulate skin tumor initiation, stemness, and progression. Cell Stem Cell. 2015;16:67–79. doi: 10.1016/j.stem.2014.12.002. [DOI] [PubMed] [Google Scholar]
- 14.Boumahdi S, et al. SOX2 controls tumor initiation and cancer stem-cell functions in squamous-cell carcinoma. Nature. 2014;511:246–250. doi: 10.1038/nature13305. [DOI] [PubMed] [Google Scholar]
- 15.Sastre-Perona A, et al. De Novo PITX1 Expression Controls Bi-Stable Transcriptional Circuits to Govern Self-Renewal and Differentiation in Squamous Cell Carcinoma. Cell Stem Cell. 2019;24:390–404.:e398. doi: 10.1016/j.stem.2019.01.003. [DOI] [PMC free article] [PubMed] [Google Scholar]
- 16.Siegle JM, et al. SOX2 is a cancer-specific regulator of tumor initiating potential in cutaneous squamous cell carcinoma. Nat Commun. 2014;5:4511. doi: 10.1038/ncomms5511. [DOI] [PMC free article] [PubMed] [Google Scholar]
- 17.Lin FJ, Qin J, Tang K, Tsai SY, Tsai MJ. Coup d’Etat: an orphan takes control. Endocr Rev. 2011;32:404–421. doi: 10.1210/er.2010-0021. [DOI] [PMC free article] [PubMed] [Google Scholar]
- 18.Pereira FA, Tsai MJ, Tsai SY. COUP-TF orphan nuclear receptors in development and differentiation. Cell Mol Life Sci. 2000;57:1388–1398. doi: 10.1007/PL00000624. [DOI] [PMC free article] [PubMed] [Google Scholar]
- 19.Qin J, Chen X, Xie X, Tsai MJ, Tsai SY. COUP-TFII regulates tumor growth and metastasis by modulating tumor angiogenesis. Proc Natl Acad Sci U S A. 2010;107:3687–3692. doi: 10.1073/pnas.0914619107. [DOI] [PMC free article] [PubMed] [Google Scholar]
- 20.Qin J, Chen X, Yu-Lee LY, Tsai MJ, Tsai SY. Nuclear receptor COUP-TFII controls pancreatic islet tumor angiogenesis by regulating vascular endothelial growth factor/vascular endothelial growth factor receptor-2 signaling. Cancer Res. 2010;70:8812–8821. doi: 10.1158/0008-5472.CAN-10-0551. [DOI] [PMC free article] [PubMed] [Google Scholar]
- 21.Xie X, Tang K, Yu CT, Tsai SY, Tsai MJ. Regulatory potential of COUP-TFs in development: stem/progenitor cells. Semin Cell Dev Biol. 2013;24:687–693. doi: 10.1016/j.semcdb.2013.08.005. [DOI] [PMC free article] [PubMed] [Google Scholar]
- 22.Hawkins SM, et al. Expression and functional pathway analysis of nuclear receptor NR2F2 in ovarian cancer. J Clin Endocrinol Metab. 2013;98:E1152–1162. doi: 10.1210/jc.2013-1081. [DOI] [PMC free article] [PubMed] [Google Scholar]
- 23.Polvani S, et al. COUP-TFII in pancreatic adenocarcinoma: clinical implication for patient survival and tumor progression. Int J Cancer. 2014;134:1648–1658. doi: 10.1002/ijc.28502. [DOI] [PubMed] [Google Scholar]
- 24.Qin J, Tsai S, Tsai MJ. COUP-TFII, a prognostic marker and therapeutic target for prostate cancer. Asian J Androl. 2013;15:360–361. doi: 10.1038/aja.2013.12. [DOI] [PMC free article] [PubMed] [Google Scholar]
- 25.Ding W, et al. Overexpression of COUPTFII suppresses proliferation and metastasis of human gastric cancer cells. Mol Med Rep. 2018;17:2393–2401. doi: 10.3892/mmr.2017.8164. [DOI] [PMC free article] [PubMed] [Google Scholar]
- 26.Litchfield LM, Appana SN, Datta S, Klinge CM. COUP-TFII inhibits NFkappaB activation in endocrine-resistant breast cancer cells. Mol Cell Endocrinol. 2014;382:358–367. doi: 10.1016/j.mce.2013.10.010. [DOI] [PMC free article] [PubMed] [Google Scholar]
- 27.Shin SW, et al. Clinical significance of chicken ovalbumin upstream promoter-transcription factor II expression in human colorectal cancer. Oncol Rep. 2009;21:101–106. [PubMed] [Google Scholar]
- 28.Wang C, et al. High expression of COUP-TF II cooperated with negative Smad4 expression predicts poor prognosis in patients with colorectal cancer. Int J Clin Exp Pathol. 2015;8:7112–7121. [PMC free article] [PubMed] [Google Scholar]
- 29.Zhang C, Han Y, Huang H, Qu L, Shou C. High NR2F2 transcript level is associated with increased survival and its expression inhibits TGF-beta-dependent epithelial-mesenchymal transition in breast cancer. Breast Cancer Res Treat. 2014;147:265–281. doi: 10.1007/s10549-014-3095-3. [DOI] [PubMed] [Google Scholar]
- 30.Qin J, et al. COUP-TFII inhibits TGF-beta-induced growth barrier to promote prostate tumorigenesis. Nature. 2013;493:236–240. doi: 10.1038/nature11674. [DOI] [PMC free article] [PubMed] [Google Scholar]
- 31.Latil M, et al. Cell-Type-Specific Chromatin States Differentially Prime Squamous Cell Carcinoma Tumor-Initiating Cells for Epithelial to Mesenchymal Transition. Cell Stem Cell. 2017;20:191–204.:e195. doi: 10.1016/j.stem.2016.10.018. [DOI] [PMC free article] [PubMed] [Google Scholar]
- 32.Nassar D, Latil M, Boeckx B, Lambrechts D, Blanpain C. Genomic landscape of carcinogen-induced and genetically induced mouse skin squamous cell carcinoma. Nat Med. 2015;21:946–954. doi: 10.1038/nm.3878. [DOI] [PubMed] [Google Scholar]
- 33.Lapouge G, et al. Identifying the cellular origin of squamous skin tumors. Proc Natl Acad Sci U S A. 2011;108:7431–7436. doi: 10.1073/pnas.1012720108. [DOI] [PMC free article] [PubMed] [Google Scholar]
- 34.White AC, et al. Defining the origins of Ras/p53-mediated squamous cell carcinoma. Proc Natl Acad Sci U S A. 2011;108:7425–7430. doi: 10.1073/pnas.1012670108. [DOI] [PMC free article] [PubMed] [Google Scholar]
- 35.Caulin C, Bauluz C, Gandarillas A, Cano A, Quintanilla M. Changes in keratin expression during malignant progression of transformed mouse epidermal keratinocytes. Exp Cell Res. 1993;204:11–21. doi: 10.1006/excr.1993.1003. [DOI] [PubMed] [Google Scholar]
- 36.Marcato P, Dean CA, Giacomantonio CA, Lee PW. Aldehyde dehydrogenase: its role as a cancer stem cell marker comes down to the specific isoform. Cell Cycle. 2011;10:1378–1384. doi: 10.4161/cc.10.9.15486. [DOI] [PubMed] [Google Scholar]
- 37.Marcato P, et al. Aldehyde dehydrogenase activity of breast cancer stem cells is primarily due to isoform ALDH1A3 and its expression is predictive of metastasis. Stem Cells. 2011;29:32–45. doi: 10.1002/stem.563. [DOI] [PubMed] [Google Scholar]
- 38.Pastushenko I, et al. Identification of the tumor transition states occurring during EMT. Nature. 2018;556:463–468. doi: 10.1038/s41586-018-0040-3. [DOI] [PubMed] [Google Scholar]
- 39.Vaillant F, et al. The mammary progenitor marker CD61/beta3 integrin identifies cancer stem cells in mouse models of mammary tumorigenesis. Cancer Res. 2008;68:7711–7717. doi: 10.1158/0008-5472.CAN-08-1949. [DOI] [PubMed] [Google Scholar]
- 40.van Kempen LC, et al. Activated leukocyte cell adhesion molecule/CD166, a marker of tumor progression in primary malignant melanoma of the skin. Am J Pathol. 2000;156:769–774. doi: 10.1016/S0002-9440(10)64943-7. [DOI] [PMC free article] [PubMed] [Google Scholar]
- 41.Xiao M, et al. Cancer stem-like cell related protein CD166 degrades through E3 ubiquitin ligase CHIP in head and neck cancer. Exp Cell Res. 2017;353:46–53. doi: 10.1016/j.yexcr.2017.03.005. [DOI] [PMC free article] [PubMed] [Google Scholar]
- 42.Gujral TS, et al. A noncanonical Frizzled2 pathway regulates epithelial-mesenchymal transition and metastasis. Cell. 2014;159:844–856. doi: 10.1016/j.cell.2014.10.032. [DOI] [PMC free article] [PubMed] [Google Scholar]
- 43.Moll R, Franke WW, Schiller DL, Geiger B, Krepler R. The catalog of human cytokeratins: patterns of expression in normal epithelia, tumors and cultured cells. Cell. 1982;31:11–24. doi: 10.1016/0092-8674(82)90400-7. [DOI] [PubMed] [Google Scholar]
- 44.Wang L, et al. Small-molecule inhibitor targeting orphan nuclear receptor COUP-TFII for prostate cancer treatment. Sci Adv. 2020;6:eaaz8031. doi: 10.1126/sciadv.aaz8031. [DOI] [PMC free article] [PubMed] [Google Scholar]
- 45.Ma I, Allan AL. The role of human aldehyde dehydrogenase in normal and cancer stem cells. Stem Cell Rev Rep. 2011;7:292–306. doi: 10.1007/s12015-010-9208-4. [DOI] [PubMed] [Google Scholar]
- 46.Minn I, et al. A red-shifted fluorescent substrate for aldehyde dehydrogenase. Nat Commun. 2014;5:3662. doi: 10.1038/ncomms4662. [DOI] [PMC free article] [PubMed] [Google Scholar]
- 47.Pillai S, Bikle DD, Mancianti ML, Cline P, Hincenbergs M. Calcium regulation of growth and differentiation of normal human keratinocytes: modulation of differentiation competence by stages of growth and extracellular calcium. J Cell Physiol. 1990;143:294–302. doi: 10.1002/jcp.1041430213. [DOI] [PubMed] [Google Scholar]
- 48.Hennings H, et al. Calcium regulation of growth and differentiation of mouse epidermal cells in culture. Cell. 1980;19:245–254. doi: 10.1016/0092-8674(80)90406-7. [DOI] [PubMed] [Google Scholar]
- 49.Angel P, Szabowski A, Schorpp-Kistner M. Function and regulation of AP-1 subunits in skin physiology and pathology. Oncogene. 2001;20:2413–2423. doi: 10.1038/sj.onc.1204380. [DOI] [PubMed] [Google Scholar]
- 50.Ito Y, Bae SC, Chuang LS. The RUNX family: developmental regulators in cancer. Nat Rev Cancer. 2015;15:81–95. doi: 10.1038/nrc3877. [DOI] [PubMed] [Google Scholar]
- 51.Qin J, Tsai SY, Tsai MJ. The critical roles of COUP-TFII in tumor progression and metastasis. Cell Biosci. 2014;4:58. doi: 10.1186/2045-3701-4-58. [DOI] [PMC free article] [PubMed] [Google Scholar]
- 52.Zheng J, et al. Knockdown of COUP-TFII inhibits cell proliferation and induces apoptosis through upregulating BRCA1 in renal cell carcinoma cells. Int J Cancer. 2016;139:1574–1585. doi: 10.1002/ijc.30193. [DOI] [PubMed] [Google Scholar]
- 53.Alečković M, et al. Identification of Nidogen 1 as a lung metastasis protein through secretome analysis. Genes Dev. 2017;31:1439–1455. doi: 10.1101/gad.301937.117. [DOI] [PMC free article] [PubMed] [Google Scholar]
- 54.Barker HE, Cox TR, Erler JT. The rationale for targeting the LOX family in cancer. Nat Rev Cancer. 2012;12:540–552. doi: 10.1038/nrc3319. [DOI] [PubMed] [Google Scholar]
- 55.Knowles LM, et al. Integrin alphavbeta3 and fibronectin upregulate Slug in cancer cells to promote clot invasion and metastasis. Cancer Res. 2013;73:6175–6184. doi: 10.1158/0008-5472.CAN-13-0602. [DOI] [PMC free article] [PubMed] [Google Scholar]
- 56.Levental KR, et al. Matrix crosslinking forces tumor progression by enhancing integrin signaling. Cell. 2009;139:891–906. doi: 10.1016/j.cell.2009.10.027. [DOI] [PMC free article] [PubMed] [Google Scholar]
- 57.Krebs AM, et al. The EMT-activator Zeb1 is a key factor for cell plasticity and promotes metastasis in pancreatic cancer. Nat Cell Biol. 2017;19:518–529. doi: 10.1038/ncb3513. [DOI] [PubMed] [Google Scholar]
- 58.Ocana OH, et al. Metastatic colonization requires the repression of the epithelial-mesenchymal transition inducer Prrx1. Cancer Cell. 2012;22:709–724. doi: 10.1016/j.ccr.2012.10.012. [DOI] [PubMed] [Google Scholar]
- 59.Stemmler MP, Eccles RL, Brabletz S, Brabletz T. Non-redundant functions of EMT transcription factors. Nat Cell Biol. 2019;21:102–112. doi: 10.1038/s41556-018-0196-y. [DOI] [PubMed] [Google Scholar]
- 60.de The H. Differentiation therapy revisited. Nat Rev Cancer. 2018;18:117–127. doi: 10.1038/nrc.2017.103. [DOI] [PubMed] [Google Scholar]
- 61.Degos L, et al. All-trans-retinoic acid as a differentiating agent in the treatment of acute promyelocytic leukemia. Blood. 1995;85:2643–2653. [PubMed] [Google Scholar]
- 62.Storm EE, et al. Targeting PTPRK-RSPO3 colon tumors promotes differentiation and loss of stem-cell function. Nature. 2016;529:97–100. doi: 10.1038/nature16466. [DOI] [PubMed] [Google Scholar]
- 63.Biehs B, et al. A cell identity switch allows residual BCC to survive Hedgehog pathway inhibition. Nature. 2018;562:429–433. doi: 10.1038/s41586-018-0596-y. [DOI] [PubMed] [Google Scholar]
- 64.Sanchez-Danes A, et al. A slow-cycling LGR5 tumor population mediates basal cell carcinoma relapse after therapy. Nature. 2018;562:434–438. doi: 10.1038/s41586-018-0603-3. [DOI] [PMC free article] [PubMed] [Google Scholar]
- 65.Pastushenko I, et al. Fat1 deletion promotes hybrid EMT state, tumor stemness and metastasis. Nature. 2021;589:448–455. doi: 10.1038/s41586-020-03046-1. [DOI] [PMC free article] [PubMed] [Google Scholar]
- 66.Sallee JL, Burridge K. Density-enhanced phosphatase 1 regulates phosphorylation of tight junction proteins and enhances barrier function of epithelial cells. J Biol Chem. 2009;284:14997–15006. doi: 10.1074/jbc.M901901200. [DOI] [PMC free article] [PubMed] [Google Scholar]
- 67.Wu B, et al. Baicalein mediates inhibition of migration and invasiveness of skin carcinoma through Ezrin in A431 cells. BMC Cancer. 2011;11:527. doi: 10.1186/1471-2407-11-527. [DOI] [PMC free article] [PubMed] [Google Scholar] [Retracted]
- 68.Gautier L, Cope L, Bolstad BM, Irizarry RA. affy--analysis of Affymetrix GeneChip data at the probe level. Bioinformatics. 2004;20:307–315. doi: 10.1093/bioinformatics/btg405. [DOI] [PubMed] [Google Scholar]
- 69.Bolger AM, Lohse M, Usadel B. Trimmomatic: a flexible trimmer for Illumina sequence data. Bioinformatics. 2014;30:2114–2120. doi: 10.1093/bioinformatics/btu170. [DOI] [PMC free article] [PubMed] [Google Scholar]
- 70.Dobin A, et al. STAR: ultrafast universal RNA-seq aligner. Bioinformatics. 2013;29:15–21. doi: 10.1093/bioinformatics/bts635. [DOI] [PMC free article] [PubMed] [Google Scholar]
- 71.Anders S, Pyl PT, Huber W. HTSeq--a Python framework to work with high-throughput sequencing data. Bioinformatics. 2015;31:166–169. doi: 10.1093/bioinformatics/btu638. [DOI] [PMC free article] [PubMed] [Google Scholar]
- 72.Langmead B, Salzberg SL. Fast gapped-read alignment with Bowtie 2. Nat Methods. 2012;9:357–359. doi: 10.1038/nmeth.1923. [DOI] [PMC free article] [PubMed] [Google Scholar]
- 73.Li H, et al. The Sequence Alignment/Map format and SAMtools. Bioinformatics. 2009;25:2078–2079. doi: 10.1093/bioinformatics/btp352. [DOI] [PMC free article] [PubMed] [Google Scholar]
- 74.Zhang Y, et al. Model-based analysis of ChIP-Seq (MACS) Genome Biol. 2008;9:R137. doi: 10.1186/gb-2008-9-9-r137. [DOI] [PMC free article] [PubMed] [Google Scholar]
- 75.Quinlan AR, Hall IM. BEDTools: a flexible suite of utilities for comparing genomic features. Bioinformatics. 2010;26:841–842. doi: 10.1093/bioinformatics/btq033. [DOI] [PMC free article] [PubMed] [Google Scholar]
- 76.McLean CY, et al. GREAT improves functional interpretation of cis-regulatory regions. Nat Biotechnol. 2010;28:495–501. doi: 10.1038/nbt.1630. [DOI] [PMC free article] [PubMed] [Google Scholar]
- 77.Heinz S, et al. Simple combinations of lineage-determining transcription factors prime cis-regulatory elements required for macrophage and B cell identities. Mol Cell. 2010;38:576–589. doi: 10.1016/j.molcel.2010.05.004. [DOI] [PMC free article] [PubMed] [Google Scholar]
- 78.Chen EY, et al. Enrichr: interactive and collaborative HTML5 gene list enrichment analysis tool. BMC bioinformatics. 2013;14:128. doi: 10.1186/1471-2105-14-128. [DOI] [PMC free article] [PubMed] [Google Scholar]
- 79.Kuleshov MV, et al. Enrichr: a comprehensive gene set enrichment analysis web server 2016 update. Nucleic Acids Res. 2016;44:W90–97. doi: 10.1093/nar/gkw377. [DOI] [PMC free article] [PubMed] [Google Scholar]
- 80.Gendoo DM, et al. Genefu: an R/Bioconductor package for computation of gene expression-based signatures in breast cancer. Bioinformatics. 2016;32:1097–1099. doi: 10.1093/bioinformatics/btv693. [DOI] [PMC free article] [PubMed] [Google Scholar]
- 81.Hu Y, Smyth GK. ELDA: extreme limiting dilution analysis for comparing depleted and enriched populations in stem cell and other assays. J Immunol Methods. 2009;347:70–78. doi: 10.1016/j.jim.2009.06.008. [DOI] [PubMed] [Google Scholar]
Associated Data
This section collects any data citations, data availability statements, or supplementary materials included in this article.
Supplementary Materials
Data Availability Statement
All the raw microarray and sequencing data have been deposited in the Gene Expression Omnibus under the following accession codes: GSE164605 (reference series of the whole data), GSE175726 (human RNA-seq), GSE164597 (Microarray carcinoma and papilloma cancer stem cells), GSE164602 (Microarray papilloma GOF vs Ctrl and carcinoma LOF vs Ctrl), GSE175724 (ChIP-seq). Source data related to all figures are provided with this paper. All other relevant data are available from the corresponding author upon reasonable request.


