Abstract
Epithelial-to-mesenchymal transition (EMT) regulates tumour initiation, progression, metastasis and resistance to anti-cancer therapy1–7. Although great progress has been made in understanding the role of EMT and its regulatory mechanisms in cancer, no therapeutic strategy to pharmacologically target EMT has been identified. Here we found that netrin-1 is upregulated in a primary mouse model of skin squamous cell carcinoma (SCC) exhibiting spontaneous EMT. Pharmacological inhibition of netrin-1 by administration of NP137, a netrin-1-blocking monoclonal antibody currently used in clinical trials in human cancer (ClinicalTrials.gov identifier NCT02977195), decreased the proportion of EMT tumour cells in skin SCC, decreased the number of metastases and increased the sensitivity of tumour cells to chemotherapy. Single-cell RNA sequencing revealed the presence of different EMT states, including epithelial, early and late hybrid EMT, and full EMT states, in control SCC. By contrast, administration of NP137 prevented the progression of cancer cells towards a late EMT state and sustained tumour epithelial state. Short hairpin RNA knockdown of netrin-1 and its receptor UNC5B in EPCAM+ tumour cells inhibited EMT in vitro in the absence of stromal cells and regulated a common gene signature that promotes tumour epithelial state and restricts EMT. To assess the relevance of these findings to human cancers, we treated mice transplanted with the A549 human cancer cell line—which undergoes EMT following TGFβ1 administration8,9—with NP137. Netrin-1 inhibition decreased EMT in these transplanted A549 cells. Together, our results identify a pharmacological strategy for targeting EMT in cancer, opening up novel therapeutic interventions for anti-cancer therapy.
Introduction
Tumour cells lose their epithelial characteristics and acquire mesenchymal features via EMT. This process is a key driver of tumour heterogeneity and has been associated with tumour initiation, progression, metastasis and resistance to chemotherapy or immunotherapy2,4–7,10,11. Although substantial progress has been made towards understanding the role and the mechanisms by which EMT regulates these various aspects of cancer, there are still very few non-genetic pharmacological interventions that enable the inhibition of EMT in primary tumours, decrease their metastatic potential or potentiate the response to anti-cancer therapy.
Netrin-1 is expressed in EMT skin SCC
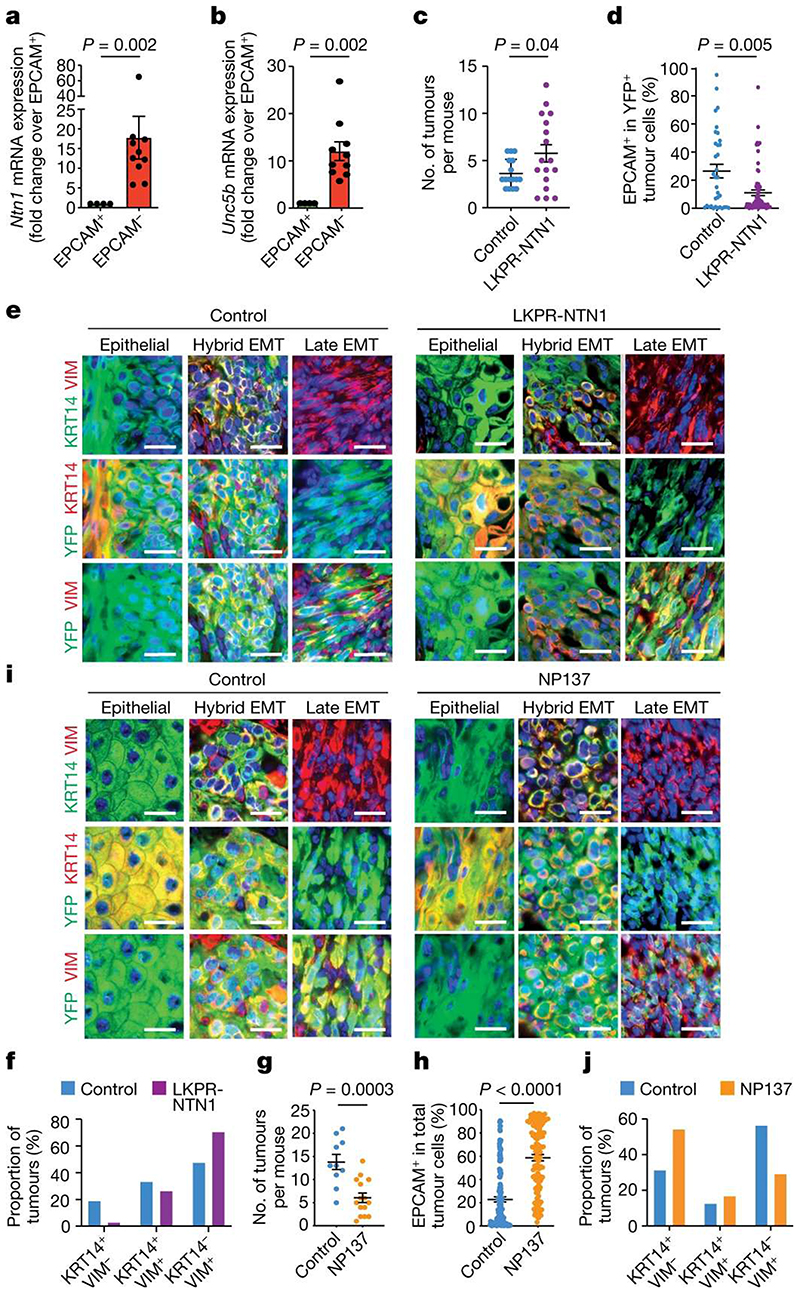
To identify novel therapeutic strategies that can inhibit EMT, we searched RNA-sequencing (RNA-seq) data from epithelial and mesenchymal tumour cells isolated from a model of SCC in mouse that presented spontaneous EMT12–14 (Lgr5-creER;KrasG12D ;Trp53cKO ;Rosa-YFP (LKPR)) for secreted factors preferentially expressed by mesenchymal EPCAM− tumour cells compared with epithelial EPCAM+ tumour cells and for which specific therapy targeting the factor was available and currently administered for cancer in humans. We found that the genes encoding netrin-1 (Ntn1) and its receptor UNC5B (Unc5b) were overexpressed in EPCAM− EMT tumour cells compared with EPCAM+ epithelial tumour cells (Fig. 1a,b). Netrin-1 has been shown to regulate tumour progression in multiple cancer models by preventing apoptosis of tumour cells, promoting neoangiogenesis and controlling the pro-tumorigenic cancer-associated function of fibroblasts15–26. The therapeutic netrin-1-blocking antibody NP137 is currently being tested in clinical trials for treatment of cancer (ClinicalTrials.gov identifier: NCT02977195).
Figure 1. Targeting netrin-1 inhibits EMT.
a,b, Relative mRNA expression of Ntn1 (a) and Unc5b (b) in EPCAM+ (n = 4) and EPCAM− (n = 10) tumour cells determined by quantitative real-time PCR. Data are mean ± s.e.m., normalized to the Tbp gene. Two-tailed Mann-Whitney U test. c, Dot plot showing the number of tumours in control LKPR (n = 16) and LKPR-NTN1 (n = 17) mice. Data are mean ± s.e.m. Two-tailed t-test. d, The proportion of EPCAM+ tumour cells in control LKPR (n = 34 tumours from 16 mice) and LKPR-NTN1 (n = 70 tumours from 17 mice). Data are mean ± s.e.m. Two-tailed t-test. e, Co-immunostaining of YFP and KRT14 or vimentin (VIM) in primary control and LKPR-NTN1 tumours (n = 21 tumours from 11 control LKPR mice and n = 34 tumours from 9 LKPR-NTN1 mice). Scale bars, 20 μm. f, The percentage of tumours with epithelial (KRT14+VIM−), hybrid EMT (KRT14+VIM+) and full EMT (KRT14−VIM+) phenotypes (n = 21 tumours from 11 control LKPR mice and n = 34 tumours from 9 LKPR-NTN1 mice). g, Dot plot showing the number of tumours in control (n = 10) and NP137-treated (n = 15) LKPR mice. Data are mean ± s.e.m. Two-tailed t-test. h, The proportion of EPCAM+ tumour cells in skin SCC of control (n = 148 tumours from 20 mice) and NP137-treated (n = 117 tumours from 16 mice) LKPR mice. Data are mean ± s.e.m. Twotailed t-test. i, Co-immunostaining of YFP and KRT14 or vimentin in control and NP137-treated skin SCC from LKPR mice (n = 32 tumours from 10 control mice and n = 24 NP137-treated SCCs from 9 mice). Scale bars, 20 μm. j, The percentage of tumours exhibiting epithelial (KRT14+VIM−), hybrid EMT (KRT14+VIM+) and full EMT (KRT14−VIM+) phenotypes (n = 32 tumours from 10 control mice and n = 24 NP137-treated SCCs from 9 mice).
Netrin-1 overexpression increases EMT
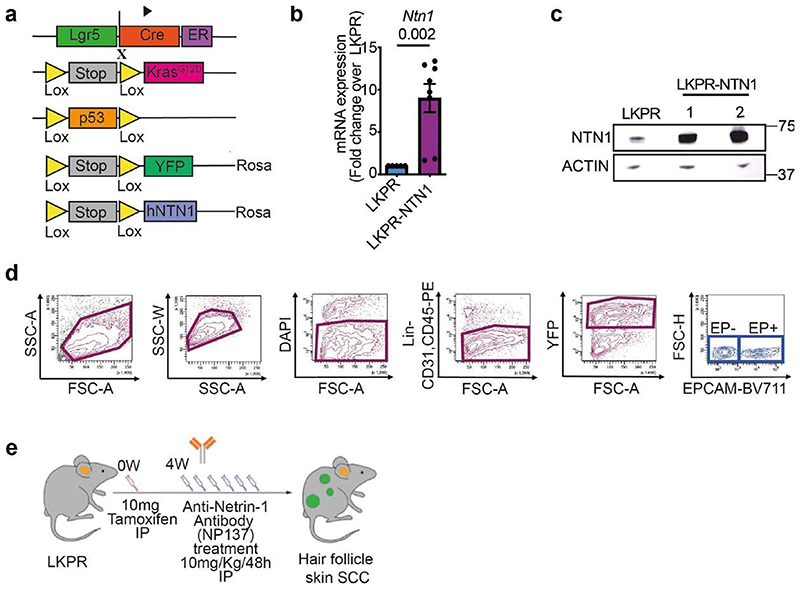
To assess whether netrin-1 promotes EMT, we first overexpressed human netrin-1 in LKPR mice to produce LKPR-NTN1 mice (Lgr5-creER; KrasG12D;Trp53cKO;Rosa-YFP;Rosa-NTN1) (Extended Data Fig. 1a-c). Following netrin-1 overexpression, we observed an increase in the number of tumours per mouse (Fig. 1c) and the proportion of tumour cells that underwent EMT compared with control mice (Fig. 1d and Extended Data Fig. 1d). As reported previously, EMT is not a binary process—it occurs in a stepwise manner via intermediate EMT states3,6,7,14,27–29. Using histological analysis and immunofluorescence, we assessed the effects of netrin-1 overexpression on the different tumour states previously described in this model14, including epithelial (KRT14+VIM−), hybrid EMT (KRT14+VIM+) and late EMT (KRT14−VIM+). Immunostaining revealed that control skin SCCs were heterogeneous: 20% were epithelial (KRT14+VIM−), 35% exhibited hybrid EMT (KRT14+VIM+) and 45% exhibited full EMT (KRT14−VIM+) (Fig. 1e,f). By contrast, overexpression of netrin-1 led to a significant increase in the proportion of tumours with full EMT (70%) and a decrease in SCCs with epithelial phenotype (3%) (Fig. 1e,f), in good accordance with the quantification of EPCAM expression by fluorescence-activated cell sorting (FACS) (Fig. 1d). These data demonstrate that overexpression of netrin-1 promotes tumour initiation and EMT in a primary model of skin SCC.
Targeting netrin-1 inhibits EMT
Previous in vitro studies have reported upregulation of netrin-1 in several cancers exhibiting EMT30–33; however, to our knowledge, the effect of pharmacological inhibition of netrin-1 on EMT in vivo has not been investigated. To assess whether pharmacological inhibition of netrin-1 inhibits EMT, we treated LKPR mice with NP137 four weeks after tamoxifen administration and determined the effect of netrin-1 inhibition on tumour formation and EMT (Extended Data Fig. 1e). NP137 administration three times per week led to a decrease of 50% in the number of SCCs per mouse (Fig. 1g). FACS quantification of the percentage of YFP+EPCAM+ (epithelial) tumour cells and YFP+EPCAM− tumour cells (those that had been through EMT) showed that NP137 administration decreased the proportion of EPCAM− tumour cells that underwent EMT (41% in NP137-treated versus 77% in control mice) in primary skin SCCs presenting spontaneous EMT, showing that in the LKPR mouse model, pharmacological targeting of netrin-1 inhibits EMT (Fig. 1h). To determine whether netrin-1 inhibition differentially affects the different EMT states, we used immunofluorescence to assess the proportions of tumour states. NP137 administration increased the proportion of the epithelial state (54% in NP137-treated mice versus 31% in control mice), whereas the proportion of hybrid EMT was unchanged (16% in NP137-treated mice versus 12% in control mice) and the proportion of the late EMT state was decreased (30% in NP137-treated mice versus 56% in control mice) (Fig. 1i,j). These data demonstrate that pharmaco-logical targeting of netrin-1 inhibits EMT in a mouse model of cancer.
Targeting netrin-1 inhibits metastasis
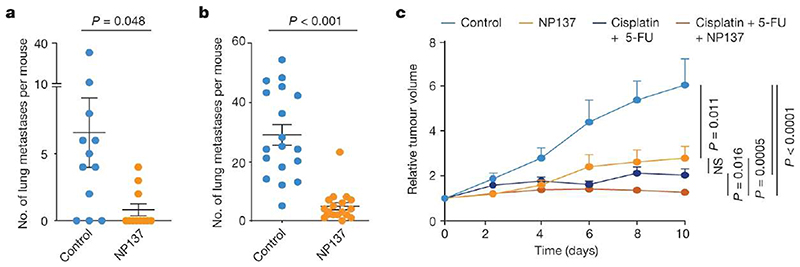
EMT has been shown to have an important role in metastasis formation in different mouse models and is associated with resistance to anti-cancer therapy1,4–6,10,11,34. We assessed whether pharmacological inhibition of netrin-1 in LKPR mice decreased the formation of primary metastases. NP137 administration strongly decreased the number of lung metastases in LKPR mice (Fig. 2a), suggesting that netrin-1 is important for the formation of spontaneous lung metastases. As the number of tumours was lower in LKPR mice treated with NP137, it is possible that the reduction in the number of lung metastases was a consequence of the reduced number of tumours. To clarify this point, we injected YFP+ tumour cells intravenously and assessed the number of lung metastases following pharmacological netrin-1 inhibition. NP137 administration strongly decreased the number of lung metastases following tail vein injection of FACS-isolated YFP+ tumour cells from LKPR mice, demonstrating that netrin-1 inhibition directly inhibits metastasis formation (Fig. 2b).
Figure 2. Targeting netrin-1 reduces metastasis and sensitizes tumour cells to chemotherapy in skin SCC.
a, Dot plot showing the number of spontaneous lung metastases in control (n = 12) and NP137-treated (n = 11) mice with skin SCC. Data are mean ± s.e.m. Two-tailed t-test. b, Dot plot showing the number of lung metastases arising from the intravenous injection of 1,000 EPCAM− tumour cells (n = 18 control-injected mice and n = 18 NP137-injected mice). Data are mean ± s.e.m. Two-tailed t-test. c, Relative tumour volume over time of control tumours (n = 29 from 5 mice) or tumours following therapy with cisplatin plus 5-FU (n = 58 from 8 mice), anti-netrin-1 antibody (n = 29 from 5 mice) or combined of cisplatin plus 5-FU and anti-netrin-1 (n = 59 from 8 mice). Data are mean + s.e.m. Two-tailed t-test. Tumour volumes were normalized to the tumour volume on the first day of chemotherapy.
NP137 sensitizes cancer cells to chemotherapy
EMT has been shown to promote resistance to chemotherapy in skin SCC2,35. To assess whether pharmacological targeting of netrin-1 can sensitize tumour cells to chemotherapy, we treated mice with cisplatin and 5-fluoracil (5-FU), a standard chemotherapy for the treatment of human SCCs36,37 and assessed the effect of netrin-1 inhibition on the response to chemotherapy. The combination of NP137 with cisplatin and 5-FU significantly potentiated the effect of cisplatin and 5-FU on the inhibition of tumour growth in primary SCCs from LKPR mice (Fig. 2c). These data demonstrate that pharmacological targeting of netrin-1 can decrease cancer traits associated with EMT, including metastasis and resistance to therapy.
Effect of NP137 on stromal cells
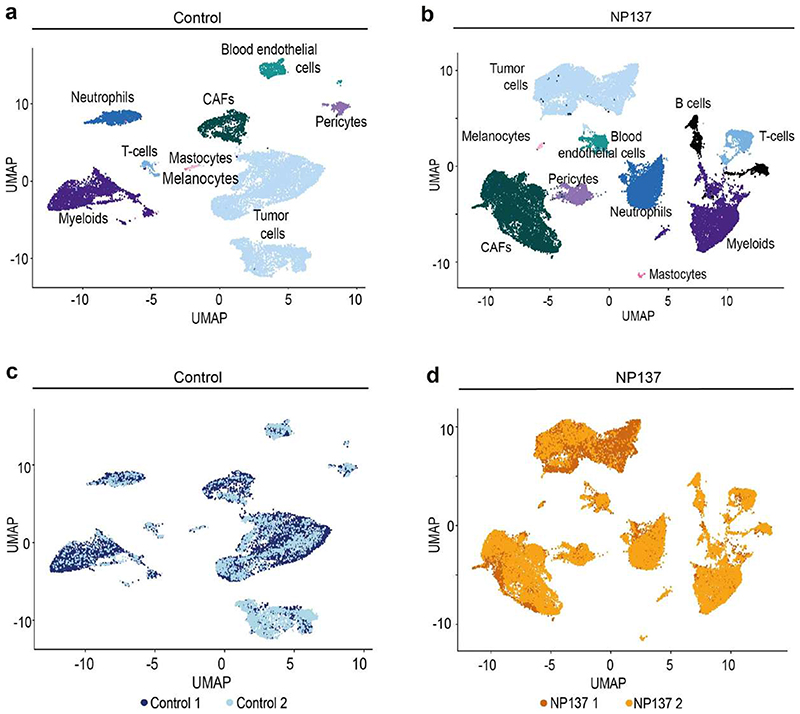
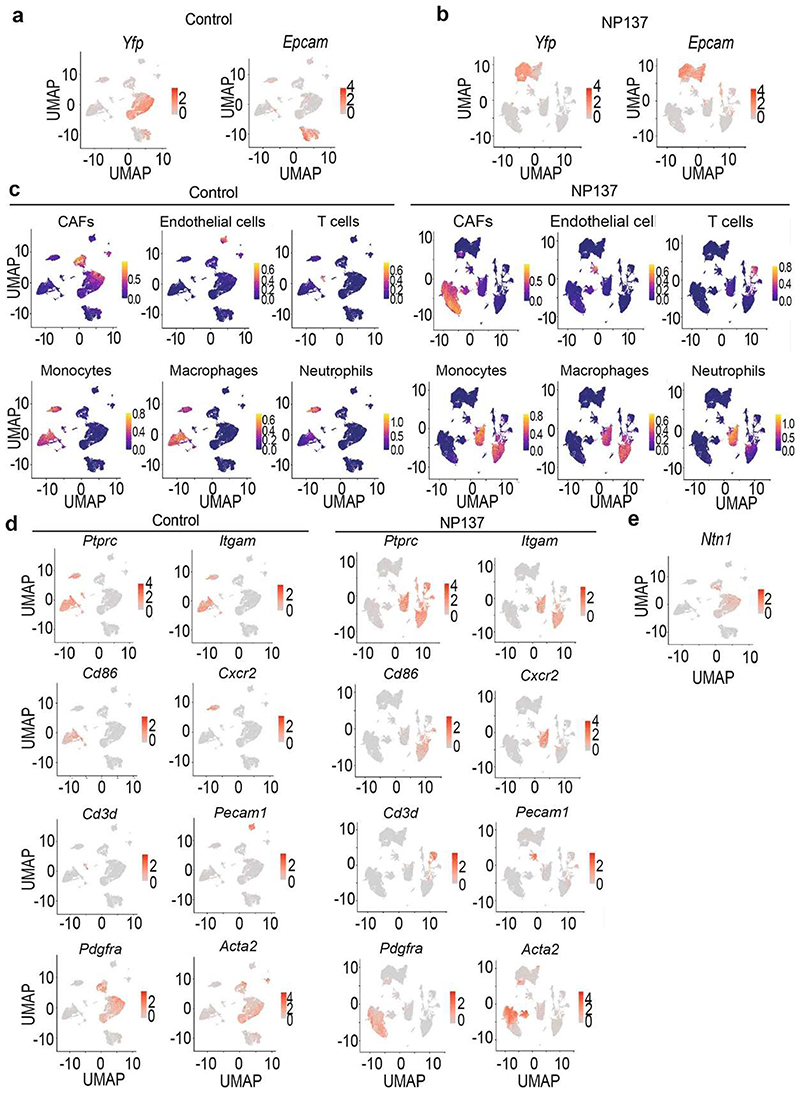
To assess comprehensively the effect of netrin-1 inhibition on the different EMT tumour states and the composition of the tumour stroma, we performed single-cell RNA-seq (scRNA-seq) (10x Genomics Chromium) analysis of tumour cells and their associated stromal cells in two control and two NP137-treated primary skin SCCs. Unsupervised clustering revealed the presence of different cell populations in primary skin SCCs (Extended Data Fig. 2), including tumour cells (Epcam+Yfp+) (Extended Data Fig. 3a,b), immune cells (marked by CD45 (also known as Ptprc) coexpression with Cd86 (myeloid cells), Cxcr2 (neutrophils) and Cd3d (T cells)), cancer-associated fibroblasts (CAFs) (Acta2+Pdgfra+Yfp−’) and endothelial cells (Pecam1+) (Extended Data Fig. 3c,d). This clustering reveals that Ntn1 is expressed in EMT tumour cells and CAFs in skin SCC with spontaneous EMT from LKPR mice (Extended Data Fig. 3e).
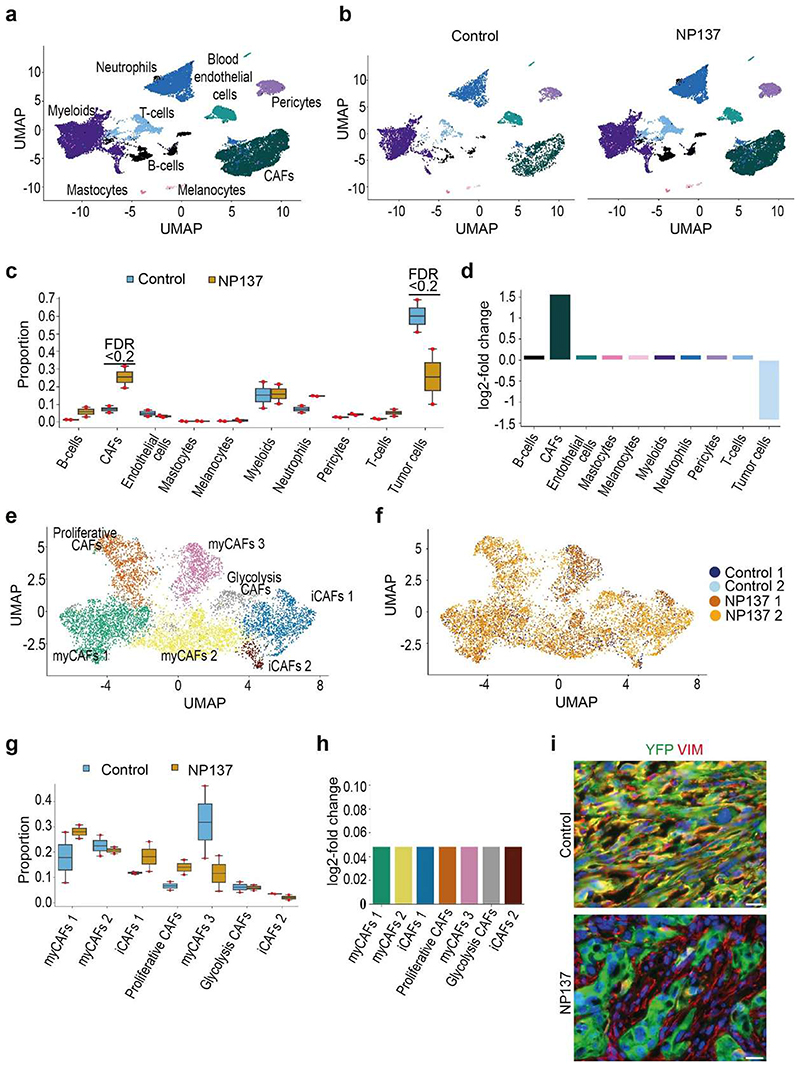
After integration of the tumour microenvironment across conditions, we observed that NP137 administration decreased the proportion of tumour cells and changed the composition of the tumour stroma, with a relative increase in the proportion of CAFs (Extended Data Fig. 4a-d). Using single-cell compositional data analysis (scCODA) to perform differential abundance analysis, we found no significant difference in the proportions of the different CAF clusters—three myofibroblastic CAFs (myCAF) clusters, two immune (iCAF) clusters and proliferative and glycolysis CAF clusters—or in gene expression within these clusters between two control and two NP137-treated mice (Extended Data Fig. 4e-h). Immunostaining analyses confirmed the relative increase of CAFs following NP137 administration (Extended Data Fig. 4i).
Impact of NP137 on tumour cell states
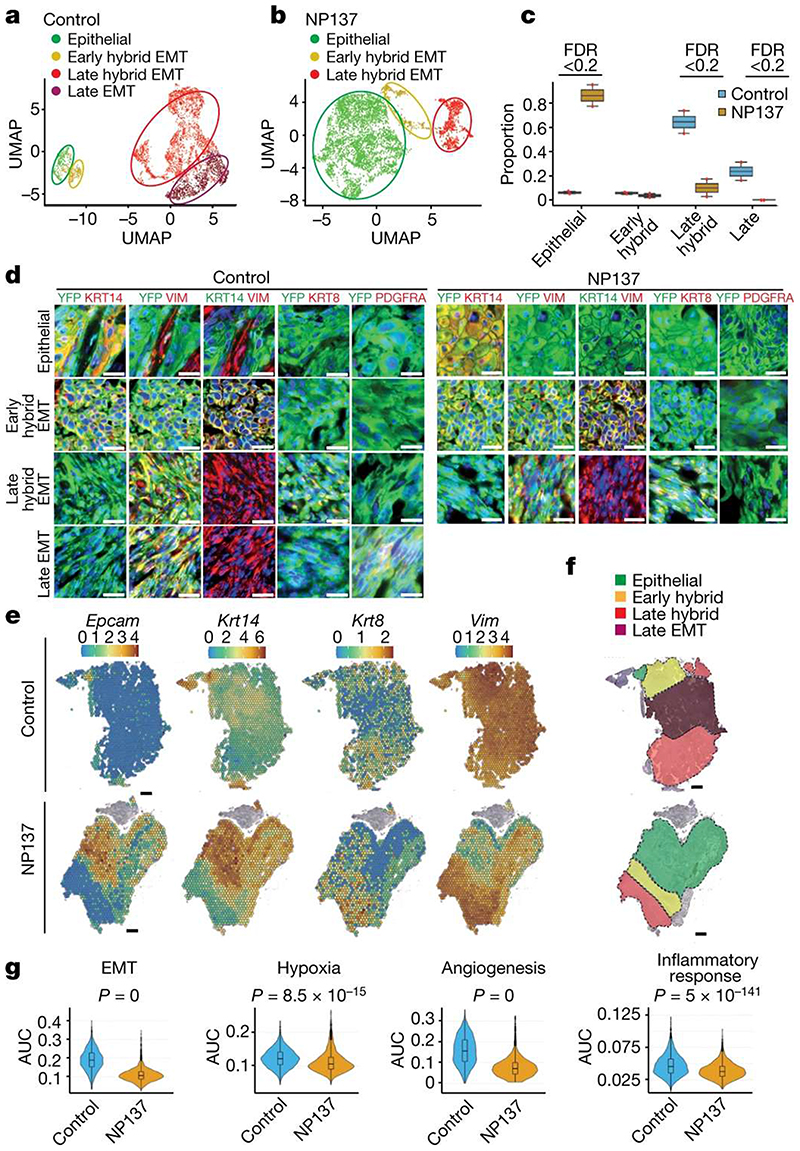
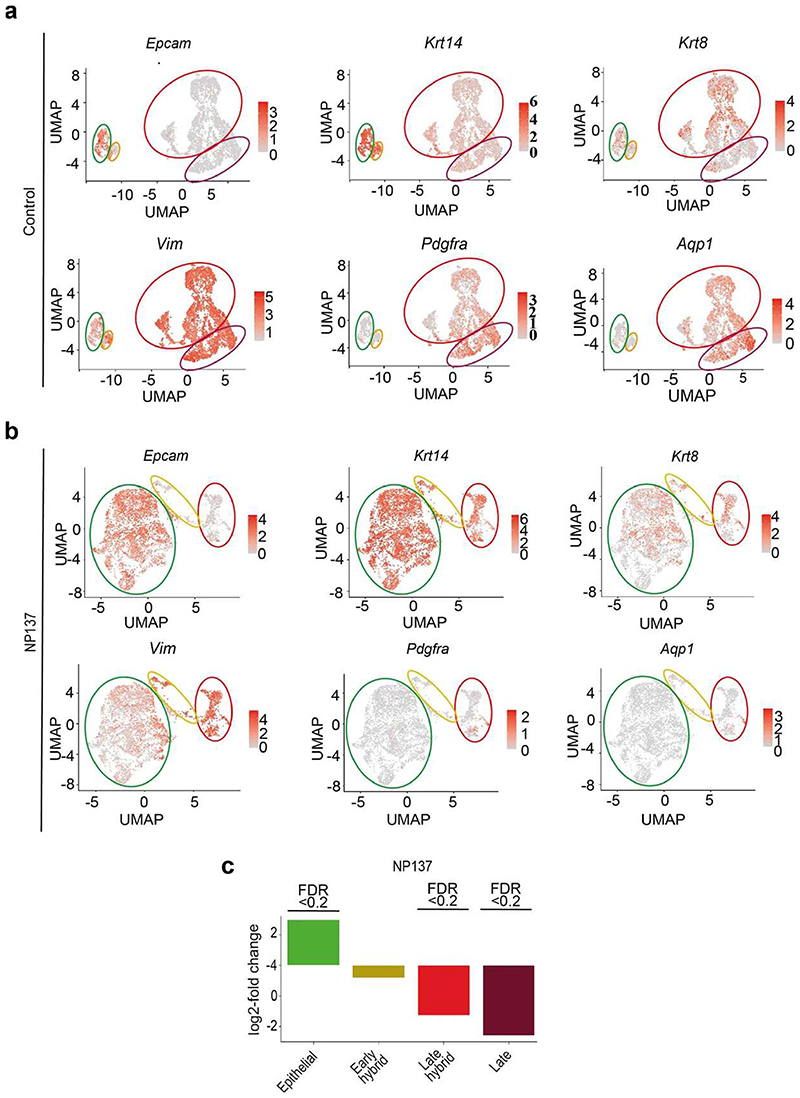
To assess more specifically the effect of netrin-1 inhibition on tumour states, we clustered YFP+ tumour cells of control and NP137-treated mice at higher resolution (Fig. 3a,b). In control tumours, we identified clusters corresponding to distinct EMT cell states ranging from epithelial (Epcam+Krt14+Vim−), early hybrid EMT (Epcam−Krt14+Vim+), late hybrid EMT (Epcam−Krt14−Krt8+Vim+Pdgfra−) and late EMT (Epcam−Krt14−Krt8−Vim+Pdgfra+) (Fig. 3a and Extended Data Fig. 5a). NP137 administration was associated with an increase in the proportion of the epithelial tumour cell state, a similar proportion of early EMT, a decreased proportion of late hybrid EMT and a strong decrease in late EMT compared with the control (Fig. 3b,c and Extended Data Fig. 5b,c). In situ immunofluorescence for KRT14, VIM, KRT8 and PGFRA confirmed the increase in epithelial states and the decrease in late EMT tumour states following NP137 administration (Fig. 3d).
Figure 3. Pharmacological inhibition of netrin-1 inhibits late EMT and promotes epithelial tumour states.
a,b, Uniform manifold approximation and projection (UMAP) plots coloured by EMT state for control (a) and NP137-treated (b) YFP+ tumour cells from skin SCC. Colours represent the different tumour states. c, Box plot depicting the proportion of tumour states for the four samples in control and NP137-treated conditions. Significant changes in proportion are defined as false discovery rate (FDR) <0.2. d, Co-immunostaining of YFP and KRT14, KRT8, vimentin and PDGFRA in control (left) and anti-netrin-1 treated (right) skin SCC from LKPR mice, defining areas with different degrees of EMT (n = 3 control tumours and n = 3 NP137-treated tumours). Scale bars, 20 m. e, Spatial transcriptomics using 10x Visium was conducted on tumour sections of control and NP137-treated mice. Normalized gene expression values are represented as a colour gradient. f, Summary of the different areas presenting different tumour states based on the expression of Epcam, Krt14, Krt8 and Vim: epithelial, Epcam+ Krt14+ Vim- ; early hybrid EMT, Epcam-Krt14+ Vim+ ; late hybrid EMT,Epcam− Krt14−Krt8+Vim+; late full EMT, Epcam− Krt14−Krt8− Vim+. g, Combined box plot and violin plot showing the activity of 4 MSigDB38 hallmark gene sets (epithelial-to-mesenchymal transition, hypoxia, angiogenesis and inflammatory response) in control (n = 2) and NP137-treated (n = 2) tumours. The area under the curve (AUC) indicates enrichment of the different hallmark gene sets in NP137-treated tumours relative to control tumours. Twosided Wilcoxon rank-sum test with Bonferroni correction. In box plots, the centre line represents median, box edges delineate 25th and 75th percentiles and whiskers extend to 1.5 times the interquartile range (IQR).
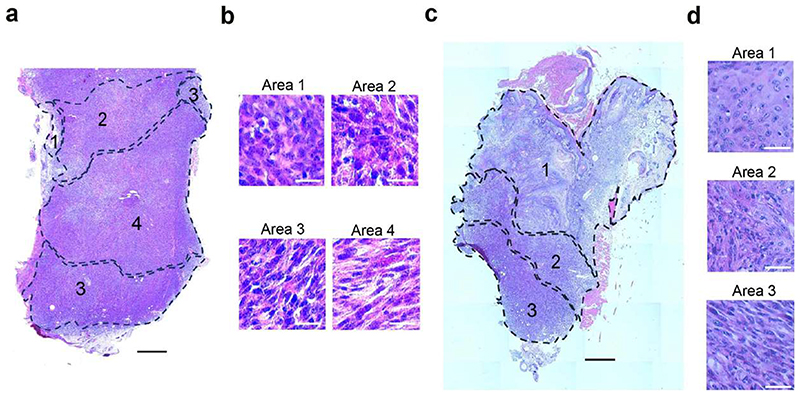
Spatial transcriptomic analysis using 10x Visium revealed the spatial localization of the tumour states identified by scRNA-seq and showed that they were localized in distinct niches, as previously reported14. NP137 administration increased the proportion of the epithelial state (Epcam+Krt14+) and inhibited the occurrence of the late EMT state (Krt14−Krt8−Vim+), blocking EMT progression at the hybrid EMT state (Krt8+Vim+) (Fig. 3e,f and Extended Data Fig. 6).
To further understand the mechanisms and signalling pathways by which NP137 administration regulates EMT, we performed pathway analyses using MSigDB Hallmark gene sets38 on the scRNA-seq data. These analyses revealed that the expression of genes associated with EMT, hypoxia, angiogenesis and inflammatory response were all significantly decreased in tumour cells following netrin-1 inhibition (Fig. 3g).
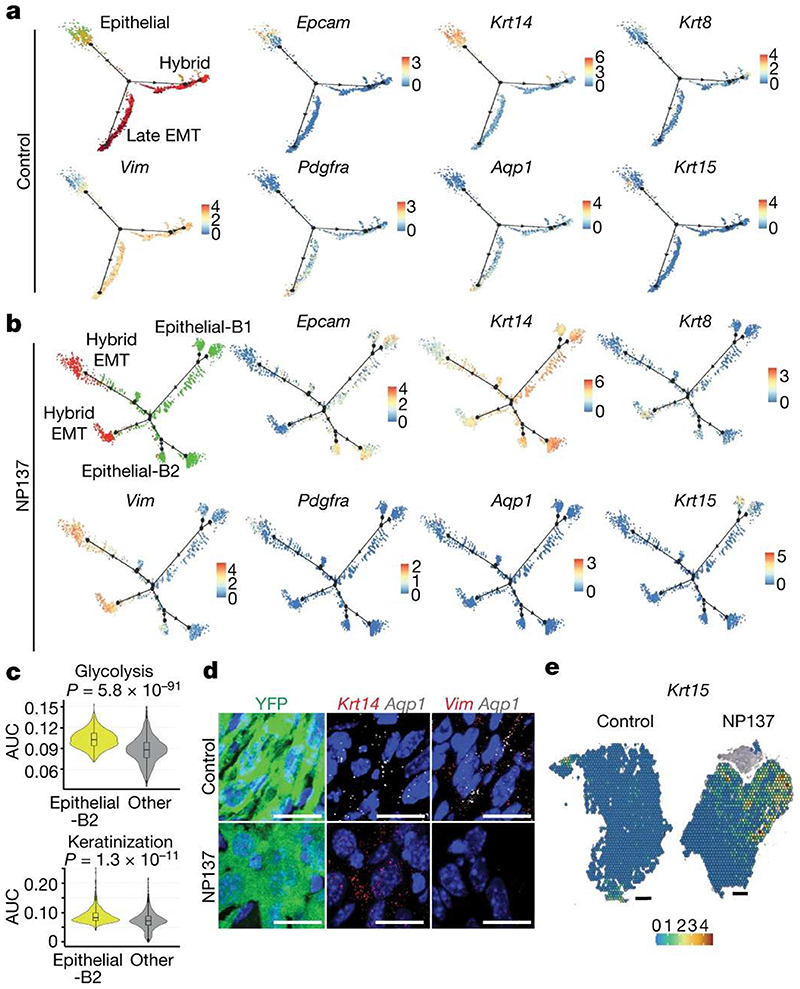
Lineage trajectory analysis revealed that two distinct lineage trajectories could be identified in the control tumour, with a trajectory going from epithelial cells towards hybrid EMT and another trajectory going from the epithelial state towards the late full EMT state (Fig. 4a). NP137-treated tumour cells were characterized by different lineage trajectories, with the disappearance of a trajectory toward the late EMT state expressing a high level of Aqp1 and the appearance of two new trajectories towards epithelial states (epithelial-B1 and epithelial-B2), and two hybrid EMT trajectories (Fig. 4b). The epithelial-B1 state was characterized by high expression of Krt15, and gene ontology (GO) term enrichment analysis of marker genes of cells belonging to the epithelial-B2 state revealed an upregulation of glycolysis and increased keratinization (Fig. 4b,c). In situ analysis using RNA fluorescence in situ hybridization and 10x Visium spatial transcriptomics on tumour sections of control and NP137-treated tumours showed a decrease of Aqp1-expressing cells (Fig. 4d) and an increase of tumour cells expressing Krt15 following netrin-1 inhibition, confirming the inhibition of the late EMT trajectory and the increase of epithelial states following NP137 administration (Fig. 4e). Together, these data reveal that EMT is characterized by the presence of different EMT tumour states, with two different differentiation trajectories from the epithelial state towards distinct EMT states, and that pharmacological targeting of netrin-1 inhibits the switch of the epithelial state to the late EMT state and promotes tumour cell differentiation to the epithelial state.
Figure 4. Pharmacological inhibition of netrin-1 inhibits late EMT promotes epithelial differentiation trajectories of tumour cells.
a,b, Pseudotemporal analysis using Monocle2 showing lineage trajectories in control skin SCC showing two EMT trajectories (hybrid and full (late) EMT trajectories) (a) and in NP137-treated skin SCC showing the absence of the late EMT trajectory and the appearance of new epithelial trajectories (b). Dots represent single cells. Green, epithelial; orange, early hybrid EMT; red, late hybrid EMT; dark red, late EMT. Gene expression is visualized as a colour gradient with blue indicating no expression and red indicating maximum expression. The two new branches detected in the NP137-treated trajectory are labelled epithelial-B1 and epithelial-B2. c, Combined box plot and violin plot showing the activity of glycolysis and keratinization gene sets in tumour cells belonging to the new epithelial state and other EMT states based on GO-term analysis in NP137-treated tumours (n = 2). The centre line represents median, box edges delineate 25th and 75th percentiles and whiskers extend to 1.5 times the IQR. Two-sided Wilcoxon rank-sum test with Bonferroni correction. d, Immunostaining for YFP and RNA in situ hybridization (RNAscope) for Krt14, Vim or Aqp1 in control and NP137-treated skin SCCs from LKRP mice (n = 2 independent biological replicates). Scale bars, 20 μm. e, Krt15 expression analysis using 10x Visium spatialtranscriptomic analysis on tumour sections. Gene expression values are normalized in the control and treated sample and are visualized as a colour gradient. Scale bars, 500 μm.
The netrin-1/Unc5b axis promotes EMT
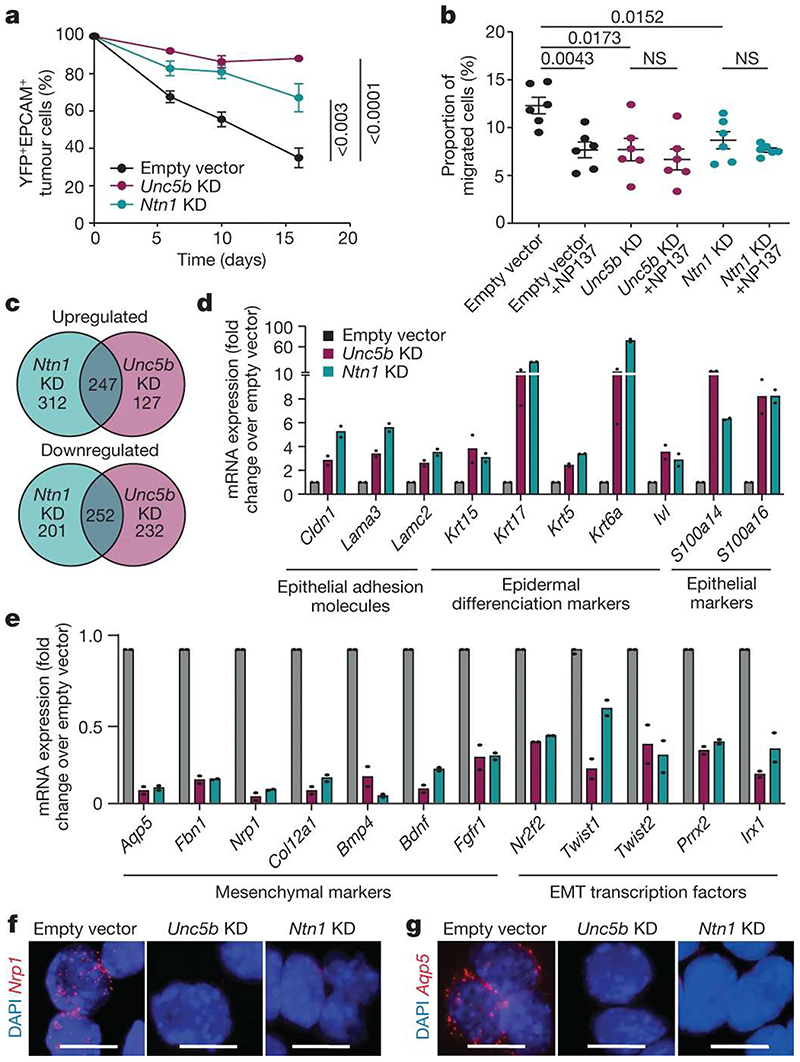
Netrin-1 has been proposed to have a pleiotropic role in cancer, including a cellular autonomous role in tumour proliferation and apoptosis, as well as having a non-cellular autonomous mechanism that regulates tumour growth by controlling tumour angiogenesis and CAF functions15–26. Our single-cell analysis shows that NP137 administration modulates the composition of the tumour microenvironment and the proportion of the different EMT tumour cell states. NP137 has been shown to specifically inhibit the interaction of netrin-1 with its receptor UNC5B39. To assess whether the regulation of EMT and the promotion of proepithelial states by NP137 administration is the consequence of a disruption of a paracrine or autocrine netrin-1-UNC5B signalling axis that directly regulates EMT states, we studied the effect of genetic knockdown of Ntn1 and Unc5b on EMT states in a tumour cell-autonomous manner in vitro in the absence of the tumour microenvironment. EPCAM+ tumour cells isolated by FACS from primary SCCs from LKPR mice and cultured in vitro progressively underwent EMT, as shown by the progressive loss of EPCAM expression by tumour cells (Fig. 5a), with an average of 60% of EPCAM+ switching to become EPCAM− tumour cells over two weeks in culture. Notably, shRNA-mediated knockdown of Ntn1 or Unc5b resulted in a strong decrease in the ability of EPCAM+ tumour cells to switch to the EPCAM− EMT phenotype (Fig. 5a). Inhibition of EMT upon shRNA knockdown of Ntn1 or Unc5b was accompanied by a decrease in cell migration that was not further enhanced by NP137 administration (Fig. 5b).
Figure 5. Netrin-1 and Unc5b knockdown inhibits EMT and promotes epithelial state.
a, EPCAM expression following in vitro culture of FACS-isolated primary EPCAM+ tumour cells transduced with empty vector, or Ntn1 or Unc5b shRNA knockdown (KD) (n = 8 independent replicates for empty vector, n = 6 independent replicates for Unc5b knockdown and n = 3 independent replicates for Ntn1 knockdown). Data are mean ± s.e.m. Two-tailed t-test. b, The percentage of migrated EPCAM− cells from LKPR mice quantified by crystal violet staining (n = 2 independent replicates, 3 wells per condition). Data are mean ± s.e.m. Twotailed Mann-Whitney U test. c, Venn diagram showing the overlap between upregulated and downregulated genes in Ntn1-KD and Unc5b-KD cell lines. d, mRNA expression of upregulated epithelial genes by RNA-seq of EPCAM+ cells 6 days after plating of 100% EPCAM+ tumour cells. Histograms represent mean; n = 2 for empty vector, Ntn1-KD and Unc5b-KD. e, mRNA expression of mesenchymal genes that are downregulated following Ntn1 knockdown or Unc5b knockdown, determined by RNA-seq in EPCAM+ cells 6 days after plating of 100% EPCAM+ tumour cells. Histograms represent mean; n = 2. f,g, In situ hybridization (RNAscope) for Nrp1 (f) and Aqp5 (g) in empty vector control, Ntn1-KD and Unc5B-KD cell lines (n = 2 independent biological replicates). Scale bars, 20 μm.
To assess the molecular mechanisms by which netrin-1 and UNC5B signalling regulate EMT, we performed bulk RNA-seq of EPCAM+ tumour cells from control, Ntn1-KD and Unc5b-KD tumour cells cultured in vitro 6 days after plating of FACS-isolated EPCAM+ tumour cells. More than 50% of the genes that were downregulated or upregulated following Unc5b knockdown were also differentially regulated by Ntn1 knockdown (Fig. 5c), indicating that netrin-1 and UNC5B regulate a similar signalling pathway and transcriptional programme. Consistent with the results of single-cell RNA-seq following NP137 administration, Ntn1 knockdown and Unc5b knockdown promoted the expression of genes associated with the epithelial state (Krt14, Krt15 and involucrin and claudin) (Fig. 5d) and decreased the expression of genes associated with EMT and promoting EMT (Aqp5, Nrp1, Nr2f2, Twist1 and Twist2) (Fig. 5e-g). Together, these data demonstrate that targeting the netrin-1-UNC5B signalling axis in tumour cells decreases EMT and promotes the epithelial state in skin SCC in a cellular autonomous manner independently of the tumour microenvironment.
NP137 prevents EMT in human cancer
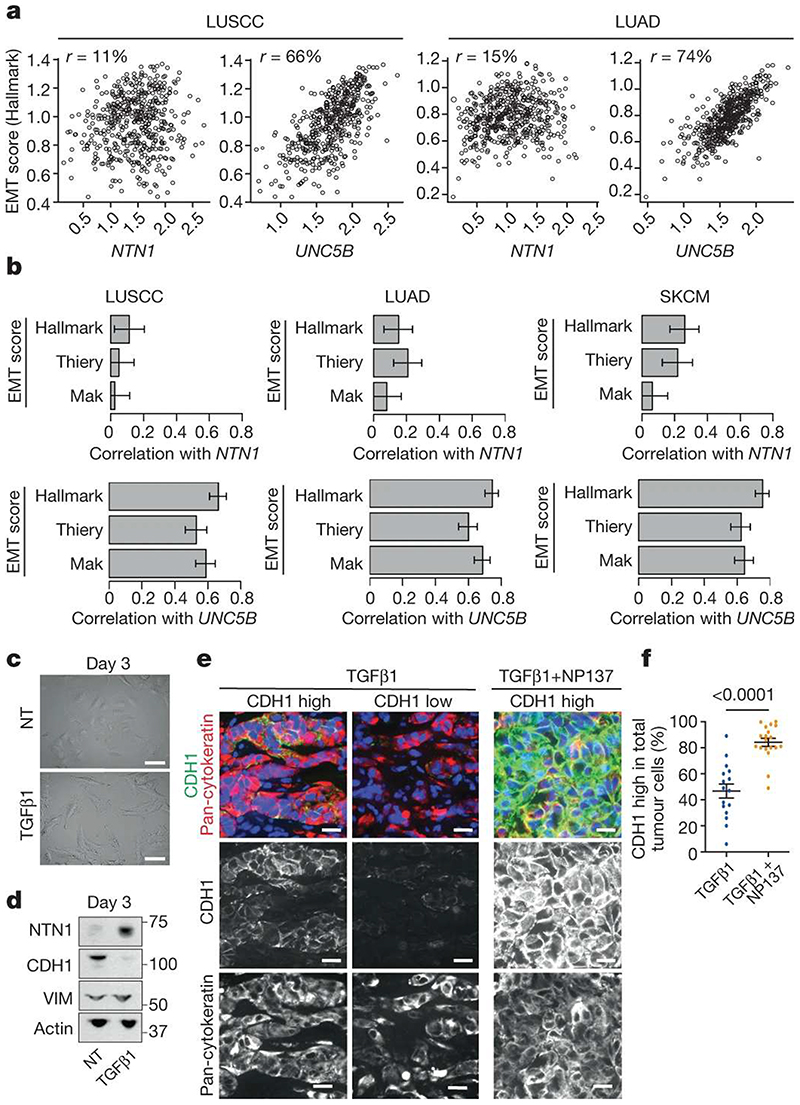
To assess the human and clinical relevance of our findings, we first assessed the correlations between netrin-1 expression, UNC5B expression and the EMT signature in human non-small cell lung carcinoma (lung SCC and lung adenocarcinoma) and melanoma. We used several previously described human EMT signatures11,38,40 and the gene expression dataset from the pan-TCGA (The Cancer Genome Atlas) version of lung SCC (LUSCC) (484 primary tumours), lung adenocarcinoma (LUAD) (510 primary tumours) and skin cutaneous mela-noma (SKCM) (76 primary tumours and 367 metastases). Although netrin-1 expression was not strongly associated with the EMT score, there was a very good correlation between the expression of the netrin-1 receptor UNC5B and EMT scores for these three cancer types (Fig. 6a,b).
Figure 6. Anti-netrin-1 therapy inhibits EMT in human cancer cells.
a, Scatter plots of NTN1 and UNC5B expression versus Hallmark EMT signatures are shown for LUSCC (n = 484 primary tumours) and LUAD (n = 510 primary tumours) cancer types from the TCGA. Spearman correlations are shown at the top of each graph. b, Bar plots showing Spearman correlations between NTN1, UNC5B expression and three EMT signature scores11,38,40 acrossLUSCC (n = 484 primary tumours), LUAD (n = 510 primary tumours) and SKCM (n = 443 tumours including 76 primary tumours and 367 metastases) cancer types from TCGA, with 95% confidence intervals (clipped at 0 for low correlations). To obtain EMT scores, the Hallmark signature was computed using single-sample Gene Set Enrichment Analysis41 (ssGSEA) on genes from the HALLMARK_EPITHELIAL_ MESENCHYMAL_TRANSITION signature, from MSigDB38; the Thiery signature was computed similarly using genes from ref. 11; the Mak signature was calculated from the gene sets in ref. 40 as the difference of two signatures: a mesenchymal signature defined as the mean of mesenchymal gene expression and an epithelial signature defined as the mean of epithelial gene expression. c, Microscopic appearance of A549 NSCLC cells, following no treatment or after 3 days of TGFβ1 treatment (n = 3). Scale bars, 20 μm. d, Western blot analysis of netrin-1, E-cadherin (CDH1) and vimentin expression in the A549 NSCLC cell line in control conditions or following 3 days of TGFβ1 treatment. e, Co-immunostaining of E-cadherin and pan-cytokeratin on tumours arising from subcutaneous grafting into immunodeficient mice of A549 cells pre-treated with TGFβ1 in vitro for 6 days. The mice were treated with physiologic serum or NP137 for 25 days and the tumours were collected for histological analysis. Scale bars, 20 μm. f, Tumour cells expressing high levels of E-cadherin as a percentage of pan-cytokeratin-positive tumour cells (each dot represents the mean of E-cadherin-high cells in 4 representative areas from each tumour; n = 6 control tumours and n = 6 NP137-treated tumours). Data are mean ± s.e.m. Two-tailed t-test.
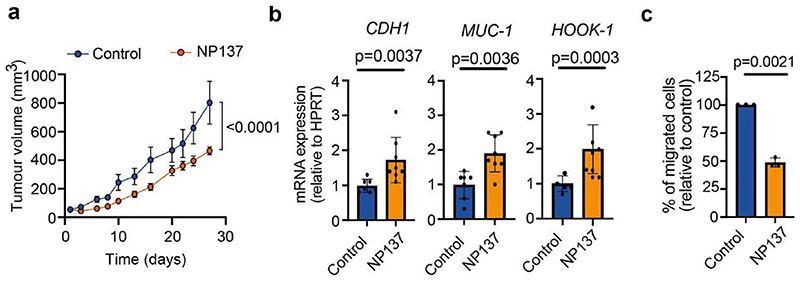
To assess the functional relevance of these data, we then assessed the effect of blocking netrin-1-UNC5B signalling on EMT in the A549 human non-small cell lung cancer (NSCLC) cell line, a commonly used human cancer cell line that can undergo EMT in a plastic manner upon TGFβ1 administration8,9. We treated A549 cells with recombinant TGFβ1 in vitro for 3 days, which promoted mesenchymal cell morphology, increased netrin-1 expression and promoted EMT as shown by the upregulation of vimentin and downregulation of E-cadherin expression (Fig. 6c,d). We next performed subcutaneous grafting of the A549 cells that underwent EMT into immunodeficient mice and administered NP137 every 2 days. Of note, immunostaining analysis revealed that NP137 significantly increased the number of tumour cells expressing high levels of epithelial marker E-cadherin (Fig. 6e,f), demonstrating that netrin-1 inhibition decreases EMT in human cancer cells in vivo. Treatment of Ishikawa cells—a human endometrial adenocarcinoma cell line—with NP137 following their transplantation into immunodeficient mice decreased tumour growth (Extended Data Fig. 7a) and resulted in an increase in epithelial gene expression (Extended Data Fig. 7b), further demonstrating that targeting netrin-1 inhibits EMT. Consistent with the decrease of EMT induced by netrin-1 inhibition, NP137 administration decreased migration of these cells in vitro (Extended Data Fig. 7c).
Discussion
Our study demonstrates that pharmacological targeting of netrin-1 using NP137—a netrin-1-blocking monoclonal antibody currently being tested in phase II clinical trials for the treatment of different solid tumours—is a safe and effective strategy for targeting EMT in primary mouse and human tumours, decreasing lung metastasis and increasing the response of tumour cells to chemotherapy.
Our bioinformatic analysis of scRNA-seq data following netrin-1 inhibition combined with in situ characterization reveals the molecular mechanisms by which netrin-1 regulates EMT and promotes a late EMT differentiation trajectory. Inhibition of netrin-1 induces a switch in the lineage differentiation of tumour cells that redirects the tumour differentiation towards an epithelial tumour state that is more sensitive to chemotherapy and less prone to give rise to metastasis. Netrin-1 exerts its pro-EMT function by signalling to UNC5B, which promotes the expression of a mesenchymal transcriptional programme and downregulates the expression of genes controlling cell-cell adhesion and promoting the epithelial differentiation programme. The sensitization of tumour cells to chemotherapy following NP137 administration suggests that the combination of anti-netrin-1 antibody with other anti-cancer drugs might be beneficial for patients with cancer exhibiting EMT features.
We have also demonstrated the human relevance of pharmacologically targeting EMT following treatment with netrin-1-blocking antibody using a human lung cancer cell line and an endometrial adenocarcinoma line that presents EMT plasticity, demonstrating that pharmacological inhibition of EMT can be achieved in human cancers in vivo in pre-clinical settings.
In sum, our study provides a proof-of-principle that pharmacological targeting of EMT in a mouse model of primary cancer and in human cancers is possible. These results have important implications for the development of strategies for anti-cancer therapy combining netrin-1 inhibition in patients with cancer exhibiting EMT and for the development of novel biomarkers that will help to better stratify cases of cancer to identify those that are more likely to respond to anti-netrin-1 therapy.
Methods
Compliance with ethical regulations
Mouse colonies were maintained in a certified animal facility in accordance with the European guidelines. All the experiments were approved by the corresponding ethical committee (Commission d’Etique et du Bien-Être Animal CEBEA, Faculty of Medicine, Université Libre de Bruxelles). CEBEA follows the European Convention for the Protection of Vertebrate Animals Used for Experimental and Other Scientific Purposes (2010/63/UE). The mice were checked every day and were euthanized when tumours reached the endpoint size (2 cm3), if the tumour was ulcerated (independently of the size), or if the mouse lost >20% of its initial weight or showed any other sign of distress (based on general health status and spontaneous activity). None of the experiments performed in this study surpassed the size limit of the tumours. All the experiments complied strictly with the protocols approved by ethical committee. The housing conditions of all animals were strictly following the ethical regulations. The room temperature ranged from 20 and 24 °C. The relative ambient humidity at the level of mouse cages was 55 ± 10%. Each cage was provided with food, water and two types of nesting material. A semi-natural light cycle of 12:12 was used. All the experiments complied strictly with the protocols approved by ethical committee.
For subcutaneous grafting using Ishikawa cells, female Swiss nude mice, six weeks of age, were purchased from Janvier Laboratories and maintained in specific pathogen-free conditions (P-PAC) and kept in sterilized filter-topped cages. Their care and housing were in accordance with institutional European guidelines as put forth by the CECCAP local ethical committee.
Mouse strains
Rosa26-YFP mice42, Lgr5-creER mice43, KrasLSL−G12D mice44 and Trp53fl/fl mice45 were imported from the NCI mouse repository and Jackson Laboratories. NOD/SCID/Il2Rγ null mice were purchased from Charles River. All mouse groups used in this study were composed of males and females with mixed genetic background. No randomization and no blinding were performed in this study. The Rosa26LSL-NTN1 transgenic mice (for LKPR-NTN1 gain of function) were imported from Mehlen Laboratory-Apoptosis, Cancer and Development, Centre de Recherche en Cancérologie, Lyon, France46.
LKPR and LKPR-NTN1 induced SCC model
The model LKPR mice were obtained by crossing Rosa26-YFP 42, Lgr5-creER 43, KrasLSL-GG2D 44, and Trp53fl/fl 45 mice12. Intraperitoneal administration of tamoxifen (an oestrogen analogue) (Sigma, T5648-1G) was used to activate specifically in hair follicle cells expressing LGR5 the CreERT2 recombinase fused to oestrogen receptor. Irreversible Cre-lox recombination results in expression of Kras oncogene, loss of the Trp53 suppressor gene, and expression of the YFP reporter gene as tool for lineage tracing of tumour cells. Tamoxifen was diluted at 25 mg ml-1 in sunflower seed oil, 10% ethanol (Sigma). Four daily intraperitoneal injections of 2.5 mg tamoxifen were administered at postnatal day (P) 28 as previously described12 to LKPR mice. Seven to nine weeks after tamoxifen injection, tumours were detected by daily observation and palpation. Mice were euthanized when the endpoint or maximum tumour size was reached or when mice presented signs of distress (see ‘Compliance with ethical regulations’). Skin tumours were measured using a precision calliper. Tumour volumes were measured on the first day of appearance of the tumour and then every week until the death of the animal or every 2 days during chemotherapy assays in combination with anti-netrin-1 antibody. To generate the LKPR-NTN1 model, we crossed the LKPR mice with Rosa26LSL-NTN1 transgenic mice. These mice conditionally overexpress Flag-tagged netrin-1 under the control of a Rosa26 promoter46.
Cell culture
FACS-isolated EPCAM+ and EPCAM− cells were cultured in Modified Eagle Medium (Capricorn Scientific, SP-2002-500 ml) supplemented with 10% fetal bovine serum (FBS) (Serana, S-FBS-SA-015), 4 μg ml-1 hydrocortisone (Sigma, H0888) 1% penicillin/streptomycin (100×) (Capricorn Scientific, PS-B), 2 mM l-glutamine, 2 ml amphotericin B (100×) (Capricorn Scientific, AMP-B) and 500 μl T3 (Sigma, T6397). Cells were washed with Dulbecco’s phosphate buffered saline (PBS 1×) and detached from the cell culture plate with trypsin (Capricorn Scientific, TRY-2B10).
The A549 cell line was donated by R. Derynck and has been used in vitro as model in which EMT is plastic and can be induced by TGFβ19. These cells were cultured in DMEM (Gibco, 11965092) with 10% FBS and 1% penicillin/streptavidin. For EMT induction, cells were plated, deprived in FBS the following day for 24 h, then treated with recombi nant TGFβ1 (Peprotech, 100-21) at 5 μg ml-1 in vitro for 3 days or 6 days (treatment every 2 days) in DMEM 1.5% FBS.
The Ishikawa cell line, a well-differentiated endometrial adenocarcinoma cell line with netrin-1 and UNC5B expression, was purchased from the American Type Culture Collection (ATCC).
They were grown in Minimum Essential Medium (Ozyme, COR10-009-CV), supplemented with 1% of penicillin/streptomycin and 5% FBS at 37 °C with saturating humidity and 5% CO2.
In vitro invasion assays
For invasion assays on Ishikawa cell line, experiments were carried out using the xCELLigence RTCA DP instrument (Agilent, 56665817001), which was placed in a humidified incubator at 37 °C and 5% CO2. Invasion experiments were performed using 16-well integrated Boyden chamber RTCA CIM plates (Agilent, 5665817001). Wells were prepared by depositing 190 μl of cell-free culture medium (5% FBS) in lower chambers and 20 μl of cell-free serum-free culture medium complemented with 2.5% Matrigel (Corning) on the porous membranes. CIM plates were placed in the humidified incubator (37 °C, 5% CO2) for 1 h to let the Matrigel polymerize. Ishikawa cells that had been treated with NP137 or its isotypic control NP001 at 20 ng ml-1 for 72 h were collected, suspended in serum-free medium and counted, and 150,000 cells were seeded in 170 μl serum-free medium complemented with NP137 or its isotypic control NP001 at 20 ng ml-1 in the upper chambers of the CIM plates. The CIM plates were then placed in the xCELLigence RTCA DP instrument and cell invasion was monitored by detection of cells passing through the porous membrane and attaching to the impedance microelectrode in the lower chamber.
In vitro migration assays
For migration assays with EPCAM− cells (primary LKPR mouse skin SCC cell lines), experiments were carried out using Transwell migration plates (6.5 mm Transwell with 8.0 μm pore, Corning, 3422). Cells were deprived in FBS (0.5%) for 12 h before plating in migration plates. Wells were prepared by depositing 150 μl of cell culture medium (10% FBS) in the lower chamber (control or supplemented with NP137 at 20 μg ml-1) and 50 μl serum-free culture medium containing 5,000 cells. Plates were placed in the humidified incubator (37 °C, 5% CO2) for 18 h for migration progression. To detect cells that had passed through the porous membrane, the lower side of Transwell was fixed using fresh PFA (4%). Transwells were washed with PBS and the top sides of the Transwells were cleaned. The lower side of membrane was then stained with 0.2% crystal violet (in 20% methanol) for 20 min. After several washes, migrated cells were counted using an inverted microscope.
Lentiviral transduction using shRNA
HEK 293T cells (ATCC) were used as packaging cells. Transfer plasmid pLKO.1-puro (Sigma) carrying our gene of interest (Unc5b or Ntn1), TRC1 as empty vector and PPAX and PMDG packaging plasmids were transfected into the cells with Lipofectamine 2000 (Thermo Fisher Scientific) using Opti-medium (Capricorn Scientific). The cell line of interest (EPCAM+ primary mouse skin SCC cell lines derived from LKPR mice) was plated and transduced with the lentiviral shRNA with additional polybrene (Sigma, T2-1003G). A puromycin resistance test was performed after transduction.
Anti-netrin-1 treatment of LKPR mice
For in vivo experiments, to determine the effect of anti-netrin-1 on primary tumour progression and metastasis, LKPR mice were treated intraperitoneally with netrin-1 monoclonal antibody at 10 mg kg-1 every 2 days from 4 weeks after tamoxifen injection until the mouse was euthanized (see ‘Compliance with ethical regulations’). 5-FU was used at 10 mg kg-1 and cisplatin was used at 4.4 mg kg-1 once a week for 2 weeks, and mice were treated with anti-netrin-1 every 2 days.
FACS isolation of tumour cells
Skin tumours from LKPR mice were dissected, rinsed and digested in collagenase type I (Sigma) at 3.5 mg ml-1 in HBSS (Gibco) for 1 h at 37 °C on a rocking plate protected from the light. Collagenase was blocked by the addition of EDTA (5 mM), and then the cells were rinsed once in PBS supplemented with 10% FBS and the cell suspension was filtered through a 70-μm cell strainer (BD Bioscience). For the next wash and antibody incubation, cells were resuspended in PBS supplemented with 2% FBS (FACS buffer). For cell sorting, cells were also filtered through a 40-μm cell strainer (BD Bioscience). Cells were incubated with BV711-conjugated anti-EPCAM (rat, clone G8.8, BD Bioscience 563134, dilution 1:100), PE-conjugated anti-CD45 (rat, clone 30-F11, BD, 553081, dilution 1:100) and PE-conjugated anti-CD31 (rat, clone MEC 13.3, BD, 553373, dilution 1:100) antibodies for 30 min at 4 °C protected from light. Living single tumour cells were selected by forward and side scatter, doublet discrimination and Hoescht exclusion. Tumour cells were selected by YFP expression and the exclusion of CD45 and CD31 (Lin−). Different tumour cell subpopulations were defined in EPCAM+ and EPCAM− tumour cells. FACS and analysis were performed using FACSAria and LSRFortessa, using FACSDiva software (v.9.1, BD Bioscience). Sorted cells were collected in culture medium complemented with 50% FBS for in vivo tail vein injection experiments and generation of culture cell lines or lysis buffer for RNA extraction with the RNeasy Micro Kit (Qiagen).
To analyse EPCAM profile on FACS on the EPCAM+ LKPR cell line, cells were washed in PBS and detached from the cell culture plate with trypsin. Cells were resuspended and washed with PBS supplemented with 2% FBS (FACS buffer) and incubated with BV711-conjugated anti-EPCAM (rat, clone G8.8, BD Bioscience 563134, dilution 1:200) 30 min at room temperature and protected from the light. For cell sorting, cells were washed two times in FACS buffer and filtered through a 40-μm cell trainer. Living single YFP+EPCAM+ tumour cells were selected by forward and side scatter, doublet discrimination and Hoescht exclusion.
Metastasis assay
Primary tumours from mice were generated as described above and collected. The FACS-isolated tumour EPCAM− cell subpopulation was resuspended in 50 μl PBS and injected into the tail vein of NOD/SCID/Il2Rγ-null mice (1,000 cells per injection). The mice were treated with NP137 every 2 days (10 mg kg-1) for 1 month. The mice were killed after the last treatment and lungs were analysed. The number of metastases was quantified on ten cryosections per lung (separated by 100 μm) based on YFP expression (skin SCCs tumours) and presented as the number of metastases per lung.
Tumour transplantation assays
Female Swiss nude mice, six weeks of age, were purchased from Janvier Laboratories (France) and maintained in specific pathogen-free conditions (P-PAC) and kept in sterilized filter-topped cages. Their care and housing were in accordance with institutional European guidelines as put forth by the CECCAP local ethical committee as previously described (C2EA-15, CLB_2014_001; CLB_2014_012; CECCAPP_CLB_2016_017). The mice were subcutaneously injected in the flank with Ishikawa cells (5 x 10⁶) suspended in 100 μl of PBS. Tumours were allowed to grow for 15 days. Once tumours reached a volume of 100 mm3, mice were stratified into treatment groups with 1 tumour per mouse based on their tumour volume at the start of the experiment, such that the starting tumour volumes in each group were uniform. Mice were treated via intravenous injection of 100 μl of NP137 or its isotypic control NP001 diluted in PBS at 20 mg kg-1 for 3 days, then 10 mg kg-1 every 2 days thereafter for 1 month. Tumours were measured every 2 days with calipers. Tumour size was calculated using the following formula: tumour volume (in mm3) = (D x d2)/2. D, long dimension; d, short dimension.
A549 tumour cells were pre-treated in vitro with TGFβ1 for 6 days (see ‘Cell culture’ section) and then collected in Matrigel (50%) + PBS (50%) for subcutaneous grafting into NOD/SCID mice (1 × 10⁶ cells per grafting point). Secondary tumours were detected by palpation every week, and their sizes were monitored until they reached 1 cm in size or when mice presented signs of distress. The mice were killed at the same time and tumours were collected for histology analyses.
Immunofluoresence
All staining was performed on frozen sections. Tumour tissues and lungs were pre-fixed in 4% PFA for 2 h at room temperature, rinsed in PBS, incubated overnight in 30% sucrose at 4 °C and embedded in OCT (Tissue Tek) for cryopreservation. Tissues were cut into 6-μm sections using a CM3050S cryostat (Leica Microsystems GmbH) and rinsed with PBS three times (5 min). Non-specific antibody binding was blocked with 5% horse serum, 1% BSA and 0.2% Triton X-100 for 1 h at room temperature. Primary antibodies were incubated overnight at 4 °C in blocking buffer. Sections were rinsed in PBS 3 times (5 min) and incubated with secondary antibodies diluted in blocking buffer at 1:400 for 1 h at room temperature. Nuclei were stained with Hoechst (4 mM) and slides were mounted using SafeMount (Labonord). Image acquisition was performed on a Zeiss Axio Imager.M2 fluorescence microscope with a Zeiss Axiocam MRm camera using Axiovision release 4.8 software. Brightness, contrast and picture size were adjusted using Adobe Photoshop.
Antibodies for immunostaining
The following primary antibodies were used for immunofluorescence: anti-GFP (goat polyclonal, Abcam, ab6673, dilution 1:500), anti-KRT14 (chicken, polyclonal, Thermo Fisher Scientific, MA5-11599, dilution 1:1 000), anti-VIM (rabbit, clone ERP3776 Abcam, ab92547,dilution 1:500), anti-KRT8 (rat, TROMA clone 1/28/21, DSHB, AB_531828, dilution 1:1,000), anti-PDGFRA (rat, clone APA5, eBioscience, 13-1401, dilution 1:500), anti-CDH1 (mouse, clone 67A4, BD, 563570, dilution 1:500) and anti-pan-CK antibody (clone CKAE/1AE3, Dako Belgium, 1:150). The following secondary antibodies were used (dilution 1:400): anti-rabbit, anti-rat, anti-goat or anti-chicken conjugated to Rhodamine Red-X (Jackson ImmunoResearch), Cy5 (Jackson ImmunoResearch) or Alexa Fluor-A488 (Invitrogen).
Immunoblot analysis
Subconfluent cells were washed with cold PBS and lysed in a lysis buffer containing SDS. Lysates were sonicated five times for 10 min each using a Bioruptor Plus (Diagenode, UCD-300) and cellular debris was pelleted by centrifugation (10,000g 15 min at 4 °C). Protein quantifications were carried out using the Pierce 660 nm Protein Assay kit (Thermo Fisher, 22662) with an ionic detergent compatibility reagent (Thermo Fisher, 22663) and measured using a Bio-Rad iMark microplate. Protein extracts containing 30 or 40 μg protein were loaded onto 4-12% SDS-PAGE (Thermo Fisher) and blotted onto nitrocellulose sheets. The membranes were then blocked with 5% non-fat dried milk + 0.05% BSA for 1 h at room temperature and incubated at 4 °C overnight with primary antibodies: anti-NTN1 (rabbit, clone EPR5428, Abcam, ab126729, dilution 1:10,000), anti-CDH1 (mouse, clone 4A2, Cell Signaling, 14472, dilution 1:1,000), anti-VIM (rabbit, clone ERP3776 Abcam, ab92547, dilution 1:1,000) and anti-β-actin (rabbit, Abcam, ab8227, dilution 1:2,000). After three washes with PBS-T, it was followed by incu bation 1 h incubation with anti-rabbit secondary antibody (antirabbit IgG HRP NA9340V, 1:5,000, Sigma Aldrich, Gena9340) at room temperature. After washing in TBS-T, immunoreactive antibody-antigen complexes were visualized with enhanced chemiluminescence reagents, West Dura or ECL Chemiluminescence System (Pierce). Membranes were imaged using iBright FL1500, Invitrogen.
RNA fluorescence in situ hybridization
All staining was performed on frozen sections or on cytospin. Tumour tissues were pre-fixed in 4% paraformaldehyde for 2 h at room temperature, rinsed in PBS, incubated overnight in 30% sucrose at 4 °C and embedded in OCT (Tissue Tek) for cryopreservation. Cytospin cell cultures were generated using CellspinI (Tharmac) (20,000 cells for one cytospin). The in situ protocol was performed according to the manufacturer’s instructions (Advanced Cell Diagnostics). The following mouse probes were used: Mm-Aqp1 (504741-C2), Mm-Nrp1 (471621), Mm-Aqp5, (430021-C2), Mm-Vim (457961-C2) and Mm-Krt14 (422521-C3). The LSM-780 (Carl Zeiss) confocal system and ZEN2012 software were used to acquire and analyse the images.
Bulk RNA-seq
RNA quality was evaluated by Bioanalyzer 2100 (Agilent) before sequencing. Indexed cDNA libraries were obtained using Ovation Solo RNA-seq Systems (NuGen) according to the manufacturer’s recommendations. The multiplexed libraries (11 pM or 18 pM) were loaded onto flow cells and sequences were produced using a HiSeq PE Cluster Kit v4 and TruSeq SBS Kit v3-HS (250 cycles) on a Novaseq 6000 (Illumina). Approximately 20 million paired-end reads per sample were generated and quality checks were performed with FastQC (https://www.bioinformatics.babraham.ac.uk/projects/fastqc/). The adapter sequences and low-quality regions were trimmed by Trimmomatic. Trimmed reads were mapped against the mouse reference genome (Grcm38/mm10) using STAR software to generate read alignments. Duplicated reads were removed by Picard MarkDuplicates. Annotations for Grcm38.87 were obtained from ftp://ftp.ensembl.org/. After transcript assembly, gene level counts were obtained using HTseq and normalized to 20 million of aligned reads. Average expression for each gene in the different sample was computed using two biological replicates and fold changes were calculated between control sample (empty vector) and sample of interest (Ntn1 knockdown or Unc5b knockdown). Genes for which all the mean expressions across the sample were lower than 100 reads per million mapped reads were considered not expressed and removed from further analysis. Genes having a fold change of expression greater than or equal to 2 were considered upregulated and those having a fold change of expression lower than or equal to 0.5 were considered downregulated.
RNA extraction and real-time PCR
RNA was extracted from FACS-isolated cells or culture cell lines using RNeasy micro kit (QIAGEN) according to the manufacturer’s recommendations. For real-time PCR, after mRNA quantification using Nanodrop1000, the first-strand cDNA was synthesized using Superscript II (Invitrogen) and random hexamers (Roche) in 50 μl final volume. Control of genomic contamination was measured for each sample by performing the same procedure with or without reverse transcriptase. Quantitative PCR assays were performed using 1 ng cDNA as template and SYBRGreen mix (Applied Bioscience) on a Light Cycler 96 (Roche) real-time PCR system. Tbp or HPRT housekeeping genes were used for normalization. The following probes were used: Ntn1 forward: GCAAGCTGAAGATGAACATGA, Ntn1 reverse: CTTT GTCGGCCTTCAGGAT, Unc5b forward: TTCCAGCTGCACACAACG, Unc5b reverse: GCAGAGCAGAGAGCATCCA, Tbp forward: TGTAC CGCAGCTTCAAAATATTGTAT, Tbp reverse: AAATCAACGCAGTTGTC CGTG, NTN1 forward: AAAAGTACTGCAAGAAGGACTATGC, NTN1 reverse: CCCTGCTTATACACGGAGATG, CDHl forward: CCCGG GACAACGTTTATT, CDHl reverse: GCTGGCTCAAGTCAAAGTCC, HOOK1 forward: TGCTGCTGAGATTATGCCAGTGGA, HOOK1 reverse: TCAGC CTCTGCTCAGTTTCCAGT, MUC1 forward: GCCAGGATCTGTGGTG GTACAAT, MUC1 reverse: TGTCTCCAGGTCGTGGACATTGAT, HPRT forward: TGACCTTGATTTATTTTGCATACC, HPRT reverse: CGAGCAA GACGTTCAGTCCT.
Single-cell transcriptomic data analysis
Single-cell RNA library preparation and gene expression analysis
After FACS isolation, living cells from fresh LKPR control and anti-netrin-1 treated skin SCC tumours were sorted and loaded onto each channel of the Chromium Single Cell 3' microfluidic chips (V2-chemistry, 10x Genomics) and individually barcoded with a 10x Chromium controller according to the manufacturer’s recommendations (10x Genomics). RNA from the barcoded cells was reverse transcribed, followed by amplification. The libraries were prepared using the Chromium Single Cell 3’ Library Kit (V2-chemistry, 10x Genomics), quantified using a low coverage Illumina NextSeq 550 run and sequenced on an Illumina NovaSeq. CellRanger (v3.0.2) was used with the default parameters to demultiplex, align, and annotate the obtained sequencing reads with the 10x Genomics mm10-3.0.0 reference dataset extended with the Yfp transgene. The Seurat R package was used to perform further downstream analysis of the gene expression matrices for the treated and control samples separately47 (v3.1.5). Only cells passing the following criteria were considered for further analysis: between 600 and 8,000 uniquely expressed genes and less than 25% of the unique molecular identifier counts mapping to mitochondrial sequences. For the treated samples (NP137 1 and NP137 2), respectively, 16,926 of the 19,288 cells and 14,104 of 17,620 passed quality control. For the control samples (control 1 and control 2), respectively, 10,986 of the 12,180 cells and 5,248 of the 8,327 cells were considered for downstream analysis.
scRNA-seq clustering leading to cell types
Default parameters of Seurat were used unless mentioned otherwise. Before determining the cell cycle state, the read counts were log-normalized and scaled. The scaled expression data for the 2,000 most highly variable genes (HVG) (identified using Seurat’s FindVariableGenes function) served as input for principal component analysis (PCA). Next, the JackStraw methodology implemented in Seurat was used to determine the number of significant principal components for Leiden clustering48 and UMAP dimensionality reduction (maximum of 30 principal components). Clustering resolutions ranging from 0.1-1.0 with steps of 0.1 were assessed for stability with the clustree49 R package (v0.4.2). The lowest stable resolution was chosen for a general overview of the cell types present in both conditions (control: 0.1 and treated: 0.2). Following that, the Wilcoxon rank sum was used to identify marker genes for each subcluster, only reporting genes that were expressed in at least 25% of the cells in the cluster and had an average log fold change of at least 0.25. Batch integration was performed per condition using Harmony50 (v1.0) with standard parameters. Cell-type clusters were subsequently annotated using Seurat’s module scoring function and cell-type-specific marker genes obtained from the PanglaoDB51 database (version of 27/03/2020). Our annotations were further confirmed by plotting the expression of canonical cell markers as Ptprc for immune cells, Pecam for endothelial cells, Cd3d for T cells and Col6a3 for CAFs. The clusters containing the tumour cells were characterized by expression of the Yfp transgene. Afterwards, the two datasets, except for the tumour cells, were integrated using Harmony with 30 principal components, and standard parameters or Leiden clustering was subsequently performed in steps of 0.1 for resolutions ranging from 0.1 to 1.0. The clustree R package was then used to determine the lowest stable resolution (0.2). Cell-type clusters were then annotated in the same way as previously described. To compare the abundance of the identified cell types between the control and treated conditions, we used the scCODA algorithm52 implemented in the pertpy v4.0 Python package using the pericytes as the reference cell type and a FDR threshold of 0.2.
scRNA-seq clustering leading to cell subtypes for CAFs
After being rescaled, the combined CAFS cluster across the conditions was further subclustered by using the top 2,000 HVGs as input for PCA analysis. The number of significant principal components for clustering and UMAP calculation, which ranged from 1 to 30, was determined using the JackStraw methodology. Seurat’s AddModuleScore was then used to identify clusters with a high enrichment of PanglaoDB-derived marker genes for other cell types using a resolution of 0.4 for the Leiden clustering. Following the removal of these clusters, the previous analysis steps were repeated, and stable clustering resolutions for the treated condition were determined using clustree. A resolution of 0.3 was used for the identification of the final CAF subclusters. Harmony was used with standard parameters to perform batch integration. The mouse MSigDB hallmark gene sets and the AUCell R package (v1.8.0). were used to calculate pathway activities. Clusters were assigned the apCAF, iCAF or myCAF label using Seurat’s AddModuleScore function and the signatures obtained from Elyada et al.53 Compositional analysis between the control and treated condition was performed with the scCODA algorithm, implemented in the pertpy v4.0 Python package using the ‘glycolytic CAFS’ as the reference and a FDR threshold of 0.2.
scRNA-seq clustering leading to EMT states for YFP-positive cells and pseudotime analysis
For both conditions, all YFP-positive cells (defined as at least having two transcripts assigned to the YFP transgene) were subclustered. The top 2,000 variable genes were used as input for PCA analysis after the counts were rescaled. The JackStraw methodology was then used to calculate the number of significant principal components in a range of 1 to 30. The lowest stable clustering resolution per condition was determined using clustree (control: 0.1, treated: 0.3). Based on PanglaoDB-derived marker genes, the AddModuleScore was used to score clusters that showed an enrichment of expression signatures related to other cell types. Following the removal of these clusters, the preceding steps were repeated, with clustering resolutions of 0.7 and 0.6 used for the control and treated conditions, respectively. Subsequently the obtained clusters were scored as epithelial (Epcam+Krt14+Vim−), early hybrid (Epcam−Krt14+Vim+), late hybrid (EpcamrKrt14−Krt8+Vim+Pdgfra−) or full EMT (Epcam−Krt14−Krt8−Vim+Pdgfra+−) based on the expression of Epcam, Krt14, Krt8, Vim and Pdgfra. The mouse MSigDB hallmark gene sets and the AUCell R package38 (v1.8.0). were used to analyse pathway activities. Before performing the Wilcoxon rank-sum test with Bonferroni correction for multiple testing between conditions, the AUC distributions were normalized per sample using linear regression. To compare the abundance of the identified cell subtypes and cell cycle distribution per EMT state between the control and treated conditions, the scCODA algorithm of the pertpy v4.0 Python package was used with the early hybrid EMT state as reference a FDR threshold of 0.2. Harmony with standard parameters was used for batch integration per condition. Pseudotime ordering of YFP-positive cells in the G1 cell-phase was calculated using monocle54 (v2.14.0) with the DDRtree (v0.1.5) method for dimensionality reduction on the top 2,000 HVGs for each condition, controlling for sample effects. The dynplot55 R-package (v1.0.2) was used to create the trajectory plots.
Visium spatial transcriptomic analysis
To analyse the spatial distribution and localization of different EMT tumour states previously described by scRNA-seq in control and anti-netrin-1-treated skin SCC tumours, we used 10x Visium technology for spatial transcriptomic analysis (10x Genomics). FFPE tissue section were places on Visium slides and prepared according to 10x Genomics protocols. After haematoxylin and eosin staining, imaging and decrosslinking steps, tissue sections were incubated with human specific probes targeting 10,551 genes (10x Genomics, Visium Mouse Transcriptome Probe Set v1.0). Probes hybridized on mRNA were captured onto Visium slides and gene expression libraries were prepared following the provided protocol and sequencing on an Illumina Novaseq 6000 with 50,000 reads per spot targeted sequencing depth. For each FFPE section, FASTQ files and histology images were processed using 10x Space Ranger v2.0 to obtain the matrix associated with each spot. The SCutility method was used to perform the analysis. Briefly, filtered matrices were loaded and merged per sample, and spots with less than 1,000 detected genes were removed.
EMT score
Three signatures were used to assess the EMT level. The Hallmark signature was computed using ssGSEA41 on the genes from the HALLMARK_EPITHELIAL_MESENCHYMAL_TRANSITION signature from MSigDB38. The Thiery signature was computed similarly using genes from ref. 11. The Mak signature was calculated from gene sets in ref. 40 as the difference of two signatures: a mesenchymal signature defined as the mean of mesenchymal gene expression and an epithelial signature defined as the mean of epithelial gene expression.
Statistical analysis
All statistical analyses are based on biological replicates (n indicated in the text, figures or figure legends). Multiple unpaired t-tests were per-formed using GraphPad Prism version 9.00 for Mac software. Bar graphs and dot plots were generated with mean ± s.e.m with GraphPad Prism. Wilcoxon rank-sum test and Fisher test with Bonferroni correction were used for multiple analyses in scRNA-seq.
Extended Data
Extended data 1. Strategy to study the impact of Netrin-1 on EMT in mouse skin SCCs.
a, Mouse model of skin SCC allowing the expression of KrasG12D, YFP, p53 deletion and overexpression of human NETRIN-1 in hair follicle stem cells and their progeny using Lgr5CreER. b, Relative mRNA expression of NTN1 in EPCAM-control LKPR (n = 5) and LKPR-NTN1 (n = 8) skin SCC defined by qRT-PCR (data are normalized to Tbp gene, mean ± s.e.m., two tailed Mann-Whitney U test). c, Western blot analysis of Netrin-1 expression in EPCAM-control LKPR and LKPR-NTN1 skin SCC TCs. d, FACS plots showing the gating strategy used to FACS-isolate or to analyse the proportion of YFP+/ EPCAM+ and EPCAM− tumour cells. e, Drawing showing the experimental strategy of NP137 administration after Tamoxifen induction in Lgr5CreER/ KrasLSL-G12D/p53 fl/fl/Rosa26-YFP+/+ mice. IP, intraperitoneal.
Extended data 2. Single cell analysis of the cellular composition of control and NP137-treated skin SCCs.
a,b Uniform Manifold Approximation and Projection (UMAP) plot for control (a) and NP137-treated skin SCC (b) coloured by the identified cell types. c,d, UMAP plot for control (c) and NP137-treated skin SCC (d) coloured by the sample of origin for each cell. CAFs, cancer-associated fibroblasts.
Extended data 3. Annotation of the cell types found by single cell RNA-seq in control and NP137-treated skin SCCs.
a, UMAP plots coloured by normalized Yfp and Epcam expression in the control tumours. Gene expression values are visualized as colour gradient with grey indicating no expression and red indicating the maximum expression. b, UMAP plots coloured by normalized Yfp and Epcam in NP137-treated samples. c, UMAP plots coloured by the activity of modules containing the mouse-specific marker genes of the different cell types including CAFs, Macrophages, Neutrophils, Endothelial cells and T cells obtained from the PanglaoDB database in control samples (left) and anti-Netrin-1 treated samples (right). Module activity visualized as a colour gradient with blue indicating no expression and yellow indicating maximum activity. d, UMAP plots coloured by normalized Pdgfra, Acta2, Pecam1, Cd3d, Ptprc, Itgam, Cd86 and Cxcr2 expression in the control samples (left) and NP137-treated samples (right). CAFs, cancer-associated fibroblasts. e, UMAP plot coloured by normalized Ntn1 expression in control condition.
Extended data 4. Impact of anti-Netrin antibody administration on the cellular composition of skin SCCs.
a,b, Uniform Manifold Approximation and Projection (UMAP) plots coloured by the cell type labels obtained from the analysis of the microenvironment for the integration of all the samples in total (a) and split per sample (b), respectively. c, Boxplot depicting the proportions of the different cell types for the 4 samples, split by their condition. The boxplots are coloured by their condition, and the individual measurements are visualized as red dots. The centre line, top and bottom of the boxplots represent respectively the median, 25th and 75th percentile and whiskers are 1.5 x IQR. Significant proportion changes are indicated by FDR < 0.2. d, barplot depicting the relative log fold change of the relative abundance of the different cell types after NP137-treated samples compared to the pericytes. Bars are coloured according to their cell type. e,f, UMAP plot of the CAFS subclustering, coloured by the identified seven subclusters and the sample the cell originated from, respectively. g, Boxplot depicting the proportions of the different CAF subclusters for the 4 samples, split by their condition. The boxplots are coloured by their condition, and the individual measurements are visualized as red dots. The centre line, top and bottom of the boxplots represent respectively the median, 25th and 75th percentile and whiskers are 1.5 x IQR. h. barplot depicting the relative log fold change of the relative abundance of the different CAF subclusters after NP137 treatment compared to the glycolysis CAFs subcluster. i, Co-immunostaining of YFP and Vimentin in control (top) (n = 5 tumours) and NP137-treated skin SCC (bottom) (n = 5 tumours) that defines YFP-/VIM+ CAFs as cells (Scale bars, 20 μm).
Extended data 5. Expression of markers of the different EMT states in control and NP137-treated skin SCCs.
a, b, UMAP plots coloured by normalized gene expression values for the indicated genes in the control (a) and treated samples (b). Gene expression values are visualized as colour gradient with grey indicating no expression and red indicating the maximum expression. Circles represent TCs groups with a different degree of EMT based on the expression of Epcam, Krt14, Krt8, Vim, Pdg fra (green: Epcam+/Krt14+/Vim- as epithelial state; orange: Epcam-/Krt14+/Vim+ as early hybrid EMT state; red: Epcam-/ Krt14-/Krt8+/Vim+ as late hybrid EMT state; dark red: Epcam-/Krt14-/Krt8-/ Vim+ as late full EMT state expressing Pdg fra and Aqp1). c, Barplot depicting the relative log fold change of the relative abundance of the different EMT states after NP137-treatment compared to the early hybrid state. Significant proportion changes are indicated by FDR < 0.2.
Extended data 6. Histological analysis of the control and NP137-treated tumors.
a-d, Haematoxylin and Eosin staining showing the control (n = 1) (a,b) or NP137-treated (n = 1) (c,d) tumour skin SCC analysed in Visium spatial transcriptomic method. The annotated areas represent the EMT states previously defined by the expression of Epcam, Krt14, Krt8 and Vim (1: epithelial, 2: early hybrid, 3, late hybrid, 4: full late EMT) (scale bars in a, c, 500 μm, scale bars in b, 20 μm).
Extended data 7. Analysis of NP137 treatment on tumour growth, EMT and migration in endometrial human cancer cell line.
a, Tumor growth quantification of human Ishikawa endometrial carcinoma cells grafted in nude mice treated with either control (n = 9) or NP137 (n = 9) (mean ± s.e.m., 2-way ANOVA). b, Relative mRNA expression of epithelial markers CDH1, MUC1 and HOOK1 by qRT-PCR in Ishikawa human cells grafted in nude mice treated with control (n = 7) or NP137 (n = 8) (data are normalized to HPRT gene, mean +/- s.e.m., two tailed Mann-Whitney U test). c, Percentage of migrated Ishikawa cells treated with NP137 relative to the migration of control condition through serum deprived culture medium complemented with 2.5% Matrigel between 5 and 24 h of invasion. (n = 3) (mean ± s.e.m, two tailed t test).
Supplementary Material
Acknowledgments
The authors thank the ULB animal facility; ULB genomic core facility (F. Libert and A. Lefort) for bulk RNA-seq and scRNA-seq; the Gilles Thomas bioinformatic platform; Centre de Recherche en Cancérologie de Lyon, Fondation Synergie Lyon cancer for the spatial transcriptomic sequencing; S. Bottieau for technical assistance; F. Lavial for Unc5b shRNA; and R. Derynck for the A549 cell line. J.L. is supported by NETRIS Pharma. I.P. is supported by FNRS and WELBIO. S.V. is supported by a PhD fellowship for Strategic Basic Research (1S93320N) from the Research Foundation Flanders (FWO). C. Decaestecker is a senior Research Associate with Fond National de la Recherche Scientifique (FNRS, Brussels, Belgium). DIAPath and the Department of Pathology are supported by the Fonds Yvonne Boёl. The CMMI is supported by the European Regional Development Fund and the Walloon region (Wallonia-biomed; grant no. 411132-957270; project “CMMI-ULB” support the Center for Microscopy and Molecular Imaging and its DIAPath department). C.B. is supported by WELBIO, FNRS, TELEVIE, Fondation Contre le Cancer, ULB Foundation, Foundation Baillet Latour, FNRS/ FWO EOS (40007513) and the European Research Council (AdvGrant 885093). This work was also supported by institutional grants from CNRS, University of Lyon1, Centre Léon Bérard and from the Ligue Contre le Cancer, INCA, ARC Sign’it and ANR (nos. ANR-10-LABX-0061, ANR-17-CONV-0002 and ANR-18-RHUS-0009).
Footnotes
Author Contribution
J.L., I.P., S.V. and C.B. designed the experiments and performed data analysis. J.L. and I.P. performed most of the biological experiments. S.V. performed most of bioinformatic analysis for single-cell sequencing. N.R., Y.S. and A.S. helped with bioinformatic analysis. J.V.H. helped with 10x single-cell sequencing. R.M.S. helped with RNAscope analysis. V.M., A. Boinet., S.S., S.L., S.G. and S.B. helped with cell culture experiments, immunostaining,blocking antibody injection and follow-up with the mice. I.S., J.A., E.Z., C. Decaestecker. and A.C. performed immunostaining and quantification of EMT in human cancer samples. B.D., M.B. and N.B. performed biological in vivo and in vitro experiments on Ishikawa endometrial cell lines. C.S. and D.V. performed bioanalysis from TCGA. C. Dubois performed FACS sorting. T.V. helped and supervised the single-cell data analysis. P.M. and A. Bernet helped with the design of the experiments, data analysis and provided NP137 antibody. All authors read and approved the final manuscript.
Competing interests
A. Bernet and P.M. declare a conflict of interest as founders and shareholders of NETRIS Pharma. J.L., P.M., B.D., M.B. and N.B. declare a conflict of interest as employees of NETRIS Pharma. A. Bernet. and N.R. declare a conflict of interest as consultants for NETRIS. T.V. is co-inventor on licensed patents WO/2011/157846 (Methods for Haplotyping Single Cells), WO/2014/053664 (High-Throughput Genotyping by Sequencing Low Amounts of Genetic Material) and WO/2015/028576 (Haplotyping and Copy Number Typing Using Polymorphic Variant Allelic Frequencies).
Data Availability Statement
All raw data sequencing data for mouse RNA-seq, single cell RNA-seq and 10x Visium have been deposited in the gene expression Omnibus with the following accession number: GSE234267. Source data are provided with this paper.
References
- 1.Ye X, Weinberg RA. Epithelial-Mesenchymal Plasticity: A Central Regulator of Cancer Progression. Trends Cell Biol. 2015;25:675–686. doi: 10.1016/j.tcb.2015.07.012. [DOI] [PMC free article] [PubMed] [Google Scholar]
- 2.Shibue T, Weinberg RA. EMT, CSCs, and drug resistance: the mechanistic link and clinical implications. Nat Rev Clin Oncol. 2017;14:611–629. doi: 10.1038/nrclinonc.2017.44. [DOI] [PMC free article] [PubMed] [Google Scholar]
- 3.Lambert AW, Weinberg RA. Linking EMT programmes to normal and neoplastic epithelial stem cells. Nat Rev Cancer. 2021;21:325–338. doi: 10.1038/s41568-021-00332-6. [DOI] [PubMed] [Google Scholar]
- 4.Puisieux A, Brabletz T, Caramel J. Oncogenic roles of EMT-inducing transcription factors. Nat Cell Biol. 2014;16:488–494. doi: 10.1038/ncb2976. [DOI] [PubMed] [Google Scholar]
- 5.Brabletz S, Schuhwerk H, Brabletz T, Stemmler MP. Dynamic EMT: a multi-tool for tumor progression. EMBO J. 2021;40:e108647. doi: 10.15252/embj.2021108647. [DOI] [PMC free article] [PubMed] [Google Scholar]
- 6.Pastushenko I, Blanpain C. EMT Transition States during Tumor Progression and Metastasis. Trends Cell Biol. 2019;29:212–226. doi: 10.1016/j.tcb.2018.12.001. [DOI] [PubMed] [Google Scholar]
- 7.Nieto MA, Huang RY, Jackson RA, Thiery JP. Emt: 2016. Cell. 2016;166:21–45. doi: 10.1016/j.cell.2016.06.028. [DOI] [PubMed] [Google Scholar]
- 8.Kasai H, Allen JT, Mason RM, Kamimura T, Zhang Z. TGF-beta1 induces human alveolar epithelial to mesenchymal cell transition (EMT) Respir Res. 2005;6:56. doi: 10.1186/1465-9921-6-56. [DOI] [PMC free article] [PubMed] [Google Scholar]
- 9.Kim JH, et al. Transforming growth factor beta1 induces epithelial-to-mesenchymal transition of A549 cells. J Korean Med Sci. 2007;22:898–904. doi: 10.3346/jkms.2007.22.5.898. [DOI] [PMC free article] [PubMed] [Google Scholar]
- 10.Voon DC, Huang RY, Jackson RA, Thiery JP. The EMT spectrum and therapeutic opportunities. Mol Oncol. 2017;11:878–891. doi: 10.1002/1878-0261.12082. [DOI] [PMC free article] [PubMed] [Google Scholar]
- 11.Tan TZ, et al. Epithelial-mesenchymal transition spectrum quantification and its efficacy in deciphering survival and drug responses of cancer patients. EMBO Mol Med. 2014;6:1279–1293. doi: 10.15252/emmm.201404208. [DOI] [PMC free article] [PubMed] [Google Scholar]
- 12.Lapouge G, et al. Skin squamous cell carcinoma propagating cells increase with tumour progression and invasiveness. EMBO J. 2012;31:4563–4575. doi: 10.1038/emboj.2012.312. [DOI] [PMC free article] [PubMed] [Google Scholar]
- 13.Latil M, et al. Cell-Type-Specific Chromatin States Differentially Prime Squamous Cell Carcinoma Tumor-Initiating Cells for Epithelial to Mesenchymal Transition. Cell Stem Cell. 2017;20:191–204.:e195. doi: 10.1016/j.stem.2016.10.018. [DOI] [PMC free article] [PubMed] [Google Scholar]
- 14.Pastushenko I, et al. Identification of the tumour transition states occurring during EMT. Nature. 2018;556:463–468. doi: 10.1038/s41586-018-0040-3. [DOI] [PubMed] [Google Scholar]
- 15.Paradisi A, et al. Combining chemotherapeutic agents and netrin-1 interference potentiates cancer cell death. EMBO Mol Med. 2013;5:1821–1834. doi: 10.1002/emmm.201302654. [DOI] [PMC free article] [PubMed] [Google Scholar]
- 16.Paradisi A, et al. Netrin-1 up-regulation in inflammatory bowel diseases is required for colorectal cancer progression. Proc Natl Acad Sci U S A. 2009;106:17146–17151. doi: 10.1073/pnas.0901767106. [DOI] [PMC free article] [PubMed] [Google Scholar]
- 17.Paradisi A, et al. NF-kappaB regulates netrin-1 expression and affects the conditional tumor suppressive activity of the netrin-1 receptors. Gastroenterology. 2008;135:1248–1257. doi: 10.1053/j.gastro.2008.06.080. [DOI] [PubMed] [Google Scholar]
- 18.Fitamant J, et al. Netrin-1 expression confers a selective advantage for tumor cell survival in metastatic breast cancer. Proc Natl Acad Sci U S A. 2008;105:4850–4855. doi: 10.1073/pnas.0709810105. [DOI] [PMC free article] [PubMed] [Google Scholar]
- 19.Delloye-Bourgeois C, et al. Netrin-1 acts as a survival factor for aggressive neuroblastoma. J Exp Med. 2009;206:833–847. doi: 10.1084/jem.20082299. [DOI] [PMC free article] [PubMed] [Google Scholar]
- 20.Sung PJ, et al. Cancer-Associated Fibroblasts Produce Netrin-1 to Control Cancer Cell Plasticity. Cancer Res. 2019;79:3651–3661. doi: 10.1158/0008-5472.CAN-18-2952. [DOI] [PubMed] [Google Scholar]
- 21.Park KW, et al. The axonal attractant Netrin-1 is an angiogenic factor. Proc Natl Acad Sci U S A. 2004;101:16210–16215. doi: 10.1073/pnas.0405984101. [DOI] [PMC free article] [PubMed] [Google Scholar]
- 22.Arakawa H. Netrin-1 and its receptors in tumorigenesis. Nat Rev Cancer. 2004;4:978–987. doi: 10.1038/nrc1504. [DOI] [PubMed] [Google Scholar]
- 23.Brisset M, Grandin M, Bernet A, Mehlen P, Hollande F. Dependence receptors: new targets for cancer therapy. EMBO Mol Med. 2021;13:e14495. doi: 10.15252/emmm.202114495. [DOI] [PMC free article] [PubMed] [Google Scholar]
- 24.Hao W, et al. The pan-cancer landscape of netrin family reveals potential oncogenic biomarkers. Sci Rep. 2020;10:5224. doi: 10.1038/s41598-020-62117-5. [DOI] [PMC free article] [PubMed] [Google Scholar]
- 25.Dumartin L, et al. Netrin-1 mediates early events in pancreatic adenocarcinoma progression, acting on tumor and endothelial cells. Gastroenterology. 2010;138:1595–1606.:1606 e1591-1598. doi: 10.1053/j.gastro.2009.12.061. [DOI] [PubMed] [Google Scholar]
- 26.Kefeli U, et al. Netrin-1 in cancer: Potential biomarker and therapeutic target? Tumour Biol. 2017;39:1010428317698388. doi: 10.1177/1010428317698388. [DOI] [PubMed] [Google Scholar]
- 27.Haerinck J, Berx G. Partial EMT takes the lead in cancer metastasis. Dev Cell. 2021;56:3174–3176. doi: 10.1016/j.devcel.2021.11.012. [DOI] [PubMed] [Google Scholar]
- 28.Simeonov KP, et al. Single-cell lineage tracing of metastatic cancer reveals selection of hybrid EMT states. Cancer Cell. 2021;39:1150–1162.:e1159. doi: 10.1016/j.ccell.2021.05.005. [DOI] [PMC free article] [PubMed] [Google Scholar]
- 29.Yang J, et al. Guidelines and definitions for research on epithelial-mesenchymal transition. Nat Rev Mol Cell Biol. 2020;21:341–352. doi: 10.1038/s41580-020-0237-9. [DOI] [PMC free article] [PubMed] [Google Scholar]
- 30.Jin X, et al. Netrin-1 interference potentiates epithelial-to-mesenchymal transition through the PI3K/AKT pathway under the hypoxic microenvironment conditions of non-small cell lung cancer. Int J Oncol. 2019;54:1457–1465. doi: 10.3892/ijo.2019.4716. [DOI] [PubMed] [Google Scholar]
- 31.Zhang X, et al. Netrin-1 elicits metastatic potential of non-small cell lung carcinoma cell by enhancing cell invasion, migration and vasculogenic mimicry via EMT induction. Cancer Gene Ther. 2018;25:18–26. doi: 10.1038/s41417-017-0008-8. [DOI] [PubMed] [Google Scholar]
- 32.Yan W, et al. Netrin-1 induces epithelial-mesenchymal transition and promotes hepatocellular carcinoma invasiveness. Dig Dis Sci. 2014;59:1213–1221. doi: 10.1007/s10620-013-3016-z. [DOI] [PubMed] [Google Scholar]
- 33.Han P, et al. Netrin-1 promotes cell migration and invasion by down-regulation of BVES expression in human hepatocellular carcinoma. Am J Cancer Res. 2015;5:1396–1409. [PMC free article] [PubMed] [Google Scholar]
- 34.Revenco T, et al. Context Dependency of Epithelial-to-Mesenchymal Transition for Metastasis. Cell Rep. 2019;29:1458–1468.:e1453. doi: 10.1016/j.celrep.2019.09.081. [DOI] [PubMed] [Google Scholar]
- 35.DeConti RC. Chemotherapy of squamous cell carcinoma of the skin. Semin Oncol. 2012;39:145–149. doi: 10.1053/j.seminoncol.2012.01.002. [DOI] [PubMed] [Google Scholar]
- 36.Khansur T, Kennedy A. Cisplatin and 5-fluorouracil for advanced locoregional and metastatic squamous cell carcinoma of the skin. Cancer. 1991;67:2030–2032. doi: 10.1002/1097-0142(19910415)67:8<2030::aid-cncr2820670803>3.0.co;2-k. [DOI] [PubMed] [Google Scholar]
- 37.Chen QY, et al. miR-206 regulates cisplatin resistance and EMT in human lung adenocarcinoma cells partly by targeting MET. Oncotarget. 2016;7:24510–24526. doi: 10.18632/oncotarget.8229. [DOI] [PMC free article] [PubMed] [Google Scholar]
- 38.Liberzon A, et al. The Molecular Signatures Database (MSigDB) hallmark gene set collection. Cell Syst. 2015;1:417–425. doi: 10.1016/j.cels.2015.12.004. [DOI] [PMC free article] [PubMed] [Google Scholar]
- 39.Grandin M, et al. Structural Decoding of the Netrin-1/UNC5 Interaction and its Therapeutical Implications in Cancers. Cancer Cell. 2016;29:173–185. doi: 10.1016/j.ccell.2016.01.001. [DOI] [PubMed] [Google Scholar]
- 40.Mak MP, et al. A Patient-Derived, Pan-Cancer EMT Signature Identifies Global Molecular Alterations and Immune Target Enrichment Following Epithelial-to-Mesenchymal Transition. Clin Cancer Res. 2016;22:609–620. doi: 10.1158/1078-0432.CCR-15-0876. [DOI] [PMC free article] [PubMed] [Google Scholar]
- 41.Subramanian A, et al. Gene set enrichment analysis: a knowledge-based approach for interpreting genome-wide expression profiles. Proc Natl Acad Sci U S A. 2005;102:15545–15550. doi: 10.1073/pnas.0506580102. [DOI] [PMC free article] [PubMed] [Google Scholar]
- 42.Srinivas S, et al. Cre reporter strains produced by targeted insertion of EYFP and ECFP into the ROSA26 locus. BMC Dev Biol. 2001;1:4. doi: 10.1186/1471-213x-1-4. [DOI] [PMC free article] [PubMed] [Google Scholar]
- 43.Barker N, et al. Identification of stem cells in small intestine and colon by marker gene Lgr5. Nature. 2007;449:1003–1007. doi: 10.1038/nature06196. [DOI] [PubMed] [Google Scholar]
- 44.Tuveson DA, et al. Endogenous oncogenic K-ras(G12D) stimulates proliferation and widespread neoplastic and developmental defects. Cancer Cell. 2004;5:375–387. doi: 10.1016/s1535-6108(04)00085-6. [DOI] [PubMed] [Google Scholar]
- 45.Jonkers J, et al. Synergistic tumor suppressor activity of BRCA2 and p53 in a conditional mouse model for breast cancer. Nat Genet. 2001;29:418–425. doi: 10.1038/ng747. [DOI] [PubMed] [Google Scholar]
- 46.Boussouar A, et al. Netrin-1 and Its Receptor DCC Are Causally Implicated in Melanoma Progression. Cancer Res. 2020;80:747–756. doi: 10.1158/0008-5472.CAN-18-1590. [DOI] [PubMed] [Google Scholar]
- 47.Satija R, Farrell JA, Gennert D, Schier AF, Regev A. Spatial reconstruction of single-cell gene expression data. Nat Biotechnol. 2015;33:495–502. doi: 10.1038/nbt.3192. [DOI] [PMC free article] [PubMed] [Google Scholar]
- 48.Traag VA, Waltman L, van Eck NJ. From Louvain to Leiden: guaranteeing well-connected communities. Sci Rep. 2019;9:5233. doi: 10.1038/s41598-019-41695-z. [DOI] [PMC free article] [PubMed] [Google Scholar]
- 49.Zappia L, Oshlack A. Clustering trees: a visualization for evaluating clusterings at multiple resolutions. Gigascience. 2018;7 doi: 10.1093/gigascience/giy083. [DOI] [PMC free article] [PubMed] [Google Scholar]
- 50.Korsunsky I, et al. Fast, sensitive and accurate integration of single-cell data with Harmony. Nat Methods. 2019;16:1289–1296. doi: 10.1038/s41592-019-0619-0. [DOI] [PMC free article] [PubMed] [Google Scholar]
- 51.Franzen O, Gan LM, Bjorkegren JLM. PanglaoDB: a web server for exploration of mouse and human single-cell RNA sequencing data. Database (Oxford) 2019;2019 doi: 10.1093/database/baz046. [DOI] [PMC free article] [PubMed] [Google Scholar]
- 52.Buttner M, Ostner J, Muller CL, Theis FJ, Schubert B. scCODA is a Bayesian model for compositional single-cell data analysis. Nat Commun. 2021;12:6876. doi: 10.1038/s41467-021-27150-6. [DOI] [PMC free article] [PubMed] [Google Scholar]
- 53.Elyada E, et al. Cross-Species Single-Cell Analysis of Pancreatic Ductal Adenocarcinoma Reveals Antigen-Presenting Cancer-Associated Fibroblasts. Cancer Discov. 2019;9:1102–1123. doi: 10.1158/2159-8290.CD-19-0094. [DOI] [PMC free article] [PubMed] [Google Scholar]
- 54.Trapnell C, et al. The dynamics and regulators of cell fate decisions are revealed by pseudotemporal ordering of single cells. Nat Biotechnol. 2014;32:381–386. doi: 10.1038/nbt.2859. [DOI] [PMC free article] [PubMed] [Google Scholar]
- 55.Saelens W, Cannoodt R, Todorov H, Saeys Y. A comparison of single-cell trajectory inference methods. Nat Biotechnol. 2019;37:547–554. doi: 10.1038/s41587-019-0071-9. [DOI] [PubMed] [Google Scholar]
Associated Data
This section collects any data citations, data availability statements, or supplementary materials included in this article.
Supplementary Materials
Data Availability Statement
All raw data sequencing data for mouse RNA-seq, single cell RNA-seq and 10x Visium have been deposited in the gene expression Omnibus with the following accession number: GSE234267. Source data are provided with this paper.


