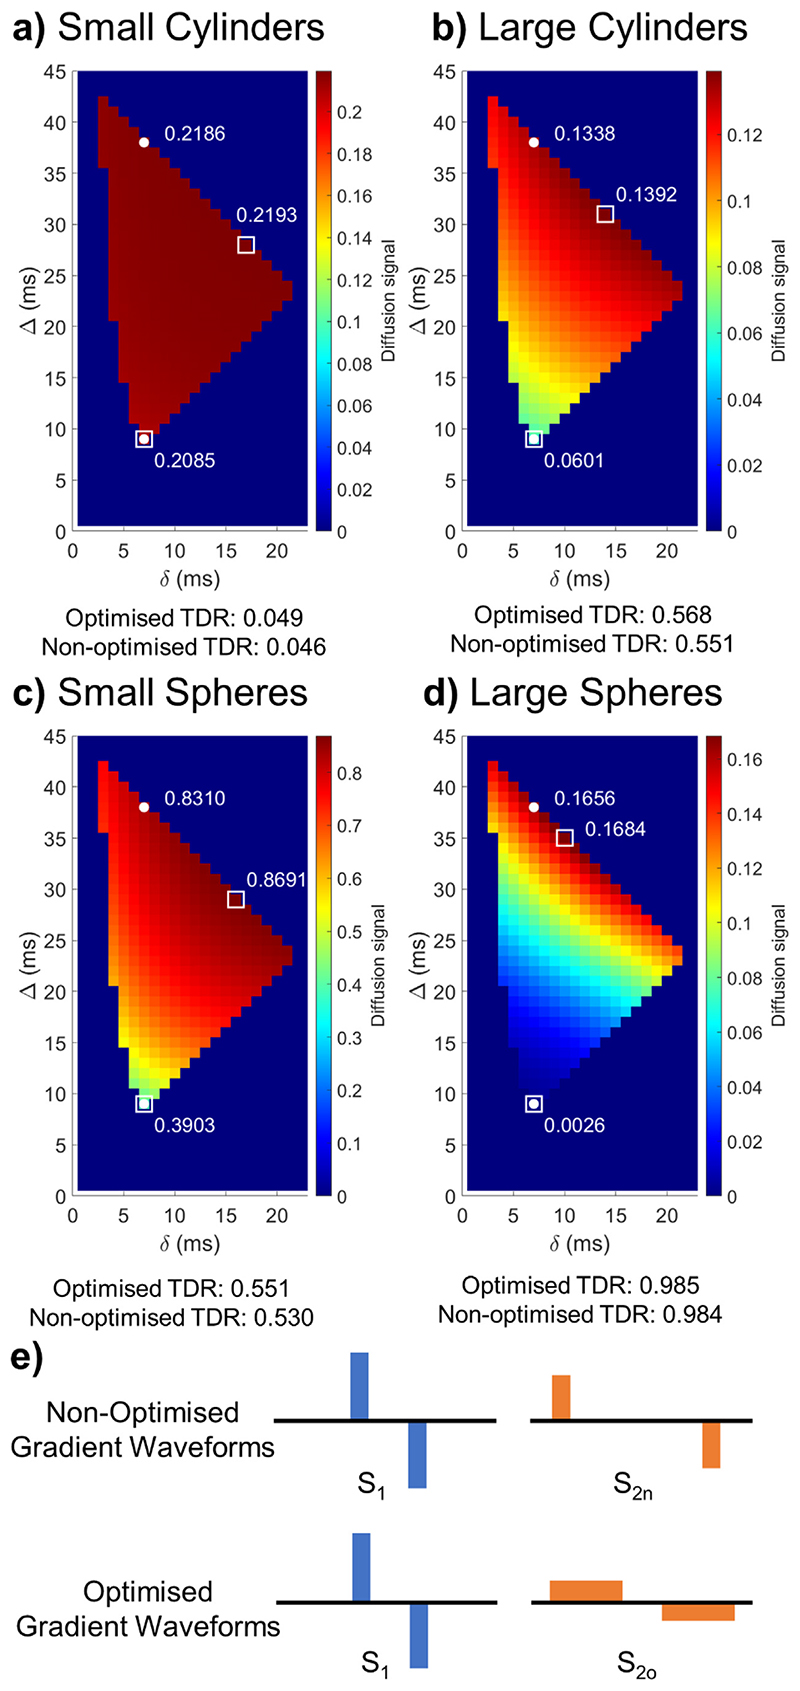
Fig. 3.
Optimisation results maximising TDR for G < 600 mT/m, Δ+δ < 45 ms and b = 8 ms/μm2. (a-d) Maps showing the diffusion weighted signal averaged over the 60 uniformly distributed directions for sequences with various δ/Δ combinations for the substrates illustrated in Fig. 2. White markers indicate the non-optimised (circle) and optimised (square) sequences, respectively. The optimised sequences provide larger signal differences between S1 and S2o compared to between S1 and S2n, and higher TDR values. In each plot, colours are scaled so that a diffusion signal of 0 is blue, and the maximum diffusion signal obtained is red; the colour range displayed in each plot gives an idea of the maximum TDR possible. (e) Schematic representation of nonoptimized and optimised gradient shapes. These figures show that optimised TDR maximises the difference between the signal from the two acquisitions, using sequences with different pulse shapes. Equivalent figure for b = 20 ms/ μm2 is Fig. S2 presented in Supplementary Material.

