Summary
Gastrulation is the fundamental process in all multicellular animals through which the basic body plan is first laid down1–4. It is pivotal in generating cellular diversity coordinated with spatial patterning. In humans, gastrulation occurs in the third week following fertilization. Our understanding of this process in humans is relatively limited and based primarily on historical specimens5–8, experimental models9–12, or, more recently, in vitro cultured samples13–16. Here, we characterize in a spatially resolved manner the single cell transcriptional profile of an entire gastrulating human embryo, staged to be between 16 and 19 days after fertilization. We used these data to analyse the cell types present and to make comparisons with other model systems. In addition to pluripotent epiblast, we identified primordial germ cells, red blood cells, and various mesodermal and endodermal cell types. This dataset offers a unique glimpse into a central but inaccessible stage of our development, being the first transcriptomic examination of an entire gastrulation stage human embryo. This characterisation provides new context for interpreting experiments in other model systems and represents a valuable resource for guiding directed differentiation of human cells in vitro.
Human gastrulation starts approximately 14 days after fertilization and continues for slightly over a week. Donations of human fetal material at these early stages are rare, making it nearly impossible to study directly. Our understanding of human gastrulation is therefore based almost entirely on extrapolation from model systems, historical collections of fixed samples5–8 and more recently, several in vitro models. These include human Embryonic Stem Cells (hESCs) cultured on circular micropatterns9, hESC colonies engrafted into chick embryos10 or 3D cellular models derived from hESC11,12. The stages just preceding gastrulation have also been studied using human embryos cultured in vitro13–16. There is currently no transcriptional data of in utero human gastrulation to compare such in vitro models against. Here, we present a morphological and spatially resolved single cell transcriptomic characterisation of a single human gastrulating embryo at Carnegie Stage (CS) 7, equivalent to 16−19 days post-fertilization, providing a detailed description of cell types present at this previously unexplored and fundamental stage of human embryonic development.
Characterization of a CS7 human gastrula
Through the Human Developmental Biology Resource, we obtained a gastrulation stage human embryo, from a donor who generously provided informed consent for the use in research of embryonic material arising from the termination of her pregnancy. The embryo was karyotypically normal, male and staged as gestational week 4 plus 5 days, which corresponds to between 2 and 3 post conception weeks (pcw).
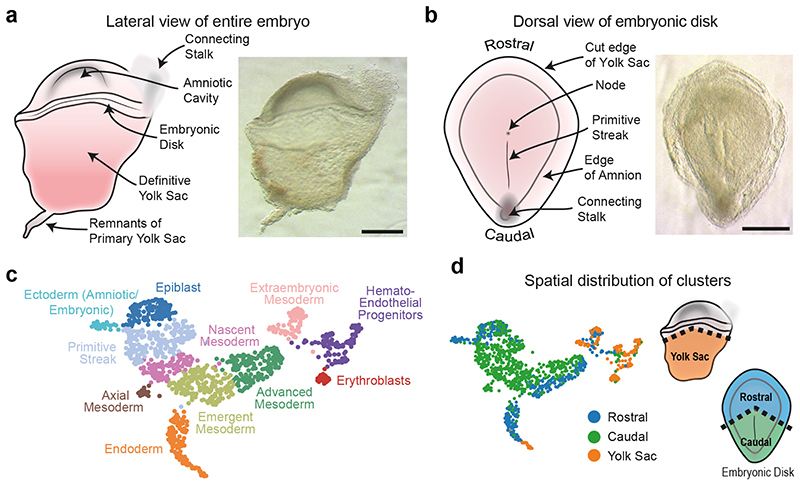
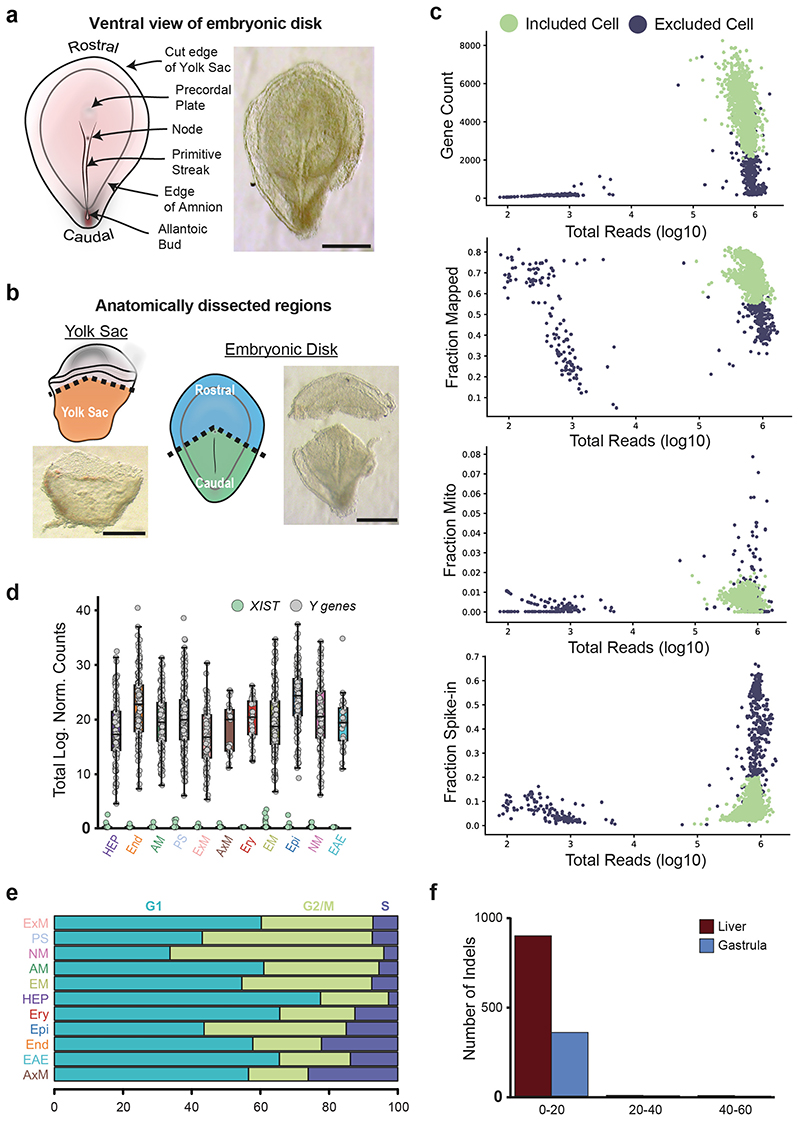
The sample was completely intact and morphologically normal, comprising an embryonic disk with amniotic cavity, connecting stalk and yolk sac with pigmented cells (Figure 1a). We micro-dissected away the yolk sac and connecting stalk to isolate the embryonic disk with overlying amnion. Dorsal and ventral views of the disk showed the primitive streak (PS) extending approximately half the diameter of the disk along the long, rostral-caudal, axis (Figure 1b, Extended Data Figure 1a). The primitive node was visible at the rostral end of the streak. The length of the PS relative to the embryonic disk, the presence of prechordal plate, and the node at the middle of the disk allowed us to stage the embryo as Carnegie Stage (CS) 717. To retain anatomical information when disaggregating cells for the single-cell RNA-seq (scRNAseq), we sub-dissected the embryo into the yolk sac, rostral embryonic disk, and caudal embryonic disk (Figure 1d, Extended Data Figure 1b).
Figure 1. Morphological and transcriptional characterization of a CS7 human gastrula.
a, Lateral view of the intact CS7 human embryo (Scale bar = 500μm; n=1). b, Dorsal view of the dissected embryonic disk showing the primitive streak and node (Scale bar = 500μm; n=1). c, UMAP of all the cells, computed from highly variable genes. d, UMAP and schematics highlighting the anatomical region that cells were collected from (Also see Extended Data Figure 1b).
After stringent quality filtering, we generated a library of 1,195 single cells (665 caudal, 340 rostral and 190 yolk sac cells), with a median of 4,000 genes detected per cell (Extended Data Figure 1c). All cells showed expression of Y-chromosome genes and XIST transcript was largely undetectable (Extended Data Figure 1d), confirming there was no maternal cell contamination. All cell cycle stages could be detected, suggesting that normal cell cycling was occurring (Extended Data Figure 1e). The genomic integrity of the sample was normal, with the number of indels identified falling in the same range as other human transcriptomic datasets (Extended Data Figure 1f). These analyses, alongside the karyotyping (see Methods) and morphology of the sample (Figure 1a-b), suggest that this sample might be representative of normal human gastrulation.
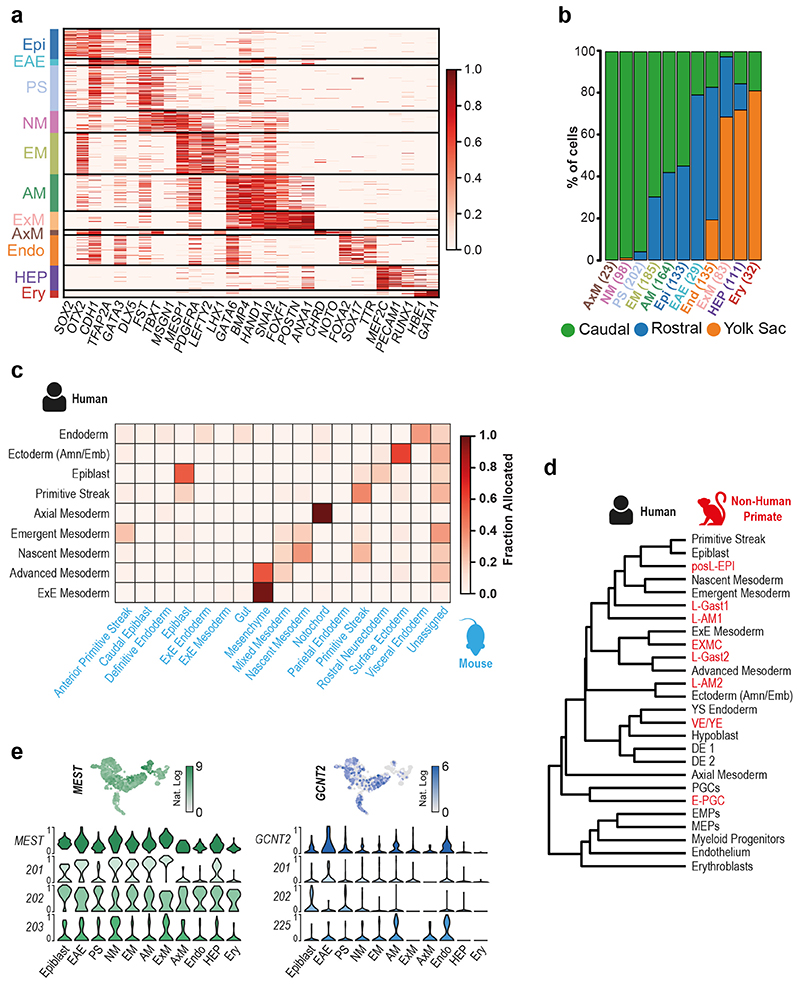
We detected 11 different cell populations with unsupervised clustering (Figure 1c). Using a combination of anatomical location and marker genes (Supplementary Note 1), we annotated them as: Epiblast, Ectoderm (Amniotic/Embryonic), Primitive Streak, Nascent Mesoderm, Axial Mesoderm, Emergent Mesoderm, Advanced Mesoderm, Extraembryonic Mesoderm, Endoderm, Hemato-Endothelial Progenitors and Erythroblasts (Figure 1c, Extended Data Figure 2a and b, SI Table 1 and 2). This annotation was supported by comparison with cell types described in the mouse18 and the non-human primate cynomolgus macaque19 (Extended Data Figure 2c and d). The Smart-Seq2 protocol also allowed us to differentiate between transcript isoforms and detect the cluster specific expression of gene isoforms (Extended Data Figure 2e and SI Table 3).
As a user-friendly community resource, we have created a web-interface to interactively explore these data, accessible at http://www.human-gastrula.net.
Cell type diversification
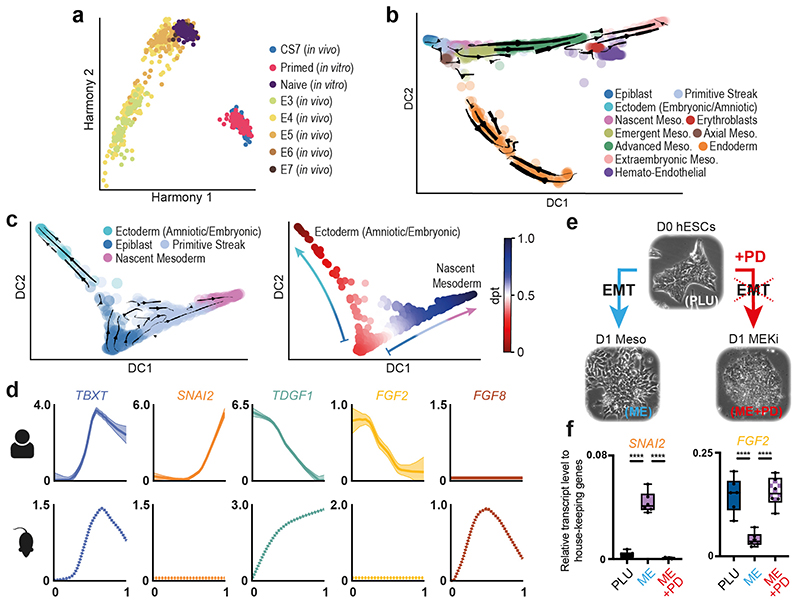
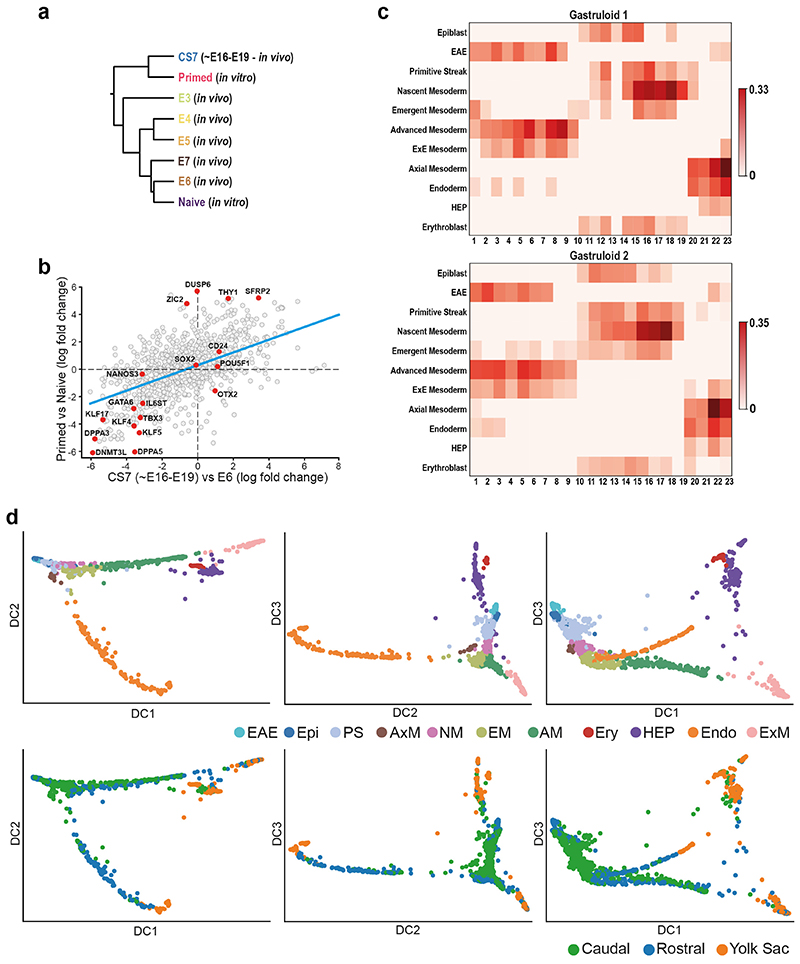
The identification of the CS7 Epiblast cluster offered the opportunity to transcriptionally define the human primed pluripotent state as it exists in utero. To generate anchors of the in vivo primed and naïve states, we first combined our Epiblast data with existing pre-implantation human embryo scRNAseq data20 that captures the in vivo naïve state. Cells showed an ordered pattern according to their developmental stage (Figure 2a, Extended Data 3a). We next projected the transcriptomes of naïve and primed in vitro cultured hESC21 onto this representation. We found that naïve hESC plotted closest to E6/E7 cells while primed hESC plotted partially overlapped with CS7 Epiblast, verifying that the primed state captured in vitro in hESC closely represents at the global transcriptome level the in vivo primed state. A comparison of the naïve and primed state in vivo and in vitro showed some differences (Extended Data Figure 3b and SI Table 4), which could suggest ways to further refine in vitro models. Similar approaches can be adopted to evaluate in vitro models of human gastrulation, such as gastruloids (Extended Data Figure 3c; details in Supplementary Note 2).
Figure 2. State transitions during gastrulation.
a, Harmony representation of the transcriptomic profiles of CS7 epiblast cells compared with cells from pre-implantation human embryos20, primed and naïve hESC21. b, RNA velocity vectors overlaid on diffusion map of cells from all 11 clusters. c, Diffusion maps with RNA velocity vectors (at left) and diffusion pseudotime (dpt) coordinates (at right). The two differentiation trajectories from Epiblast towards Ectoderm (Amniotic/Embryonic) or Mesoderm are shown. d, Comparison of primitive streak and nascent mesoderm formation in human and mouse18. Mean expression profile and standard error, along pseudotime, is plotted for selected human (top) and mouse (bottom) genes. e, in vitro model for EMT during gastrulation. hESC (D0 hESC, PLU) are differentiated towards Mesendoderm (D1 MESO, ME) and undergo EMT. Inhibition of the MEK pathway (MEKi) prevents MET (D1 MEK Inhibition, ME+PD). f, Quantification of selected transcripts across the three conditions PLU, ME, ME+PD. qPCR results are consistent with in vivo data in panel d. (n = 6 from three different experiments. Center line, median; box limits, upper and lower quartiles; whiskers, minimum and maximum; dots, mean value per experiment. **** = p-value < 0.000; ordinary one-way ANOVA after Shapiro-Wilk normality test). See SI Table 17 for source data.
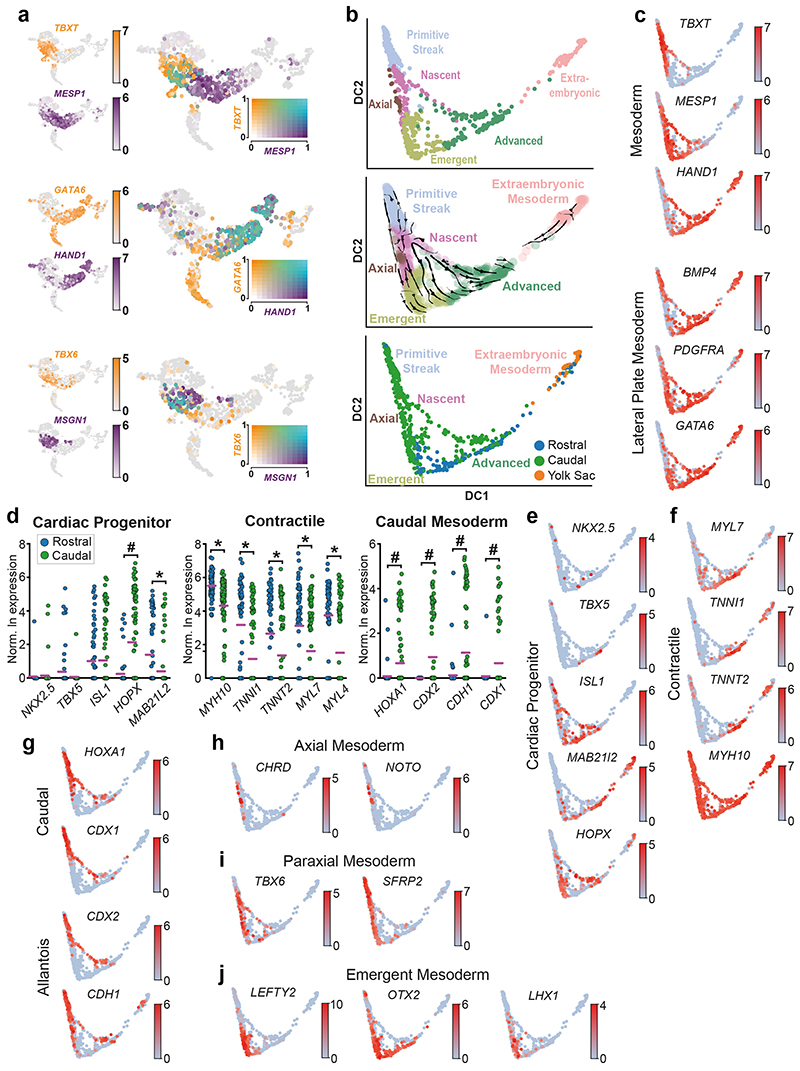
Diffusion maps and RNA velocity analysis22,23 (Figure 2b, Extended Data Figure 3d) revealed trajectories from the Epiblast along two broad streams corresponding to mesoderm and endoderm, separated along the second diffusion component (DC2). The first diffusion component (DC1) corresponded closely to cell type and spatial location, reflecting the extent of their differentiation and the ‘age’ of cells, based on how far in the past of this sample they had emerged from the Epiblast (Figure 2b, Extended Data Figure 3d). For example, Extra-Embryonic Mesoderm cells, which emerge relatively early during gastrulation, plotted further from the epiblast than Axial Mesoderm cells, that emerge later. The cells that we annotated as Nascent, Emergent and Advanced Mesoderm showed overlapping expression of markers of established mesodermal sub-types, such as paraxial or lateral plate mesoderm. This suggests that at this stage, these clusters do not yet represent specified mesodermal subtypes and rather, correspond to transitional states (Supplementary Note 1 and 3, Extended Data Figure 10).
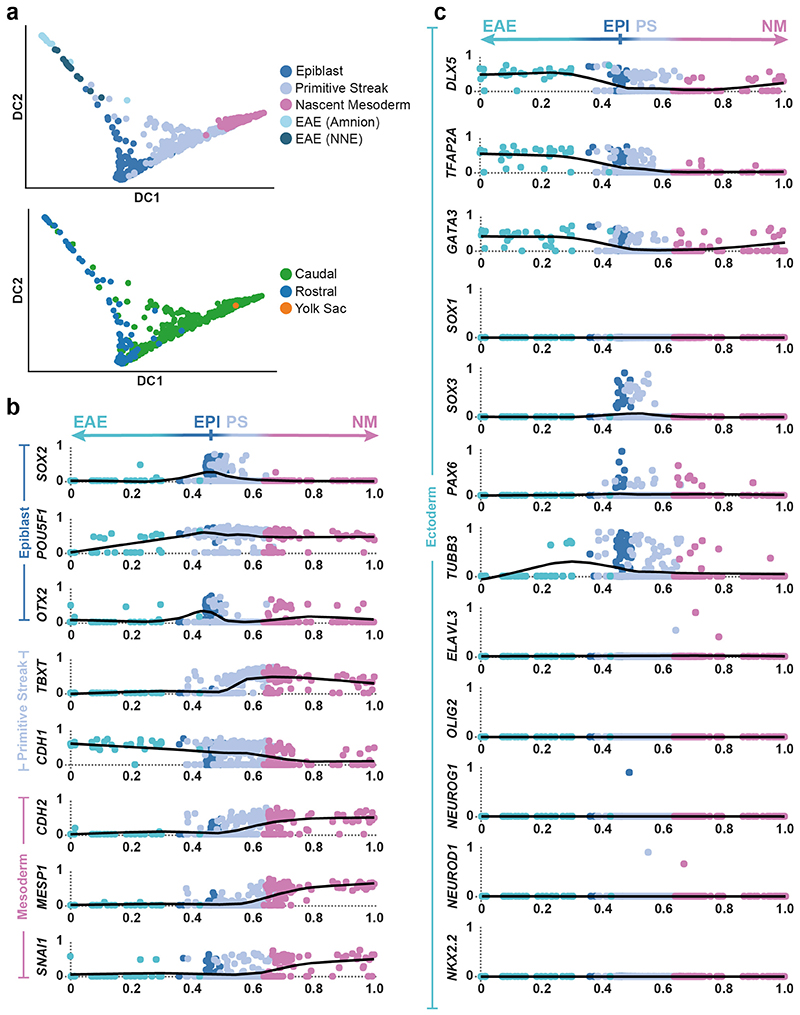
To probe changes in the epiblast during gastrulation, we computed RNA velocity vectors with cells belonging to the Epiblast, Primitive Streak, Nascent Mesoderm and Ectoderm (Amniotic/Embryonic) clusters. This supported the existence of a bifurcation from Epiblast, towards Mesoderm via the Primitive Streak on one side and towards Ectoderm on the other (Figure 2c). Ordering cells using diffusion pseudotime provided a method to infer the changes in gene expression as Epiblast cells differentiate into Ectoderm or enter the Primitive Streak and begin to delaminate into Nascent Mesoderm (Figure 2c, Extended Data Figure 4). While we could detect robust upregulation of markers common to the Amniotic and Embryonic Ectoderm (DLX5, TFAP2A and GATA324), markers of early neural induction (SOX1, SOX3, PAX6) and differentiated neurons (TUBB3, OLIG2, NEUROD1) were undetectable or expressed at very low levels (Extended Data Figure 4c)25,26. In particular, we could not detect any cells which showed combinatorial expression of SOX3, PAX6 or TUBB3. Together, these data suggest that in this CS7 embryo, neural differentiation had not yet commenced.
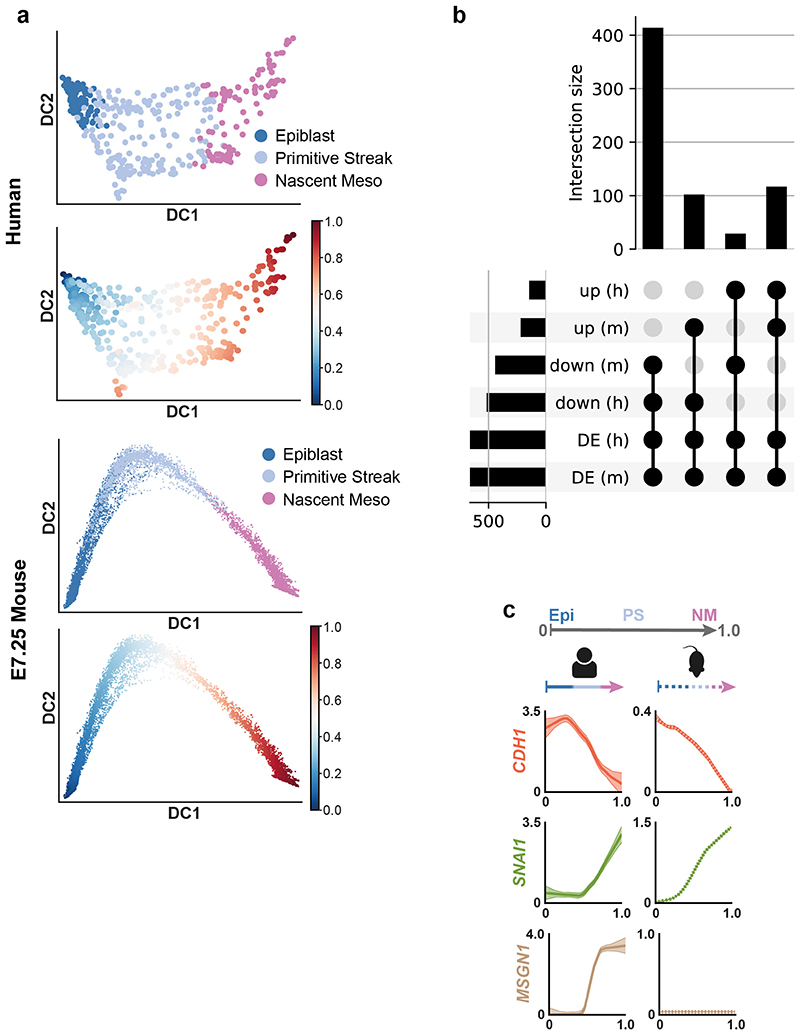
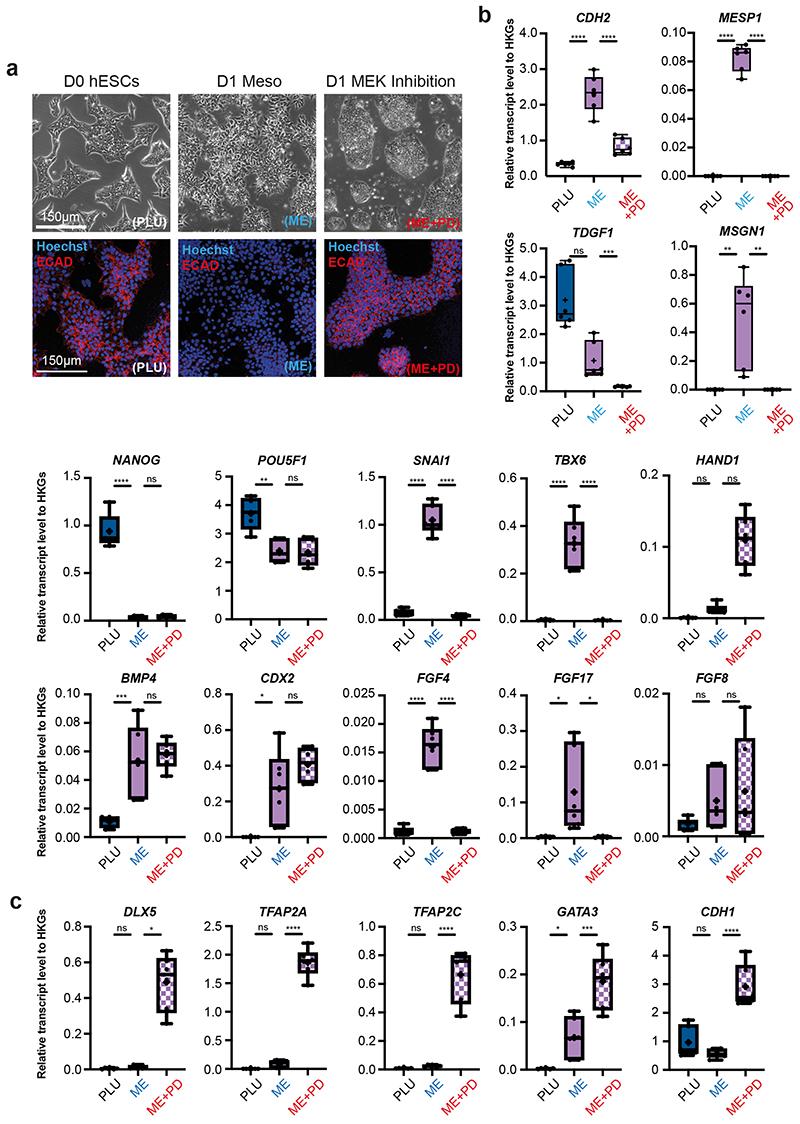
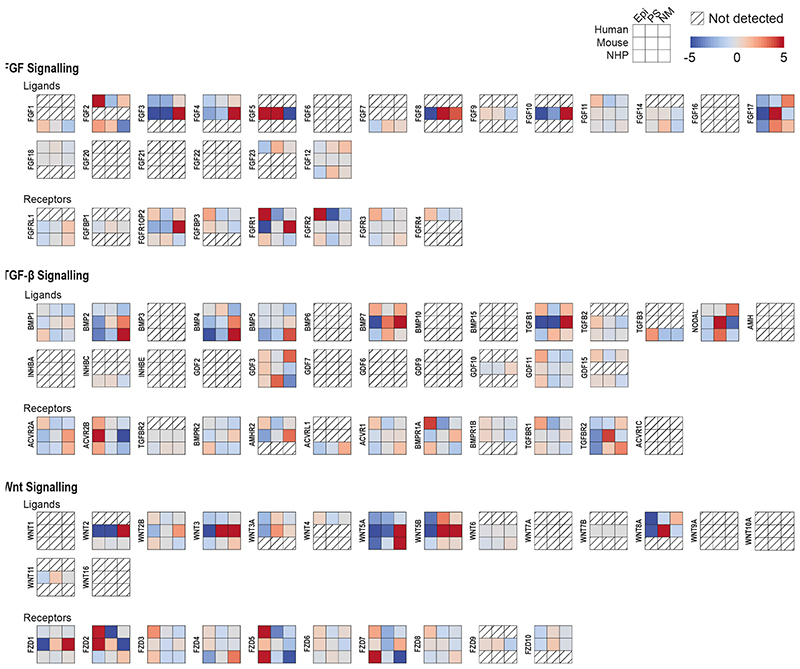
The mouse is the predominant model of mammalian gastrulation. To unbiasedly test similarities and differences between human and mouse gastrulation, we used pseudotime analyses to compare the transition from Epiblast to Nascent Mesoderm in the human gastrula with the equivalent populations from the Mouse Gastrula Single Cell Atlas18 (Extended Data Figure 5a) (SI Table 5 and 6). We identified 662 genes common to both species that were differentially expressed along this developmental trajectory (Extended Data Figure 5b and SI Table 7). The majority of these (531) shared the same trend across pseudotime, either increasing (117) or decreasing (414). For example, in both mouse and human, during the transition from Epiblast to Nascent Mesoderm, CDH1 decreased, TBXT was transiently expressed, and SNAI1 continuously increased (Figure 2d, Extended Data Figure 5c). Additionally, we also found some genes with trends that differed between the two species, such as SNAI2 (upregulated only in human), TDGF1 (opposing trends), FGF8 (transient expression in mouse only) and FGF2 (expression downregulated in human, but not at all expressed in mouse). To experimentally validate these human specific transcriptional trends, we used a hESC based in vitro model of the transition from Epiblast to Nascent Mesoderm and found similar trends during hESC differentiation (Figure 2c, Extended Data Figure 6). We extended this comparison to include the closest available stages of gastrulation of the cynomolgus monkey19. An analysis of expression trends of signaling molecules across the three species again revealed broad similarities, as well some specific differences (Extended Data Figure 7 and details in Supplementary Note 4).
Cluster subtypes
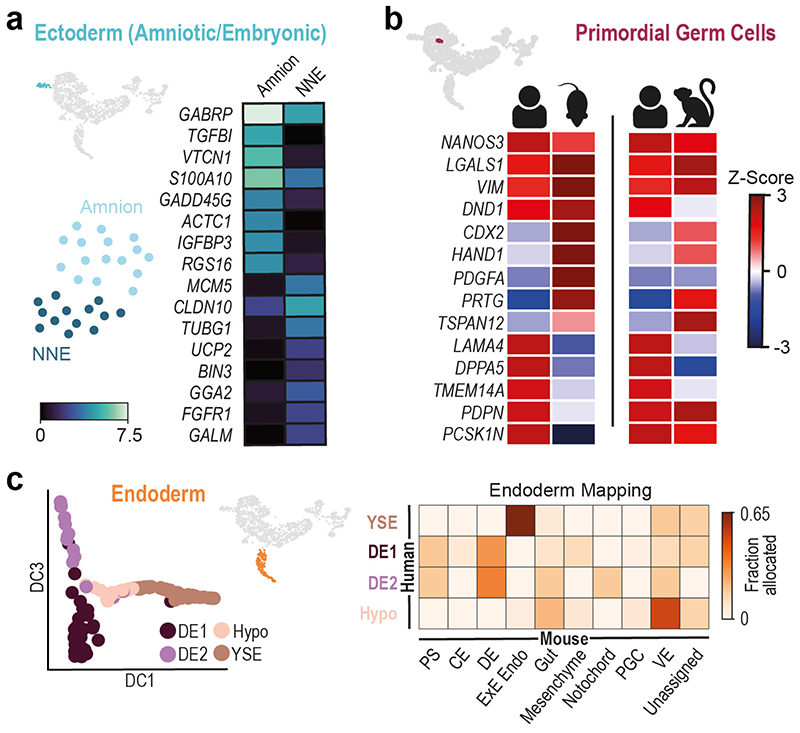
The Ectoderm (Amniotic/Embryonic) cluster expresses markers common to the embryonic ectoderm at the rostral boundary of the neural plate, which will generate surface ectoderm, and the amniotic ectoderm24,27. To explore this population further, we performed subclustering, which revealed two sub-populations, one of which represented amniotic ectoderm based on the high expression of VTCN1 and GABRP28 (Figure 3a, SI Table 8). The other sub-population (NNE) represents either embryonic non-neural ectoderm at the rostral boundary of the forming neural plate27 or immature amnion.
Figure 3. Identification of cell subtypes.
a, Subclustering of Ectoderm (Amniotic/Embryonic), highlighted in UMAP insert, into Amnion and Non-Neural Ectoderm (NNE). Heatmap of log expression of the top eight upregulated genes in the two subclusters. b, Primordial Germ Cell (PGC) population subclustered from the Primitive Streak cluster. Heatmaps comparing gene expression in human PGCs with those from cultured E7.5 mouse embryos (left) and cynomolgus monkey (right). c, At left, diffusion map of Endodermal, showing four subclusters: Definitive Endoderm 1 and 2 (DE1 and DE2); Hypoblast (Hypo); Yolk Sac Endoderm (YSE). At right, heatmap showing the fraction of cells from the human endodermal sub clusters allocated to mouse cell types at E7.25. PS, primitive streak; CE, caudal epiblast; DE, definitive endoderm; ExE Endo, extraembryonic endoderm; VE, visceral endoderm.
An important population of cells to originate from the early Epiblast are the Primordial Germ Cells (PGCs). In the mouse, PGCs emerge at approximately E7.2529,30. Recent work has shown that cells expressing some PGC markers can be identified at E1131 in non-human primates and in ex vivo cultured human embryos13. Consistent with this, we were able to detect a small population of PGCs in the PS cluster (Figure 3b, SI Table 9). A comparison of the transcriptional profile of early human PGCs with that of mouse and non-human primate identified markers shared between these species and others that differed, such as DND1 and PDPN (Figure 3b and SI Table 10).
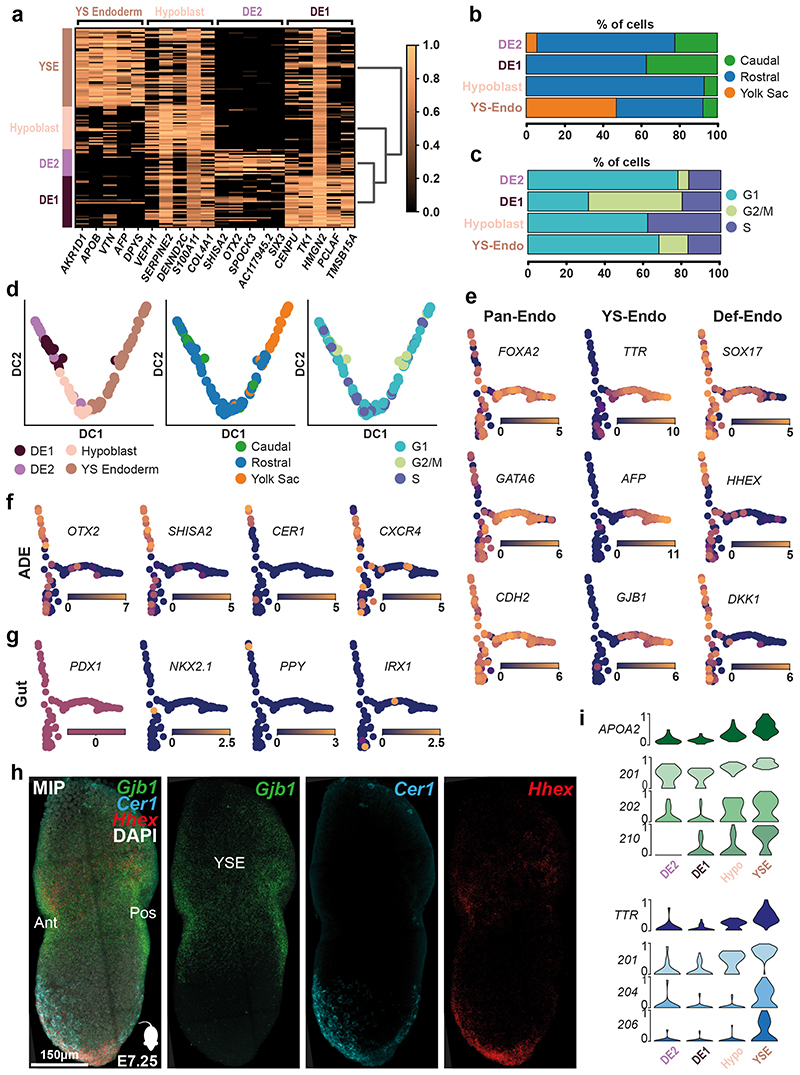
The Endoderm cluster showed a higher order of substructure based on gene expression and anatomical origin of cells. Subclustering revealed four spatially distinct sub-populations: Hypoblast, Yolk Sac (YS) Endoderm and two Definitive Endoderm (DE1 and 2) groups (Figure 3c, Extended Data Figure 8, SI Table 11). A comparison of these cells with mouse endodermal subtypes at E7.25 confirmed our annotation (Figure 3c). The two DE clusters had the largest proportion of cells collected from the caudal region (Extended Data Figure 8b). One of the main differences between them was in the distribution of cells across the phases of the cell cycle, with DE1 being more proliferative compared to DE2 (Extended Data Figure 8c). DE2 also had elevated expression of the anterior endoderm markers HHEX, OTX2, SHISA2 and CER1 (Extended Data Figure 8f). Analysis of transcript isoforms also revealed further differences between these endoderm clusters in markers such as APOA2 and TTR (Extended Data Figure 8i, SI Table 12).
Maturation of hemogenic progenitors
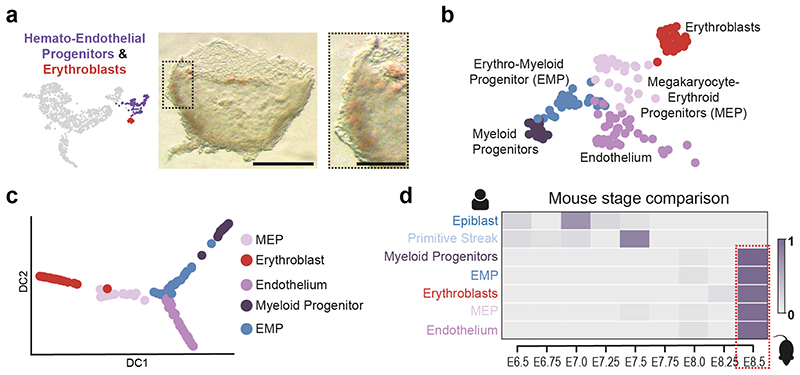
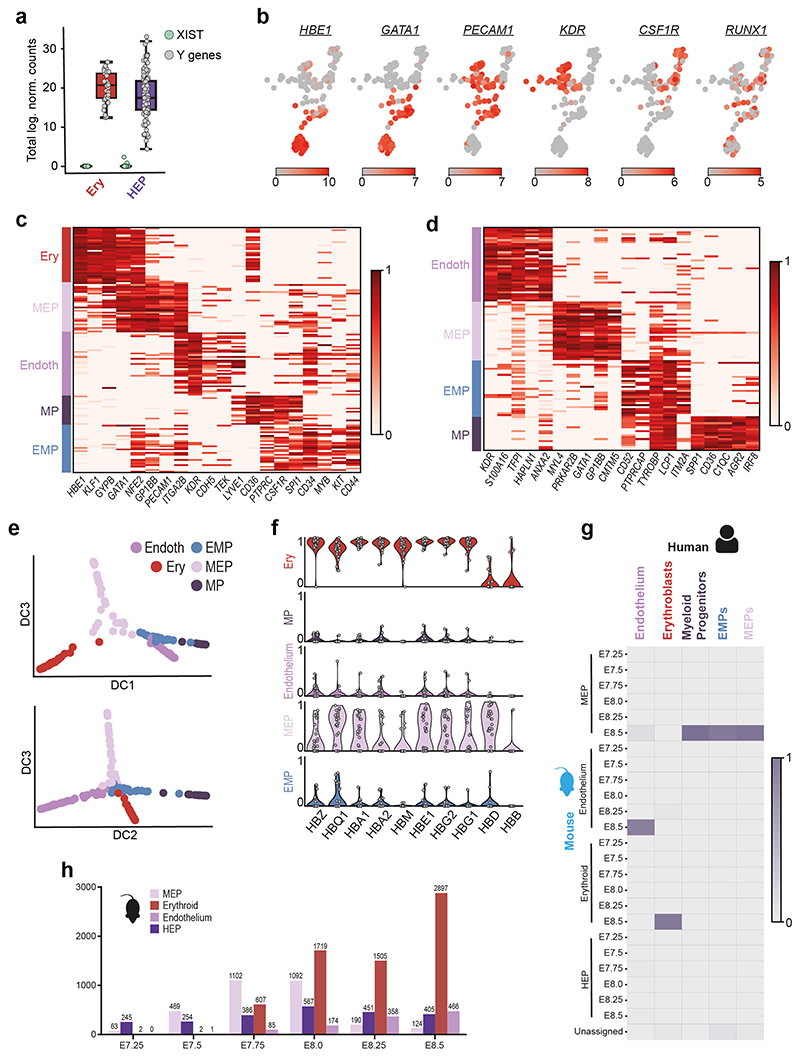
Our initial analysis revealed two blood related clusters, Erythroblasts and Hemato-Endothelial Progenitors (HEP). The identification of primitive erythroblasts was consistent with pigmented cells in the yolk sac and the expression of embryonic globin genes (Figure 4a, Extended Data Figure 9f). This was striking given the absence of pigmented blood cells at the equivalent stage in mouse embryos (~E7.25). The expression of XIST and Y-chromosome specific genes (Extended Data Figure 9a) ruled out the possibility of maternal origin of these cells.
Figure 4. Identification of early blood progenitor types in the human.
a, Brightfield image of the Yolk Sac highlighting pigmented cells (Scale bar = 500μm; n=1). Boxed region magnified at right (Scale bar = 150μm). b, UMAP of the HEP and Erythroblast clusters showing four subclusters within the HEPs. c, Diffusion maps of HEP subclusters and Erythroblasts. d, Estimation of equivalent mouse stage for selected human clusters. The heatmap shows the fraction of human cells from each cluster that maps onto the equivalent mouse cell type at different stages. Epiblast and Primitive Streak cells are most similar to their mouse counterpart at E7.0 and E7.5 respectively, but blood related cells are all equivalent to E8.5 mouse cells.
Unsupervised clustering of the HEP revealed four sub-populations with distinct transcriptional and isoform signatures (Figure 4b, Extended Data Figure 9d, SI Table 13, S14). These represented Endothelium (Endo), Megakaryocyte-Erythroid progenitors (MEP; expressing both megakaryocyte and erythroid markers), Myeloid progenitors and an Erythro-Myeloid progenitor (EMP) population. Diffusion analysis revealed a separation of trajectories based on HEP subtype (Figure 4c, Extended Data Figure 9e).
The existence of hemoglobinizing cells and multiple hematopoietic progenitor populations suggest that hematopoiesis in humans had progressed further in comparison to equivalent stage mouse embryos (E6.75–7.5). To unbiasedly examine this, we compared the sequence of the human clusters to the equivalent populations from the Mouse Gastrula Single Cell Atlas18 that spans E6.5-E8.5. In contrast to the human Epiblast and Primitive Streak that correspond to mouse cells from E7.0 and E7.5 respectively, all the human hematopoietic populations most closely correlated with cells from stage E8.5 in the mouse (Figure 4d, Extended Data Figure 9g and h), further suggesting that hematopoiesis is further advanced in the human compared to the equivalent stage in mouse.
Discussion
The singular nature of the sequenced specimen raises caveats to making generalizations about human gastrulation in utero. Ethically obtained human samples at these early stages are exceptionally rare so, in this context, it will be illuminating in the future to compare this human gastrula transcriptome with those from stage-matched non-human primates. For now, our characterisation of the human sample provides some reassurance that it reflects normal development based on: gross morphology; karyotype; distribution and frequency of indels and; broad agreement of its single-cell transcriptome to established paradigms of gastrulation from model organisms.
Our characterization revealed that the embryo at this stage already had PGCs and red blood cells, but had not yet initiated neural specification. The differentiation trajectory and signaling pathways of gastrulating cells transitioning from epiblast to mesoderm was broadly conserved between humans and the mouse, indicating that the latter represents a good model of human gastrulation. However, some notable differences suggest that the process of epithelial to mesenchymal transition may be regulated differently at the level of specific signaling family members. These human specific details of differentiation will be a valuable resource for refining approaches for the directed differentiation of human embryonic stem cells. Furthermore, they will help in interpreting experimental results on gastrulation from model organisms such as the mouse, or in vitro gastruloid systems. The human and mouse gastrula are morphologically very different, the former being a disc and the latter being cylindrical. This profound difference in morphology alters the migratory path of cells during gastrulation and therefore the inductive signals cells might be subject to from neighbouring germ layers. It will therefore be important to compare this human gastrula single-cell transcriptome to stage-matched gastrulae of other organisms with a similar embryonic disc, such as the rabbit, chick and non-human primates. This will enable us to address the extent to which specific differences between human and mouse transcriptomes are due simply to evolutionary divergence or instead, reflect difference in morphology.
Extended Data
Extended Data Figure 1. Quality control of scRNA-seq dataset.
a, Dorsal view of the dissected embryonic disk showing the primitive streak and node (Scale bar = 500μm; n=1). b, Brightfield images showing embryo dissection with schematic diagrams highlighting the three anatomical regions collected (yolk sac, rostral and caudal regions of embryonic disk; Scale bar = 500μm; n=1). c, Metrics used to assess the quality of the scRNA-seq libraries. The scatter plots show the number of detected genes (top left), the fraction of reads mapped to the human genome (top right), the fraction of reads mapped to mitochondrial genes (bottom left) and the fraction of reads mapped to ERCC spike-ins (bottom right), all as a function of the total number of reads. Cells that passed quality control are marked by green circles, while black circles indicate cells that failed the quality control and were excluded from downstream analyses. d, The boxplots show the total log expression of normalized counts for XIST and Y-genes across all clusters. While XIST was mostly not detected, Y-chromosome genes had always non-zero counts; this suggests that there is no contamination from maternal tissues in any of the clusters. n= 1195 cells were examined from a single embryo. Horizontal black lines denote median values and boxes cover the 25th and 75th percentiles range; whiskers extend to 1.5 x IQR. e, The stacked barplots indicate the percentages of cells from each cluster in the phase G1, S or G2/M of the cell cycle, as predicted from their transcriptomic profiles. f, Insertion-deletion length and size distribution of gastrula and fetal liver data. Y axis represents total number of indels on merged cells, while x axis represents indel length in base pairs. Hemato-Endothelial Progenitors (HEP), Endoderm (End), Advanced Mesoderm (AM), Primitive Streak (PS), Extraembryonic Mesoderm (ExM), Axial Mesoderm (AxM), Erythroblasts (Ery), Emergent Mesoderm (EM), Epiblast (Epi), Nascent Mesoderm (NM), Ectoderm (Amniotic/Embryonic (EAE)).
Extended Data Figure 2. Characterisation and comparison of a CS7 human gastrula with Non-human primate and Mouse.
a, Heatmap with the normalized log expression of well characterized marker genes for the identified cell types: Epiblast (Epi), Ectoderm (Amniotic/Embryonic (EAE)), Primitive Streak (PS), Nascent Mesoderm (NM), Emergent Mesoderm (EM), Advanced Mesoderm (AM), Extraembryonic Mesoderm (ExM), Axial Mesoderm (AxM), Endoderm (Endo), Hemato-Endothelial Progenitors (HEP), Erythroblasts (Ery). b, Stacked bar plots highlighting the anatomical region that cells were collected from and the percentage breakdown of each cluster. Numbers in brackets represent the total number of cells per cluster. c, Heatmap showing the fraction of human gastrula cells allocated to mouse cell types at E7.25 (data from 18). d, Dendrogram showing hierarchical clustering of the transcriptomes of cell types from human gastrula and cultured cynomolgus macaque embryos at 16-day post-fertilization (from 19). e, Top, UMAP plots showing the log expression of MEST and GCNT2. Bottom, violin plots showing the log expression of total transcripts (top row) and selected isoforms scaled by the maximum value in different cell types. Isoform names refer to Ensembl nomenclature.
Extended Data Figure 3. In Vitro vs In Vivo comparisons.
a, Dendrogram representation built on corrected expression values obtained with Seurat showing comparison of an in vitro model of pluripotency with in vivo data. b, Log-fold changes of expression levels of the genes between primed vs naïve hESC (y axis) and CS7 epiblast vs E6 data (x axis). Selected genes are highlighted in red; the blue line is obtained through a linear regression. A statistically significant positive correlation is found (Pearson’s correlation coefficient ~0.63, p-value = 3e-107), indicating that the hESC resemble the in vivo primed and naïve states at the transcriptome-wide level. c, Heatmaps showing the correlations between the transcriptomic profiles of the human gastrula cell types (rows) and sections of human gastruloids taken at different positions along the rostral-caudal axis (columns) in two different replicates (Gastruloid 1 and Gastruloid 2). Only the values of the statistically significant correlations (p-value < 0.01; 2-tailed Pearson’s correlation, see Methods) are reported, while all the non-significant correlations were set to 0. d, UMAP representation of the human gastrula data with the PGCs highlighted. d, Diffusion map of cells from all 11 clusters. The first three diffusion components (DC1, 2, 3) are plotted in different combinations. In the top panels, cells are coloured by the clusters they belong to,while in the bottom panels the colours indicate the region each cell was dissected from. Ectoderm (amniotic/embryonic) (EAE), Epiblast (Epi), Primitive Streak (PS), Axial Mesoderm (AxM), Nascent Mesoderm (NM), Emergent Mesoderm (EM), Advanced Mesoderm (AM), Erythroblasts (Ery), Hemato-Endothelial Progenitors (HEP), Endoderm (Endo), Extraembryonic Mesoderm (ExM).
Extended Data Figure 4. Differentiation of the epiblast.
a, Diffusion map of cells from the Epiblast, Primitive Streak, Nascent Mesoderm and Ectoderm (amniotic/embryonic). The first two diffusion components are plotted (DC1 and DC2) and cells are colored by their cluster (top) or the anatomical region they were isolated from (bottom). b and c, Normalized log gene expression changes along a pseudotime coordinate (see Figure 4a) running from 0 to 1 and spanning the Ectoderm (amniotic/embryonic) (EAE), the Epiblast (EPI), the Primitive Streak (PS) and the Nascent Mesoderm (NM), as depicted by the arrow on top. The selected genes highlight Primitive Streak and mesoderm formation (panel b) as well as ectoderm differentiation (panel c).
Extended Data Figure 5. Mesoderm formation in human and mouse.
a, Diffusion map with cells from the human (top two plots) or mouse (bottom two plots) Epiblast, Primitive Streak and Nascent Mesoderm clusters. Cells are colored based on their cluster of origin or on their diffusion pseudotime coordinate. b, Upset plot for the number of differentially expressed (DE) genes as a function of the diffusion pseudotime (dpt) shown in panel a in mouse (m) or human (h). Here, only genes that are differentially expressed in both species and with a log-fold change > 1 along the trajectory are included. Genes are split according to their increasing (up) or decreasing (down) trend as a function of dpt. c, Comparison of pseudotime analysis during primitive streak and nascent mesoderm formation in human and mouse (data from18). Cells in epiblast (Epi), Primitive Streak (PS) and Nascent Mesoderm (NM) clusters from human and mouse embryos at matching stages (see Methods) were independently aligned along a differentiation trajectory and a diffusion pseudotime coordinate (dpt) was calculated for each (top). The expression pattern and standard error of the mean of selected genes along pseudotime is plotted for human (left, continuous lines) and mouse (right, dashed lines). Both SNAI1 and CDH1 showed comparable expression profiles during mesoderm formation in mouse and human whilst MSGN1 was differently expressed between species.
Extended Data Figure 6. Characterization of EMT during hESC mesoderm formation.
a, Bright-field microscopy images of D0 hESC (left), D1 Meso (center) and D1 MEK Inhibition (right) ESC colonies (top panels). Fluorescence microscopy images of E-Cadherin staining (bottom panels). b, Quantification of transcript levels for selected pluripotent, EMT and mesendoderm genes across the three conditions PLU, ME, ME+PD. c, Quantification of transcript levels for selected non-neural ectoderm genes across the three conditions PLU, ME, ME+PD. (n = 6 from three different experiments. Center line, median; box limits, upper and lower quartiles; whiskers, minimum and maximum; dots, mean value per experiement. ns = p-value ≥ 0.05; *** = p-value < 0.001; **** = p-value < 0.0001 (Ordinary one-way ANOVA after passing a Shapiro-Wilk normality test. Kruskal-Wallis multiple comparison test used if Shapiro-Wilk normality test failed (MSGN1, TDGF1, HAND1, DLX5). House-keeping genes, HKGs. See SI Table 17 for source data and exact p-values.
Extended Data Figure 7. Comparison of signaling during mesoderm formation in the human and mouse.
Heatmap comparison of the z-score-normalized log expression values of components of FGF, TGF-β and Wnt signaling pathways in the human gastrula, mouse embryos (E7.25 stage) and cultured cynomolgus macaque embryos (16 d.p.f stage). From human and mouse we considered the Epiblast (Epi), Primitive Streak (PS) and Nascent Mesoderm (NM) clusters; in the macaque, we used the clusters annotated as postL-Epi, L-Gast1 and L-Gast2.
Extended Data Figure 8. Endoderm subcluster identification.
a, Heatmap showing the scaled log expression levels of marker genes of the four endodermal subclusters. b, Percentage of cells dissected from the Caudal, Rostral or Yolk Sac portion of the embryo in the four endodermal subclusters. c, Percentage of cells based on their predicted cell-cycle phase of the four endodermal subclusters. d, Diffusion map of cells from the Endoderm cluster. The first two diffusion components (DC1 and DC2) are plotted and cells are coloured by the sub clusters (left), anatomical origin (central) or the predicted cell-cycle phase (right). Yolk Sac, YS; Definitive Endoderm (DE) 1 and 2. e, Diffusion map of cells from the Endoderm cluster with DC1 and DC3 plotted, showing log expression levels of Panendoderm, Yolk-sac endoderm and definitive endoderm markers. f, Log expression levels of Anterior Definitive Endoderm markers. These genes are more highly expressed in DE2. g, Log expression levels of Gut Endoderm markers, showing limited expression. h, Maximum intensity projection and mid-sagittal section (h’) of an E7.0 mouse embryo showing expression of Gjb1 (yolk sac endoderm marker) as well as Cer1 and Hhex (anterior definitive endoderm markers) using Hybridization Chain Reaction (n=4). Cer1 and Hhex show greater expression in the anterior embryonic endoderm. Anterior, Ant; Posterior, Pos; Yolk-sac Endoderm, YSE. i, Violin plots showing the scaled log expression of total transcripts (top row) and individual isoforms in different endodermal subclusters. Isoform lables refer to Ensembl transcript numbers.
Extended Data Figure 9. Hemato-Endothelial Progenitors subclusters.
a, Boxplots showing the total log expression of normalized counts for XIST and Y-genes in Erythroblasts (Ery) and Hemato-Endothelial Progenitors (HEP), indicating no contamination from maternal tissue. n=143 cells were examined from a single embryo. Horizontal black lines denote median values and boxes cover the 25th and 75th percentiles range; whiskers extend to 1.5 x IQR. b, UMAP of HEP and Erythroblast clusters showing log expression of blood related marker genes. c, Heatmap showing the scaled log expression of well-characterized marker genes for both the Hemato-Endothelial Progenitors subclusters and Erythroblast cluster. d, Heatmap showing the normalized log expression levels of the top 5 marker genes of the four Hemato-Endothelial Progenitors subclusters. e, Diffusion maps of HEP subclusters and Erythroblasts showing diffusion components (DC) 1, 2 and 3. f, Violin plots showing the scaled log expression of Globin genes in the five blood related clusters: Erythroblasts (Ery), Myeloid Progenitors (MP), Endothelium, Megakaryocyte-Erythroid Progenitors (MEP) and Erythro-Myeloid progenitors (EMP). Each grey dot represents a single cell. g, Heatmap showing the estimated mapping of human Erythroid and HEP subclusters to mouse blood-related clusters. Scalebar represents the fraction of human cells mapped to each category. h, Bar graph showing the number of cells present in the mouse scRNA-seq dataset 18 at different development timepoints, values represent the exact number of cells present.
Extended Data Figure 10. Rostral and Caudal differences in diversification of mesodermal subtypes.
a, UMAP highlighting combinatorial gene expression. Individual gene expression (left) is reported as the log expression whilst combinatorial plots (right) show scaled log expression values. b, Diffusion map of cells from the 6 mesoderm related clusters (Primitive Streak, PS; Nascent Mesoderm, NM; Emergent Mesoderm, EM; Mesoderm, Meso; Axial Mesoderm, AxM; Extraembryonic Mesoderm, ExM), with the first and the second diffusion components plotted. c, Diffusion map of mesodermal showing the log expression levels of mesodermal markers genes. d, Differential gene expression between rostral and caudal advanced mesoderm cells. Significantly upregulated in rostral (*) or caudal (#) cells. e-j, Diffusion map of mesodermal clusters showing log expression levels of mesoderm subtype markers.
Supplementary Material
Acknowledgements
Human embryonic material was provided by the MRC/Wellcome Trust funded (grant # 099175/Z/12/Z and MR/R006237/1) Human Developmental Biology Resource (www.hdbr.org). We thank Neil Ashley (Oxford MRC single cell facility) for help with sequencing, Marella De Bruijn, Bertie Gottgens, Jim Palis, Liz Robertson, Tristan Rodriguez and Maria-Elena Torres-Padilla for helpful comments. This work was funded by: British Heart Foundation Immediate Postdoctoral Basic Science Research Fellowship no. FS/18/24/33424 to RT; JSPS Overseas Research Fellowship to SN; European Research Council advanced grant ERC: 741707 to LV; funding from the Helmholtz Association to AS; Wellcome Awards 105031/C/14/Z, 108438/Z/15/Z, 215116/Z/18/Z and 103788/Z/14/Z to SS.
Footnotes
Author Contributions:
Human gastrula processing: RT, SS; hESC in vitro experiments: SN; Computational analyses of sequence data: EM, AS; Gastrula single-cell annotation and analyses: RT, EM, AS, SS; hESC in vitro data analysis: RT, SN; Preparation of illustrations and figures: RT; Preparation of manuscript draft: RT, EM, SN, AS, SS; Editing and review of final manuscript: RT, EM, SN, LV, AS, SS. Study coordination: AS, SS.
Competing Interest statement
The authors declare no competing interests.
Data and Code Availability statement
Source data are provided with this paper. The raw data from our study can be downloaded from ArrayExpress under accession code: E-MTAB-9388. The processed data may be downloaded from http://www.human-gastrula.net. Datasets used as references include; Mouse gastrula data: E-MTAB-6967; Pre-implantation embryo data: E-MTAB-3929. Source data for hESC RT-PCR analysis can be found in SI Table 17.
All code is available upon request and at https://github.com/ScialdoneLab/human-gastrula-shiny
References
- 1.Stern CD. Gastrulation: From Cells to Embryo. 2004 [Google Scholar]
- 2.Tam PPL, Loebel DAF. Gene function in mouse embryogenesis: Get set for gastrulation. Nature Reviews Genetics. 2007;8:368–381. doi: 10.1038/nrg2084. [DOI] [PubMed] [Google Scholar]
- 3.Bardot ES, Hadjantonakis AK. Mouse gastrulation: Coordination of tissue patterning, specification and diversification of cell fate. Mech Dev. 2020;163 doi: 10.1016/j.mod.2020.103617. [DOI] [PMC free article] [PubMed] [Google Scholar]
- 4.Arnold SJ, Robertson EJ. Making a commitment: cell lineage allocation and axis patterning in the early mouse embryo. Nat Rev Mol Cell Biol. 2009;10:91–103. doi: 10.1038/nrm2618. [DOI] [PubMed] [Google Scholar]
- 5.O’Rahilly R, Müller F. Developmental stages in human embryos: Revised and new measurements. Cells Tissues Organs. 2010 doi: 10.1159/000289817. [DOI] [PubMed] [Google Scholar]
- 6.Yamaguchi Y, Yamada S. The kyoto collection of human embryos and fetuses: History and recent advancements in modern methods. Cells Tissues Organs. 2019 doi: 10.1159/000490672. [DOI] [PubMed] [Google Scholar]
- 7.Florian J, Hill JP. An Early Human Embryo (No. 1285, Manchester Collection), with Capsular Attachment of the Connecting Stalk. J Anat. 1935 [PMC free article] [PubMed] [Google Scholar]
- 8.De Bakker BS, et al. An interactive three-dimensional digital atlas and quantitative database of human development. Science (80-) 2016 doi: 10.1126/science.aag0053. [DOI] [PubMed] [Google Scholar]
- 9.Warmflash A, Sorre B, Etoc F, Siggia ED, Brivanlou AH. A method to recapitulate early embryonic spatial patterning in human embryonic stem cells. Nat Methods. 2014 doi: 10.1038/nMeth.3016. [DOI] [PMC free article] [PubMed] [Google Scholar]
- 10.Martyn I, Kanno TY, Ruzo A, Siggia ED, Brivanlou AH. Self-organization of a human organizer by combined Wnt and Nodal signaling. Nature. 2018 doi: 10.1038/s41586-018-0150-y. [DOI] [PMC free article] [PubMed] [Google Scholar]
- 11.Simunovic M, et al. A 3D model of a human epiblast reveals BMP4-driven symmetry breaking. Nat Cell Biol. 2019 doi: 10.1038/s41556-019-0349-7. [DOI] [PubMed] [Google Scholar]
- 12.Moris N, et al. An in vitro model of early anteroposterior organization during human development. Nature. 2020 doi: 10.1038/s41586-020-2383-9. [DOI] [PubMed] [Google Scholar]
- 13.Chen D, et al. Human Primordial Germ Cells Are Specified from Lineage-Primed Progenitors. Cell Rep. 2019 doi: 10.1016/j.celrep.2019.11.083. [DOI] [PMC free article] [PubMed] [Google Scholar]
- 14.Molè MA, et al. A single cell characterisation of human embryogenesis identifies pluripotency transitions and putative anterior hypoblast centre. Nat Commun. 2021;12 doi: 10.1038/s41467-021-23758-w. [DOI] [PMC free article] [PubMed] [Google Scholar]
- 15.Xiang L, et al. A developmental landscape of 3D-cultured human pre-gastrulation embryos. Nature. 2020;577 doi: 10.1038/s41586-019-1875-y. [DOI] [PubMed] [Google Scholar]
- 16.Zhou F, et al. Reconstituting the transcriptome and DNA methylome landscapes of human implantation. Nature. 2019;572 doi: 10.1038/s41586-019-1500-0. [DOI] [PubMed] [Google Scholar]
- 17.O’Rahilly R, Müller F. Developmental Stages in Human Embryos. Contrib Embryol, Carnegie Inst Wash. 1987;637 [Google Scholar]
- 18.Pijuan-Sala B, et al. A single-cell molecular map of mouse gastrulation and early organogenesis. Nature. 2019;566:490–495. doi: 10.1038/s41586-019-0933-9. [DOI] [PMC free article] [PubMed] [Google Scholar]
- 19.Ma H, et al. In vitro culture of cynomolgus monkey embryos beyond early gastrulation. Science (80-) 2019 doi: 10.1126/science.aax7890. [DOI] [PubMed] [Google Scholar]
- 20.Petropoulos S, et al. Single-Cell RNA-Seq Reveals Lineage and X Chromosome Dynamics in Human Preimplantation Embryos. Cell. 2016 doi: 10.1016/j.cell.2016.03.023. [DOI] [PMC free article] [PubMed] [Google Scholar]
- 21.Messmer T, et al. Transcriptional Heterogeneity in Naive and Primed Human Pluripotent Stem Cells at Single-Cell Resolution. Cell Rep. 2019 doi: 10.1016/j.celrep.2018.12.099. [DOI] [PMC free article] [PubMed] [Google Scholar]
- 22.Haghverdi L, Büttner M, Wolf FA, Buettner F, Theis FJ. Diffusion pseudotime robustly reconstructs lineage branching. Nat Methods. 2016 doi: 10.1038/nmeth.3971. [DOI] [PubMed] [Google Scholar]
- 23.La Manno G, et al. RNA velocity of single cells. Nature. 2018 doi: 10.1038/s41586-018-0414-6. [DOI] [PMC free article] [PubMed] [Google Scholar]
- 24.Streit A. The preplacodal region: An ectodermal domain with multipotential progenitors that contribute to sense organs and cranial sensory ganglia. International Journal of Developmental Biology. 2007 doi: 10.1387/ijdb.072327as. [DOI] [PubMed] [Google Scholar]
- 25.Trevers KE, et al. Neural induction by the node and placode induction by head mesoderm share an initial state resembling neural plate border and ES cells. Proc Natl Acad Sci U S A. 2017 doi: 10.1073/pnas.1719674115. [DOI] [PMC free article] [PubMed] [Google Scholar]
- 26.Delile J, et al. Single cell transcriptomics reveals spatial and temporal dynamics of gene expression in the developing mouse spinal cord. Dev. 2019 doi: 10.1242/dev.173807. [DOI] [PMC free article] [PubMed] [Google Scholar]
- 27.Yang L, et al. An early phase of embryonic Dlx5 expression defines the rostral boundary of the neural plate. J Neurosci. 1998 doi: 10.1523/JNEUROSCI.18-20-08322.1998. [DOI] [PMC free article] [PubMed] [Google Scholar]
- 28.Roost MS, et al. KeyGenes, a Tool to Probe Tissue Differentiation Using a Human Fetal Transcriptional Atlas. Stem Cell Reports. 2015 doi: 10.1016/j.stemcr.2015.05.002. [DOI] [PMC free article] [PubMed] [Google Scholar]
- 29.Chiquoine AD. The identification, origin, and migration of the primordial germ cells in the mouse embryo. Anat Rec. 1954 doi: 10.1002/ar.1091180202. [DOI] [PubMed] [Google Scholar]
- 30.Magnúsdóttir E, Surani AM. How to make a primordial germ cell. Dev. 2014 doi: 10.1242/dev.098269. [DOI] [PubMed] [Google Scholar]
- 31.Sasaki K, et al. The Germ Cell Fate of Cynomolgus Monkeys Is Specified in the Nascent Amnion. Dev Cell. 2016 doi: 10.1016/j.devcel.2016.09.007. [DOI] [PubMed] [Google Scholar]
Associated Data
This section collects any data citations, data availability statements, or supplementary materials included in this article.
Supplementary Materials
Data Availability Statement
Source data are provided with this paper. The raw data from our study can be downloaded from ArrayExpress under accession code: E-MTAB-9388. The processed data may be downloaded from http://www.human-gastrula.net. Datasets used as references include; Mouse gastrula data: E-MTAB-6967; Pre-implantation embryo data: E-MTAB-3929. Source data for hESC RT-PCR analysis can be found in SI Table 17.
All code is available upon request and at https://github.com/ScialdoneLab/human-gastrula-shiny


