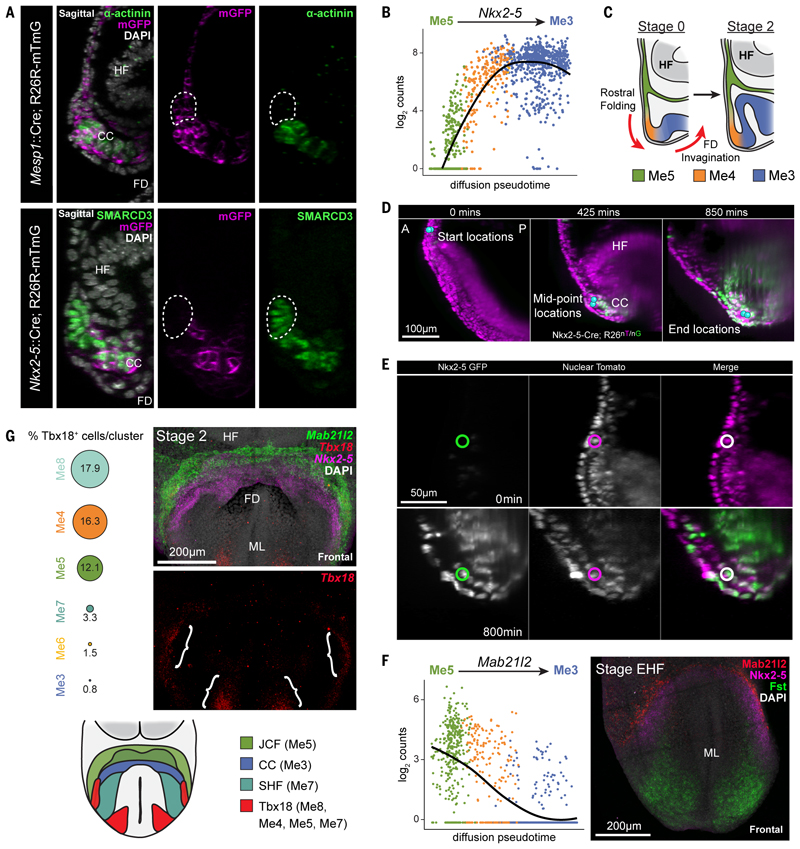
Fig. 5. The JCF represents a cardiac progenitor population.
A, Top, sagittal section of Mesp1-Cre; R26R-mTmG embryos immunostained for α-actinin and GFP (n=6). Bottom, section of Nkx2-5-Cre; R26R-mTmG embryos immunostained for SMARCD3 and GFP (n=4). Dotted regions highlight the JCF, revealing it is derived from Mesp1, but not Nkx2-5, expressing cells. HF; headfold; FD, foregut diverticulum; CC, cardiac crescent. B, Nkx2-5 expression levels plotted against the diffusion pseudotime of all cells consistent with the trajectory from Me5 to Me3. Points are colored based on their assigned cluster. Nkx2-5 is upregulated during the transition from JCF towards cardiomyocytes. The line is the quadratic local linear fit of the expression levels as a function of pseudotime. C, Schematic diagrams highlighting the relative positions of Me3-Me5 during rostral folding and the transition from stage 0 to stage 2 cardiac crescents. D,E, Frames from time-lapse movie of an E7.5 Nkx2-5-Cre; R26-nTnG embryo imaged over a 16-hour period with light-sheet microscopy. D, JCF cells migrated from a more rostral position towards the developing crescent (blue spheres = representative tracked cells). A, anterior; P, posterior. E, Nkx2-5 was upregulated by JCF cells, as shown by an increase in the nuclear expression of GFP. Circles indicate the same cell tracked across time, shown in different channels. Representative cells also shown in Movies S12 and S13. F, On the left, Mab21l2 gene expression levels are plotted against the diffusion pseudotime of all cells consistent with the trajectory from Me5 to Me3. Points are colored based on their assigned cluster. Mab21l2 expression is downregulated during the transition from the JCF towards cardiomyocytes. At right, maximum intensity projection (MIP) of HCR on an early headfold stage (EHF) embryo, prior to crescent formation, revealing the early rostral expression of Mab21l2 in JCF progenitors proximal to Nkx2-5 and Fst expression. 3D rendering of expression is shown in Movie S14. ML, midline. G, Tbx18 is expressed in multiple cell clusters. The percentages of Tbx18-positive cells from each cluster are shown as proportionally sized circles. At right, MIP of HCR for Tbx18, Mab21l2 and Nkx2-5 in a stage 2 embryo, highlighting location of Tbx18 expression (brackets) (Movie S6). Schematic at bottom, highlights Tbx18 expression domains in the anterior crescent region of the developing embryo.

