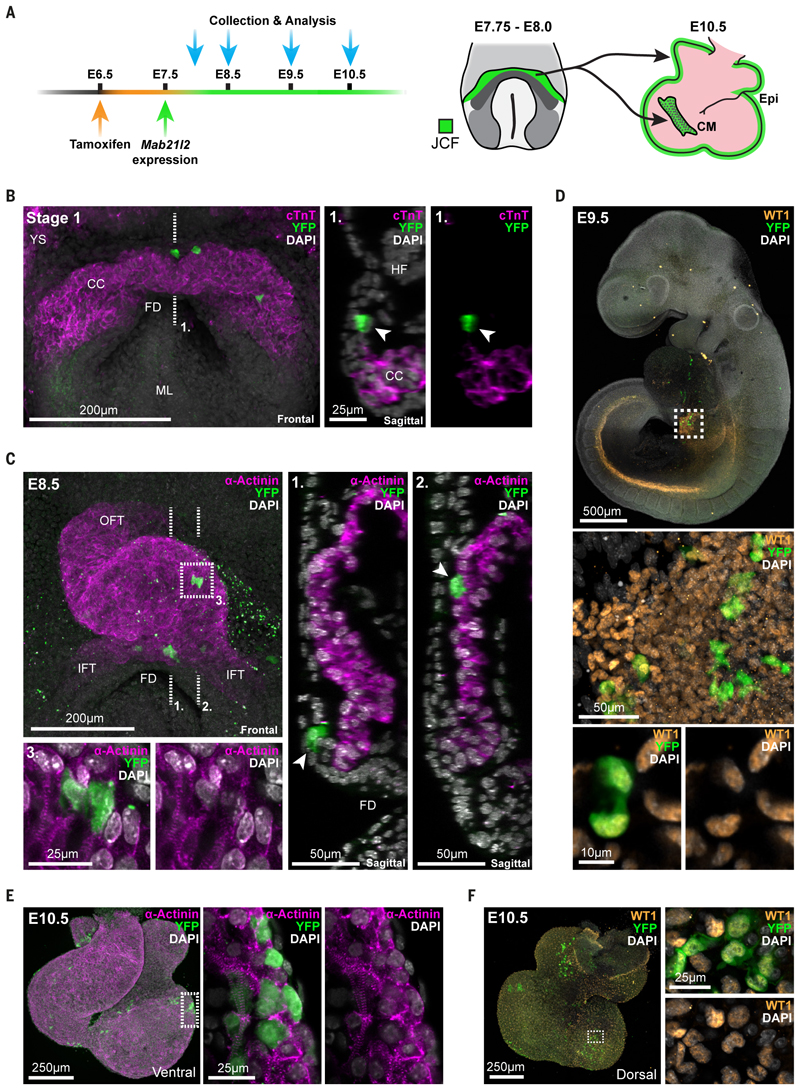
Fig. 6. Juxta-cardiac field progenitors contribute to cardiomyocytes and epicardium.
A, Schematic showing the experimental design of lineage labelling experiments using a Mab21l2- iCreERT2 transgenic mouse line. At right, a schematic highlighting that labelling of the juxta-cardiac field (JCF) between E7.75 and E8.0 leads to labelling of both cardiomyocytes (CM) and the epicardium (Epi) at E10.5. B, Maximum intensity projection (MIP) of a stage 1 Mab21l2- iCreERT2; R26R-YFP embryo immunostained for cardiac troponin T (cTnT) and YFP. The dotted line represents the location of the sagittal section at right. YFP positive cells (arrows) are located in the JCF and do not express cardiomyocyte marker cTnT. CC, cardiac crescent; FD, foregut diverticulum; YS, yolk sac; ML, midline; HF, headfold. C, MIP of a looping heart tube from an E8.5 Mab21l2-iCreERT2; R26R-YFP embryo immunostained for α-actinin and YFP. Dotted lines show locations of sagittal sections at right. Arrows highlight the location of recombined YFP cells within the myocardium (2.) and maintained within the JCF progenitor region (1.). The dotted box (3.) shows zoomed in view of JCF derived cardiomyocytes with sarcomeric striations of α-actinin. OFT, outflow tract; IFT, inflow tract. D, MIP of an E9.5 embryo immunostained for WT1 and YFP. WT1 marks both the nephrogenic cord and proepicardium (boxed). Below are high magnification views of the proepicardium highlighting the coexpression of YFP and WT1. E and F, Immunostaining of E10.5 hearts showing co-expression of α-actinin (E) and WT1 (F) with YFP positive cells, highlighting the dual potential of the JCF. Dotted boxes represent zoomed in regions. Dorsal and ventral views shown.

