Abstract
During megakaryopoiesis, megakaryocytes (MK) undergo cellular morphological changes with strong modification of membrane composition and lipid signaling. Here we adopt a lipid-centric multiomics approach to create a quantitative map of the MK lipidome during maturation and proplatelet formation. Data reveal that MK differentiation is driven by an increased fatty acyl import and de novo lipid synthesis, resulting in an anionic membrane phenotype. Pharmacological perturbation of fatty acid import and phospholipid synthesis blocked membrane remodeling and directly reduced MK polyploidization and proplatelet formation resulting in thrombocytopenia. The anionic lipid shift during megakaryopoiesis was paralleled by lipid-dependent relocalization of the scaffold protein CKIP-1 and recruitment of the kinase CK2α to the plasma membrane, which seems to be essential for sufficient platelet biogenesis. Overall, this study provides a framework to understand how the MK lipidome is altered during maturation and the impact of MK membrane lipid remodeling on MK kinase signaling involved in thrombopoiesis.
Introduction
Deriving from pluripotent hematopoietic stem cells in the bone marrow (BM), megakaryocytes (MK) are responsible for the production of platelets, thus being essential for hemostasis and vascular integrity. Since MKs produce thousands of platelets, irregularities in MK differentiation (megakaryopoiesis) affect platelet generation or function and can result in clinically significant disorders. Thrombocytopenia or impaired platelet function might lead to disrupted primary hemostasis with increased risk of bleeding. Oppositely, elevated platelet counts (thrombocythemia) or excessive platelet activation increases the risk for thrombotic events and ischemic diseases.1
After the hematopoietic stem cell was discovered more than 150 years ago2,3, the description of megakaryopoiesis at the omics scale is still in its infancy, although the cellular processes underlying megakaryopoiesis are well-defined nowadays.4 MKs become polyploid during their maturation due to endomitotic processes and reach diameters of up to 100 μm. However, they only occur with a frequency of 0.2% when compared to other nucleated blood cells, making them hard to study. The entire process of megakaryopoiesis is accompanied by a substantial membrane reorganization, including shaping a lobulated nuclear envelope, packing granules, generating the lipid-rich demarcation membrane system (DMS)5, and MK polarization towards the protrusion of proplatelets into the sinusoids of the BM6. Altogether, these processes make it necessary to adapt membrane properties constantly. Especially sphingolipid metabolism and signaling7–9 are indicated in the elongation of proplatelet extensions and the shedding process of platelets. Recently, there is growing scientific evidence that de novo lipogenesis may modulate MK maturation and platelet production.10 It has been reported that maturating MKs incorporate fatty acids (FA) released by adipocytes closely located to MKs in the BM to facilitate thrombopoiesis11. Consequently, the FA transfer from adipocytes to MKs has important clinical implications in obesity-related cardiovascular thrombotic complications.
However, despite its high clinical importance, the MK lipidome composition is still ill-defined and the lipid-dependent processes during MK maturation and platelet biogenesis, are largely unknown.
The existence of more than 350 lipids in platelets12 with the capability to influence membrane geometry and platelet signaling13, demands a systematic large-scale modulation potential of the lipid metabolism in MKs. Over the last ten years, mass spectrometry (MS) has evolved into the state-of-the-art technology for lipid analysis. The improvements in sensitivity, speed, and resolution, coupled with developments in systems biology14, the ease of access to lipid databases15 and search engines, along with the availability of lipid standards for accurate quantification, have made it possible to explore various aspects of lipid function and regulation16. Present-day lipidomics tools provide access to understand lipids' complexity, homeostatic regulation, and their role in differentiation, thus linking lipids to diseases and cellular impairments such as platelet dysfunction. Therefore, it is astonishing that neither a quantitative lipid inventory nor a map of the lipid metabolism of MKs is currently available.
Additionally, information gained from multiomics is more valuable when extracted from multiple layers of evidence of one biological sample. This accounts for missing values and point to new molecular mechanisms and interactions. Although lipidomics and proteomics were successfully applied to investigate different blood cells, the potential of multiomics has yet to be fully explored. Here, we established a multiomics extraction strategy and quantitative MS workflow to determine lipid metabolism and its modulating effect on megakaryopoiesis and proplatelet formation. Employing this unique approach, we were able to define regulatory metabolic mechanisms shaping the MK lipidome during MK maturation. These mechanisms directly influence the processes that are critically involved in thrombopoiesis, and their inhibition results in profound thrombocytopenia.
Results
Dynamic lipid metabolism modulation in megakaryopoiesis
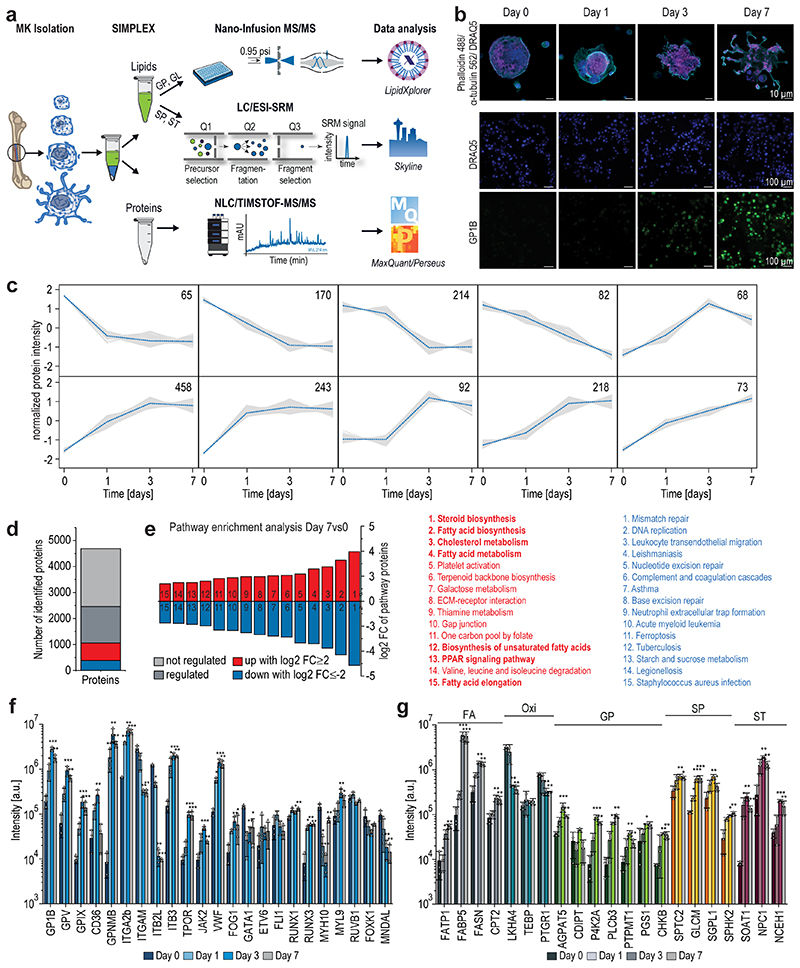
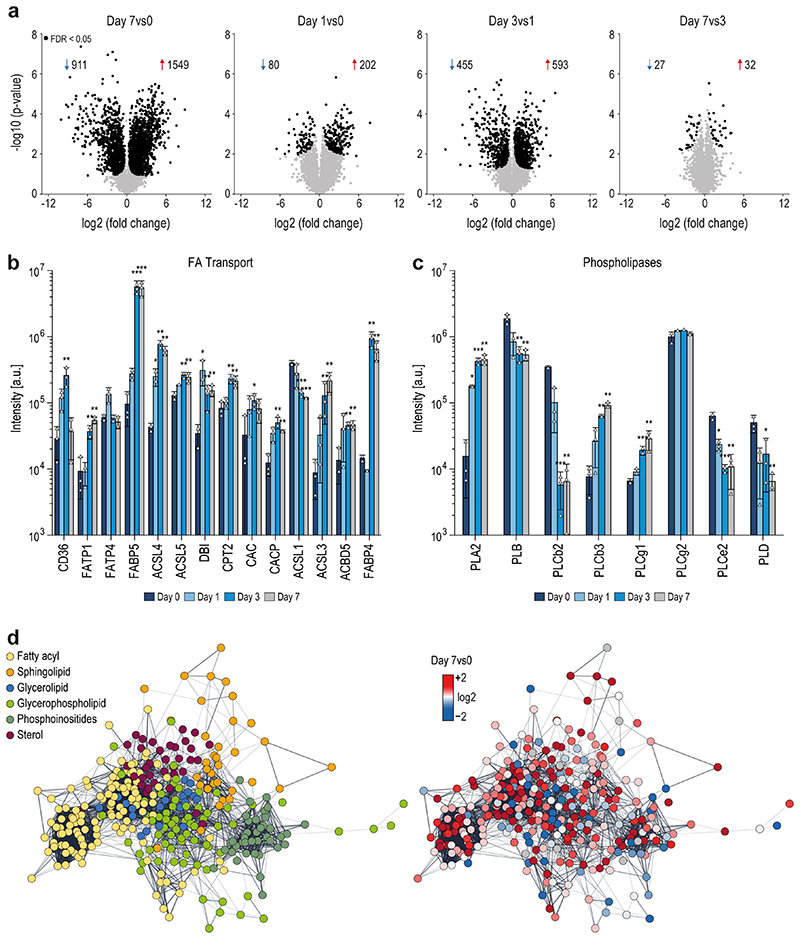
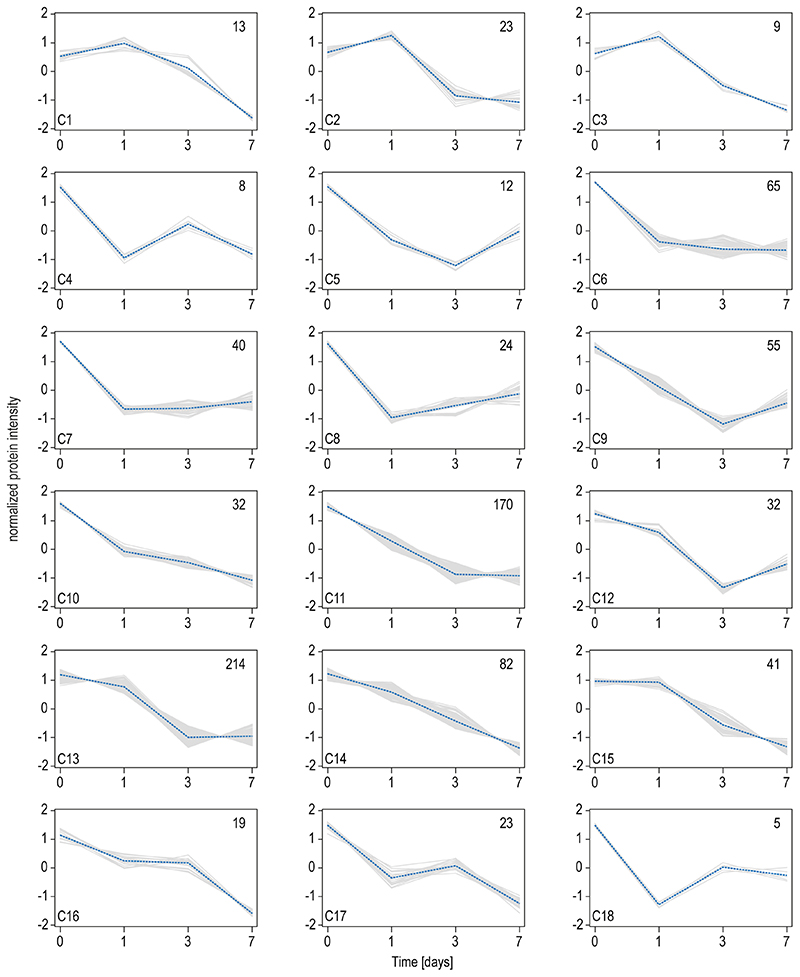
For multiomics method development, hematopoietic stem cells were isolated from BM of 10-14 weeks old male mice and subjected to a 7-day differentiation protocol. The SIMPLEX workflow (Fig.1a), allowing simultaneous lipid and protein sample preparation, was employed to determine their general molecular composition.17–19 The differentiation efficiency was monitored by immunocytochemistry staining of the MK surface marker GP1B and the nuclear lobulation using a DRAQ5 DNA stain (Fig.1b). The MS-based global proteomics analysis was integrated with top-down shotgun and targeted lipidomics to establish the multiomics workflow (Fig.1a). In total, 4651 proteins, with two or more unique peptides, were identified and relatively quantified by nanoLC-high-resolution MS. Across the time course of differentiation, comparing all days, 3152 proteins were significantly regulated, with approximately 1908 proteins displaying continuous upregulation, 1189 showing downregulation, and about 55 were transiently regulated. During MK maturation, protein regulation mostly occurred between days 1 and 3, with 593 proteins being upregulated and 455 downregulated (Extended Data Fig.1a). Computing fuzzy c-means clustering of all regulated proteins (p<0.01) from day 0 to 7, we identified 39 distinct clusters using a similarity threshold of 85% (Fig.1c,Extended Data Fig.2–3). Here, 607 proteins showed an overall downward trend, whereas 979 proteins showed an upward trend. In a subsequent pathway enrichment analysis, considering significantly regulated proteins from day 0 to 7 with a log2 fold change (FC) ≥2 or ≤-2 (Fig.1d), pathway hallmarks of megakaryopoiesis were enriched, such as platelet and ECM receptor activation (Fig.1e). However, most strikingly, 7 lipid-specific pathways were identified under the top 15 most enriched biosynthesis pathways ranging from steroid biosynthesis over the PPAR signaling pathway to FA elongation (Fig.1e), pointing to a strong dependency of MK differentiation on lipid metabolism. The data were particularly analyzed for markers to underscore the enrichment analysis and further evaluate the differentiation process and the discovered link to lipid metabolism. MK differentiation markers such as RUNX1, RUNX3, and GATA120–22, and surface markers such as GP1B, CD36, VWF, GPV, GPNMB, and integrins23–27 were monitored and shown to be highly regulated (Fig.1f). Moreover, specific domains of lipid metabolism, such as the FA receptors, transporters, the FA synthetase itself or mitochondrial FA importers are highly upregulated in maturating MKs (Fig.1g,Extended Data Fig.1b). Moreover, the metabolism of complex lipids such as phospholipids, sphingolipids, and sterols are elevated, whereas other enzymes derived from the oxylipin metabolism were downregulated or unregulated as indicated by their corresponding metabolizing enzymes (Fig.1g,Extended Data Fig.1c). Using the latest MS technologies, we assembled a lipid metabolic network of more than 300 proteins involved in lipid transport, synthesis, and degradation that shows substantial regulation during MK maturation (Extended Data Fig.1d). This strong metabolic rewiring at the protein level raised the question to what extent this is reflected in the lipidome and if this multiomics-derived information can be used to generate novel hypotheses.
Fig. 1. Global proteomics analysis highlights key changes of proteins steering MK maturation.
a, Multiomics workflow for the quantitative assessment of the lipidome and proteome of maturating megakaryocytes.
b,Representative immunofluorescence staining of GP1B (platelet glycoprotein Ib beta chain, green) expressed in the late stage of MK maturation and platelets (n=6). Nuclei were stained with DRAQ5 dye (blue). Scale bar equals 10 (upper panel) and 100 (lower panel) μm.
c, Fuzzy c-means clustering of regulated proteins from day 0 to day 7. Number of proteins and their median are denoted in individual plots and only a selection of clusters is shown. Note over 2229 proteins are not regulated and therefore not considered. The assignment of proteins to clusters can be found in the Source Data. Threshold = 85.
d, Diagram showing non-regulated (light grey) and significantly regulated proteins comparing day 7vs0, with the latter being divided into three sections: up (red)- or down (blue)-regulated proteins with a log2 FC ≥2 or ≤-2, respectively, and other regulated proteins (dark grey) with log2 FC between -2 and +2.
e, Pathway enrichment analysis of significantly regulated proteins with log2 FC ≥2 or ≤-2 showing the top 15 enriched pathways of only up (red)- or down (blue)-regulated proteins. Pathways were sorted by their fold enrichment independent of the number of proteins involved. Pathway enrichment analysis was performed using the open-source DAVID bioinformatics tool.
f,g, Bar graphs of various MK differentiation markers (f) as well as lipid-related enzymes (g) displayed with their associated lipid category. Proteomics data were combined from 3 independent experiments with 4 pooled mice per biological replicate. Means are displayed with the standard deviation represented as error bars. A two-sided t-test was used for statistical analysis. Benjamini Hochberg correction was applied to p-values using an FDR cut-off < 0.05 (*P ≤ 0.05, **P ≤ 0.01, ***P ≤ 0.001). FA, free fatty acid; Oxi, oxylipin; GP, glycerophospholipid; SP, sphingolipid; ST, sterol.
The MK membrane lipidome has specific signatures
For global quantitative lipidomics of MKs during maturation, we used the established workflow (Fig.1a) integrating shotgun and targeted lipidomics, to detect both, low-abundant lipid species (e.g. ceramides), as well as major membrane components (e.g. glycerophospholipids) simultaneously. All lipid molecules were sequenced and their concentrations were reported using internal standards.
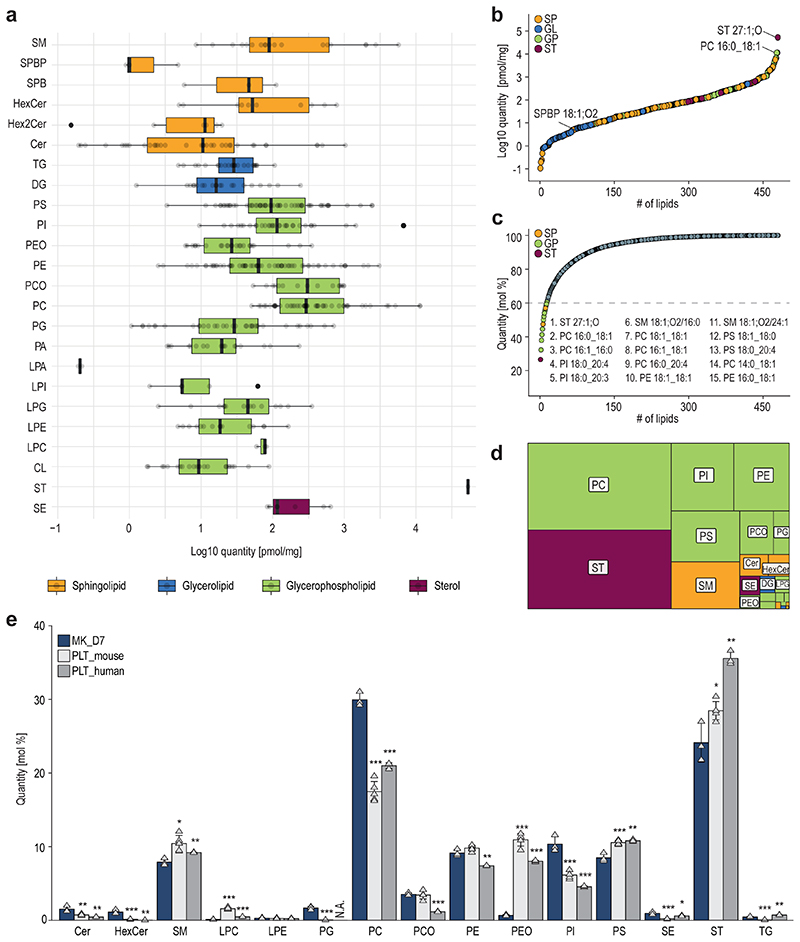
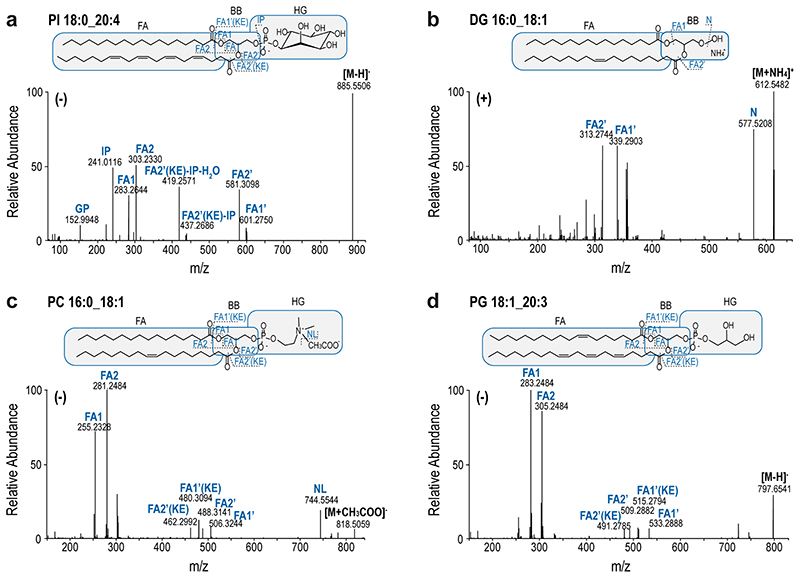
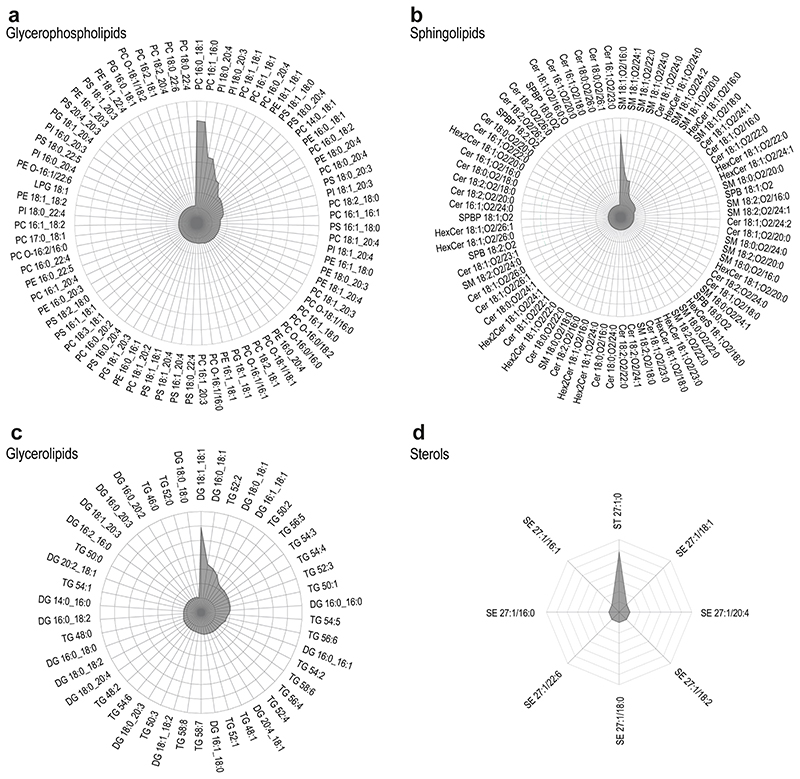
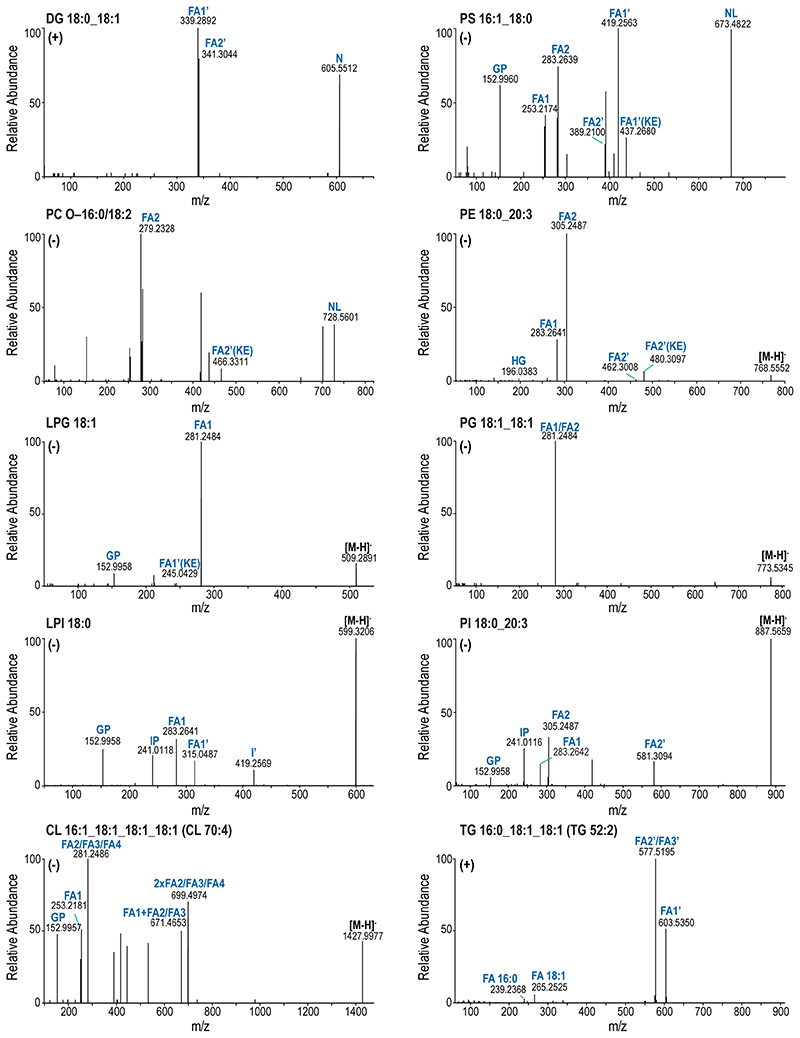
To ensure lipid identification with high confidence, all lipid molecules were structurally characterized by MS/MS, enabling the determination of the number of carbon atoms and double bonds for each FA chain (Extended Data Fig.4–5). Knowledge about the FA composition is crucial, since rearrangement and exchange of FAs constantly occur during fundamental cell-fate decisions28,29 or differentiation30. Furthermore, it contributes to the membrane’s physicochemical features, including lateral diffusion and stiffness, but most importantly, it provides the precursor reservoir of many signaling molecules.12,13 The present study structurally characterized and identified 473 lipid species in differentiated MKs (Fig.2) originating from the main lipid categories glycerophospholipids (GP, 343), glycerolipids (GL, 46), sphingolipids (SP, 76), and sterols (ST, 8), thereby covering 24 different lipid classes.
Fig. 2. Quantitative lipidomics of mature megakaryocytes covers a high dynamic range of 6 orders of magnitude.
a, Boxplots displaying the dynamic range of the MK lipidome after seven days of maturation. Quantities of four lipid categories (sphingolipids, glycerolipids, glycerophospholipids, and sterols) spanning 24 lipid classes and 473 lipid species are shown. Each bar is composed of all quantified lipid species within the respective class. SM, sphingomyelin; SPBP, sphingoidbases-phosphate; SPB, sphingoidbases; HexCer, hexosylceramide; Hex2Cer, dihexosylceramid; Cer, ceramide; TG, triacylglycerol; DG, diacylglycerol; PS, phosphatidylserine; PI, phosphatidylinositol; PEO, phosphatidylethanolamine-ether; PE, phosphatidylethanolamine; PCO, phosphatidylcholine-ether; PC, phosphatidylcholine; PG, phosphatidylglycerol; PA, phosphatidic acid; LPA, lyso-PA; LPI, lyso-PI; LPG, Lyso-PG; LPE, Lyso-PE; LPC, Lyso-PC; CL, cardiolipin; ST, cholesterol; SE, cholesterol-ester.
b, Relative lipid class distribution. Classes are color-coded by category. GL, glycerolipids; GP, glycerophospholipid; SP, sphingolipid; ST, sterol.
c, Cumulative lipid abundance, 15 lipid species account for more than 60% of the total lipid content of mature MKs.
d, Dynamic range of quantified lipid species covering 6 orders of magnitude.
e, Relative distribution of main lipid classes from mature MKs as well as mouse and human platelets in mol%. For statistical analysis, a two-sided t-test was used and both platelet samples were tested against MK day 7 (*P ≤ 0.05, **P ≤ 0.01, ***P ≤ 0.001).
All data show the mean of 3 biological replicates. One biological replicate was comprised of 5 individual animals. In A, boxplot whiskers represent the minimum and maximum, box boundaries represent the 25th and 75th percentile, and the centre line represents the mean. In E, error bars represent standard deviations.
Quantitative lipid analysis was executed utilizing internal standards that co-ionize with the target analyte. Lipids were normalized based on a fixed number of cells and the protein amount. Assembling of the quantitative results revealed a dynamic range of 6 orders of magnitude similar to the platelet lipidome (Fig.2a,b).12 In mature MKs, low abundant species such as the signaling molecule SPBP 18:1;O2 (5 pmol/mg), were detected alongside major structural components such as cholesterol (48523 pmol/mg) and PC 16:0_18:1 (11427 pmol/mg) (Fig.2b). Most lipid classes displayed a quantitative distribution of over two orders of magnitude. In contrast, lyso-phospholipid species, which have signaling capabilities, had a narrower range, likely representing a more tightly controlled metabolism (Fig.2a). Our evidence shows that 60% of the entire lipid mass is accounted for by 15 lipids, and 70% by 29 lipids (Fig.2c), making them essential building blocks for the membrane integrity of the MK lipidome.
Compared to platelets, in which already 15 lipids cover 70% of the lipid mass12, the MK lipidome seems to be twice as complex, with more lipids contributing to the membrane properties. The most abundant lipid classes detected within mature MKs were cholesterol (ST), phosphatidylcholine (PC), phosphatidylethanolamine (PE), phosphatidylinositol (PI), phosphatidylserine (PS), and sphingomyelin (SM) (Fig.2d).
Interestingly, besides arachidonic acid (FA 20:4), which dominated the top 15 lipids in platelets, here eicosatrienoic acid (FA 20:3) is also found under the most abundant molecules in MKs, indicating slight differences in the FA composition of major lipid classes. These differences underscore the likelihood that not only the DMS of MKs determines the platelet lipidome, but also subsequent processes such as aging and interaction with the microenvironment during circulation are involved in shaping platelet membranes. Nevertheless, critical precursors for platelet signaling like PI 18:0_20:4 are already abundantly available in MKs. Comparing fully mature MKs against the lipidome of human31 and mouse12 platelets reveals an equal basis for various lipid classes such as PE, PS, ST, cholesterol ester (SE), PC-ether lipids (PCO), triacylglycerol (TG), and Lyso-PE (LPE) (Fig.2e). However, PC, PI, and PE-ether lipids (PEO), and especially sphingolipid classes such as ceramides (Cer) and hexosylceramides (HexCer), display very distinct abundances. Currently, we can only speculate why this is the case. Platelets lose their ability to synthesize sphingolipids de novo32, therefore, higher levels in MKs are likely. Higher ceramide levels stabilize Cer-rich platforms, which are needed to preserve multiple signaling processes or be precursors themselves, steering megakaryopoiesis and thrombopoiesis.9,33
Anionic membrane remodeling in MK maturation
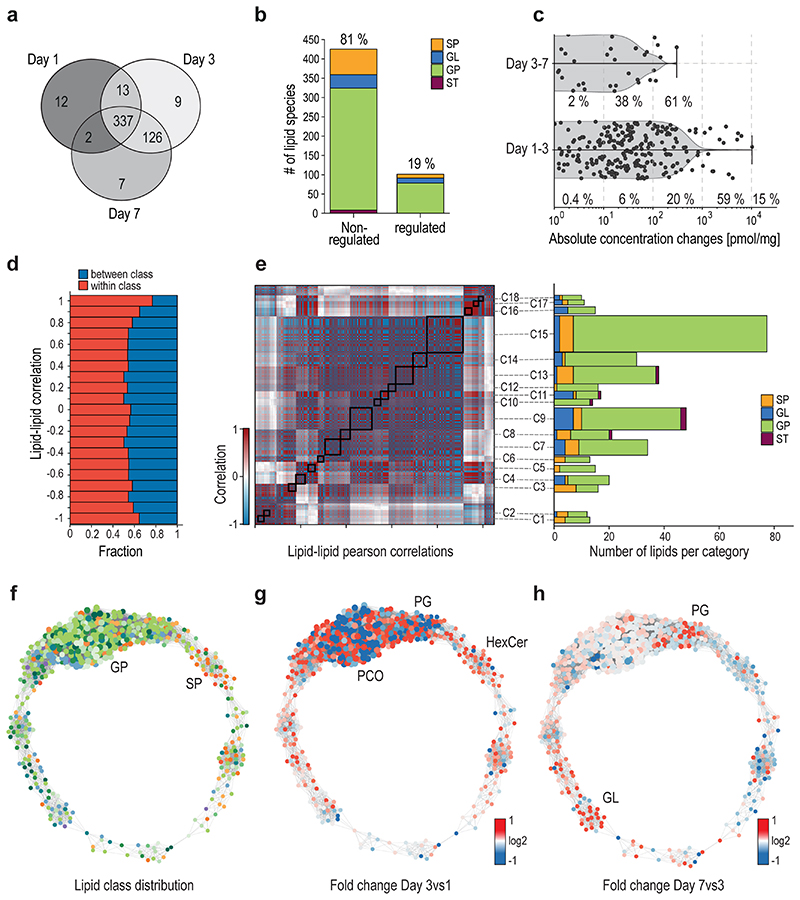
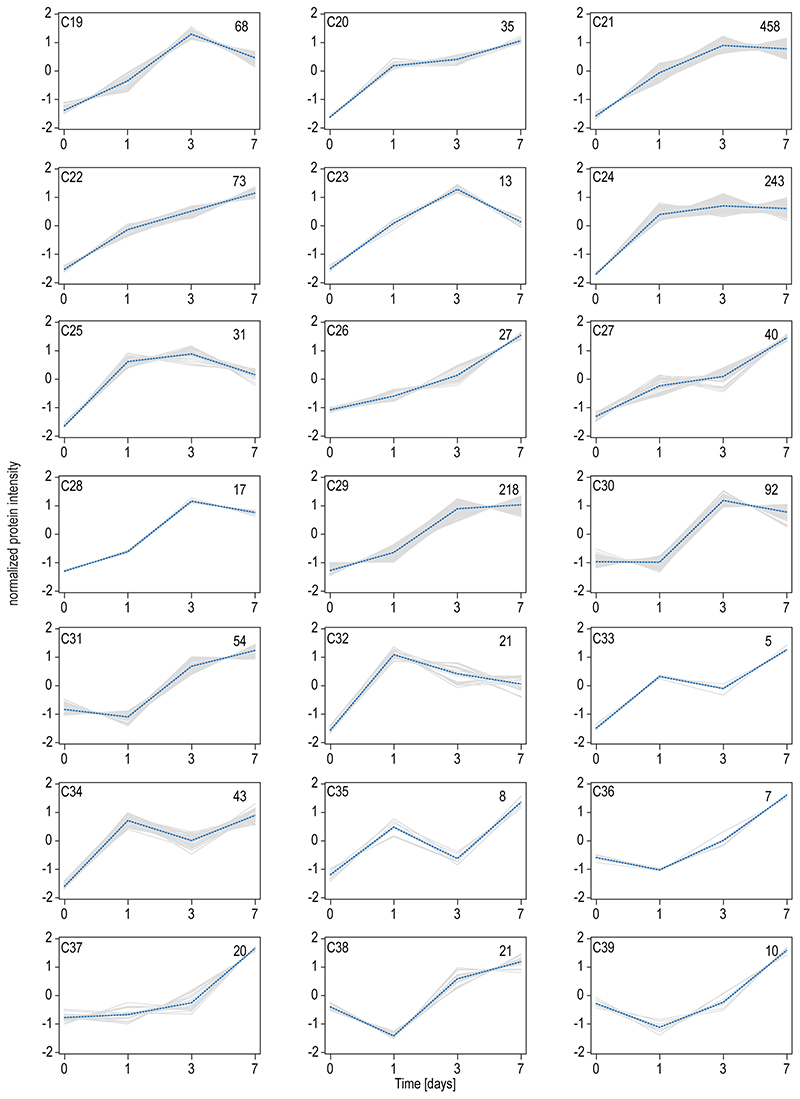
To gain further insight, the MK lipidome was analyzed on days 1, 3, and 7. Generally, the total membrane content was found to be increased within the first three days, as also observed in the lipids to protein ratio. Overall, 337 lipids were shared across all days, whereas approximately ten lipids were distinct for specific days (Fig.3a). The lipidome seems to be rather stable, as 81% of lipids were not regulated during differentiation (Fig.3b). The 19% regulated lipids (FC≥2/≤-2, p≤0.05) are mainly derived from low-abundant lipids. Nevertheless, 15 species belonging to 75% of the membrane lipidome are also altered, indicating a change in membrane properties (Fig.3c). Therefore, we aimed to elucidate higher organizational rearrangements in membranes (Fig.3d-h). First, we analyzed the coregulation of 506 lipids at the individual molecular lipid species level using absolute concentrations, revealing that most correlated lipids can be found within, but not across classes (Fig.3d). Applying the Pearson correlation computed for any lipid pair, 18 distinct clusters of correlated and anticorrelated lipids were identified during differentiation (Fig.3e). As expected, GPs and SPs were distributed over all clusters, whereas STs were only observed in clusters C8-C13. However, lipid abundance, and the individual alterations of each species, are difficult to access from a hierarchical view. Therefore, the lipid-lipid correlation matrix was transformed into a network (Fig.3f-h). Here, most lipid regulation appears between days 1 and 3, and only minor changes can be observed afterward, indicating that the membrane composition is relatively early determined during megakaryopoiesis. Interestingly, similar trends could be observed in the proteomic results (Extended Data Fig.1a).
Fig. 3. Absolute lipid quantification during megakaryopoiesis reveals a stable lipidome and distinct clusters of regulation.
a, Venn diagram of shared and distinct lipids across the time course of differentiation.
b, Bar graph of significant regulated and non-regulated lipids during megakaryopoiesis.
c, Quantitative proportion of regulated lipids on the overall observed concentration changes
d, Analysis of the fraction of correlations connecting lipids of the same lipid class (red) or different lipid classes (blue), as a function of correlation strength.
e, Hierarchical clustering of the lipid-lipid correlation and anticorrelation matrix. Rows and columns correspond to the 506 quantified lipid species. Black boxes indicate clusters of strongly correlated and anticorrelated lipids with a Pearson correlation coefficient (r) of 0.99 or above. Lipid cluster numbers are indicated on the right. Number of lipids in each cluster are sorted by lipid class.
f, Network visualization of the lipid-lipid correlations. Nodes are individual lipid species. Edges are correlations or anticorrelations (r ≥0.99). Node size represents the degree of connectivity and the node color represents the analyzed lipid class (see inset).
g,h, The network during differentiation. The FC was mapped onto the generated network. Pure red indicates a FC ≥2 and pure blue an FC ≤ -2. Data are combined from 3 independent biological experiments and mean values are shown.
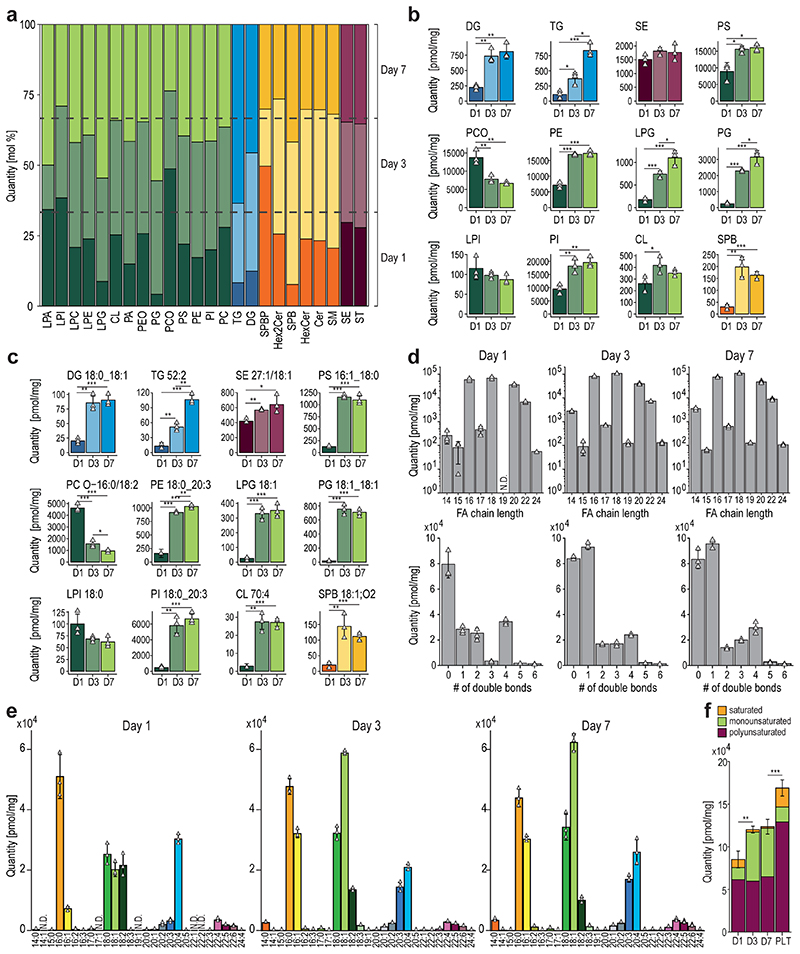
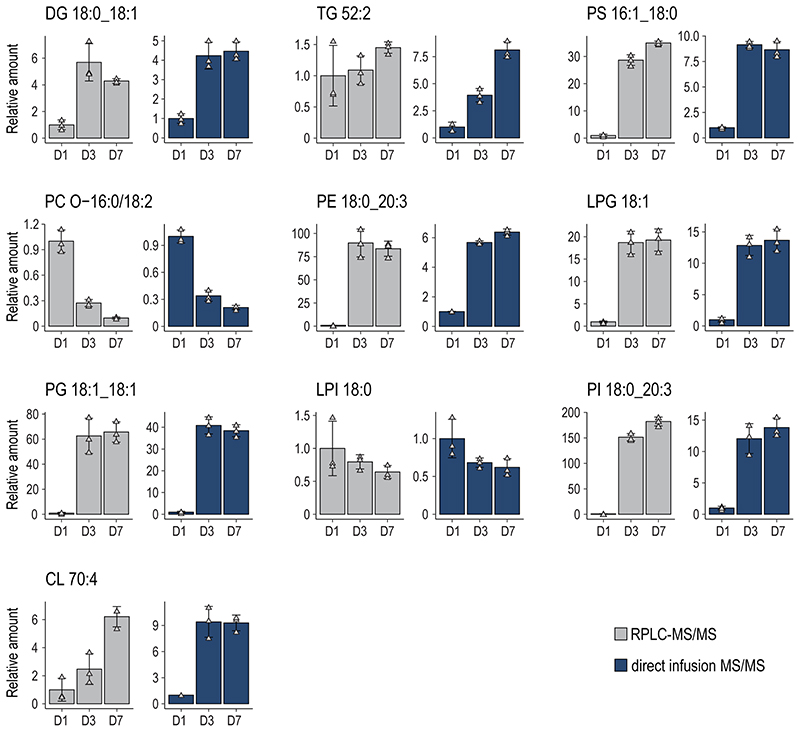
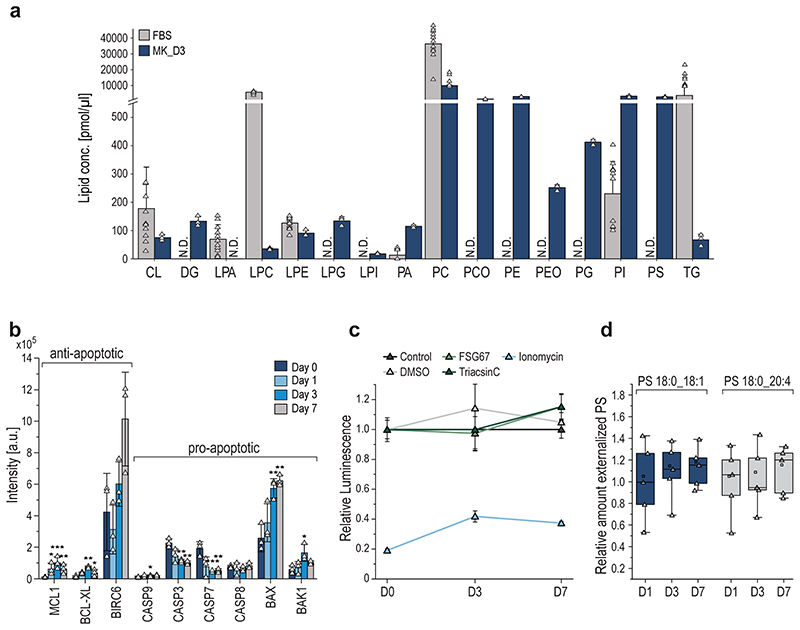
To further dissect the reorganization of the MK lipidome during differentiation, we carried out a quantitative analysis at the lipid category, lipid class, and molecular species level, as well as on the corresponding FA composition using absolute concentrations. By investigating the lipidome-wide class-specific representation (Fig.4a), the results obtained earlier could be emphasized. More specifically, many lipid classes show regulation early on and are rather unchanged in the late stage of differentiation after day 3. Most significantly regulated classes like diacylglycerol (DG), TG, PS, PCO, PE, phosphatidylglycerol (PG), Lyso-PG (LPG), PI, Lyso-PI (LPI), and sphingoid bases (SPB) follow this trend at class and individual lipid species level with PG and its lyso-forms that are further upregulated at day 7 (Fig.4b,c). LPI and PCO show opposing trends and are downregulated. Lipids of high interest were validated by high-resolution targeted LC-MS/MS (Extended Data Fig.6–7). To prove that lipid changes are not mirroring the lipid composition of the media or are induced by apoptosis we analyzed the fetal bovine serum, determined apoptotic markers, conducted a cell vitality assay, and proved by surface labeling that the PS amount is not increased in the outer membrane leaflet (Extended data Fig.8a-d).
Fig. 4. Quantitative lipid inventory analysis of MKs reveals shifts in fatty acid and double bond distribution during the course of MK maturation.
a, Relative lipid class distribution at different time points (dark = day 1, light = day 3, medium = day7) of MK maturation.
b, Absolute concentrations of selected lipid classes.
c, Selected lipid species, each representing the corresponding class displayed in b.
d, Amount and distribution of fatty acid chain length (number of carbon atoms) (top) and double bonds (bottom) of glycerophospholipids on days 1, 3, and 7 of MK maturation.
e, Bar graphs of fatty acid absolute abundances derived from different glycerophospholipid species.
f, Absolute quantification of the saturated, mono-unsaturated, and poly-unsaturated fatty acid (PUFA) content of glycerophospholipids during megakaryopoiesis (on days 1, 3, and 7) and in platelets (PLT).
All data show the mean of 3 biological replicates. One biological replicate was comprised of 5 individual animals. Error bars represent standard deviations. In f, error bars represent summed standard deviations of the total FA content each day. A two-sided t-test was used for statistical analysis (*P ≤ 0.05, **P ≤ 0.01, ***P ≤ 0.001).
Regarding the molecular lipid composition, FA shifts can be observed toward a more unsaturated membrane (Fig.4d,e). However, this is mainly due to an increased level of single monounsaturated FAs rather than total polyunsaturated FAs (PUFA). Here, a decrease in arachidonic acid with a balancing increase of FA 20:3 can be observed (Fig.4e). Nevertheless, the total PUFA levels remain unchanged (Fig.4f). Interestingly, PUFA lipids are more abundant in platelets compared with MKs, supporting the hypothesis that the lipidome of platelets is still being formed after release from MKs (Fig.4f).
Moreover, we observed an increase in odd long-chain FAs (Fig.4d) from day 1 to 3, which is likely due to increased branched-chain FAs and their oxidations and unraveled that lyso-lipids with signaling capabilities like LPG, LPC, LPA, and SPB are upregulated till the end of MK differentiation. Our data reveal that megakaryopoiesis is likely modulated from different mechanisms such as i) lipidome rearrangement (membrane charge, e.g. PG), ii) modulation of the FA lipid composition (membrane fluidity, FA 18:1) and iii) the production of signaling molecules (DG, LPG, SPB).
Phospholipid synthesis is essential for proplatelet-forming MKs
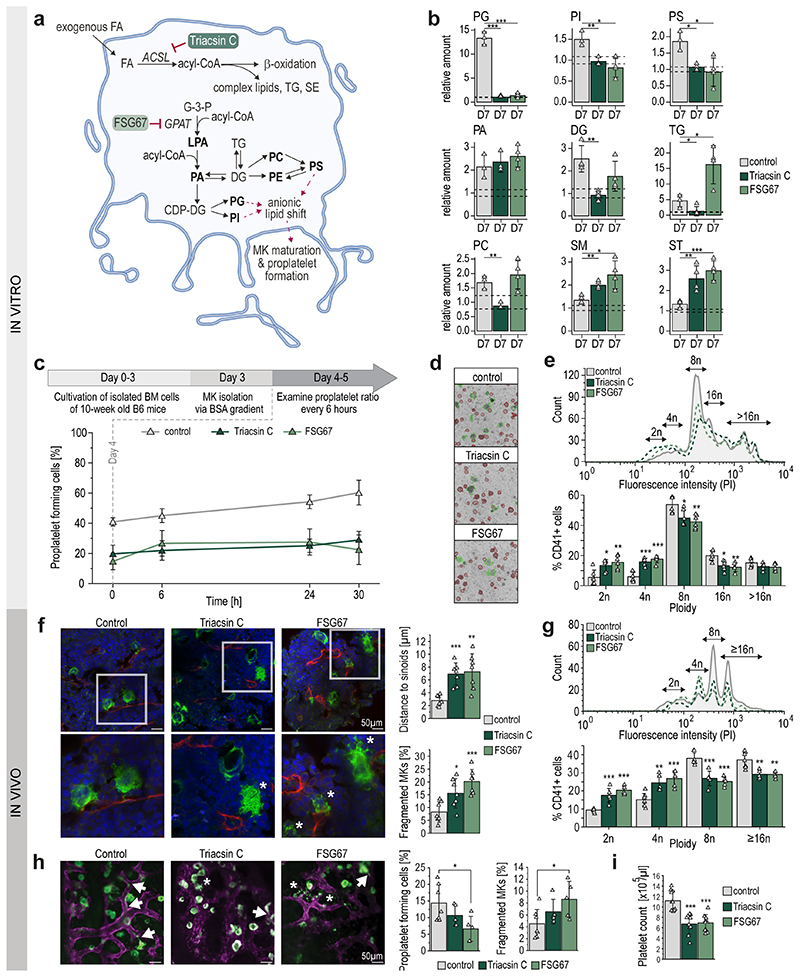
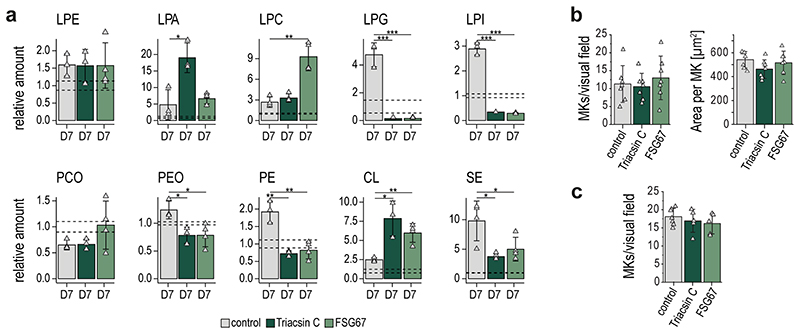
For validation of our previous data, we inhibited the de novo phospholipid biosynthesis at two initiation points (Fig.5a). In this regard, we added either a long-chain acyl-CoA synthetase (ACSL) inhibitor (Triacsin C), an inhibitor of glycerol-3-phosphate acyltransferase (GPAT) (FSG67), or vehicle control to the freshly isolated BM cell suspension and harvested TPO stimulated MKs on day 7. Non-treated day 0 MKs were used as baseline control and changes for all lipid classes were calculated as ratios relative to the control. Treatment with either inhibitor diminished the production of almost all phospholipids, including anionic lipids such as PG, PI and PS (Fig.5b,Extended Data Fig.9a). Interestingly, PA abundances were not altered, indicating a redistribution between lipid classes to preserve PA content. In FSG67-treated MKs, we observed slightly, but not significantly decreased levels of DG and an increase in PC. Of note, TGs increased 3-fold compared to day 7 control, likely due to the production of lipid droplets to compensate for high levels of acyl-CoA within the cell. While phospholipid biosynthesis is hampered when inhibitors are employed, the production of SM and ST appears to be enhanced. This could be due either to an excess of serine and palmitoyl-CoA that cannot be incorporated via normal lipogenesis, or to act as functional substituents of other stabilizing membrane lipids. To elucidate the role of phospholipids in MK maturation, we first monitored control and inhibitor-treated MKs and visually examined their ability to form proplatelets. MKs were taken after 3 days differentiation and proplatelet formation was observed for 30 hours. The number of proplatelet-forming MKs increased by only 9% for FSG67- and Triacsin C-treated MKs, instead of 20% as observed for normal MKs (Fig.5c,d). Further, polyploidization of inhibitor-treated MKs was markedly impaired as reflected by a significant reduction of polyploidy and a significantly higher percentage of MKs with a DNA content <8N (Fig.5e). Both inhibitors resulted in an overall greatly reduced number of proplatelet-forming cells compared to the control, indicating that proper megakaryocyte development and proplatelet formation requires both, de novo lipid synthesis and uptake of exogenous FAs from dietary lipids.
Fig. 5. Inhibition of de novo phospholipid biosynthesis pathways leads to reduced MK polyploidization and proplatelet formation.
a, Schematic representation of FA uptake and phospholipid biosynthesis pathways. Acyl-CoA is generated from FAs via long-chain acyl-CoA synthetase (ACSL) and transferred into glycerol-3-phosphate (G-3-P) by glycerol-3-phosphate acyltransferase (GPAT) to create LPA. Inhibitors of the enzymatic steps are illustrated by red inhibitory arrows. Dotted arrows connect lipids to anionic lipid shift illustrating putative functions in proplatelet formation.
b, Relative amount of depicted lipid classes of control and inhibitor treated MKs (Triacsin C, FSG67) on day 7. Non-treated day 0 MKs were used as baseline control and lipid quantities were set to 1 and the standard deviation is depicted as dotted lines. Changes for all lipid classes were calculated as ratios relative to control day 0.
c, Number of proplatelet-forming cells in vitro of control and inhibitor-treated MKs examined from day 4 for 30 hours (means±SD, n=5).
d, Representative images of proplatelet forming MKs after 24hrs examination.
e, Representative ploidy histogram and arithmetic means of DNA content of control and inhibitor treated CD41+ BM-derived MKs cultured for 5 days (n=6).
f, Representative confocal microscopy images of immunostained femora cryosections (left) and arithmetic means±SD (n=6, right) of MK localization (distance to sinusoids) and fragmentation in the BM of mice subjected to DMSO, Triacsin C, or FSG67 injections for seven days. Green, MKs (GPIb); red, sinusoids (CD105); blue, nuclei (DRAQ5). Asterisks indicate fragmented MKs.
g, Representative ploidy histogram and arithmetic means of DNA content of BM MKs from Triacsin C, FSG67 or vehicle treated mice (n=5-7).
h, Representative median projections of 25 μm z-stacks (left) and arithmetic means±SD (n=5-7, right) of MK fragmentation and proplatelet forming MKs from the BM of Triacsin C, FSG67 or vehicle treated mice. Arrows indicate proplatelets and asterisks indicate fragmented MKs. Green, MKs/platelets (GPIX derivative); magenta, vessels (CD105). Graphs represent ratios of proplatelet-forming (left panel) and fragmented MKs (4-8 z-stacks per mouse).
i, Platelet count of Triacsin C, FSG67 or vehicle treated mice (n=9).
A two-sided t-test was used for statistical analysis (*P ≤ 0.05, **P ≤ 0.01, ***P ≤ 0.001).
These results could also be translated into in vivo conditions. Treatment of mice with either inhibitor over a period of seven days resulted in a significant reduction in the MK sinusoid contact with a significantly higher rate of MK fragmentation within the BM of murine femora and reduced polyploidy (Fig.5f-g,Extended Data Fig.9b). These marked effects on thrombopoiesis resulted in significant thrombocytopenia in inhibitor-treated mice as compared to mice treated with solvent control (Fig.5h,i). Notably, in vivo visualization of MKs in the BM of the mouse skull using 2-photon intravital microscopy (2P-IVM) we could unravel a profound reduction of the ratio of proplatelet forming MKs in BM of mice treated with FSG67 (6.6±3.7%) or Triacsin C (10.6±3.1%) compared to vehicle-treated mice (14.4±5.5%), indicating that both treatments impair proplatelet formation in vivo (Fig.5h, Extended Data Fig.9c) and consequently results in thrombocytopenia (Fig.5i) Moreover, 2P-IVM revealed an increased ratio of MKs with altered morphology and premature ectopic fragmentation (Triacsin C: 6.5±2.1%, FSG67: 8.6±3.0%, Vehicle: 4.5±2.4%) potentially resulting in an inefficient proplatelet release into the vascular sinusoids.
Anionic membrane regulates platelet biogenesis via CKIP-1/CK2α axis
Finally, we investigated how a class rearrangement to a more anionic membrane, through increase of PG, PI and PS, can increase the anionic lipid strength in MKs from 13 to 20 mol% (0.2-1.7, 7.5-10.8, and 7-8.8 mol%, respectively). Thereby, an increased signaling capability could modulate megakaryopoiesis potentially.
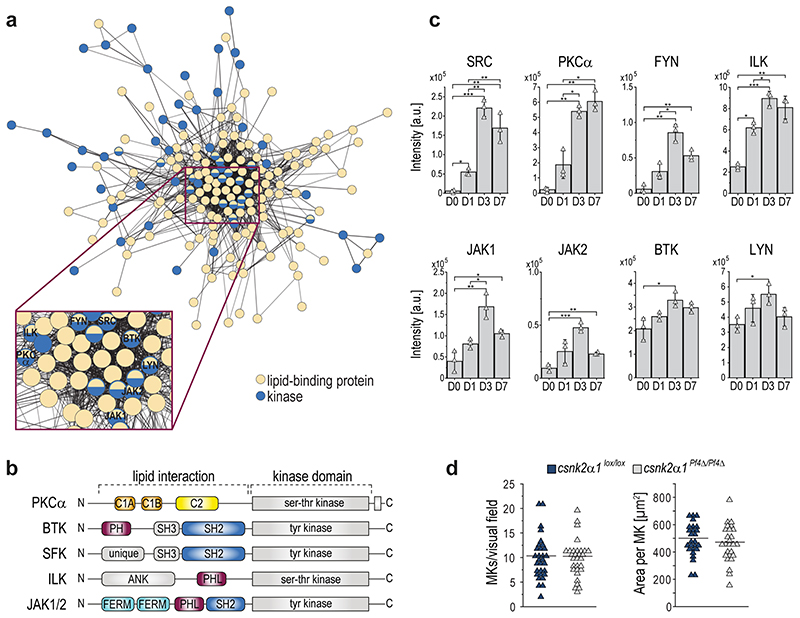
Therefore, we reanalyzed our proteomics data with an interaction analysis and identified a network of 67 strongly regulated kinases, as well as an additional 162 regulated proteins containing at least one of the following lipid-binding domains: pleckstrin homology (PH) or PH-like domains34, C1 and C235,36, FERM (Four point one-ezrin-radicin-moesin) domains37, or Src-homology domains SH2 or SH3 which were recently identified to also show lipid binding capabilities.38 All have a strong link to anionic lipids.37,39–42 Among those proteins, we identified several kinases which themselves harbor lipid binding sites like Janus kinase 1 and 2 (JAK1/JAK2), Integrin-linked protein kinase (ILK), Bruton's tyrosine kinase (BTK), protein kinase C (PKC) alpha as well as several Src-family kinases (SFK) such as SRC, FYN, and LYN (Extended Data Fig.10a-c). All eight are linked to megakaryocytic development and platelet activation43–45, and interact with or are directly or indirectly activated by lipids.46–49
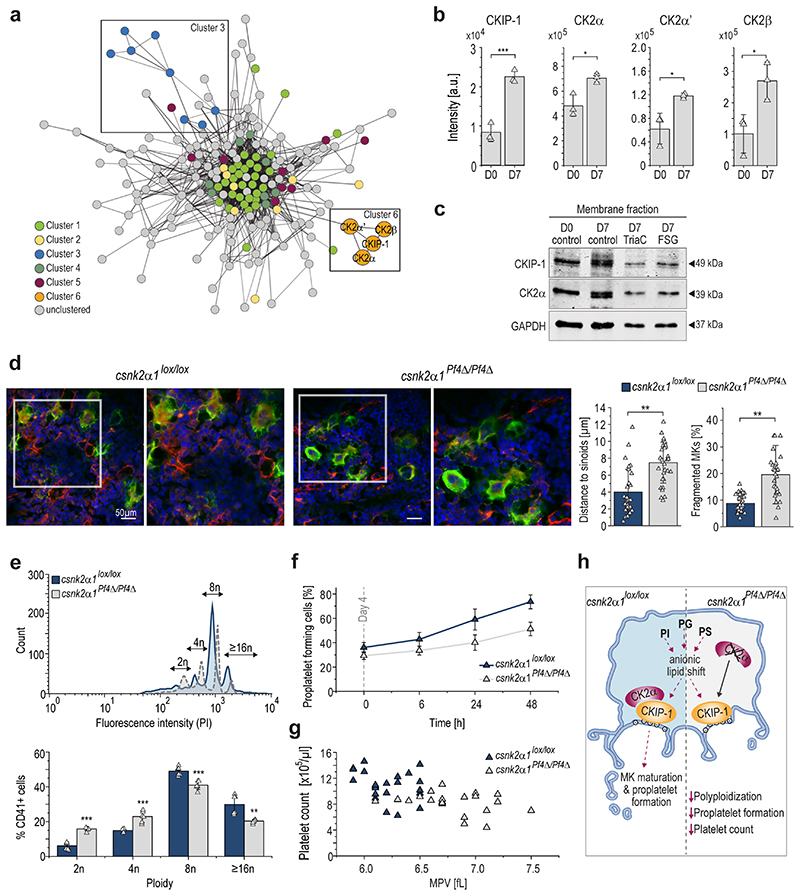
Given that anionic phospholipids linked to membrane binding exhibit continuous upregulation, we speculate whether the interplay of lipids, lipid-binding proteins and kinases may act as a potential modulatory axis driving megakaryopoiesis and proplatelet formation. Using the Molecular Complex detection (MCODE)50 clustering algorithm within the open source software Cytoscape51, we were able to identify 6 clusters (cutoff score 2.0) of densely connected regions in the protein interaction network (Fig.6a). While cluster 1,2,4, and 5 were closely clustered together, cluster 3 and 6 showed clear separation. Interestingly, cluster 6 was formed by the Casein kinase 2 catalytic subunits (CK2α/CK2α’), the CK2 regulatory subunit beta (CK2β), and the adapter protein Pleckstrin homology domain-containing family O member 1/Casein kinase interacting protein-1 (PKHO1/CKIP-1).
Fig. 6. During MK maturation CKIP-1/PKHO1 and CK2α are increasingly recruited to the MK plasma membrane and genetic deletion of csnk2α1 in MKs results in reduced ploidy and disrupted proplatelet formation with macrothrombocytopenia.
a, Network cluster analysis using MCODE. Edges are correlations with a minimum interaction confidence score 0.5. Nodes are proteins. Node-colors represent the associated cluster.
b, Regulation of proteins of cluster 6, showing relative protein intensities. Arithmetic means±SD (n=3) are shown.
c, Immunoblot analysis of CKIP-1 and CK2α protein levels in the membrane fraction of day 7 MKs treated with either Triacsin C or FSG67 (n=5).
d, Representative confocal microscopy images of immunostained femora (left) and arithmetic means±SD (n=6, right) of MK fragmentation and distance to sinusoids in the BM of csnk2α1lox/lox and csnk2α1Pf4Δ/Pf4Δ mice. Green, MKs (GPIb); red, sinusoids (CD105); blue, nuclei (DRAQ5).
e, Representative ploidy histogram and arithmetic means±SD (n=6) of DNA content of csnk2α1lox/lox and csnk2α1Pf4Δ/Pf4Δ BM-derived MKs cultured for five days.
f, Number of proplatelet-forming cells of csnk2α1lox/lox and csnk2α1Pf4Δ/Pf4Δ MKs examined from day 4 for 48 hours (means±SD, n=6).
g, Count and mean platelet volume (MPV) of csnk2α1lox/lox and csnk2α1Pf4Δ/Pf4Δ platelets (n=22). Each triangle represents one individual mouse.
h, Hypothetical illustration of obtained results showing reduced ploidy, proplatelet formation, and platelet count in csnk2α1 deficient mice.
A two-tailed t-test was used for statistical analysis (*P ≤ 0.05, **P ≤ 0.01, ***P ≤ 0.001).
In this context, we identified a robust upregulation of the CKIP-1/CK2 cluster during megakaryopoiesis on day 7 (Fig.6b). CKIP-1 reflects an adaptor protein with a PH domain facilitating recruitment of the CK2α isoform to the plasma membrane via direct interaction resulting in a non-enzymatic regulation of CK2α activity52–54. CKIP-1 contains a PH domain at the N-terminus and five proline-rich motifs throughout the protein, that mediate multiple cellular protein interactions55. Immunoblotting revealed a strong upregulation of the membrane localization of CKIP-1 in MKs and its coexpressed target CK2α at day 7 (Fig.6c), an effect that was abolished in MKs treated with ACSL inhibitor Triacsin C or the GPAT inhibitor FSG67 respectively. These observations suggest a regulation of the CKIP-1/CK2α interplay at the MK plasma membrane by the ACSL/GPAT lipid metabolic axis during megakaryopoiesis. To elucidate the functional role of the recruited catalytic CK2α subunit for the process of thrombopoiesis we examined MK localization and morphology in immunostained BM cryosections of intact murine femora from mice with a MK/platelet-specific genetic deletion of CK2α (csnk2α1). The visualization of the MK distribution within the entire femora confirmed that MKs in the femora of csnk2α1Pf4Δ/Pf4Δ mice displayed less direct sinusoidal contact and conversely an accumulation of MKs in the BM hematopoietic compartment with markedly increased MK fragmentation (Fig.6d, Extended Data Fig.10d), pointing to an insufficient transendothelial platelet biogenesis. Additionally, investigation of MKs flushed out of BM revealed a significantly reduced ploidy in csnk2α1Pf4Δ/Pf4ΔMKs with a significant reduction of ≥16N containing MKs (Fig.6e), indicating that csnk2α1 deficiency results in the accumulation of immature MKs. To study the impact of genetic deletion of CK2α in MK-dependent thrombopoiesis, we performed in vitro proplatelet formation assays using MKs derived from the BM of csnk2α1Pf4Δ/Pf4Δ mice and csnk2α1lox/lox littermates. Accordingly, significantly fewer numbers of csnk2α1Pf4Δ/Pf4Δ MKs formed proplatelets (Fig.6f). Abolished MK maturation and proplatelet formation thus again contribute to the development of a significant macrothrombocytopenia in csnk2α1Pf4Δ/Pf4Δ mice when compared to csnk2α1lox/lox mice (Fig.6g). Altogether, these observations let us hypothesize that the lipid-driven CKIP1/CK2α axis in MKs is crucial for MK maturation and proplatelet formation (Fig.6h).
Discussion
Megakaryopoiesis is a complex process by which hematopoietic stem cells differentiate into megakaryocytes, eventually capable of releasing platelets into the bloodstream through a process called thrombopoiesis. It is characterized by a progressive increase of cellular dimensions, DNA content with subsequent polyploidization, and, finally, proplatelet formation into the BM sinusoids.
Recently, a few studies tried to shed light on how lipid metabolism can affect megakaryopoiesis and proplatelet formation by mainly investigating enzymes derived from SP metabolism.7,9,32 Nevertheless, these studies did not elucidate the chemical nature of the involved lipid species to describe the observed functional effects leading to pathologies such as thrombocytopenia. Therefore, it is still unclear if lipids are the actual cause of the functional impact. To investigate the exact mechanisms of lipidome regulation during megakaryopoiesis, lipids must be analyzed in detail simultaneously with their metabolizing proteins. Several aspects should be considered, e.g. time and sensitivity of cell isolation, using detergent-free conditions, and reporting of concentrations to understand the dimensions of membrane rearrangement under the given circumstances. Here, we have used the full technological advance of MS-based lipidomics to report a quantitative lipidomics map of MK differentiation using a lipid-centered multiomics approach.18 On the one hand, we quantified 473 lipid species covering a concentration range of over six orders of magnitude. On the other hand, the expression levels of around 4651 proteins were determined. Using one sample to cover multiple molecule classes reduces the analytical error and enhances the correlation between different molecules.17 Quantitatively, the MK lipidome seems twice as complex as the one derived from platelets.12,56 Additionally, PUFAs are less enriched in the MK membrane compared to platelets. Nevertheless, both lipidomes are comparable, which is reflected in the abundance of different lipid classes. The higher complexity of the MK lipidome is most likely based on the presence of more organelles and an advanced lipid metabolism.
Using a multiomics approach to dissect megakaryopoiesis, this study revealed three major findings: First, lipid uptake is highly increased during megakaryocyte maturation, which is reflected by the increased expression of FA receptors (CD36, FATP1) and transporters (FABP4/5). Second, FA synthesis and oxidation are elevated in differentiating MKs, indicated by the upregulation of FA synthetase (FASN) and different mitochondrial FA transporters needed for beta-oxidation, such as CPT2 and CACP (Extended Data Fig.1b). Third, a significant remodeling of complex lipid synthesis pathways such as SP, GP, and ST occurs, which can be observed at the enzyme and lipid levels. Interestingly, increasing TG levels indicate an elevated lipid droplet formation, most likely needed for beta-oxidation. Most lipidome changes occur between days 1 and 3, demonstrating that membrane remodeling is an early process during megakaryopoiesis. However, the most striking finding was the upregulation of anionic membrane lipids, which increased by over seven mol% during differentiation. Of note, this elevation in anionic lipid mass correlated well with the upregulation of DG. As a result of pharmacological inhibition of FA uptake or GP de novo synthesis, no upregulation of anionic lipids in maturating MKs was observed. Moreover, the inhibition of either ACSL or GPAT resulted in an impaired MK polyploidization and a perturbated thrombopoiesis reflected by a 50% reduction of proplatelet formation and release into the BM sinusoids resulting in a significant thrombocytopenia.
Using relative-quantitative proteomics, we uncovered a broad spectrum of proteins whose expression was significantly shifted during the early and late stages of megakaryopoiesis. A recent study compared the proteome and transcriptome of round vs. proplatelet-producing MKs by 2D electrophoresis and polysome profiling to uncover protein changes during megakaryopoiesis.57 Using the latest MS technology, we analyzed the proteome at several time points of megakaryopoiesis and proplatelet formation. This enabled us to assess abundances of over 4400 proteins compared to 200 proteins of the earlier mentioned study. Of the 30 proteins previously identified to be regulated, most also displayed regulation in our study. Due to the increased sensitivity of our approach, more than 3000 proteins were found to be regulated. Remarkably, we unraveled several proteins and kinases which could potentially be regulated by (anionic) lipids and are significantly regulated during megakaryopoiesis. A signaling pathway that was significantly upregulated in MKs during MK maturation was the CKIP-1/CK2 cluster. The regulatory β-subunit of CK2 has been reported as major regulator of MK maturation and thrombopoiesis.58 CKIP-1 is a non-enzymatic and specific regulator of the catalytic CK2α isoform activity.52 CKIP-1 binds to the plasma membrane via its PH domain by specific binding of anionic lipids such as PS, PI and PIs phosphorylated forms53,54. Furthermore, CKIP-1 controls the access of CK2α to specific cellular targets through its ability to recruit selectively CK2α and not CK2α’ to the plasma membrane, again in an PH domain-dependent manner.52 Accordingly, we unraveled CKIP-1/CK2α as a potential effector of the lipidome remodeling downstream of GPAT and ACSL. The anionic shift of the MK lipidome during MK maturation culminates in an increase of phospholipids that are able to bind to the PH domain of CKIP-1 with consecutive recruitment of CKIP-1 and CK2α to the plasma membrane of MKs. It has been reported that CKIP-1 is crucially involved in MK differentiation and thrombopoiesis and a genetic deletion of CKIP-1 (plekho1/ckip1) resulted in a defective megakaryopoiesis with reduced MK ploidy and a reduced platelet production with significant thrombocytopenia.59 Similarly, after MK/platelet-specific genetic deletion of CK2 (csnk2α1), we found a significantly reduced MK ploidy and abrogated proplatelet formation with development of a significant macrothrombocytopenia. Remarkably, csnk2α1Pf4Δ/Pf4Δ mice displayed a highly comparable pattern of MK distribution within the BM, the same MK characteristics with premature fragmentation and reduced proplatelet formation with subsequent thrombocytopenia as mice upon treatment with the GPAT or ACSL inhibitor (Fig.7).
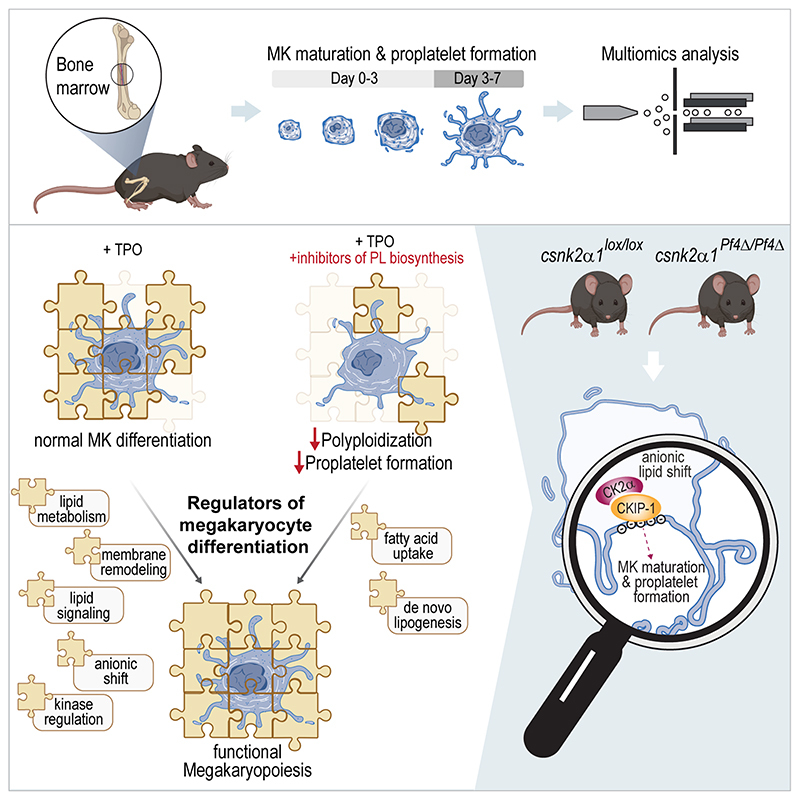
Fig. 7. Lipid driven functional regulation and underlying mechanisms of MK maturation and thrombopoiesis.
This study focuses on the functional analysis and regulation of MK maturation and proplatelet formation, utilizing a multiomics approach and incorporating both in vitro and in vivo methodologies. To develop the multiomics method, hematopoietic stem cells were isolated from murine BM and subjected to a 7-day differentiation protocol with TPO. The SIMPLEX workflow, enabling simultaneous lipid and protein sample preparation, was employed to comprehensively determine the general molecular composition of MKs. The results revealed significant anionic lipid membrane remodeling and relocalization of the CKIP-1/CK2α complex to the plasma membrane, which appear to be essential for adequate platelet biogenesis. The graphical illustration was generated using BioRender.
These identified mechanisms in MK maturation and thrombopoiesis are of potential interest for deepen our understanding how alterations in lipid metabolism in diseases like obesity or the metabolic syndrome both associated with thrombotic cardiovascular complications might interfere with platelet production.
In conclusion, in this study we aimed to establish a MK-specific multiomics workflow to comprehensively analyze the MK lipid metabolism. We could demonstrate, that the MK lipidome remodeling during MK maturation and proplatelet formation involves GPAT/ACSL-dependent lipid metabolism. Potentially, as a result from a shift towards anionic membrane properties during MK maturation, the altered MK lipidome may promote specific signaling complexes and kinases, such as CKIP-1/CK2α, which are critically involved in thrombopoiesis. However, further analyses linking anionic membrane remodeling to kinase changes in proplatelet formation are ultimately warranted to tackle the question how lipids control platelet production and properties.
Methods
Experimental procedures
Materials and standards
Antibodies
Rabbit anti-a-tubulin (Thermo Fisher Scientific PA5-19489), rat anti-CD42b, monoclonal (clone: Xia.G7, Emfret M042-1), rat FITC anti-mouse CD41 (Biolegend 133904), rabbit anti-CSNK2A1 (Abcam ab76040), mouse anti-CKIP1 (Santa Cruz sc-376355), mouse anti-GAPDH (Thermo Fisher Scientific MA5-15738), goat anti-rabbit secondary antibody (Life Technologies A21069), goat anti-rat secondary antibody (Life Technologies A11006), donkey anti-mouse secondary antibody (LI-COR 926-32212), Alexa594-conjugated anti-CD105 antibody (BioLegend 120418), Alexa546-conjugated anti-CD105 (self-generated, clone MJ7/1860), anti-CD42a (GPIX) Alexa Fluor 488 derivative (self-generated, p0p661).
Chemicals
DRAQ5 DNA stain (Thermo Fisher Scientific 62251), Alexa Flour 488 Phalloidin (Life Technologies A12379), antibody diluent (Zytomed ZUC025-100), Roti-Load (Roth K929.1), bovine serum albumin (BSA) (PanReac AppliChem A1391,0500), Triacsin C (Cayman 10007448), FSG67 (Focus Biomolecules 10-4577), mounting medium (Invitrogen P36961), poly-L-lysine (Sigma Aldrich P8920-100ML, 0.1%), paraformaldehyde (PFA) (Fisher 6131108), cell lysis buffer (Cell Signaling 9803S), protease and phosphatase inhibitor cocktail (Cell signaling 5872S), FcR blocking reagent mouse (Miltenyi Biotec 130-092-575), PureLink RNase A (Invitrogen 12091-021), propidium iodide (Invitrogen P1304MP), EZ-Link™ Sulfo-NHS-Biotin (Thermo Fisher Scientific 11851185), EZ-Link™ NHS-Biotin (Thermo Fisher Scientific 10381394), L-Lysine (Sigma Aldrich L5501), Triethylamine (Sigma Aldrich 90335), Medetomidine (Pfizer), Midazolam (Roche), Fentanyl (Janssen Cilag), recombinant TPO (Immuno Tools 12345615).
Chemicals specific for lipid analysis
formic acid (FA) (Biosolve 6914143), ULC/MS-grade methanol (Biosolve 13684102), ULC/MS-grade water (Biosolve 23214102), ULC/MS-grade acetonitrile (ACN) (Biosolve 1204102), methyl tert-butyl ether (MTBE) (VWR 34875-1L), ammonium acetate (AA) (Merck 73594-25G-F), ammonium formate (Sigma Aldrich 70221-25G- F), HPLC grade phosphoric acid (85-90%) (Sigma Aldrich 79617-250ML), chloroform (Sigma Aldrich 650498-1L), Isopropanol (Sigma Aldrich 1010402500).
Chemicals specific for protein analysis
formic acid (VWR 84865-180P), and ULC/MS-grade methanol (VWR 83638320), ULC/MS-grade water (Honeywell 14263-2L), ULC/MS-grade acetonitrile (Honeywell 34967-2.5L), urea (Merck 1084871000), triethylammonium bicarbonate (TEAB) (Sigma Aldrich 18597-100ML), sodium dodecyl sulfate (SDS) (GERBU 1212), dithiotreitol (DTT) (Sigma Aldrich APOSBIMB1015-25G), iodoacetamide (IAA) (Sigma Aldrich I6125-25G), Trypsin/Lys-C Mix MS-grade (Promega V5073), trifluoroacetic acid (TFA) (Sigma Aldrich T6508-100ML).
Peptide standards
Standard peptide Glu1-Fribrinopeptide B (Sequence: EGVNDNEEGFFSAR, Sigma Aldrich F3261), Standard peptide M48 (Sequence: TTPAVLDSDGSYFLYSK, PSL), Standard peptide HK0 (Sequence: VLETKSLYVR, PSL), Standard peptide HK1 (Sequence: VLETK(ε-AC)SLYVR, PSL).
Lipid standards
Mouse SPLASH® Lipidomcs ® Mass Spec Standard (Avanti Polar Lipids 330710X-1EA) consisting of phosphatidylcholine (PC) 15:0-18:1(d7), phosphatidylethanolamine (PE) 15:0-18:1(d7), phosphatidylserine (PS) 15:0-18:1(d7), phosphatidylglycerol (PG) 15:0-18:1(d7), phosphatidylinositol (PI) 15:0-18:1(d7), phosphatidic acid (PA) 15:0-18:1(d7), lyso-PC 18:1(d7), lyso-PE 18:1(d7) (as internal standard for all lyso phospholipids except LPC), cholesterol ester (SE) 18:1(d7), phosphatidylcholine-ether (PC O-a) 18:0-18:1(d9), phosphatidylethanolamine-ether (PE O-a) 18:0-18:1(d9), diacylglycerol (DG) 15:0-18:1(d7), triacylglycerol 15:0-18:1(d7)-15:0, sphingomyelin d18:1-18:1(d9), Ceramide/Sphingoid internal standard mixture II (CerMixII) (Avanti Polar Lipids LM6005-1EA) consisting of sphingosine (SPB) d17:1, sphinganine (SPB) d17:0, sphingosine-1-P (SPBP) d17:1, sphinganine-1-P (SPBP) d17:0, sphingomyelin (SM) d18:1/12:0, ceramide (Cer) d18:1/12:0, glucosylceramide (GlcCer) d18:1/c12:0 (as internal standard for HexCer), lactosylceramide (LacCer) d18:1/12:0 (as internal standard for Hex2Cer), ceramide-1-P (CerP) d18:1/12:0, cholesterol-d7 (Avanti Polar Lipids 700041P), lyso- sphingomyelin-d7 (Avanti Polar Lipids 860639P), PS 14:0-14:0 (Avanti Polar Lipids 840033P) (self-generated biotinylated internal standard for biotin-PS).
Animal models
Csnk2a1lox/lox mice were generated elsewhere.62 For megakaryocyte (MK)/platelet-specific deletion of CK2α, csnk2a1lox/lox mice were crossed with Pf4-Cre transgenic mice (Jackson Laboratory, #008535) and studied at the age of 12-14 weeks. All animal experiments were performed according to the Directive 2010/63/EU of the European Parliament on the protection of animals used for scientific purposes and were approved by local authorities (Regierungspräsidium Tübingen) following the ARRIVE guidelines (protocol: M01/20G,M03/19M).
For in vivo treatment studies, 6 weeks old C57BL6/J mice, were treated daily i.p. with either 0,285 mg/kg body weight Triacsin C, 5 mg/kg body weight FSG67 or DMSO over a period of seven days. Concentrations were adapted according to Cotte et al. and Kuhajda et al..63,64
Bone marrow isolation and megakaryocyte differentiation
For the bone marrow (BM) isolation, a centrifugation protocol previously published by Heib et al.65 was used. Briefly, 10-14 weeks old, male C57BL/6J mice (Jackson) were anesthetized using isoflurane and sacrificed by cervical dislocation following the institutional guidelines and the German law for the welfare of animals. Both femora bones were dissected and cleaned, cut open at the knee side, and placed with the cut side facing down in a 0.5 ml Eppendorf tube with a pre-pierced hole in the bottom. The tube was placed into a 1.5 ml tube, pre-filled with 100 μl DMEM (supplemented with 1 % penicillin/streptomycin and 10 % FBS) and centrifuged for 1 min at 2600 xg at room temperature (RT). Next, 1 ml supplemented medium was added, and BM cells were resuspended, filtered through a pluriStrainer Mini (70 μm), and the strainer rinsed with 1 ml medium. Afterward, cells were centrifuged for 5 min at 300 xg at RT, and the supernatant was removed.
To induce MK differentiation, the freshly isolated BM cells (pool of 5 individual animals) were cultivated in 10 cm cell culture dishes containing supplemented DMEM and differentiation was initiated by adding (1%) recombinant TPO. Cells were cultivated at 37 °C, 5 % CO2 for different periods of time. On days 1, 3, and 7, cells were harvested (1000 rpm, 5 min) and resuspended in 950 μl PBS. The cell suspension was carefully pipetted on a two-phase BSA gradient (bottom: 1.5 ml 3 % BSA in PBS, top: 1.5 ml 1.5 % BSA in PBS) to separate cells by weight. After 40 minutes, the supernatant was removed, and the cell pellet was washed 3 times with 500 μl PBS. Cells were counted in a Neubauer chamber and adjusted to 200.000 cells per tube. Cell pellets were shock-frozen in liquid nitrogen and stored at -80 °C for later multiomics analysis.
Immunofluorescence microscopy
For immunofluorescence microscopy of MKs, cells were isolated and purified as described above and cultivated for 1, 3, and 7 days. After isolation via BSA-gradient, 5000 MKs were seeded on chamber slides precoated with 0.1 % poly-L-lysine for 60 min at 37 °C and further incubated for one hour. Cells were fixed for 15 min with 4 % paraformaldehyde (PFA) at RT, washed 3 times 3 min with PBS, 10 min with PBS and 0.1 % Triton-X100, and again 3 times 3 min with PBS. Cells were further incubated with 1 % BSA in PBS to block the unspecific binding of antibodies. Cells were either stained with the primary antibodies Phalloidin Alexa Fluor 488 (1:200 in antibody diluent) and a-tubulin (1:400 in antibody diluent) or CD42b (1:100 in antibody diluent), or CD42d (1:300 in antibody diluent). After overnight incubation at 4 °C and washing 3 times 3 min each with PBS, secondary antibodies (anti-rabbit-Alexa568; 1:300 in PBS, anti-rat-Alexa488-; 1:300 in PBS) were applied for 2 hours at RT. After 3 times 3 min washing with PBS, nuclei were stained for 15 min with DRAQ5 stain (1:1000), washed again with PBS, and mounted using a mounting medium. An LSM510 confocal laser scanning microscope (Zeiss) and ZEN Blue software (Zeiss) was used for the analysis.
Protein and lipid extraction
Samples, consisting of 200.000 cells per tube, were used for lipid and protein extraction following the SIMPLEX protocol previously described by Coman et al.18 In brief, 225 μl MeOH and the internal standard mixture were added to all samples and cell pellets homogenized through 2 − 5 min ultrasonication. Two blanks used as quality controls were processed in parallel, one with and the other without internal standards. Next, 750 μl methyl-tert-butyl-ether (MTBE) was added, and samples were incubated for 1 h at 950 rpm, 4 °C. To induce phase separation, 188 μl water (HPLC-grade), was added and samples were incubated on ice for 5 min. After a 10 min centrifugation step at 10.000 xg, 4 °C, the upper organic phase (containing GPs, GLs, SPs, and STs) was carefully removed and dried under a gentle nitrogen flow. The dried organic phase was reconstituted in 100 μl IPA/MeOH/CHCl3 (4:2:1, v/v/v) containing 7.5 mM ammonium acetate for lipid analysis. To complete protein precipitation, 527 μl MeOH was added to the lower aqueous phase, and samples were stored at -20 °C for 2 h, following centrifugation for 30 min at 12.000 xg, 4 °C. The protein pellet was dried and further subjected to protein analysis.
Protein analysis
Proteomics sample preparation
Protein samples were diluted 1:2 in lysis buffer (8 M urea, 50 mM TEAB, 5 % SDS), heated at 90 °C for 5 min, and protein concentrations determined using a Pierce™ BCA protein assay kit (Thermo Scientific). For enzymatic digestion, 20 μg of protein was used, and the ProtiFi S-trap technology was applied.66 In short, solubilized proteins were reduced and carbamidomethylated by adding 64 mM dithiothreitol (DTT) and 48 mM iodoacetamide (IAA), respectively. Before loading the samples onto S-trap mini cartridges (Protifi), trapping buffer (90 % (v/v) methanol, 0.1 M triethylammonium bicarbonate) was added. Subsequently, samples were thoroughly washed and subsequently digested using Trypsin/Lys-C Mix at 37°C for two hours. Finally, peptides were eluted, dried, and stored at -20 °C until LC-MS analysis.
Label-free proteomics
LC-MS/MS analysis was performed as described previously67–69. Briefly, reconstitution of dried peptide samples was achieved by adding 5 μl of 30 % formic acid (FA) containing 4 synthetic standard peptides. Afterwards, samples were diluted with 40 μl of loading solvent (97.9 % H2O, 2 % ACN, 0.05 % trifluoroacetic acid (TFA)), of which 5 μl were injected into the Dionex Ultimate 3000 nano high-performance liquid chromatography (HPLC)-system (Thermo Fisher Scientific). A pre-column (2 cm × 75 μm C18 Pepmap100; Thermo Fisher Scientific) run at a flow rate of 10 μl/min using mobile phase A (99.9 % H2O, 0.1 % FA) was used to pre-concentrate peptides before chromatographic separation. Peptides were then separated on an analytical column (25 cm x 75 μm 25 cm Aurora Series emitter column (IonOpticks)) by applying a flow rate of 300 nL/min and using a gradient of 8 % to 40 % mobile phase B (79.9 % ACN, 20 % H2O, 0.1% FA) over 155 min, resulting in a total LC run time of 195 min including washing and equilibration steps. A timsTOF Pro mass spectrometer (Bruker) with a captive spray ion source run at 1700 V was used for mass spectrometric analysis. The timsTOF Pro mass spectrometer was operated in the Parallel Accumulation-Serial Fragmentation (PASEF) mode, and a moderate MS data reduction was applied. Further parameters included a scan range (m/z) from 100 to 1700 to record MS and MS/MS spectra and a 1/k0 scan range from 0.60 − 1.60 V.s/cm2 resulting in a ramp time of 100 ms to achieve trapped ion mobility separation. All experiments were performed with 10 PASEF MS/MS scans per cycle, leading to a total cycle time of 1.16 s. Furthermore, the collision energy was ramped as a function of increasing ion mobility from 20 to 59 eV and the quadrupole isolation width was set to 2 Th for m/z < 700 and 3 Th for m/z > 700. All samples were analyzed in technical duplicates.
Label-free proteomics data analysis
The publicly available software package MaxQuant (v1.6.17.0) running the Andromeda search engine was used for protein identification and label-free quantification (LFQ).70 Therefore, raw data were searched against the SwissProt database mus musculus (v220621 with 17519 entries). Search parameters included an allowed peptide tolerance of 20 ppm, a maximum of 2 missed cleavages, carbamidomethylation on cysteines as fixed modification, methionine oxidation, and N-terminal protein acetylation as variable modification. A minimum of two peptides per protein, of which at least one has to be unique for each protein was set as a search criterium for positive identifications. In addition, the “match between runs” option was applied, using a 0.7 min match time window, a match ion mobility window of 0.05, a 20 min alignment time window, and an alignment ion mobility of 1. An FDR ≤ 0.01 was set for all peptide and protein identification. LC-MS data evaluation and statistical analysis were accomplished using the Perseus software (v1.6.14.0).71 Identified proteins were first filtered for reversed sequences and common contaminants and annotated according to differentiation time points. Before statistical analysis, LFQ intensity values were log2-transformed, means of technical duplicates were calculated, and proteins were additionally filtered for their number of independent identifications (a minimum of 3 identifications in at least one group). Two-sided t-tests and statistics for volcano plots, were performed by applying an FDR cutoff of 0.05 and an S0 of 0.1, whereby S0 controls the relative importance of the t-test p-value and difference between the means. Figure visualization was done using OriginPro (2021), Rstudio (v1.4.1106), and Instant Clue (v0.10.10).72
Protein network and Cluster analysis
For the generation of protein networks, we divided our proteomics data into two groups: kinases and lipid binding proteins. All proteins that were significantly regulated on either day were used for network analysis using STRING. Networks generated were loaded in Cytoscape (v3.9.1). For Protein clustering, the MCODE application inside the Cytoscape interface was used with the following conditions: Network scoring including loops with a degree cutoff 2, cluster finding with fluffing using a node density cutoff 0.8 and node score cutoff 0.24 with K-core 2 and max depth 100.
Lipid analysis
Shotgun lipidomics
A Q Exactive HF (Thermo Fisher Scientific) coupled to a TriVersa NanoMate ion source (Advion Biosciences) was used for direct infusion experiments. 12 μl of the sample was delivered over 14 min with a backpressure of 0.95 psi. After 6 min, polarity switching from +1.25 kV to -1.25 kV was applied to acquire mass spectra in both positive and negative ion mode in one measurement. Full MS spectra covering the mass range from 350 − 1200 m/z in both positive and negative mode were acquired with a resolution of 240.000, an AGC target of 1e6 and a maximum IT of 105 ms. MS1 acquisition was followed by data-independent acquisition (DIA) of precursor masses at an interval of 1.001 Da. The precursor isolation window was 1 Da, and normalized collision energy (nCE) was 21 % and 26 % for positive and negative mode, respectively. MS2 spectra were acquired with a resolution of 60.000, an AGC target of 1e5, and a maximum IT of 105 ms.
Targeted lipidomics
Analysis of sphingolipids and sterols was performed as previously described by Peng et al.73 Inclusion lists for targeted measurements were generated using LipidCreator (v1.2.0). For the reverse phase liquid chromatography (LC), an Ultimate 3000-system (Thermo Fisher Scientific, Darmstadt, Germany) was equipped with an Ascentis Express C18 main column (150 mm x 2.1 mm, 2.7 μm, Supelco) and fitted with a guard cartridge (50 mm x 2.1 mm, 2.7 μm, Supelco) in a column oven set to 60 °C. Solvent A was ACN/H2O (3:2, v/v), and solvent B was IPA/ACN (9:1, v/v), both containing 0.1 % formic acid, 10 mM ammonium formate, and 5 μM phosphoric acid. The separation was carried out with a flow rate of 0.5 ml/min with the following 25 min-long gradient: initial (30 % B), 0 − 2 min (hold 30 % B), 2 − 3 min (30 − 56.1 % B), 3 − 4 min (56.1 − 58.3 % B), 4 − 5.5 min (58.3 − 60.2 % B), 5.5 − 7 min (60.2 − 60.6 % B), 7 − 8.5 min (60.6 − 62.3 % B), 8.5 − 10 min (62.3 − 64 % B), 10 − 11.5 min (64 − 64.5 % B), 11.5 − 13 min (64.5 − 66.2 % B), 13 − 14.5 min (66.2 − 66.9 % B), 14.5 − 15 min (66.9 − 100 % B),15.0 − 19.0 min (hold 100 % B), 19 min (5 % B), 19 − 22 min (hold 5 % B), 22 min (30 % B), 22 − 25 min (hold 30 % B). The injector needle was automatically washed with 30 % B and 0.1 % phosphoric acid and a volume of 5 μl per sample was injected.
The LC was coupled to a QTRAP 6500+ (Applied Biosystems Sciex, Darmstadt, Germany) with an electrospray ion source (Turbo V ion source). MS scans were acquired in positive ion mode with the following source settings: curtain gas, 30 arbitrary units; temperature, 250 °C; ion source gas I: 40 arbitrary units; ion source gas II, 65 arbitrary units; collision gas, medium; ion spray voltage, +5500 V; declustering potential, +100 V / -100 V; entrance potential, +10 V; exit potential, +13 V. For the scheduled MRM, Q1 and Q3 were set to unit resolution. The detection window was set to 2 min, and the cycle time was set to 0.5 s. Data were acquired with Analyst (v1.7.2, Applied Biosystems Sciex, Concord, ON).
Lipid identification and quantification
All spectra from shotgun experiments were converted to centroid mode using MSConvert (v3.0.20186-dd907d757) and analyzed using LipidXplorer (v1.2.8.1) under the following settings: mass tolerance of 5 ppm with an intensity threshold of 1e5 for MS1 and a mass tolerance of 10 ppm with an intensity threshold of 5e4 for MS2. For the lipid identification, molecular fragmentation query language (MFQL) queries, based on the previous work from Herzog et al.74,75, were compiled to match precursor and fragment ions to recognize lipid species. The detection and quantification of GLs (DG, TG) were employed in positive ion mode. GPs (CL, LPA, LPI, LPG, LPC, LPE, PA, PG, PC, PCO, PE, PEO, PI, PS) were identified and quantified in negative ion mode. All signal intensities were normalized to the corresponding deuterated internal standard (Mouse SPLASH® LIPIDOMIX® Mass Spec Standard). Protein concentrations, determined by the Pierce™ BCA protein assay kit (Thermo Scientific), were used to quantify all lipid species. TGs and CLs were quantified based on precursor intensities (Supplementary Table 1).
SLs (Cer, HexCer, Hex2Cer, SHexCer, LSM, SPBP, SPB, SM) and STs (ST and SE) were identified and quantified by LC-MS analysis (Supplementary Table 2). Integration of peaks from targeted measurements was performed using Skyline (v21.1.0.146). Lipid species’ abundance was calculated using peak areas and quantified to the respective internal standard (Ceramide/Sphingoid internal standard mixture II; Cholesterol-d7) and protein amount described above.
Generation of biotinylated PS standards
A biotinylated PS internal standard was generated for quantification of biotin-labeled PS species within the biological sample. The generation of biotinylated standards was performed according to the protocol of Thomas et al.76. Briefly, 1 mg of PS 14:0_14:0 standard (Avanti Polar Lipids) was dissolved in 330 μl chloroform/methanol (2:1, v/v) and 6 mg of EZ Link NHS-Biotin (NB) was added. After vortexing, 3.3 μl triethylamine (Sigma) was added and incubated at room temperature for 30 min. Excess NB was sedimented by centrifugation at 500 xg for 5 min at RT. The supernatant was transferred into a new glass vial. The sediment was washed once with 330 μl 2:1 CHCl3/MeOH, vortexed and centrifuged and the supernatant combined from the previous step. After drying under nitrogen flow, the biotinylated standard was resuspended in 600 μl MeOH for HPLC purification. An Agilent 1200 Series LC system with a Discovery C18 column (250 x 4.6 mm, 5μm) was used with the following conditions: Temperature 22 °C, flow rate 1 ml/min, gradient elution profile 50 % B (A: Water + 5 mM ammonium acetate, B: MeOH + 5mM ammonium acetate) to 100 % B over 15 min. Hold at 100 % B for 20 min, then re-equilibrated to 50 % B. UV absorbance was measured at 205 nm. Six times, 100 μl was injected, all fractions were manually collected, combined and dried using a GeneVac and resuspended in 200 μl MeOH. The standard was transferred into a clean, pre-weighted glass vial, dried and weighted again. The standard concentration was adjusted to 100 ng/μl in MeOH and stored under nitrogen gas at -80°C. The derivatization of the standard was validated by direct injection on an amazon speed ion ETD trap instrument.
Surface labeling of externalized PS
Biotinylation of cell surface exposed phosphatidylserine was performed based on the protocol from Thomas et al..76 A cell-impermeable reagent was used to label PS on the outer leaflet (EZ Link Sulfo-NHS-Biotin, SNB) and a cell-permeable reagent (NB) was used for quantification of total PS content. Briefly, MK cell suspensions containing 200.000 cells per sample were equally divided in two tubes (100.000 cells each) and treated with either 43 μl of 22 mM SNB in PBS or 20 μl of 20 mM NB reagent in DMSO for 10 min at RT. To SNB treated cells 72 μl 250 mM L-Lysine in PBS was added and incubated for another 10 min at RT to quench access SNB. To NB samples, 95 μl LC-grade water was added to reach the final extraction volume of 315 μl. Samples were transferred into 5 mL polypropylene Eppendorf tubes and subjected to the SIMPLEX protocol as described in “Methods − Protein and Lipid Extraction” using a tripled amount of all solvents. For normalization of lipid intensities, 10 μl of a self-generated biotinylated PS standard (Biotin-PS 14:0_14:0, 10ng/μl) and 5 μl Mouse SPLASH mix (Avanti Polar Lipids) was added prior to extraction. Dried lipid extracts were resuspended in 25 μl Butanol solvent (1-BuOH:IPA:H2O, 8:23:69, v/v/v + 5mM phosphoric acid) and lipids identified using targeted LC-MS/MS.
Reverse phase LC-MS/MS of biotinylated PS
Lipid extracts were separated by reverse phase HPLC according to Rampler & Coman et al.77 with minor adaptions. For separation, an Ascentis Express C18 column (150 mm × 2.1 mm, 2.7 μm, Supelco) fitted with a guard cartridge (50 mm × 2.1 mm, 2.7 μm, Supelco) was used. Mobile phase A was ACN/H2O (60:40, v/v) and mobile phase B was IPA/ACN (90/10, v/v), both containing 10 mM ammonium formate and 0.1% formic acid. The temperatures of the autosampler and the column oven were set to 10 and 60 °C, respectively. The separation was carried out with a flow rate of 0.5 ml/min with the following 35 min-long gradient: initial 30 % B, 0.0 − 3.0 min hold 30 % B, 3.0 − 15.0 min ramp to 75% B, 15.0 − 17.0 min ramp to 100% B, 17.0 − 30.0 min to 5% B, and 30.1 − 35.0 min to 30% B. The injector needle was automatically washed with 30 % B and a volume of 5 μl per sample was injected.
The LC was coupled to a Q Exactive HF instrument (Thermo Fisher Scientific) and data were acquired in negative ion mode. The following ESI source parameters were applied: spray voltage 3.8 kV, capillary temperature of 270 °C, sheath gas flow rate of 50, auxiliary gas flow rate of 15, auxiliary gas heater temperature of 380 °C, and S-lens RF level of 60. Full MS spectra from 500 − 1200 m/z were acquired in negative mode with a resolution of 60000, an AGC target of 106, and a maximum IT of 50 ms. For MS/MS a resolution of 30000, an AGC target of 105, a maximum IT of 115 ms and an nCE of 24 were applied.
Identification and quantification of biotinylated PS
Integration of peaks from targeted measurements was performed using Skyline (v21.1.0.146). The top two abundant PS species (PS 18:0_18:1 and PS 18:0_20:4) were monitored. For the identification of biotinylated PS, both fatty acids and the neutral loss of the biotinylated PS headgroup (m/z 313) was used. Lipids were quantified on MS1 level. Lipid species’ abundance was calculated using peak areas and quantified to the respective internal standard (biotinylated PS to B-PS 14:0_14:0, unlabeled PS to PS 15:0_18:1(d7)). To account for differences in PS total amount throughout the samples, the summed intensity of labeled and unlabeled PS within each sample was used to normalize the amount of labeled PS. A ratio was calculated of externalized / total PS. Day 1 was set to 1 and used as reference to calculate relative changes during megakaryopoiesis.
Validation of shotgun lipidomics data by targeted LC-MS/MS
Trends of selected lipid species shown in Fig. 4C were validated by targeted LC-MS/MS to increase confidence in the data obtained by shotgun lipidomics. After extraction of lipids by SIMPLEX, the dried lipid phase was resuspended in 50 μl Butanol solvent (1-BuOH:IPA:H2O, 8:23:69, v/v/v + 5mM phosphoric acid) and separated by RPLC-MS/MS. LC parameters are as described in “Reversed-Phase LC-MS/MS of biotinylated PS”. The LC was coupled to a Q Exactive HF instrument applying the following ESI source parameters: spray voltage 4.0 kV and 3.8 kV in positive and negative mode, respectively, capillary temperature of 270 °C, sheath gas flow rate of 50, auxiliary gas flow rate of 15, auxiliary gas heater temperature of 380 °C, and S-lens RF level of 60. Glycerolipids were analyzed in positive mode, glycerophospholipids in negative mode. Except for TG and CL all lipids were quantified on MS2 level. High-resolution MS full scan and PRM were performed in one measuring cycle (MS1: 0.0 − 35.0 min negative mode, resolution 60000, 350 − 1500 m/z; 13.0 − 35.0 min positive mode, resolution 30000, 400 − 900 m/z; MS2: 0.0 − 16.0 min negative mode, resolution 30000, nCE 24; 13.0 − 16.0 min positive mode, resolution 30000, nCE 21). An AGC target of 106 and 105, and a maximum IT of 50 ms and 115 ms were used in full scan and PRM, respectively. A pooled sample was measured in both polarities separately to verify the identification and acquire MS2 data for TG and CL.
Visualization and network analysis
For further investigation of common patterns in the lipid profiles, we performed both a similarity-based clustering and a network analysis based on the analysis approach of Peng et al.12 In the first step, we pairwisely compared all lipids with each other. For each lipid, we computed the mean abundances for days 1, 3, and 7, which we denote as a lipid profile. For each lipid pair, we compared their lipid profiles using Pearson correlation. The result is a quadratic similarity matrix m. For the network analysis, we have drawn a graph where we connected all lipids with each other that had a cosine similarity ≥ 99% in m. For the cluster analysis, we sorted m row-wise and column-wise equally. To do so, we applied hierarchical clustering on the columns of m with cosine similarity and unweighted average clustering. The result is a sorted matrix m. Since we were interested in lipid profiles even with anti-correlation, we worked only with the absolute values of m. Along the diagonal of the sorted matrix m, we searched for the biggest non-intersecting squared areas, where all values within the squares have a Pearson correlation value of ≥ 99%. The results are presented in Fig. 3E-H. Networks were generated using Cytoscape (v3.9.1).
Cell vitality assay
Cell vitality of control and inhibitor treated MKs was determined by the Promega CellTiter-Glo® 2.0 Assay, based on the quantification of ATP and indication of metabolically active cells, as done by Josefsson et al..78 Experiments were performed according to the manufacturer’s protocol. Per 96-well, 10.000 MKs were seeded in TPO supplemented DMEM. Inhibitors of phospholipid synthesis (160 μM FSG67, 5 μM Triacsin C), 1 μM ionomycin or DMSO were added to the cells in single wells and cultivated for 0, 3 and 7 days. Ionomycin was added to cells as a positive control for apoptotic cells. Plates were equilibrated to RT for approximately 30 min, before addition of CellTiter-Glo® 2.0. reagent (equilibrated to 22°C). The reagent was added to each well in a 1:1 reagent to cell culture medium ratio, mixed and incubated for 2 minutes on an orbital shaker to induce cell lysis. After 10 minutes, luminescence signals were recorded using a GLOMAX Multi Detection System (Promega, 9300-002).
Subcellular protein fractionation
Subcellular protein fractions were obtained using the Subcellular Protein Fractionation Kit for Cultured Cells (78840, Thermo Scientific) following the manufacturer’s instructions with some modifications. MKs were isolated after cultivation for 0 and 7 days in TPO supplemented DMEM, and washed with ice-cold PBS. 100.000 cells were pelleted by centrifugation at 500 xg for 2 min. Cell pellets were dried, 100 μl ice-cold CEB containing protease inhibitors (1:100) was added and cell pellets incubated at 4 °C for 30 min while mixing on an end-over-end shaker. After centrifugation at 500 xg for 5 min, the supernatant was collected and to the remaining cell pellet 100 μl ice-cold MEB containing protease inhibitors (1:100) was added, vortexed 5 sec and incubated at 4°C for 10 min while mixing. The supernatant (membrane fraction) was collected after 5 min centrifugation at 3000 xg and frozen at -80°C until immunoblot analysis.
Immunoblot analysis
Immunoblot analysis was performed using the prepared membrane fraction of cultivated megakaryocytes (day 0, day 7) in the absence or presence of the inhibitors. After centrifugation for 15 minutes at 20.000xg and 4°C, the supernatant was collected and the protein concentration was measured using Bradford assay from Bio-Rad. For immunoblotting, protein was loaded in 12% gels and electrotransferred onto a nitrocellulose membrane followed by blocking with 5% non-fat milk or 5% bovine serum albumin at room temperature for 1h. Afterward, the membrane was incubated with the primary antibody against CSNK2A1 (1:1000), CKIP1/PKHO1 (1:200), or GAPDH (1:1000) at 4°C overnight. After washing with TBS-T the blots were incubated with fluorochrome-conjugated secondary antibodies (1:15.000) for 1h at RT. After washing, antibody binding was detected with Odyssey infrared imaging system (LI-COR). Bands were quantified with ImageJ79.
Functional assessment of megakaryopoiesis
To validate the importance of the observed lipidomic changes on megakaryopoiesis, inhibitors of two enzymes involved in phospholipid biosynthesis were used. Either 160 μM FSG67, 5 μM Triacsin C or vehicle control (DMSO) were added to the cell suspensions 24 hours after the start of cultivation.
Lipidomic analysis (see section “Lipid Analysis”) was performed on MKs isolated via BSA-gradient on day 0 (before the addition of inhibitors and control) and after 7 days of cultivation.
Proplatelet formation assay
Proplatelet formation (PPF) assays were performed in triplicates on 48-well plates. After isolation via BSA-gradient after 3 days of cultivation, 15 000 cells per well were seeded. Proplatelet formation was examined every 6 hours by microscopy (Nikon ECLIPSE Ti2, NIS Elements Imaging Software, Europe B.V.). Ratios of PPF MKs compared to no PPF MKs were calculated.
MK Polyploidization
Ploidy measurements were performed according to Gawaz et al..1 Briefly, the bone marrow of femora bones from B6 mice was flushed and homogenized. Cells were cultivated in 10 cm cell culture dishes containing DMEM (supplemented with 1 % penicillin / streptomycin and 10 % FBS) and differentiation was initiated by adding (1%) recombinant TPO. After 5-day cultivation, the cell suspension was carefully pipetted on a two-phase BSA gradient (bottom: 1.5 ml 3 % BSA in PBS, top: 1.5 ml 1.5 % BSA in PBS) to separate cells by weight. After 40 minutes, the supernatant was removed and the cell pellet was washed 3 times with 500 μl PBS. Non-specific BM binding was blocked by incubation with 0.02 mg/ml FcR Blocking Reagent. Afterwards, MKs were stained using FITC-conjugated anti-CD41 antibody and the cells were subsequently washed once with 2 mM EDTA in PBS. Cells then were washed with PBS (5 min at 300 xg) and fixed in PBS containing 1% PFA/0.1% EDTA. Fixed cells were washed with PBS (10 min at 300 xg) and permeabilized in PBS containing 0.1% TritonX-100. Finally, DNA was stained using 50 μg/ml propidium iodide staining solution containing 100 μg/ml RNaseA and 2 mM EDTA in PBS. Analysis was performed by flow cytometry (BD FACSCalibur, Biosciences) and FlowJo software (Tree Star Inc) (Supplementary Fig. 1).
Two-photon intravital microscopy
Mice were anesthetized by intraperitoneal injection of medetomidine 0.5 mg/g, midazolam 5 mg/g and fentanyl 0.05 mg/g body weight. A 1-cm midline incision was made to expose the frontoparietal skull, while carefully avoiding damage to the bone tissue. For immobilization of the head, the mice were placed on a custom-built metal stage equipped with a stereotactic holder. BM vasculature was visualized by injection of anti-CD105 Alexa Fluor 546 (0.6 μg/g body weight), MKs and platelets by injection of anti-CD42a (GPIX) Alexa Fluor 488 derivative (0.8 μg/g body weight). Images were acquired on an upright 2-photon fluorescence microscope (TCS SP8 MP, Leica Microsystems, Wetzlar, Germany) equipped with a 25x water objective with a numerical aperture of 1.0. A tunable broad-band Ti:Sa laser (Chameleon, Coherent, Dieburg, Germany) was used at 780 nm to capture Alexa Fluor 488 and 546 fluorescence. For each mouse, 4-8 z-stacks with a step size of 0.51 μm were recorded from different positions in the BM. Proplatelet-forming MKs were counted, and MK morphology was categorized in normal and fragmented by a blinded experimenter. ImageJ software (NIH) was used to generate movies.
Immunofluorescence staining on femora cryosections
Femora bones of inhibitor treated or csnk2α1lox/lox and csnk2α1Pf4Δ/Pf4Δ mice were fixed with 4 % PFA in 5 mM sucrose solution (Sigma Aldrich), transferred into 10 % sucrose in PBS and dehydrated using a graded sucrose series (10% - 20% - 30%). Subsequently, femora were embedded in Cryo-Gel (Leica) and shock frozen in liquid nitrogen. Five-μm thin cryosections were generated using a CryoJane tape transfer system (Leica) and probed with a self-conjugated FITC-antiCD41 antibody (1:100) for specific labeling of MKs and platelets, Alexa647-conjugated antiCD105 antibody (1:300) for endothelium detection, and DRAQ5 (1:1000) for nuclei staining. Samples were visualized using a Leica Stellaris 5 (LMB R039a) confocal microscope.
Extended Data
Extended Data Fig. 1. Protein regulation highlighting key proteins involved in lipid metabolism. Related to Figure 1.
a, Volcano plots of -log10 p-values over log2 fold changes of all identified proteins on day 0, 1, 3 and 7 of MK maturation. P-values were corrected using the Benjamini-Hochberg correction with an FDR cut-off of 0.05. b,c, Proteins of fatty acid transport pathways (b) as well as identified phospholipases (c) are depicted. A two-sided t-test was used for statistical analysis. Benjamini-Hochberg correction was applied to p-values using an FDR cut-off < 0.05 (*P ≤ 0.05, **P ≤ 0.01, ***P ≤ 0.001). d, Network highlighting proteins involved in lipid metabolism. Edges are correlations of r ≥ 0.85. Nodes represent proteins and the node color the associated lipid category (left). The network on the right is color-coded based on the log2 fold change of proteins regulated from day 0 to day 7. Pure red indicates an FC ≥ 2 and pure blue an FC ≤ -2. Data are combined from 3 independent biological experiments and mean values are shown. Error bars represent standard deviations.
Extended Data Fig. 2. Fuzzy c-means clustering of down-regulated proteins during MK maturation. Related to Figure 1.
Protein cluster (C1-C18) showing overall downregulation. Number of proteins and their median are denoted in individual plots as well as the associated cluster (C1-C18). The assignment of proteins to clusters can be found in the Source Data. Threshold = 85.
Extended Data Fig. 3. Fuzzy c-means clustering of up-regulated proteins during MK maturation. Related to Figure 1.
Protein cluster (C19-C39) showing overall upregulation. Number of proteins and their median are denoted in individual plots as well as the associated cluster (C19-C39). The assignment of proteins to clusters can be found in the Source Data. Threshold = 85.
Extended Data Fig. 4. Structural elucidation at the FA level of lipids in the main lipid categories. Related to Figure 2.
a-d, Molecular structural analysis of lipids identified with shotgun lipidomics at the MS2 level. The MS2 spectra shown in each panel are used as structural assessment by customized MFQL search files using the LipidXplorer search engine. Potential fragmentation patterns are shown above each panel. Annotated fragments are denoted in the chemical structure of the individual species. For lipid identification, FAs and loss of FAs as well as class-specific headgroups or neutral losses were used. Quantification of lipid species on the molecular species level is based on FA intensities.
Extended Data Fig. 5. Quantitative elucidation at the FA level of lipids in the main lipid categories. Related to Figure 2.
a-d, Radar charts displaying the relative intensity of lipid species of mature MKs organized according to their lipid category, including GP, SP, GL, and STs. GPs and GLs were analyzed with shotgun lipidomics while SPs and STs were analyzed with targeted lipidomics.
Extended Data Fig. 6. Validation of shotgun lipidomics data by targeted RPLC-MS/MS. Related to Figure 4.
Trends of selected class representative lipid species were confirmed by targeted reverse-phase LC-MS/MS. Shown in blue are data obtained from shotgun measurements, shown in grey are results from LC experiments. For better comparison of observed lipid trends, lipid quantities are shown as relative amount compared to day 1. All data show the mean of 3 biological replicates. One biological replicate was comprised of 5 individual animals. Error bars represent standard deviations.
Extended Data Fig. 7. MS2 spectra for the structural elucidation of representative lipid species. Related to Figure 4.
All MS2 spectra were acquired using a collision energy of 21 % in positive ion mode and 24 % in negative ion mode at R m/z200 of 30000. GP (glycerol phosphate backbone), FA (fatty acyl), HG (class specific head group fragment), IP (inositol phosphate), I (inositol) and NL (neutral loss of class specific headgroup), indicate structure specific fragments. Scan polarity is indicated on the upper left side of each panel. The fragments annotated were used for lipid identification. Quantification of lipid species on the molecular species level is based on FA intensities. CL and TG were quantified on MS1 level based on precursor intensities.
Extended Data Fig. 8. Exclusion of media lipid composition and apoptosis as confounding factors for observed lipidomic changes in MKs. Related to Figure 4.
a, Distribution of main lipid classes from mature MKs (day 3, n=3) as well as FBS (n=11) used for cell culture supplementation. Lipid quantities were normalized to volume. b, Proteomic analysis of pro- and anti-apoptotic markers in MKs. A two-sided t-test was used for statistical analysis. Benjamini-Hochberg correction was applied to p-values using an FDR cut-off < 0.05 (*P ≤ 0.05, **P ≤ 0.01, ***P ≤ 0.001). c, ATP cell vitality assay showing MKs treated with inhibitors. Ionomycin was used as positive control for apoptotic cells. The measured luminescence was normalized to the control for each day to display changes relative to the control baseline (dark grey). d, PS externalization during megakaryopoiesis. The two most abundant PS species were monitored. Externalization was calculated by dividing the amount of biotinylated PS on the cell surface by the total biotinylated PS, as described in the methods. Lipid quantities of day 1 were used as reference and set to 1. All other days were calculated as ratios relative to day 1 (n=5). All data show the mean of at least 3 biological replicates. One biological replicate was comprised of 5 individual animals. In a-b, error bars represent standard deviations. In d, boxplot whiskers represent the minimum and maximum. The boundaries of the box represent the 25th and 75th percentile. Middle black lines represent the mean and black squares indicate the median.
Extended Data Fig. 9. Analysis of the megakaryocytes upon inhibition of phospholipid biosynthesis. Related to Figure 5.
a, Lipidome analysis showing the relative quantities (mean±SD, n=4) per lipid class of control and inhibitor treated MKs on day 7. Non-treated day 0 MKs were used as baseline control and lipid quantities were set to 1 and the standard deviation is depicted as dotted lines. Changes for all lipid classes were calculated as ratios relative to control day 0. A two-sided t-test was used for statistical analysis. All days were tested against day 7 control (*P ≤ 0.05, **P ≤ 0.01, ***P ≤ 0.001). b, Arithmetic means±SD (n=5-7) of MKs of Triacsin C, FSG67 or vehicle treated mice per visual field of in vivo imaging in the BM vasculature of the frontoparietal skull of mice. c, Arithmetic mean±SD (n=5-7) of MKs and MK area of Triacsin C, FSG67 or vehicle treated mice per visual field in immunostained BM sections.
Extended Data Fig. 10. Lipid-dependent kinases in MKs involved in megakaryopoiesis and proplatelet formation. Related to Figure 6.
a, Network showing significantly regulated kinases (blue) and lipid-binding proteins (yellow). Edges are correlations with a minimum interaction confidence score 0.5. Nodes are proteins. b, Domain composition of depicted kinases. Membrane-targeting modules are the C1 (orange), C2 (yellow), pleckstrin homology (PH) or PH-like (purple), and FERM (light blue) domains. Additional interaction domains like Src-homology (SH) domains are shown in dark blue. Kinase domains are shown in gray. Note, the schematic representation is not reproduced in the correct domain proportions and does not reflect the actual protein size. c, Regulation of kinases with a lipid binding domain (mean±SD, n=3). A two-sided t-test was used for statistical analysis. Benjamini Hochberg correction was applied to p-values using an FDR cut-off of 0.05 (*P ≤ 0.05, **P ≤ 0.01, ***P ≤ 0.001). d, Arithmetic means of MKs and MK area of csnk2α1lox/lox and csnk2α1Pf4Δ/Pf4Δ mice per visual field (n=30) in immunostained BM sections.
Supplementary Material
Acknowledgements
This study was funded by the Deutsche Forschungsgemeinschaft (DFG, German Research Foundation), project number 374031971 − CRC240, BO3786/3-1 and BO3786/7-1, 453989101 − CRC1525 (OB), and the Austrian Science Fund, FWF DMP I6303. The funders had no role in study design, data collection and analysis, decision to publish, or preparation of the manuscript.
The authors received support from the University of Vienna through seed funding and funding derived from the Vienna doctoral school in Chemistry (DoSChem) at the faculty of Chemistry, Vienna (RA), as well as from the DigiOmics4Austria: BMBWF Ausschreibung "(Digitale) Forschungsinfrastrukturen" (RA). We further thank Valerie O'Donnell (Systems Immunity Research Institute, School of Medicine, Cardiff University, CF14 4XN, UK) for providing her PS surface labelling protocols and Daniela Eißler (DFG Heisenberg Group Cardiovascular Thromboinflammation and Translational Thrombocardiology, University of Tübingen and Department of Cardiology and Angiology, University of Tübingen, Germany) for excellent technical assistance.
Footnotes
Author contributions
OB and RA developed the concept. BDJ, FK, PM, OB and RA, designed, conducted and analyzed the experiments. VG, MF, KM, NNT, MCM, MZ and MS conducted experiments. TH, DK, AB, CG, NH, DH, AA, MG, DS and HS analyzed data. RA developed the benchmarks and controlled and supervised the biochemical aspects. CC reviewed the methodological aspect with RA. OB and RA discussed, supervised, and coordinated the project. All authors wrote and revised the manuscript.
Competing interests
The authors declare no competing financial interests.
Data availability
Lipidomics data have been deposited at Zenodo (DOI:10.5281/zenodo.8186280) for immediate access. After publication, data will be further accessible at Metabolights (MTBLS6082, MTBLS6083, MTBLS6084). Proteomics data have been deposited at PRIDE (PXD037622). All other data supporting the findings in this study are included in the main article and associated files. Source data are provided with the manuscript.
References
- 1.Gawaz M, Geisler T, Borst O. Current concepts and novel targets for antiplatelet therapy. Nat Rev Cardiol. 2023 doi: 10.1038/s41569-023-00854-6. [DOI] [PubMed] [Google Scholar]
- 2.Tavassoli P, Paterson R, Grant J. Actinobaculum schaalii: An Emerging Uropathogen? Case Rep Urol. 2012;2012:468516. doi: 10.1155/2012/468516. [DOI] [PMC free article] [PubMed] [Google Scholar]
- 3.Wintrobe MM. Hematology, the blossoming of a science. A Story of Inspiration and Effort. 1985 [Google Scholar]
- 4.Machlus KR, Thon JN, Italiano JE., Jr Interpreting the developmental dance of the megakaryocyte: a review of the cellular and molecular processes mediating platelet formation. Br J Haematol. 2014;165(2):227–36. doi: 10.1111/bjh.12758. [DOI] [PubMed] [Google Scholar]
- 5.Eckly A, et al. Biogenesis of the demarcation membrane system (DMS) in megakaryocytes. Blood. 2014;123(6):921–30. doi: 10.1182/blood-2013-03-492330. [DOI] [PubMed] [Google Scholar]
- 6.Geue S, et al. Pivotal role of PDK1 in megakaryocyte cytoskeletal dynamics and polarization during platelet biogenesis. Blood. 2019;134(21):1847–1858. doi: 10.1182/blood.2019000185. [DOI] [PubMed] [Google Scholar]
- 7.Bariana TK, et al. Sphingolipid dysregulation due to lack of functional KDSR impairs proplatelet formation causing thrombocytopenia. Haematologica. 2019;104(5):1036–1045. doi: 10.3324/haematol.2018.204784. [DOI] [PMC free article] [PubMed] [Google Scholar]
- 8.Golfier S, et al. Shaping of terminal megakaryocyte differentiation and proplatelet development by sphingosine-1-phosphate receptor S1P4. Faseb j. 2010;24(12):4701–10. doi: 10.1096/fj.09-141473. [DOI] [PubMed] [Google Scholar]
- 9.Zhang L, et al. Sphingosine kinase 2 (Sphk2) regulates platelet biogenesis by providing intracellular sphingosine 1-phosphate (S1P) Blood. 2013;122(5):791–802. doi: 10.1182/blood-2012-12-473884. [DOI] [PubMed] [Google Scholar]
- 10.Kelly KL, et al. De novo lipogenesis is essential for platelet production in humans. Nat Metab. 2020;2(10):1163–1178. doi: 10.1038/s42255-020-00272-9. [DOI] [PubMed] [Google Scholar]
- 11.Valet C, et al. Adipocyte Fatty Acid Transfer Supports Megakaryocyte Maturation. Cell reports. 2020;32(1):107875. doi: 10.1016/j.celrep.2020.107875. [DOI] [PubMed] [Google Scholar]
- 12.Peng B, et al. Identification of key lipids critical for platelet activation by comprehensive analysis of the platelet lipidome. Blood. 2018;132(5):e1–e12. doi: 10.1182/blood-2017-12-822890. [DOI] [PMC free article] [PubMed] [Google Scholar]
- 13.Manke MC, et al. ANXA7 Regulates Platelet Lipid Metabolism and Ca(2+) Release in Arterial Thrombosis. Circ Res. 2021;129(4):494–507. doi: 10.1161/CIRCRESAHA.121.319207. [DOI] [PubMed] [Google Scholar]
- 14.Molenaar MR, et al. LION/web: a web-based ontology enrichment tool for lipidomic data analysis. GigaScience. 2019;8(6) doi: 10.1093/gigascience/giz061. [DOI] [PMC free article] [PubMed] [Google Scholar]
- 15.Peng B, et al. LipidCreator workbench to probe the lipidomic landscape. Nature Communications. 2020;11(1):2057. doi: 10.1038/s41467-020-15960-z. [DOI] [PMC free article] [PubMed] [Google Scholar]
- 16.Han X. Lipidomics for studying metabolism. Nature Reviews Endocrinology. 2016;12(11):668–679. doi: 10.1038/nrendo.2016.98. [DOI] [PubMed] [Google Scholar]
- 17.Borgmeyer M, et al. Multiomics of synaptic junctions reveals altered lipid metabolism and signaling following environmental enrichment. Cell Rep. 2021;37(1):109797. doi: 10.1016/j.celrep.2021.109797. [DOI] [PubMed] [Google Scholar]
- 18.Coman C, et al. Simultaneous Metabolite, Protein, Lipid Extraction (SIMPLEX): A Combinatorial Multimolecular Omics Approach for Systems Biology. Mol Cell Proteomics. 2016;15(4):1453–66. doi: 10.1074/mcp.M115.053702. [DOI] [PMC free article] [PubMed] [Google Scholar]
- 19.Michel L, et al. Eur Heart J. Targeting early stages of cardiotoxicity from anti-PD1 immune checkpoint inhibitor therapy. 2022;43(4):316–329. doi: 10.1093/eurheartj/ehab430. [DOI] [PubMed] [Google Scholar]
- 20.Kuvardina ON, et al. RUNX1 represses the erythroid gene expression program during megakaryocytic differentiation. Blood. 2015;125(23):3570–9. doi: 10.1182/blood-2014-11-610519. [DOI] [PMC free article] [PubMed] [Google Scholar]
- 21.Wang CQ, et al. Disruption of Runx1 and Runx3 leads to bone marrow failure and leukemia predisposition due to transcriptional and DNA repair defects. Cell Rep. 2014;8(3):767–82. doi: 10.1016/j.celrep.2014.06.046. [DOI] [PubMed] [Google Scholar]
- 22.Ferreira R, et al. GATA1 Function, a Paradigm for Transcription Factors in Hematopoiesis. Molecular and Cellular Biology. 2005;25(4):1215–1227. doi: 10.1128/MCB.25.4.1215-1227.2005. [DOI] [PMC free article] [PubMed] [Google Scholar]
- 23.Lepage A, et al. The αIIbβ3 integrin and GPIb-V-IX complex identify distinct stages in the maturation of CD34+cord blood cells to megakaryocytes. Blood. 2000;96(13):4169–4177. [PubMed] [Google Scholar]
- 24.Li R, Emsley J. The organizing principle of the platelet glycoprotein Ib-IX-V complex. J Thromb Haemost. 2013;11(4):605–14. doi: 10.1111/jth.12144. [DOI] [PMC free article] [PubMed] [Google Scholar]
- 25.Nurden AT, Caen JP. Specific roles for platelet surface glycoproteins in platelet function. Nature. 1975;255(5511):720–2. doi: 10.1038/255720a0. [DOI] [PubMed] [Google Scholar]
- 26.Clemetson KJ, et al. Isolation of the membrane glycoproteins of human blood platelets by lectin affinity chromatography. Biochimica et Biophysica Acta (BBA) - Biomembranes. 1977;464(3):493–508. doi: 10.1016/0005-2736(77)90025-6. [DOI] [PubMed] [Google Scholar]
- 27.Sporn LA, et al. Biosynthesis of von Willebrand protein by human megakaryocytes. J Clin Invest. 1985;76(3):1102–6. doi: 10.1172/JCI112064. [DOI] [PMC free article] [PubMed] [Google Scholar]
- 28.Peck B, et al. Inhibition of fatty acid desaturation is detrimental to cancer cell survival in metabolically compromised environments. Cancer Metab. 2016;4:6. doi: 10.1186/s40170-016-0146-8. [DOI] [PMC free article] [PubMed] [Google Scholar]
- 29.Gonzalez-Covarrubias V, et al. Lipidomics of familial longevity. Aging Cell. 2013;12(3):426–434. doi: 10.1111/acel.12064. [DOI] [PMC free article] [PubMed] [Google Scholar]
- 30.Perkins RG, Scott RE. Plasma membrane phospholipid, cholesterol and fatty acyl composition of differentiated and undifferentiated L6 myoblasts. Lipids. 1978;13(5):334–7. doi: 10.1007/BF02533724. [DOI] [PubMed] [Google Scholar]
- 31.Heimerl S, et al. Quantification of bulk lipid species in human platelets and their thrombin-induced release. Scientific Reports. 2023;13(1):6154. doi: 10.1038/s41598-023-33076-4. [DOI] [PMC free article] [PubMed] [Google Scholar]
- 32.Tani M, et al. Mechanisms of sphingosine and sphingosine 1-phosphate generation in human platelets. Journal of Lipid Research. 2005;46(11):2458–2467. doi: 10.1194/jlr.M500268-JLR200. [DOI] [PubMed] [Google Scholar]
- 33.Niazi H, et al. Murine platelet production is suppressed by S1P release in the hematopoietic niche, not facilitated by blood S1P sensing. Blood Adv. 2019;3(11):1702–1713. doi: 10.1182/bloodadvances.2019031948. [DOI] [PMC free article] [PubMed] [Google Scholar]
- 34.Haslam RJ, Koide HB, Hemmings BA. Pleckstrin domain homology. Nature. 1993;363(6427):309–310. doi: 10.1038/363309b0. [DOI] [PubMed] [Google Scholar]
- 35.Sutton RB, et al. Structure of the first C2 domain of synaptotagmin I: a novel Ca2+/phospholipid-binding fold. Cell. 1995;80(6):929–938. doi: 10.1016/0092-8674(95)90296-1. [DOI] [PubMed] [Google Scholar]
- 36.Zhang G, et al. Crystal structure of the Cys2 activator-binding domain of protein kinase Cδ in complex with phorbol ester. Cell. 1995;81(6):917–924. doi: 10.1016/0092-8674(95)90011-x. [DOI] [PubMed] [Google Scholar]
- 37.Pearson MA, et al. Structure of the ERM Protein Moesin Reveals the FERM Domain Fold Masked by an Extended Actin Binding Tail Domain. Cell. 2000;101(3):259–270. doi: 10.1016/s0092-8674(00)80836-3. [DOI] [PubMed] [Google Scholar]
- 38.Park MJ, et al. SH2 Domains Serve as Lipid-Binding Modules for pTyr-Signaling Proteins. Mol Cell. 2016;62(1):7–20. doi: 10.1016/j.molcel.2016.01.027. [DOI] [PMC free article] [PubMed] [Google Scholar]
- 39.Huang K-P. The mechanism of protein kinase C activation. Trends in Neurosciences. 1989;12(11):425–432. doi: 10.1016/0166-2236(89)90091-x. [DOI] [PubMed] [Google Scholar]
- 40.Murray NR, Fields AP. Phosphatidylglycerol is a physiologic activator of nuclear protein kinase C. J Biol Chem. 1998;273(19):11514–20. doi: 10.1074/jbc.273.19.11514. [DOI] [PubMed] [Google Scholar]
- 41.Saito K, Scharenberg AM, Kinet J-P. Interaction between the Btk PH Domain and Phosphatidylinositol-3,4,5-trisphosphate Directly Regulates Btk*. Journal of Biological Chemistry. 2001;276(19):16201–16206. doi: 10.1074/jbc.M100873200. [DOI] [PubMed] [Google Scholar]
- 42.Niggli V, et al. Identification of a phosphatidylinositol‐4, 5‐bisphosphate‐binding domain in the N‐terminal region of ezrin. Febs Letters. 1995;376(3):172–176. doi: 10.1016/0014-5793(95)01270-1. [DOI] [PubMed] [Google Scholar]
- 43.Turro E, et al. A dominant gain-of-function mutation in universal tyrosine kinase SRC causes thrombocytopenia, myelofibrosis, bleeding, and bone pathologies. Sci Transl Med. 2016;8(328):328ra30. doi: 10.1126/scitranslmed.aad7666. [DOI] [PMC free article] [PubMed] [Google Scholar]
- 44.Lannutti BJ, et al. Identification and activation of Src family kinases in primary megakaryocytes. Exp Hematol. 2003;31(12):1268–74. doi: 10.1016/j.exphem.2003.09.009. [DOI] [PubMed] [Google Scholar]
- 45.Huang J, et al. Abivertinib inhibits megakaryocyte differentiation and platelet biogenesis. Frontiers of Medicine. 2022;16(3):416–428. doi: 10.1007/s11684-021-0838-5. [DOI] [PubMed] [Google Scholar]
- 46.Boni LT, Rando RR. The nature of protein kinase C activation by physically defined phospholipid vesicles and diacylglycerols. J Biol Chem. 1985;260(19):10819–25. [PubMed] [Google Scholar]
- 47.Newton AC. Lipid activation of protein kinases. J Lipid Res. 2009;50(Suppl(Suppl)):S266–71. doi: 10.1194/jlr.R800064-JLR200. [DOI] [PMC free article] [PubMed] [Google Scholar]
- 48.Garcia P, et al. The pleckstrin homology domain of phospholipase C-delta 1 binds with high affinity to phosphatidylinositol 4,5-bisphosphate in bilayer membranes. Biochemistry. 1995;34(49):16228–34. doi: 10.1021/bi00049a039. [DOI] [PubMed] [Google Scholar]
- 49.Nishizuka Y. Intracellular signaling by hydrolysis of phospholipids and activation of protein kinase C. Science. 1992;258(5082):607–14. doi: 10.1126/science.1411571. [DOI] [PubMed] [Google Scholar]
- 50.Bader GD, Hogue CWV. An automated method for finding molecular complexes in large protein interaction networks. BMC Bioinformatics. 2003;4(1):2. doi: 10.1186/1471-2105-4-2. [DOI] [PMC free article] [PubMed] [Google Scholar]
- 51.Shannon P, et al. Cytoscape: a software environment for integrated models of biomolecular interaction networks. Genome Res. 2003;13(11):2498–504. doi: 10.1101/gr.1239303. [DOI] [PMC free article] [PubMed] [Google Scholar]
- 52.Bosc DG, et al. Identification and Characterization of CKIP-1, a Novel Pleckstrin Homology Domain-containing Protein That Interacts with Protein Kinase CK2 *. Journal of Biological Chemistry. 2000;275(19):14295–14306. doi: 10.1074/jbc.275.19.14295. [DOI] [PubMed] [Google Scholar]
- 53.Olsten MEK, et al. The Pleckstrin Homology Domain of CK2 Interacting Protein-1 Is Required for Interactions and Recruitment of Protein Kinase CK2 to the Plasma Membrane *. Journal of Biological Chemistry. 2004;279(40):42114–42127. doi: 10.1074/jbc.M407628200. [DOI] [PubMed] [Google Scholar]
- 54.Canton DA, et al. The Role of CKIP-1 in Cell Morphology Depends on Its Interaction with Actin-capping Protein *. Journal of Biological Chemistry. 2006;281(47):36347–36359. doi: 10.1074/jbc.M607595200. [DOI] [PMC free article] [PubMed] [Google Scholar]
- 55.Nie J, et al. CKIP-1: A scaffold protein and potential therapeutic target integrating multiple signaling pathways and physiological functions. Ageing Research Reviews. 2013;12(1):276–281. doi: 10.1016/j.arr.2012.07.002. [DOI] [PubMed] [Google Scholar]
- 56.Manke M-C, Ahrends R, Borst O. Platelet lipid metabolism in vascular thrombo-inflammation. Pharmacology & Therapeutics. 2022;237:108258. doi: 10.1016/j.pharmthera.2022.108258. [DOI] [PubMed] [Google Scholar]
- 57.Machlus KR, et al. Synthesis and dephosphorylation of MARCKS in the late stages of megakaryocyte maturation drive proplatelet formation. Blood. 2016;127(11):1468–80. doi: 10.1182/blood-2015-08-663146. [DOI] [PMC free article] [PubMed] [Google Scholar]
- 58.Münzer P, et al. CK2β regulates thrombopoiesis and Ca2+-triggered platelet activation in arterial thrombosis. Blood. 2017;130(25):2774–2785. doi: 10.1182/blood-2017-05-784413. [DOI] [PubMed] [Google Scholar]
- 59.Fan J, et al. A novel role of CKIP-1 in promoting megakaryocytic differentiation. Oncotarget. 2017;8(18):30138–30150. doi: 10.18632/oncotarget.15619. [DOI] [PMC free article] [PubMed] [Google Scholar]
- 60.Zehentmeier S, et al. Static and dynamic components synergize to form a stable survival niche for bone marrow plasma cells. Eur J Immunol. 2014;44(8):2306–17. doi: 10.1002/eji.201344313. [DOI] [PubMed] [Google Scholar]
- 61.Stegner D, et al. Thrombopoiesis is spatially regulated by the bone marrow vasculature. Nature Communications. 2017;8(1):127. doi: 10.1038/s41467-017-00201-7. [DOI] [PMC free article] [PubMed] [Google Scholar]
- 62.Rebholz H, et al. Selective knockout of the casein kinase 2 in d1 medium spiny neurons controls dopaminergic function. Biol Psychiatry. 2013;74(2):113–21. doi: 10.1016/j.biopsych.2012.11.013. [DOI] [PMC free article] [PubMed] [Google Scholar]
- 63.Cotte AK, et al. Lysophosphatidylcholine acyltransferase 2-mediated lipid droplet production supports colorectal cancer chemoresistance. Nature Communications. 2018;9(1):322. doi: 10.1038/s41467-017-02732-5. [DOI] [PMC free article] [PubMed] [Google Scholar]
- 64.Kuhajda FP, et al. Pharmacological glycerol-3-phosphate acyltransferase inhibition decreases food intake and adiposity and increases insulin sensitivity in diet-induced obesity. American Journal of Physiology-Regulatory, Integrative and Comparative Physiology. 2011;301(1):R116–R130. doi: 10.1152/ajpregu.00147.2011. [DOI] [PMC free article] [PubMed] [Google Scholar]
- 65.Heib T, et al. Isolation of murine bone marrow by centrifugation or flushing for the analysis of hematopoietic cells - a comparative study. Platelets. 2021;32(5):601–607. doi: 10.1080/09537104.2020.1797323. [DOI] [PubMed] [Google Scholar]
- 66.Zougman A, Selby PJ, Banks RE. Suspension trapping (STrap) sample preparation method for bottom-up proteomics analysis. Proteomics. 2014;14(9):1006–0. doi: 10.1002/pmic.201300553. [DOI] [PubMed] [Google Scholar]
- 67.Seiser S, et al. Octenidine-based hydrogel shows anti-inflammatory and protease-inhibitory capacities in wounded human skin. Sci Rep. 2021;11(1):32. doi: 10.1038/s41598-020-79378-9. [DOI] [PMC free article] [PubMed] [Google Scholar]
- 68.Weiss T, et al. Schwann cell plasticity regulates neuroblastic tumor cell differentiation via epidermal growth factor-like protein 8. Nat Commun. 2021;12(1):1624. doi: 10.1038/s41467-021-21859-0. [DOI] [PMC free article] [PubMed] [Google Scholar]
- 69.Kovarik JJ, et al. A multi-omics based anti-inflammatory immune signature characterizes Long COVID Syndrome. iScience. 2022:105717. doi: 10.1016/j.isci.2022.105717. [DOI] [PMC free article] [PubMed] [Google Scholar]
- 70.Cox J, Mann M. MaxQuant enables high peptide identification rates, individualized p.p.b.-range mass accuracies and proteome-wide protein quantification. Nat Biotechnol. 2008;26(12):1367–72. doi: 10.1038/nbt.1511. [DOI] [PubMed] [Google Scholar]
- 71.Cox J, Mann M. 1D and 2D annotation enrichment: a statistical method integrating quantitative proteomics with complementary high-throughput data. BMC Bioinformatics. 2012;13(Suppl 16):S12. doi: 10.1186/1471-2105-13-S16-S12. [DOI] [PMC free article] [PubMed] [Google Scholar]
- 72.Nolte H, et al. Instant Clue: A Software Suite for Interactive Data Visualization and Analysis. Sci Rep. 2018;8(1):12648. doi: 10.1038/s41598-018-31154-6. [DOI] [PMC free article] [PubMed] [Google Scholar]
- 73.Peng B, et al. A Comprehensive High-Resolution Targeted Workflow for the Deep Profiling of Sphingolipids. Analytical Chemistry. 2017;89(22):12480–12487. doi: 10.1021/acs.analchem.7b03576. [DOI] [PubMed] [Google Scholar]
- 74.Herzog R, et al. LipidXplorer: a software for consensual cross-platform lipidomics. PLoS One. 2012;7(1):e29851. doi: 10.1371/journal.pone.0029851. [DOI] [PMC free article] [PubMed] [Google Scholar]
- 75.Herzog R, et al. A novel informatics concept for high-throughput shotgun lipidomics based on the molecular fragmentation query language. Genome Biol. 2011;12(1):R8. doi: 10.1186/gb-2011-12-1-r8. [DOI] [PMC free article] [PubMed] [Google Scholar]
- 76.Thomas CP, et al. Identification and quantification of aminophospholipid molecular species on the surface of apoptotic and activated cells. Nat Protoc. 2014;9(1):51–63. doi: 10.1038/nprot.2013.163. [DOI] [PubMed] [Google Scholar]
- 77.Rampler E, et al. LILY-lipidome isotope labeling of yeast: in vivo synthesis of 13C labeled reference lipids for quantification by mass spectrometry. Analyst. 2017;142(11):1891–1899. doi: 10.1039/c7an00107j. [DOI] [PubMed] [Google Scholar]
- 78.Josefsson EC, et al. Platelet production proceeds independently of the intrinsic and extrinsic apoptosis pathways. Nat Commun. 2014;5:3455. doi: 10.1038/ncomms4455. [DOI] [PubMed] [Google Scholar]
- 79.Schneider CA, Rasband WS, Eliceiri KW. NIH Image to ImageJ: 25 years of image analysis. Nature Methods. 2012;9(7):671–675. doi: 10.1038/nmeth.2089. [DOI] [PMC free article] [PubMed] [Google Scholar]
Associated Data
This section collects any data citations, data availability statements, or supplementary materials included in this article.
Supplementary Materials
Data Availability Statement
Lipidomics data have been deposited at Zenodo (DOI:10.5281/zenodo.8186280) for immediate access. After publication, data will be further accessible at Metabolights (MTBLS6082, MTBLS6083, MTBLS6084). Proteomics data have been deposited at PRIDE (PXD037622). All other data supporting the findings in this study are included in the main article and associated files. Source data are provided with the manuscript.


