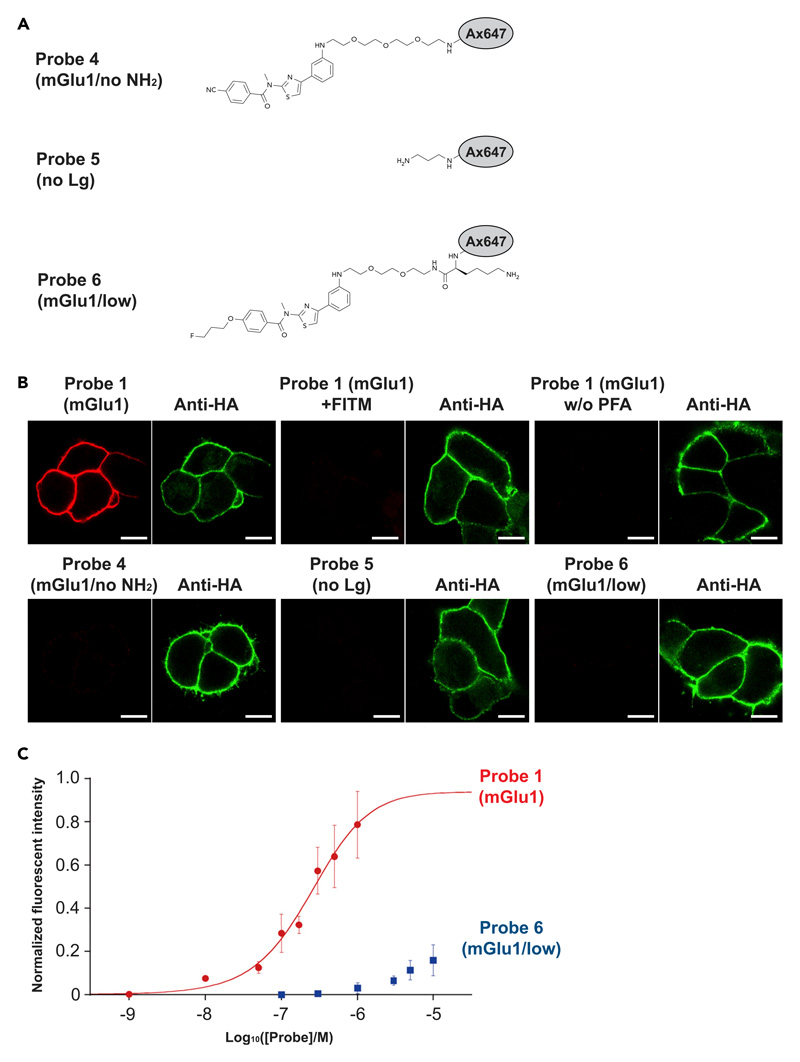
Figure 2. FixEL in cultured cells.
(A) Chemical structures of control molecules 4–6.
(B) Confocal imaging of HA-tag-fused mGlu1 expressed on HEK293T after FixEL of probe 1 (mGlu1), probe 1 (mGlu1) with 20 equiv of FITM, probe 1 (mGlu1) without PFA treating, probe 4 (mGlu1/no NH2), probe 5 (no Lg), or probe 6 (mGlu1/low) (Ax647, red). HA-tag-fused mGlu1 was stained with DyLight550 anti-HA tag (green). Fluorescence imaging of the cells was performed using a CLSM equipped with a 63× objective and a GaAsP detector (561 nm excitation for DyLight550 and 633 nm excitation for Ax647). Scale bars, 5 μm.
(C) Fluorescence change of the plasma membrane on mGlu1-expressed HEK293T cells depending on the concentration of probe 1 (mGlu1) (red circle) or probe 6 (mGlu1/low) (blue square). n = 8 cells in a single dish. Data are presented as mean ± SEM.

