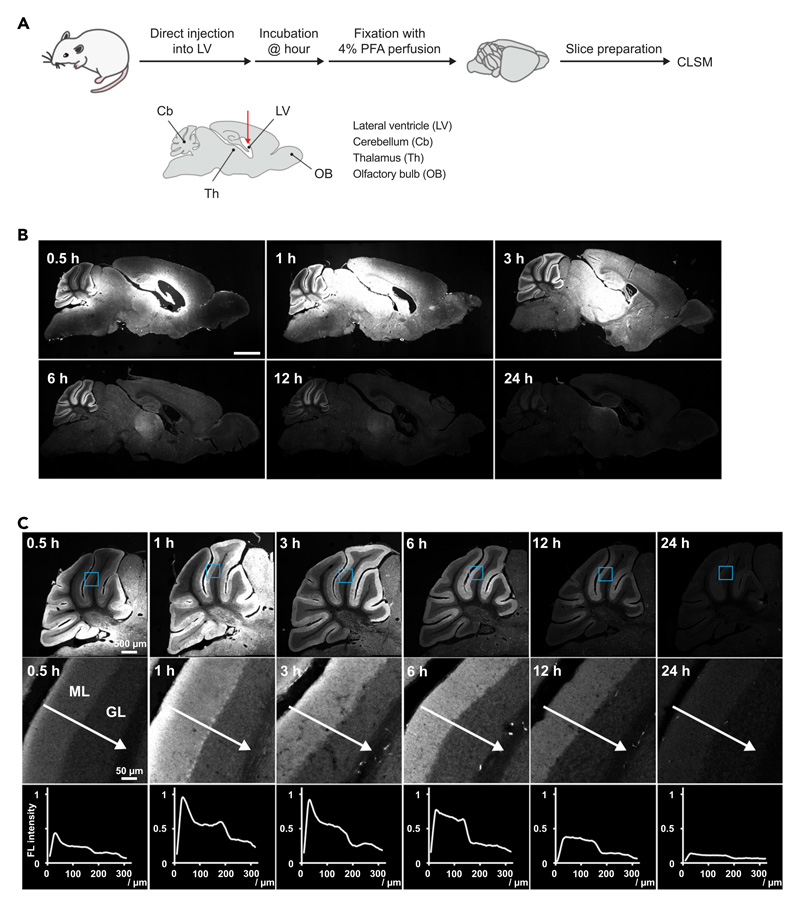
Figure 4. Visualization of the distribution changes of probe 1 (mGlu1) after FixEL at different incubation times.
(A) Schematic illustration of experimental procedures. Fluorescence imaging of whole-brain sagittal slices after FixEL with probe 1 (mGlu1). PBS(–) containing probe 1 (mGlu1) (4.5 μL of 100 μM probe which is assumed to be ca. 1 μM [Cbrain] based on the brain volume33) was injected into the mouse lateral ventricle. After 0.5, 1, 3, 6, 12, or 24 h of incubation, the mouse was transcardially perfused with 4% PFA.
(B) Fluorescence imaging of slices (50-μm thick) was performed using a CLSM equipped with a 5× objective and a GaAsP detector (633 nm excitation for Ax647). Scale bars, 2 mm.
(C) Line plot analysis of distribution changes of probe 1 (mGlu1) in the cerebellar lobule V after injection into the lateral ventricle. Fluorescence imaging of the cerebellum region was performed using a CLSM equipped with a 10× objective. The light blue square region was magnified. The line plot analysis was performed along a white arrow. ML, molecular layer; GL, granular layer.

