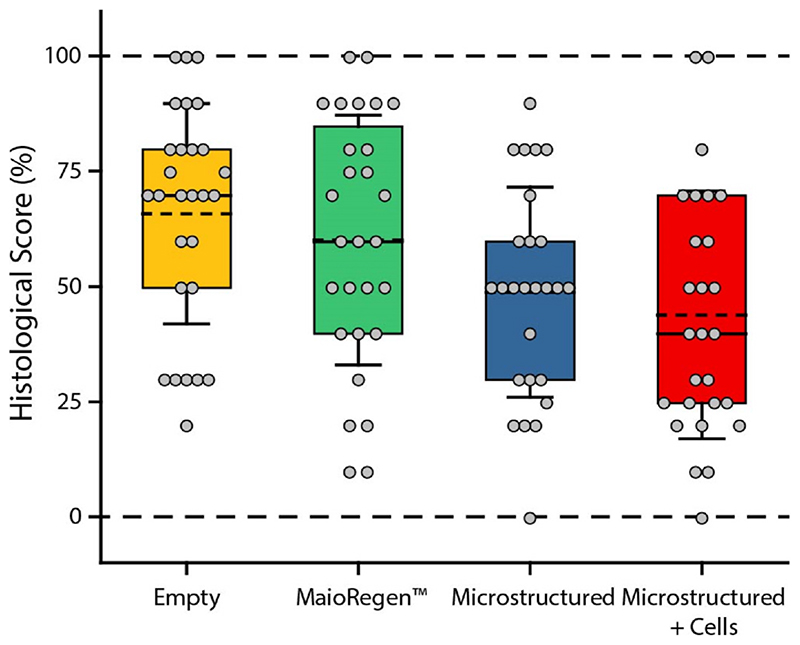
Fig. 7.
Histological scores for each treatment group from a single representative grader. The mean (dashed line), median (solid line), 25th to 75th percentile (box), and 1 standard deviation of the mean (whiskers) are shown. The data is provided in this format for visualization and generalization of the repair conditions. Statistical tests were not run on the aggregate data.

