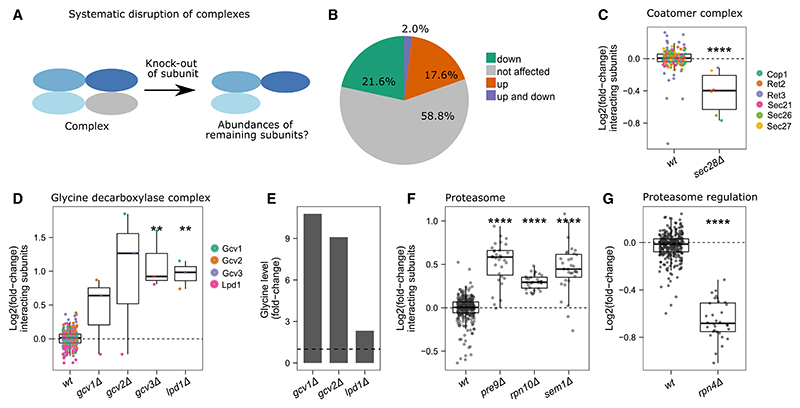
Figure 5. The response of protein complexes to genome-wide perturbation.
(A) Scheme: the response of complex subunits to the deletion of one subunit.
(B) Fraction of complexes in which at least one deletion of a subunit induces a decrease (22%, green), increase (18%, orange), or in which some deletions induce increase and others decrease (2%, purple) of subunit abundances. The total number of considered complexes is 51 (STAR Methods).
(C) Relative abundances of the coatomer complex subunits Cop1, Ret2, Ret3, Sec21, Sec26, and Sec27 are compared between sec28Δ and WT samples. Data are centered and log2-transformed.
(D) Relative abundances of the glycine decarboxylase complex subunits Gcv1, Gcv2, Gcv3, and Lpd1 are shown for the KOs of the glycine decarboxylase complex (gcv1Δ, gcv2Δ, gcv3Δ, and lpd1Δ) and WT samples.
(E) Relative glycine abundances in glycine decarboxylase KOs (gcv1Δ, gcv2Δ, and lpd1Δ) are shown, as derived from a reference dataset.15
(F) The relative protein abundances of proteasome complex subunits in the viable KOs of the proteasome complex—pre9Δ, rpn10Δ, and sem1Δ—compared with their abundance levels in WT strains. Data are centered and log2-transformed.
(G) The relative protein abundances of all measured proteasome subunits in rpn4Δ are compared with their WT abundance levels. Significance (two-sided Student’s t test with WT as a reference) is shown with asterisks (**** for p value ≤ 0.0001; *** for p value ≤ 0.001; ≤ for p value ≤ 0.01; * for p value ≤ 0.05).

