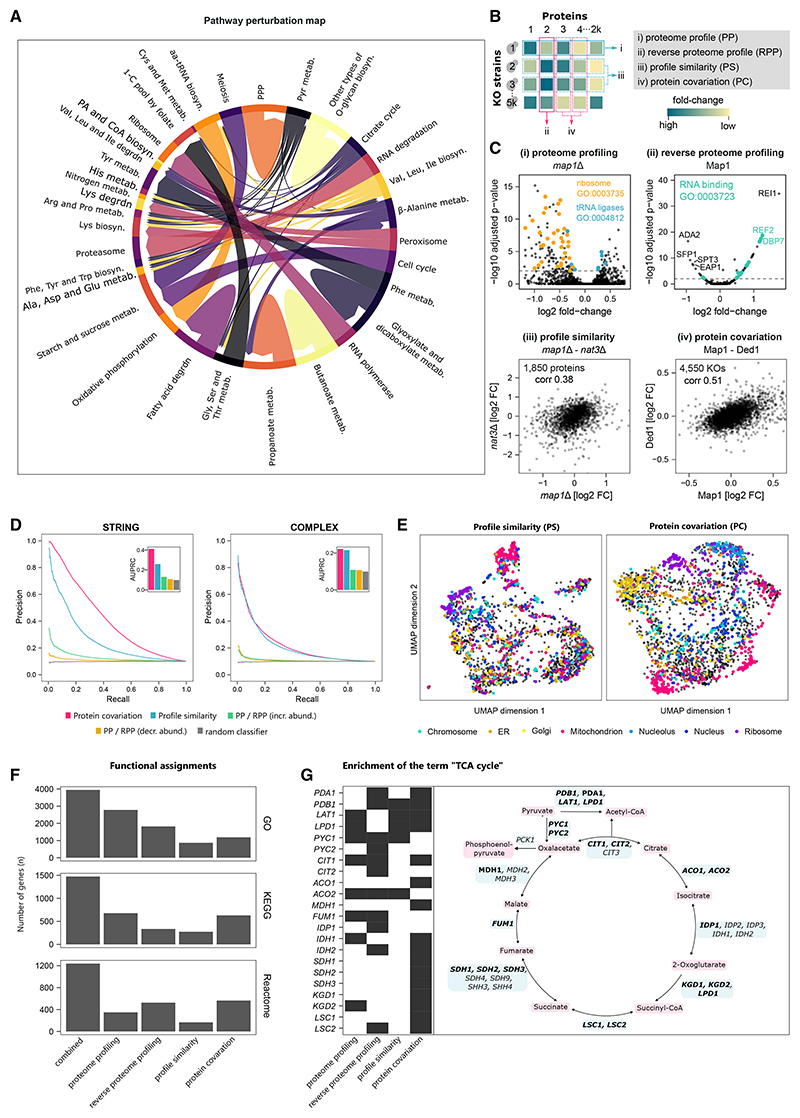
Figure 6. Annotating gene functions using functional proteomics.
(A) Map connecting genetic perturbations to the corresponding proteome response. Genes are grouped by KEGG pathway,69,70 arrows point from perturbed toward affected pathways (STAR Methods). PPP, pentose phosphate pathway; metab., metabolism; biosyn., biosynthesis; degrdn, degradation; 1-C, one carbon; PA, pantothenate; aa, aminoacyl; Pyr, pyruvate; amino acids indicated by standard three-letter code.
(B) The four functional annotation strategies supported by this dataset.
(C) The MAP1 gene exemplifies the complementary nature of these proteome annotation strategies. (Ci and Cii) Volcano plots of proteome profile and reverse proteome profile of the map1Δ strain and Map1 protein, respectively. Dashed lines indicate significant changes (adjusted p value < 0.01). (Ciii) Protein fold-changes (FC) measured in the map1Δ strain are similar to those in the nat3Δ strain (Spearman correlation = 0.38). (Civ) Abundance changes of Map1 and Ded1 proteins are correlated across all strains (Spearman correlation = 0.51).
(D) Precision-recall analyses showing that profile similarities (PSs) and protein covariation (PC) capture gene function very well. In addition, protein-KO pairs were ranked by the protein fold-change in the KO, showing that the extent of upregulation (PP/RPP [incr. abundance]) or downregulation (PP/RPP [decr. abundance]) is a relatively poor indicator of shared protein/KO function. Performance was assessed using two gold standards for shared protein function, STRING73 (left) and COMPLEAT protein complexes74 (right). Only responsive KOs were considered for profile similarity analysis. See STAR Methods for details.
(E) Functional maps created using uniform manifold approximation and projection (UMAP), grouping KO strains by profile similarity (left) and proteins by covariation (right). Subcellular compartment annotation shows that both approaches capture subcellular organization.
(F) Number of genes that could be associated with at least one GO term, KEGG pathway or Reactome pathway by over-representation analysis. For PPs, the enrichment was performed on the differentially expressed proteins in each strain and for RPPs the KOs in which the respective protein was differentially expressed. For PS and PC, we considered the highest-scoring 1% of associations in the networks. Functional enrichment was considered significant for p < 0.01 (topology-weighted topGO analysis) or BH-adjusted p < 0.01 (KEGG/Reactome Fisher’s exact test, STAR Methods).
(G) Functional annotations capture known interactions within the TCA cycle. The KEGG term “TCA cycle” was enriched in 22 TCA cycle genes by at least one of the annotation methods, 6 by two methods, and 6 by three.
See also Figure S5.

