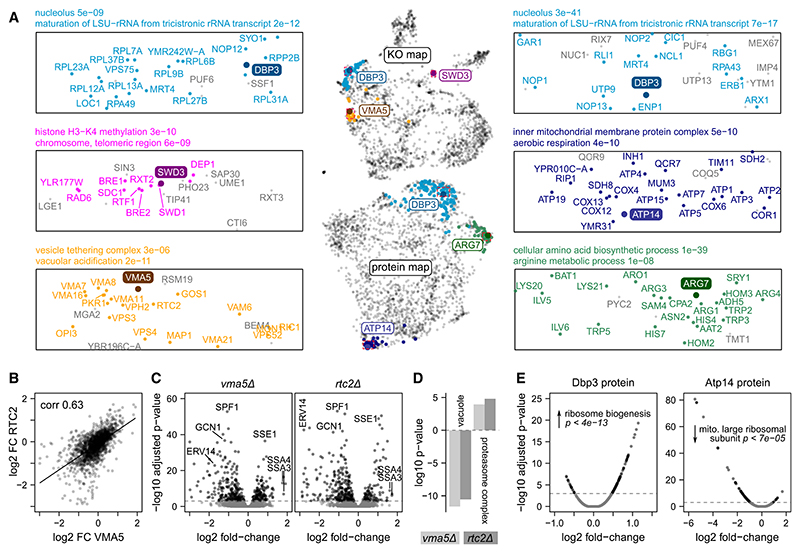
Figure 7. Exploring functional relationships in a proteomic map of genome-scale perturbation.
(A) Proximity in the UMAPs of KO strains and proteins reflects functional similarity. Three KOs (top map/left panel) and three proteins (bottom map/right panel) are shown as examples. KOs/proteins that are strongly linked to the example gene (within 1% highest-scoring associations, STAR Methods) are highlighted in color. Selected GO terms enriched among these groups are indicated (enrichment p value from Fisher’s exact test).
(B) Protein fold-changes (FC) of two KOs that are near each other in the UMAP (vma5Δ and rtc2Δ, bottom left in A) are strongly correlated (biweight midcorrelation coefficient = 0.63).
(C) Volcano plots of the PPs of the same KOs, revealing many overlapping differentially expressed proteins, a few of which are labeled.
(D) GO term enrichment for differentially expressed proteins using a Mann-Whitney U test, revealing that vacuolar proteins are depleted in both KOs, whereas the proteasome is enriched.
(E) Abundance changes of two example proteins, Dbp3 and Atp14, across KO strains are shown using volcano plots (RPP). Same GO enrichment analysis as in (D), showing that, e.g., Dbp3 abundance is increased in KO strains related to “ribosome biogenesis.”

