Abstract
Neutrophils play a crucial role in establishing inflammation in response to an infection or injury, but their production rates, as well as blood and tissue residence times, remain poorly characterized under these conditions. Herein, using a biomaterial implant model to establish inflammation followed by in vivo tracking of newly formed neutrophils, we determine neutrophil kinetics under inflammatory conditions. To obtain quantifiable information from our experimental observations, we develop an ordinary differential equation-based mathematical model to extract kinetic parameters. Our data show that in the presence of inflammation resulting in emergency granulopoiesis-like conditions, neutrophil maturation time in the bone marrow reduces by around 60% and reduced half-life in the blood, compared to non-inflammatory conditions. Additionally, neutrophil residence time at the inflammatory site increases by two-fold. Together, these data improve our understanding of neutrophil kinetics under inflammatory conditions, which could pave the way for therapies that focus on modulating in vivo neutrophil dynamics.
Keywords: Biomaterials, Foreign-body response, Granulopoiesis, Granulocytes, Half-life
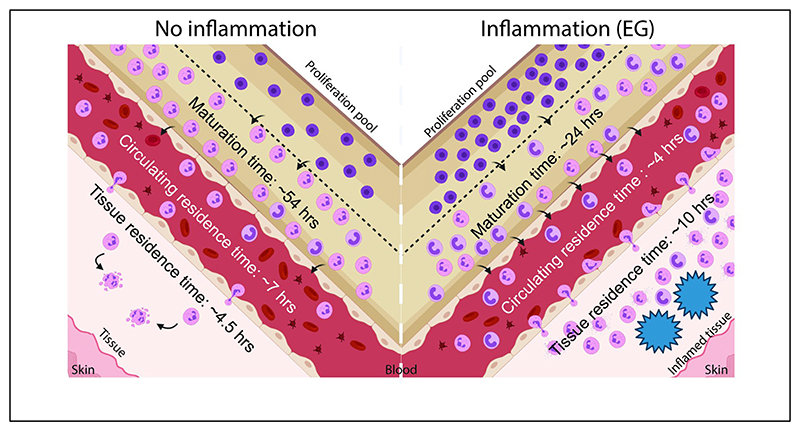
Graphical Abstract.
Introduction
Neutrophils are short-lived cells of the immune system that play an essential role in pathogen clearance and foreign body responses1. They are continually produced in the bone marrow through granulopoiesis, a process where hematopoietic stem cells differentiate to mature neutrophils in sequential steps involving numerous intermediate progenitor populations2,3. Mature neutrophils are recruited into circulation where their numbers remain relatively stable throughout an individual’s lifetime3,4. A delicate balance between progenitor proliferation, maturation time in the bone marrow, half-life in the blood, and clearance at various tissue sites, ensure that the numbers of neutrophils in circulation remain stable5,6.
The kinetics of neutrophil production, maturation, circulation, and death have been extensively studied in humans and mice. In humans, over 1011 neutrophils are produced every day, and the maturation time in the bone marrow and half-life in circulation has been measured to be about 6 days and 11-19 hours, respectively7–9. In mice, the number of neutrophils produced is about 107 per day, their maturation time in the bone marrow is 2-3 days, half-life in circulation is 10-13 hours, and half-life at tissue sites range from 8-18 hours6,9–12. These measurements have been made under steady-state, non-inflammatory conditions. Under inflammatory conditions, such as during an infection, chronic disease, injury, or biomaterial implantation, neutrophil lifespans remain unknown13.
Herein, we use a mouse model of biomaterial implantation to determine the time for maturation of neutrophils in the bone marrow, and blood and tissue residence time under sterile inflammatory conditions. We track neutrophils spatially and temporally in vivo and mathematically model the process to find that, in the presence of an inflammatory stimulus that results in a state resembling emergency granulopoiesis, many parameters associated with neutrophil kinetics are altered.
Materials and Methods
Animal Studies
All animal studies were conducted under the Control and Supervision Rules, 1998, of the Ministry of Environment and Forest Act (Government of India), and the Institutional Animal Ethics Committee, IISc. Experiments were approved by the Committee for Purpose and Control and Supervision of Experiments on Animals (permit numbers CAF/ethics/546/2017 and CAF/ethics/718/2019). Animals were procured from the Central Animal Facility, IISc or Hylasco Biotechnology (India) Pvt. Ltd, Hyderabad, India (a Charles River Laboratory licensed supplier). All experiments were performed on 8-14-week-old (weighing 20 – 30 grams) C57BL6 mice (both female and male).
Alginate and Chitosan microspheres
Alginate microspheres were prepared as described14. Chitosan (Sigma-Aldrich, USA) was dissolved in 1 % (v/v) acetic acid solution at a concentration of 1% (w/v) and stirred overnight at room temperature (RT). The chitosan solution was then passed through a 26G blunt needle at 0.8 bar pressure and a voltage of 6 kV, into 0.9 % (w/v) sodium tripolyphosphate cross-linking solution (pH 5.0). All the microspheres were collected and washed six times with sterile saline. The microspheres were then incubated in 1% NaOH at RT, for two hours with a replacement of NaOH solution at one hour, followed by incubation in a 1.6% (v/v) paraformaldehyde solution in phosphate-buffered saline at RT for 1 hour. All microspheres were then washed with excess saline and suspended in saline for use.
Microspheres were surgically implanted into the PC of mice as described14. In brief, microspheres (450 µl) were suspended in 450 µl sterile saline for implantation. The entire volume (900 µl) was then implanted into the PC following a laparotomy procedure. In controls (also called mock controls), the animals went through the surgical procedure and were injected with 900 µl sterile saline.
In vivo labelling of cells
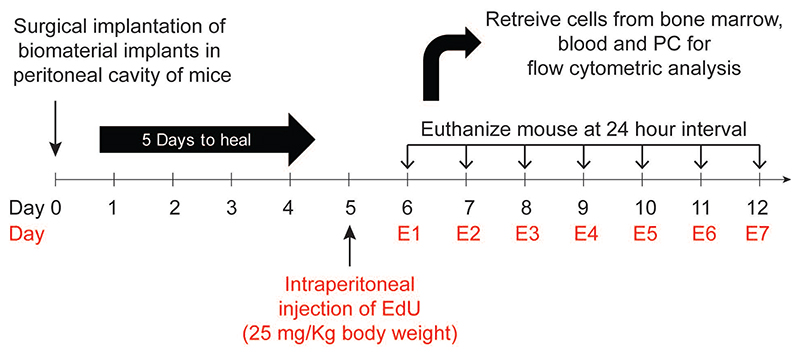
5-ethynyl-2-deoxyuridine (EdU) was purchased from Carbosynth (UK). Each mouse received EdU at a concentration of 25 mg/Kg body weight15 through intraperitoneal injection. Surgical procedures are also an inflammatory stimulus. To exclude the inflammatory effects of surgery, we waited five days post-surgery to inject EdU (Figure 1). Following EdU administration, mice were euthanized at 24-hour intervals, and labeled neutrophils were quantified using flow cytometry.
Figure 1. Experimental design.
Microspheres were implanted in the peritoneal cavity of mice. At day 5, EdU (5-ethynyl-2-deoxyuridine) was injected intraperitoneally to label proliferating cells. Following EdU administration, at 24-hour intervals, mice were euthanized, and labelled neutrophils were quantified using flow cytometry.
Retrieval of cells and microspheres
Mice were anesthetized using ketamine solution to retrieve cells and microspheres. After anaesthesia, about 500-1000 μl blood was collected through the retro-orbital vein and cardiac puncture. Following euthanasia, 5 ml of cold phosphate-buffered saline (PBS) with 4mM EDTA (PBS-EDTA) was injected into the PC using a 26G needle. The fluid containing cells was retrieved, passed through a 100 μm filter (to filter out implants) and stored on ice before analysis. Microcapsules were collected on the 100 μm filter by rinsing the PC with PBS and stored in 1.6% paraformaldehyde for analysis. Subsequently, the spleen and a tibia and femur (to get bone marrow) were collected. A cell suspension was prepared by mincing the tissue using forceps and passing the cell solution through a 100 μm filter. Cells isolated were subjected to RBC lysis and then counted manually using a hemocytometer.
Flow cytometry
For the quantification of labelled (EdU positive) neutrophils, after counting cells from each site, 0.5 × 10⁶ cells were used for antibody staining and flow cytometry. First, cells were stained with BD Horizon™ Fixable Viability Stain 510 for 20 mins at room temperature (RT). Cells were then fixed using 1.6 % paraformaldehyde for 30 mins at RT. Following one wash with excess PBS, cells were stained to estimate EdU positive cells using Sulfo-Cyanine5 azide (Lumiprobe, USA) as per the manufacturer’s instructions. Following two additional washes with PBS, cells were stained with anti-Ly6G (clone 1A8, BD Biosciences, USA) for 30 min. at 4°C, in PBS containing 1 % BSA and 4 mM EDTA (staining buffer). Finally, cells were re-suspended in staining buffer.
To determine neutrophil phenotype, 0.5 × 10⁶ cells from each site were stained immediately with a combination of the following antibodies for 30 mins at 4°C: CD11b (M1/70), Ly6G (1A8), CD45 (30-F11) CD54 (3E2), CD62L (MEL-14), CD182 (V48-2310) all purchased from BD Biosciences (USA). For ex vivo activation 0.5 × 10⁶ cells from each site were first activated using 5 µg/ml Cytochalasin B (Sigma-Aldrich) for 5 mins and 5 µM fMLP (Sigma-Aldrich) for 30 mins at 37°C and then stained with antibodies as mentioned above. Cells were stained with propidium iodide (2 µg/ml), and PI-positive cells were excluded to identify live cells.
To identify neutrophil progenitors, RBC were lysed and 2 × 10⁶ cells from bone marrow and spleen were first stained with BD Horizon™ Fixable Viability Stain 510 for 20 mins at room temperature (RT) and then with lineage cocktail antibodies: I-A/I-E (M5/114.15.2), CD49b (HMα2), NK-1.1 (PK136), CD11c (N418), Ly6C (HK1.4), Ly6G (1A8), CD3(17A2), CD127 (A7R34), CD19(6D5), CD45R/B220 (RA3-6B2) and stem/progenitor cell markers, c-Kit (2B8), Sca-1 (D7), CD34 (SA376A4) and CD16/32 (93). Ki-67 (clone 11F6, Biolegend, USA) staining was done using eBioscience™ Foxp3 / Transcription Factor Staining Buffer Set (Thermofisher Scientific, USA) according to the user manual.
All flow cytometry data were collected using a BD FACSCelesta (Becton Dickinson, USA) and analyzed using FlowJo (Tree-Star, USA). For all protocols, appropriate single color (using compensation beads, BD Biosciences) and fluorescence-minus-one (FMO) controls (using cells) were used to compensate the data and gate positive populations, respectively.
Elastase activity assay
The following numbers of cells were used for these assays: bone marrow – 2 × 10⁶, blood - 0.2 × 10⁶, peritoneal fluid - 0.2 × 10⁶. Cells were seeded in a 96-well clear flat bottom plates and incubated in a PBS solution containing CTAB. Supernatant containing intracellular contents were collected and stored at -80°C. Elastase activity was determined by the chromogenic substrate N-Methoxysuccinyl-Ala-Ala-Pro-Val p-nitroanilide (Sigma-Aldrich) and compared to a standard curve prepared using Elastase (from human leukocytes, Sigma-Aldrich).
For the calculations, we assumed that only neutrophils produce elastase. The enzyme content per neutrophils was calculated using the following formula: 96 well reaction volume = V = 150 µl, Total number of cells in volume (V) = A, Percentage of neutrophils in a sample (from flow cytometry) = X, Total number of Neutrophils in volume (V) = A.X, Total enzyme in reaction volume = B (Interpolated from the standard curve). Total enzyme per neutrophil = B/(A.X)
Mathematical model
A mechanistic mathematical model was developed based on existing knowledge of granulopoiesis13 and the following assumptions. The assumptions were: (i) Differentiation of granulocyte-monocyte progenitors (GMPs) to myelocytes occurs through several intermediate stages (such as myeloblast and promyelocyte), with each stage having a specific proliferation rate. The model assumes that the proliferating pool is kinetically homogeneous with identical turnover rates for all the stages. (ii) The numbers of senescent neutrophils returning to bone marrow again for clearance16 are assumed to be negligible. (iii) Both in non-inflammatory and the induced inflammatory condition, it is assumed that a steady-state is established, and the labeled cells are tracked at the steady-state. (iv) As the half-life of EDU in circulation (around half an hour)17 is much lower than the timescale of the experiment, mitotic pool neutrophil progenitors/precursors are assumed to be labeled instantaneously. Equations describing the percentage of EDU positive neutrophils in various compartments:
|
Maturation pool |
s = egress rate from individual transit compartment (1/hour) h = number of transit compartments with transfer rate “s” in maturation pool |
|
|
Blood |
B = percentage EDU+ neutrophils in blood U = egress rate from blood (1/hour) |
|
|
Peritoneum |
Pe = percentage EDU+ neutrophils in peritoneum w = egress rate from peritoneum (1/hour) |
The detailed derivation of the equations is provided in the Supplementary Information.
Parameter estimation
Agreement between model estimation and experimental data is quantified18 as given below, where noise in the experimental measurement is assumed to be normally distributed:
n = number of datasets
m = number of time points
Yi,j = measured data
Yi,j(t) = estimated value
σj = standard deviation of the measured data at each timepoint.
Equations are numerically solved using ODE45 in MATLAB with initial conditions that all compartments except proliferation pool has no EdU tagged cells initially (at t=0). The initial percentage of EDU tagged cells, α in the proliferation pool, is a parameter in the model. The distribution of parameters yielding acceptable agreement between model and data are obtained using iterative Approximate Bayesian Computation (iABC)19 and iABC procedure was implemented as described20. For distributions resulting from genetic algorithm(GA), Genetic Algorithm in global optimization toolbox of MATLAB R2020b is used. At least 2500 individual parameter sets yielding from repeated GA runs are used to get parameter distributions in all experimental groups. SI and observability analysis were performed analytically (see supplementary information).
Statistics
All data presented are based on at least 2 or more independent experiments with at least 3 animals per experimental group. An independent experiment is described as an experiment involving new/different batches of microspheres, mice and performed on a different date. Each ‘n’ represents an individual animal. One-way ANOVA was used for all statistical comparisons involving multiple groups. For the neutrophil tracking data across different tissue sites (BM, Blood and PC), one-way ANOVA was used at each time point. Significance is represented as * p<0.05, ** p<0.01, *** p<0.001 and **** p<0.0001. Data are presented as mean ± standard deviation. Common Language Effect Size (CLES) was used to determine statistical differences in parameters estimated using the mathematical model. The CLES measure gives us the probability of one random sample drawn from one distribution has a higher value than a randomly drawn sample from another distribution. CLES measure was calculated using the MATLAB implementation21 and is reported with 95% confidence interval.
Results
Biomaterial implant model for inducing inflammation
The mouse peritoneal cavity (PC) has been used as a model to study the molecular and cellular events for initiation, persistence, and resolution of inflammation22. Some of the most commonly used irritants (zymosan, LPS and thioglycolate), however, result in an inflammatory microenvironment that lasts for short (<3 days) periods22–24. We have previously shown that peritoneal implantation of sterile biomaterial microspheres results in sustained inflammation, which may be used to study neutrophil production under inflammatory conditions25. Hence, mice received sterile biomaterial microspheres or saline as a control (referred to as mock). To tune the level of inflammation, we used chitosan (highly stimulatory26 in its crude form) and ultrapure alginate (less stimulatory14,25) to prepare the biomaterial microspheres (Fig. S1 A). Implantation of these biomaterial microspheres resulted in recruitment of neutrophils to the implantation site for at least ten days, with a concomitant increase in the percentage of these cells (Fig. S1 B), as reported previously14,25.
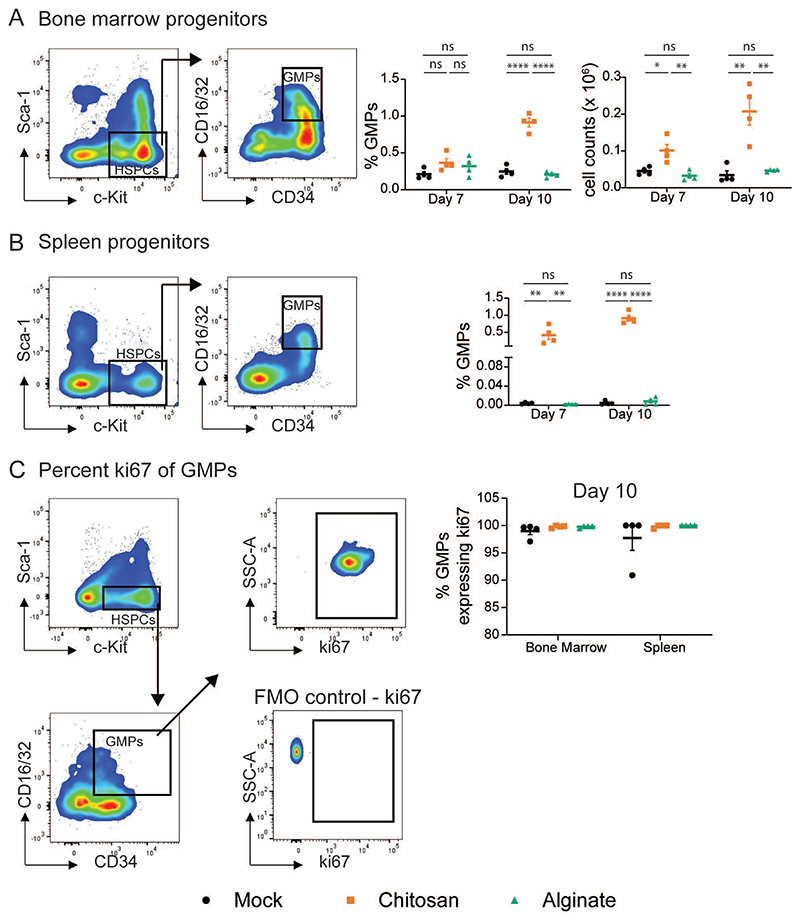
As a measure of the level of inflammation, we determine the proportions of granulocyte-monocyte progenitors (GMP), which increase when an inflammatory stimulus induces emergency granulopoiesis27. GMP population was identified as Lineage- c-Kit+ Sca-1- CD16/32+ CD34+ cells through flow cytometry in the bone marrow (BM) (Figure 2A) and spleen (Figure 2B). We observe that in mice implanted with alginate microspheres, the percentages and number of GMP in the bone marrow and percentages in the spleen were similar to those in mock controls at seven- and ten-day post-implantation. In contrast, chitosan microsphere implantation significantly increased GMP percentages and number (Figure 2A and 2B). However, no differences were observed in the proliferation of GMPs, and all of them (∼100%) appeared to be proliferating based on the expression of ki67 (Figure 2C).
Figure 2. Quantifying Granulocyte-Monocyte Progenitors (GMP).
A and B – Representative flow cytometry dot plots to determine GMPs (c-Kit+ Sca1- CD34+ CD16/32+) and quantification of granulocyte-monocyte progenitors (GMPs) as a percentage of total live single cells from bone marrow (BM) (A) and spleen (B) at day 7 and 10 after mock or microsphere-implantation. Absolute GMP counts in the bone marrow were obtained by multiplying GMP percentage with total cell counts. c-Kit+ Sca-1- population was identified as a sub-population of live cells and lineage negative (Lin–) cells, where Lin– indicates negative for I-A/I-E, CD49b, NK-1.1, CD11c, Ly6C, Ly6G, CD3, CD127, CD19 and CD45R/B220. C - Representative flow cytometry dot plots to determine ki67 expressing GMPs. Fluorescence-minus-one (FMO) plot was used to ascertain ki67 gate position. Percentage of GMPs expressing ki67 was quantified from the BM and spleen of mice at day 10 after mock or microsphere-implantation. For statistical analyses, a one-way ANOVA was performed followed by Tukey post-test, and * = p < 0.05; ** = p < 0.01; *** = p < 0.001; and **** = p < 0.0001.
Neutrophil phenotype
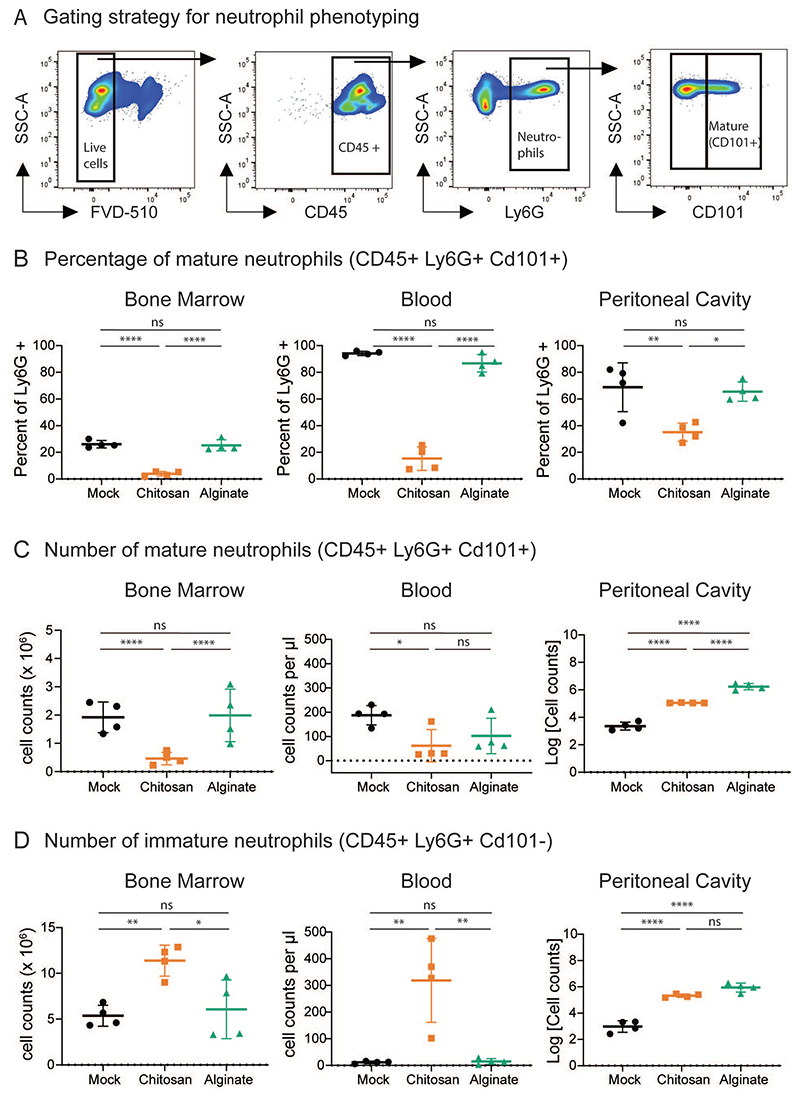
To further understand the effects of microsphere implantation, we studied the phenotype of neutrophils isolated from bone marrow, blood and PC (implant site). Neutrophils were identified using the gating strategy shown in Figure 3A, and surface expression of CD101 was used to differentiate mature and immature neutrophils28. At day ten post implantation, we observed that percentage of mature neutrophils (CD45+ Ly6G+ CD101+) is significantly lower in the bone marrow, blood and PC of mice implanted with chitosan microspheres, as compared to mock or alginate implanted mice (Figure 3B). Additionally, we observed that in the chitosan implanted mice, absolute numbers of mature neutrophils reduced ∼4 fold and ∼2 fold in the BM and blood, respectively (Figure 3C). Following the aforementioned trend, the number of immature neutrophils increased ∼2 fold and 30 fold in the BM and blood of chitosan implanted mice as compared to mock and alginate implanted mice. (Figure 3D).
Figure 3. Quantifying Immature and Mature Neutrophils.
A – Representative flow cytometry dot plots and gating strategy to identify mature neutrophils (CD45+ Ly6G+ CD101+) in bone marrow. Similar gating strategy was used to identify mature neutrophils from other tissue sites. B – D – Percentage of mature neutrophils (B), and absolute cell counts of mature (C) and immature (D) neutrophils at different sites at day 10 after mock or microsphere-implantation procedure. n = 4 mice per group from 2 independent experiments. For statistical analyses, a one-way ANOVA was performed followed by Tukey post-test, and * = p < 0.05; ** = p < 0.01; *** = p < 0.001; and **** = p < 0.0001.
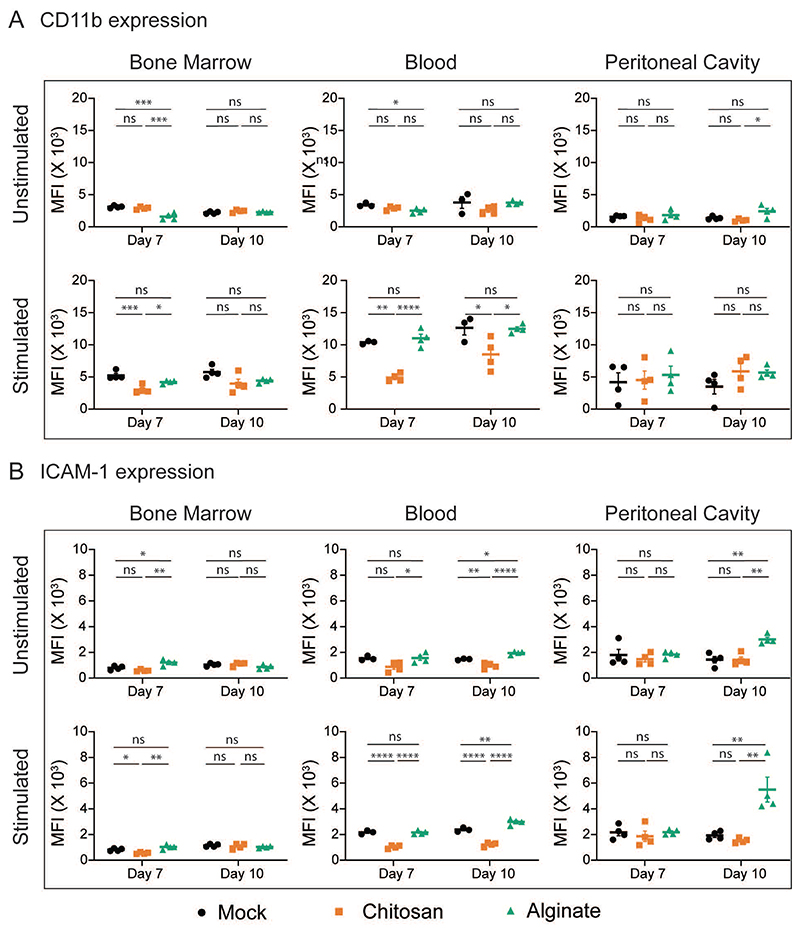
Next, we measured the surface expression levels of CD11b, ICAM-1, CD62L and CXCR2 on neutrophils at seven- and ten-day post-implantation. The expression levels of these proteins are expected to vary based on the level of cellular activation29. We observed that in neutrophils retrieved from the bone marrow and blood of mice implanted with chitosan microspheres, expression of CD11b and ICAM-1 following ex vivo activation was significantly lower compared to cells from mice implanted with alginate microspheres or mock controls. These differences are not observed among neutrophils at the site of inflammation (Figure 4A and 4B). The activation-dependent upregulation of CD11b and ICAM-1 expression may also be visualized as a fold change (Fig. S2A and S2B). Activation-dependent downregulation of CD62L and CXCR2 expression was also compromised in neutrophils isolated from the blood of mice implanted with chitosan microspheres as compared to those from mice with alginate microspheres or mock controls (Fig. S2C, S2D). Additionally, the granular content of neutrophils from the blood of mice implanted with microspheres was also different from mock controls, as significantly lower amounts of elastase per neutrophil was observed in the blood of mice with microsphere implants (Figure S2E).
Figure 4. Neutrophil Phenotype.
CD11b (A) and ICAM-1 (B) expression levels among neutrophils from bone marrow, blood and peritoneal cavity at day 7 and day 10 after mock or microsphere-implantation procedure. Cells were either treated (stimulated) or not treated (unstimulated) with cytochalasin B (5 µg/ml) and fMLP (5 µM) ex-vivo, and expression levels of CD11b and ICAM-1 among neutrophils (Ly6G+ cells) was quantified. Saline and chitosan groups are representative of 2 independent experiments with total n = 4. Alginate group is representative of 1 independent experiment with n = 4 mice at each time point, involving both male and female mice (no difference was observed based on sex of mice). For statistical analyses, a one-way ANOVA was performed followed by Tukey post-test, and * = p < 0.05; ** = p < 0.01; *** = p < 0.001; and **** = p < 0.0001. Black – Mock, Orange – Chitosan, Green - Alginate
Overall, increased GMP percentage in the bone marrow and spleen, more immature neutrophils in the BM and blood along with altered surface protein expression and reduced granule enzyme content among neutrophils in circulation suggest that emergency granulopoiesis (EG)-like conditions are induced following chitosan microsphere implantation. However, as GMP levels remains similar in mice with alginate microspheres and mock controls, we label the former as having caused inflammation but not inducing emergency granulopoiesis.
Neutrophil Kinetics
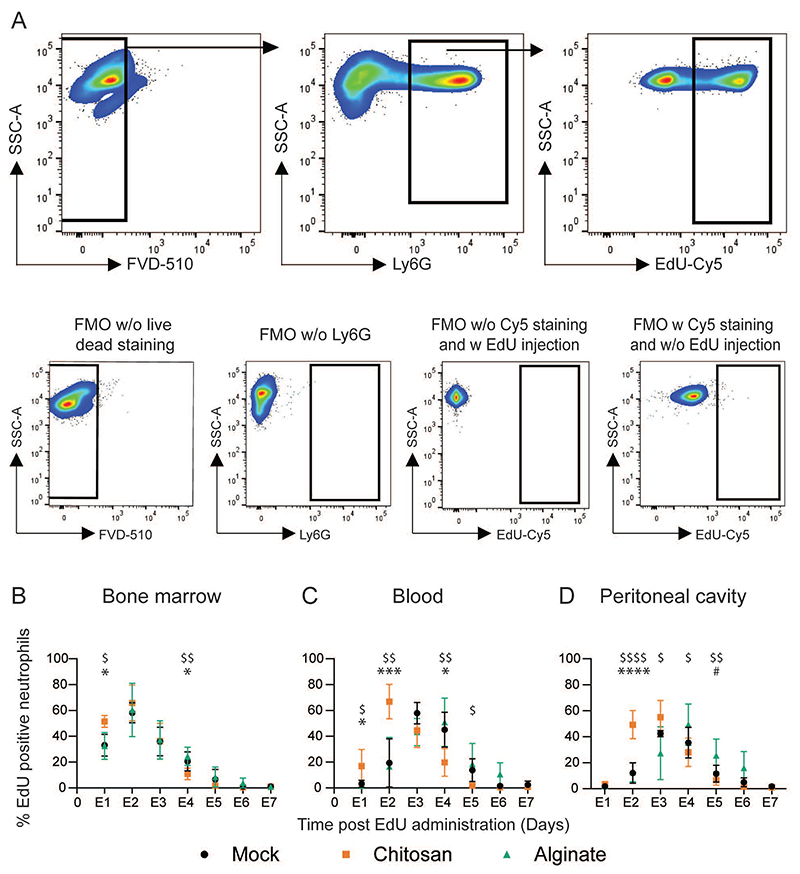
We next assessed the kinetics of neutrophils under non-inflammatory (mock), inflammatory-(alginate), and inflammation-inducing EG-like (chitosan) conditions. 5-ethynyl-2-deoxyuridine (EdU) labeled neutrophils were identified through the gating strategy described in Figure 5A (numbers in Supplementary Table 1). Under non-inflammatory and inflammatory (but not EG-like) conditions, labeled neutrophil peaks were observed at day E2 in bone marrow and day E3-E4 in the blood, which is line with recently published data on neutrophils kinetics under steady-state conditions6. In the presence of inflammation that induces EG-like conditions, we observed that labeled neutrophils appeared earlier in the bone marrow (at day E1, Figure 5B) and blood (at day E2, Figure 5C) as compared to the other two conditions. Percentages of labeled neutrophils in the PC (Figure 5D) followed a trend similar to those in circulation. Under EG-like conditions, the peak of labeled neutrophils appeared at day E2-E3, which was earlier than the peak observed in the other two conditions (day E3-E4). The differences in the timing of the peak of labeled neutrophils at each tissue site in the mice with EG-like conditions suggest a faster release of neutrophils into the circulation and early arrival of these labeled cells at the inflammatory site.
Figure 5. Tracking labelled neutrophils.
A - Gating strategy used to determine labelled (EdU positive) neutrophils. Fluorescence-minus-one (FMO) plots were used to ascertain gate positions. Plots are representative of multiple independent experiments. B – D – Labelled neutrophil percentages in the bone marrow (B) blood (C) and the peritoneal cavity (D) at different times. N = 3-7 mice/time point/per group pooled from at least 3 independent experiments including both male and female mice (no difference was observed based on sex of mice). For statistical analyses, at each time point, a one-way ANOVA was performed followed by Tukey post-test. *, $ and # indicates comparison between mock vs chitosan, alginate vs chitosan and mock vs alginate, respectively. * = p < 0.05; ** = p < 0.01; *** = p < 0.001; and **** = p < 0.0001
The overall time taken for labeled neutrophils to appear and then disappear may also be analyzed to provide insights into residence time in various compartments. One method often employed to understand half-life and residence times is fitting an exponential decay curve from the peak6,12. However, an exponential decay function is not an actual depiction of the underlying process and may lead to inaccurate estimation of the parameters. Therefore, we developed a mechanistic model to extract kinetic parameters from the experimental data.
Quantifying Kinetic Parameters
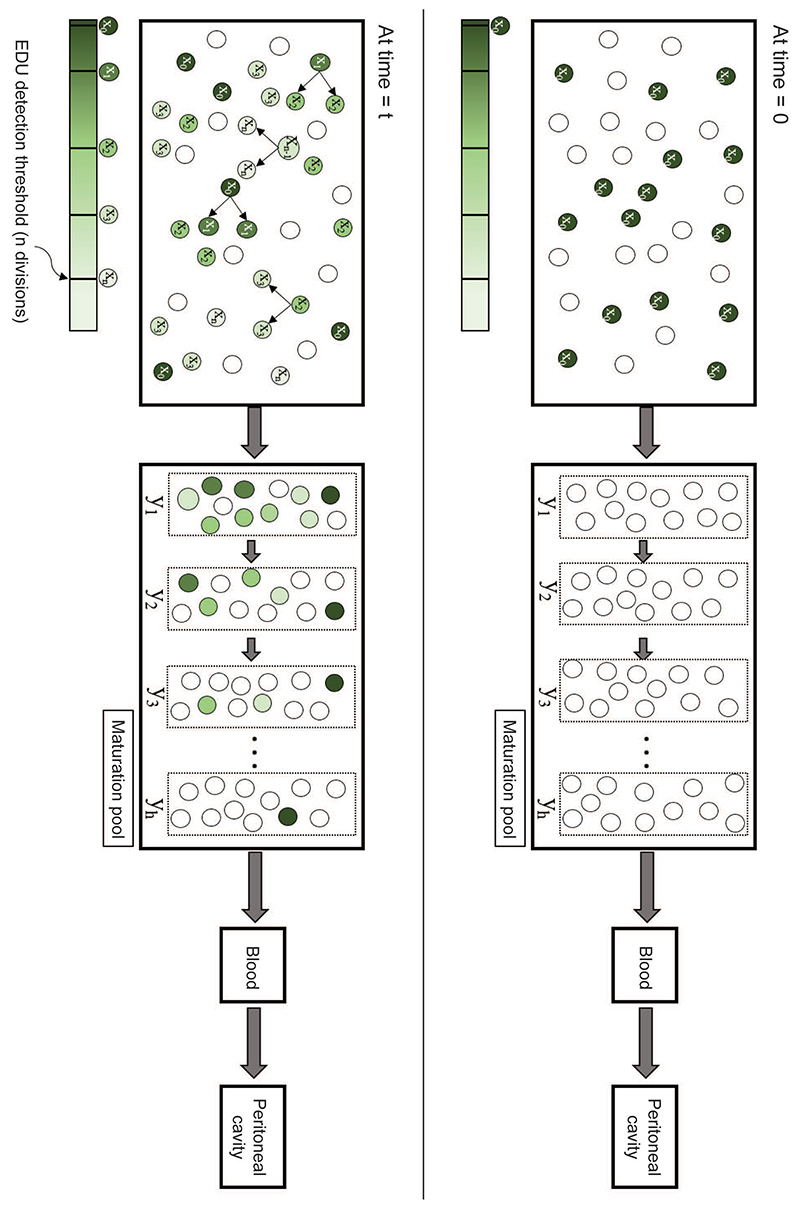
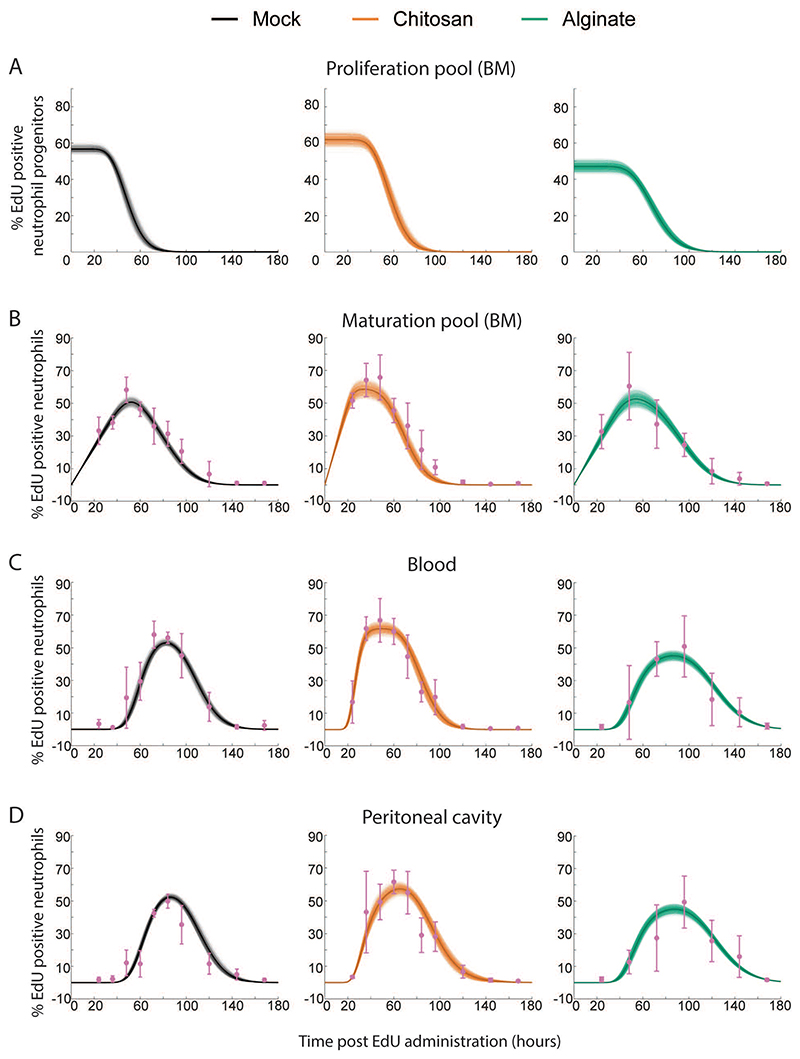
We applied a system of differential equations that explicitly model EDU dilution, neutrophil maturation in the bone marrow, and residence times in the blood and tissue (Figure 6). The model parameters must be Structurally Identifiable (which is a consequence of the model topology) for them to be estimated30,31. By analyzing the transfer functions of the experimentally observed variables and the observability of internal state variables, we determine that the model parameters were identifiable (supplementary information). Then, we fit the model to the data obtained from mock controls and microsphere implanted mice, beginning with uniform priors for all the parameters in iterative Approximate Bayesian Computation (iABC). Representative fits (∼1000) of the model to data are presented in Fig. S3. To determine if the model is predictive, we next performed additional experiments to determine the fractions of EdU labeled neutrophils in each compartment at day 1.5, 2.5, and 3.5. The experimental data obtained fit well to the model (Fig. S3). Nevertheless, the fitting could be improved with the additional data points, and hence we re-optimized the mathematical model to the entire data-set to obtain improved estimates of parameters (Figure 7).
Figure 6. Schematic for Modelling Neutrophils Kinetics.
A mathematical model was developed that represented four compartments, namely a proliferating cell population and a maturation pool in the bone marrow, circulating cells (in the blood), and cells at the inflammatory site (peritoneal cavity). The schematic describes our approach, with the top panel denoting time = 0, when a subset of neutrophil-progenitors are instantaneously labelled by EdU. At time = t, labelled neutrophil-progenitors either divide in the bone marrow or stop dividing and migrate into the maturation pool, followed by the blood and inflammatory tissue site.
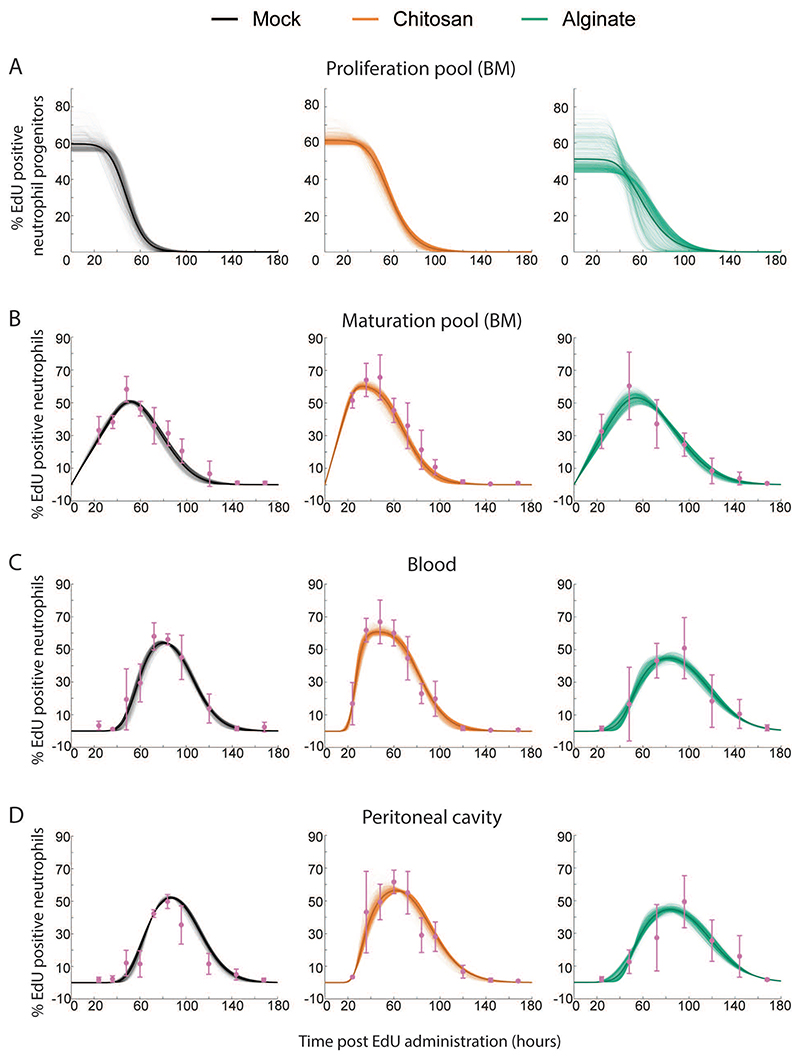
Figure 7. Mathematical Model Fits Obtained using the iABC Procedure.
Representative fits to Mock, Chitosan and Alginate data are shown here. Sample curves corresponding to different parameters sets in proliferation pool (A), maturation pool (B), blood (C) and peritoneal cavity (D) are shown as thin lines and average is shown as thick solid line. Experimentally measured data are shown in pink with standard deviation.
The practical identifiability of the parameter (which depends on the discrete nature and quality of the measured data) appears as the magnitude of spread in the parameter distributions32,33. This spread is presented in Table 1 as the medians and range of each parameter. Using these parameters, we calculated the values for maturation time in the bone marrow, and half-life and residence time in the blood and PC (Table 2). Owing to the large sample size in parameter distributions, comparing the distributions between different groups will show statistical significance even if the differences are very small. To look at practical significance of the differences, which would not be greatly influenced by the large sample size, a non-parametric effect size measure (Common Language Effect Size (CLES)), was used to quantify the differences34. CLES was calculated between different groups for all the parameters and tabulated (Table S2).
Table 1.
Parameter distributions obtained from iterative Approximate Bayesian Computation (iABC) and Genetic Algorithm (GA) methods to fit the mathematical model to experimental data. α stands for initial percentage of labelled cells; U for egress rate from blood; R for number of neutrophils in blood divided by number of neutrophils in proliferation pool, R1 for number of neutrophils in proliferation pool divided by number of neutrophils in maturation pool; s for egress rate from individual transit compartment; h for number of transit compartment with transfer rate “s” in maturation pool; w for egress rate from peritoneum. n from the mathematical model was kept constant at 10 across treatment groups and mathematical model fitting procedures.
| Saline | Chitosan | Alginate | ||||||||||
|---|---|---|---|---|---|---|---|---|---|---|---|---|
| Median | Range (central 95%) | Median | Range (central 95%) | Median | Range (central 95%) | |||||||
| α | iABC | 59.21 | 57.16 | 61.39 | 65.55 | 62.52 | 68.30 | 51.37 | 48.44 | 53.58 | ||
| GA | 56.16 | 56.75 | 69.61 | 61.01 | 59.29 | 65.17 | 47.4 | 44.4 | 72.65 | |||
| U (hr-1) | iABC | 0.14 | 0.12 | 0.15 | 0.24 | 0.20 | 0.27 | 0.10 | 0.09 | 0.11 | ||
| GA | 0.38 | 0.12 | 1.58 | 0.38 | 0.14 | 1.5 | 0.27 | 0.08 | 1.63 | |||
| R | iABC | 0.77 | 0.72 | 0.88 | 0.39 | 0.36 | 0.46 | 0.78 | 0.72 | 0.92 | ||
| GA | 0.29 | 0.07 | 0.89 | 0.24 | 0.05 | 0.66 | 0.30 | 0.05 | 1.07 | |||
| R1 | iABC | 0.17 | 0.16 | 0.19 | 0.38 | 0.36 | 0.40 | 0.29 | 0.27 | 0.31 | ||
| GA | 0.17 | 0.14 | 0.19 | 0.42 | 0.37 | 0.45 | 0.30 | 0.16 | 0.35 | |||
| s (hr-1) | iABC | 0.68 | 0.64 | 0.71 | 1.26 | 1.19 | 1.35 | 0.62 | 0.58 | 0.674 | ||
| GA | 0.57 | 0.28 | 0.87 | 1.21 | 0.49 | 1.90 | 0.50 | 0.12 | 1.06 | |||
| h | iABC | 36 | 34 | 38 | 30 | 28 | 32 | 29 | 27 | 31 | ||
| GA | 30 | 16 | 49 | 29 | 12 | 47 | 24 | 6 | 49 | |||
| w (hr-1) | iABC | 0.22 | 0.14 | 0.35 | 0.10 | 0.08 | 0.15 | 1.47 | 0.63 | 0.197 | ||
| GA | 0.15 | 0.11 | 0.39 | 0.09 | 0.07 | 0.6 | 1.16 | 0.35 | 1.98 | |||
Table 2. Mathematical model based calculation of maturation time in bone marrow, and half-life in circulation and site of inflammation.
| Saline | Chitosan | Alginate | ||||||||||
|---|---|---|---|---|---|---|---|---|---|---|---|---|
| Median | Range (central 95%) | Median | Range (central 95%) | Median | Range (central 95%) | |||||||
| Maturation time in bone marrow (h/s) (hours) | iABC | 53.62 | 50.86 | 55.98 | 24.12 | 22.97 | 25.27 | 46.76 | 44.19 | 49.35 | ||
| GA | 54.42 | 49.99 | 59.80 | 24.37 | 21.83 | 27.39 | 47.69 | 43.36 | 56.17 | |||
| Half-life in blood (ln(2)/U) (hours) | iABC | 4.69 | 4.33 | 5.36 | 2.79 | 2.52 | 3.33 | 6.43 | 5.90 | 7.46 | ||
| GA | 1.8 | 0.43 | 5.35 | 1.8 | 0.44 | 4.72 | 2.5 | 0.42 | 8.05 | |||
| Half-life in peritoneum (ln(2)/w) (hours) | iABC | 3.09 | 1.95 | 4.74 | 6.69 | 4.45 | 8.44 | 0.46 | 0.35 | 1.09 | ||
| GA | 4.6 | 1.74 | 5.92 | 7.19 | 1.14 | 8.83 | 0.59 | 0.34 | 1.97 | |||
Next, to assess if the parameter values obtained were an artifact of the fitting approach, we used a different fitting algorithm. A rejection-based algorithm, such as iABC, doesn’t lead to stationary distribution of parameters, rather moves toward one single parameter set and consequently leads to narrow parameter distributions. Hence, we used a genetic algorithm based fitting approach, which while resulting in broader parameter distributions has the advantage of computing definite bound on all possible parameters values. The genetic algorithm based fitting approach resulted in similar fits to our experimental data (Figure 8), and importantly presented a broader range of parameter values that included the values from the iABC strategy (Table 1 and Table 2). Also, a further validation of the model was performed as described in the supplementary information.
Figure 8. Mathematical Model Fits Obtained using the Genetic Algorithm Procedure.
Representative fits to Mock, Chitosan and Alginate data are shown here. Sample curves corresponding to different parameters sets in proliferation pool (A), maturation pool (B), blood (C) and peritoneal cavity (D) are shown as thin lines and average is shown as thick solid line. Experimentally measured data are shown in pink with standard deviation.
Finally, to determine the applicability of the mathematical model to a different inflammatory setting, we performed intraperitoneal injections of LPS and assessed neutrophil kinetics. Our data and model fits showed that LPS resulted in emergency granulopoiesis, which was characterized by a drop in bone marrow maturation time of neutrophils similar to the one we observe in chitosan-microsphere implanted mice (Fig. S4).
Through these steps, we determined that in mice with inflammation that induces EG-like conditions, the neutrophil maturation time in the bone marrow is considerably lower compared to the other two conditions. While this was apparent from the experimental data shown in figure 5 (peak of EdU labelled neutrophils in blood appearing at day 2 in mice with chitosan microspheres), the mathematical model allowed us determine that the median of the range of maturation times was lowered to ∼24 hours (compared to the expected ∼54 hours under non-inflammatory conditions). Additionally, we observed that half-life (and consequently residence time) in blood decreased, while half-life in PC increased in mice with EG-like conditions compared to non-inflammatory conditions. This was, in fact, not apparent from the experimental data.
Together, these data suggest that in response to inflammation resulting in EG-like conditions, neutrophils are generated and released faster from the bone marrow and spend less time in the blood and more time at the site of inflammation when compared to a non-inflammatory condition. In contrast, under a milder inflammatory condition (alginate implants), maturation time is not altered, but the half-life of neutrophils in the blood increases modestly.
Discussion
Neutrophils play an essential role in pathogen and foreign body clearance35. However, their aberrant activity may result in pathological conditions such as inflammatory bowel disease36, rheumatoid arthritis37, and acute respiratory distress syndrome38. A potential strategy to enable their beneficial roles while also limiting their damaging effects is the modulation of neutrophil frequencies and life cycle1,13,39. To achieve such modulation, we must first determine neutrophil kinetics under inflammatory conditions.
Granulopoiesis under emergency conditions has been explored by injecting granulocyte colony stimulating factor (G-CSF)11 or E. coli40 or LPS41. Both G-CSF and E. coli injections resulted in neutrophils appearing faster in circulation 11,40, and it was suggested (but not demonstrated) that this was due to reduced maturation time in the bone marrow. Another study has determined changes in neutrophil production rates in the bone marrow following a burn injury42, but other aspects of the kinetics have not been determined. Our data on neutrophil kinetics under emergency granulopoiesis-like conditions induced by chitosan microspheres is in agreement with these reports, and demonstrates that maturation time in the bone marrow is indeed reduced. We show that alterations in maturation time results in an increase in the number and percentage of immature neutrophils in the bone marrow, circulation and at the inflammatory site, which could have implications on the phenotype and function of circulating neutrophils. For example, the lowered capacity to upregulate activation markers (such as CD11b) and lower granule protein content per cell in mice implanted with chitosan microspheres could be a consequence of an increase in the number of immature neutrophils. We also determine neutrophils kinetics under a condition that induces inflammation but does not appear to cause emergency granulopoiesis (alginate microsphere implantation). Under such conditions, neutrophil maturation times in the bone marrow remain unchanged, and consequently the number of immature neutrophils in the bone marrow and blood are not different from mock controls. Notably, while our study suggests a systems-level mechanism of changes in neutrophil maturation time and phenotype, the specific molecular-level details remain to be determined.
Further, no previous report describes neutrophil kinetics at the site of inflammation. In this context, a recent study by Ballesteros et al.6 shows that neutrophil half-life in different tissues under steady-state conditions is similar (except in skin) to their half-life in the blood. It has also been suggested that inflammation may extend neutrophils’ lifespan at the inflammatory tissue site2,43,44. Our data show an increase in half-life (and consequently lifespan) of neutrophils at a sterile inflammatory site if the inflammation induces EG-like conditions.
To estimate maturation times and lifespans of neutrophils in various tissues, we have developed a new model to fit the data. Prior studies have fit an exponential decay function (peak to baseline) to similar experimental data6,11,12, but such modeling ignores the simultaneous ingress of labeled cells during that period resulting in over-estimation of half-lives. Additionally, deriving information on specific aspects of kinetics, such as maturation times in the bone marrow, is not possible using exponential decay based fitting methods. Hence, we modeled the process of granulopoiesis and neutrophil presence in tissues mechanistically, to extract kinetic parameters with an acceptable spread in distributions. Our model provided quantifiable values for most parameters, except for the peritoneal egress rate from mice implanted with alginate microspheres. The latter could be because of the large variability seen in the experimental data in this group.
One caveat to the data and the model presented here is that we assume that the number of reverse-migrating neutrophils45 in the bone marrow is negligible compared to the numbers present in the maturation compartment. Another shortcoming is that we do not explicitly include the marginated pool of neutrophils present in the lungs and liver. A logical next step to the current study would be to determine how both reverse migration and marginated pool of neutrophils are altered under inflammatory conditions.
Finally, results presented here showcase the possibility of using biomaterials as a tool to study immune cell dynamics46,47. Biomaterials induce differing grades of immune responses based on the chemical nature of the material used and on the physical (shape, size, morphology etc.) characteristics of the implant48,49. An example of this variation is demonstrated here with alginate and chitosan-based biomaterial implants. While the chemical composition of these materials is dissimilar and the purity of the base material was different, the exact reasons that these materials induce distinct immune responses remains unclear. Nevertheless, it is noteworthy that the implantation of biomaterials (specifically, chitosan) in the peritoneal cavity results in a dramatic change in neutrophil kinetics, which could have implications in our methodologies to test the compatibility of materials for in vivo use.
In conclusion, we show that in the presence of inflammation that induces EG-like conditions, neutrophil maturation time in the bone marrow and half-life in the blood reduces, and residence time at the inflammatory site increases when compared to non-inflammatory and low-grade inflammatory stimuli. The functional impact of such changes remains to be evaluated.
Supplementary Material
Acknowledgements
We thank Virta Wagde and Shruthi KS for assistance with animal work and cell culture. We acknowledge the support of the staff at the central animal facility, IISc. This work was supported by the DBT/Wellcome Trust India Alliance Fellowship [grant number IA/I/19/1/504265] awarded to SJ. This work was partly supported by a Science and Engineering Board, Department of Science and Technology, Govt. of India, grant SB/S2/RJN-135/2015 to SJ. This work was also particle supported by the R. I. Mazumdar young investigator fellowship at the Indian Institute of Science. AS is supported by a junior research fellowship from the Department of Biotechnology, Govt. of India
Footnotes
Conflict of Interest Statement
The authors declare no conflict of interest
Authorship
AA – designed the study, performed all the experiments, analyzed the data and wrote the manuscript. TJ – developed the mathematical model, carried out the simulations, and assisted with writing the manuscript. JVR – developed methodology for biomaterial particle formulation, assisted with experiments and writing the manuscript. SJ – conceptualized and designed the study, assisted with experiments and data analysis, and wrote the manuscript.
Code Availability
The code required to apply the mathematical model and perform the parameter estimation is available at https://github.com/Immunoengineeringlab/Neutrophil-kinetics_genetic-algorithm.
These may be used to fit the model to other datasets or obtain new parameter distributions for a different set of experiments.
References
- 1.Ley K, Hoffman HM, Kubes P, et al. Neutrophils: New insights and open questions. Sci Immunol. 2018;3:eaat4579. doi: 10.1126/sciimmunol.aat4579. [DOI] [PubMed] [Google Scholar]
- 2.Summers C, Rankin SM, Condliffe AM, et al. Neutrophil kinetics in health and disease. Trends Immunol. 2010;31:318–324. doi: 10.1016/j.it.2010.05.006. [DOI] [PMC free article] [PubMed] [Google Scholar]
- 3.Borregaard N. Neutrophils, from Marrow to Microbes. Immunity. 2010;33:657–670. doi: 10.1016/j.immuni.2010.11.011. [DOI] [PubMed] [Google Scholar]
- 4.Bardoel BW, Kenny EF, Sollberger G, et al. The Balancing Act of Neutrophils. Cell Host Microbe. 2014;15:526–536. doi: 10.1016/j.chom.2014.04.011. [DOI] [PubMed] [Google Scholar]
- 5.Strydom N, Rankin SM. Regulation of Circulating Neutrophil Numbers under Homeostasis and in Disease. J Innate Immun. 2013;5:304–314. doi: 10.1159/000350282. [DOI] [PMC free article] [PubMed] [Google Scholar]
- 6.Ballesteros I, Rubio-Ponce A, Genua M, et al. Co-option of Neutrophil Fates by Tissue Environments. Cell. 2020;183:1282–1297.:e18. doi: 10.1016/j.cell.2020.10.003. [DOI] [PubMed] [Google Scholar]
- 7.Price TH, Chatta GS, Dale DC. Effect of recombinant granulocyte colony-stimulating factor on neutrophil kinetics in normal young and elderly humans. Blood. 1996;88:335–340. [PubMed] [Google Scholar]
- 8.Lahoz-Beneytez J, Elemans M, Zhang Y, et al. Human neutrophil kinetics: modeling of stable isotope labeling data supports short blood neutrophil half-lives. Blood. 2016;127:3431–3438. doi: 10.1182/blood-2016-03-700336. [DOI] [PMC free article] [PubMed] [Google Scholar]
- 9.Ng LG, Ostuni R, Hidalgo A. Heterogeneity of neutrophils. Nat Rev Immunol. 2019;19:255–265. doi: 10.1038/s41577-019-0141-8. [DOI] [PubMed] [Google Scholar]
- 10.Pillay J, den Braber I, Vrisekoop N, et al. In vivo labeling with 2H2O reveals a human neutrophil lifespan of 5.4 days. Blood. 2010;116:625–627. doi: 10.1182/blood-2010-01-259028. [DOI] [PubMed] [Google Scholar]
- 11.Lord BI, Molineux G, Pojda Z, et al. Myeloid cell kinetics in mice treated with recombinant interleukin-3, granulocyte colony-stimulating factor (CSF), or granulocyte-macrophage CSF in vivo. Blood. 1991;77:2154–2159. [PubMed] [Google Scholar]
- 12.Basu S, Hodgson G, Katz M, et al. Evaluation of role of G-CSF in the production, survival, and release of neutrophils from bone marrow into circulation. Blood. 2002;100:854–861. doi: 10.1182/blood.v100.3.854. [DOI] [PubMed] [Google Scholar]
- 13.Hidalgo A, Chilvers ER, Summers C, et al. The Neutrophil Life Cycle. Trends Immunol. 2019;40:584–597. doi: 10.1016/j.it.2019.04.013. [DOI] [PubMed] [Google Scholar]
- 14.Jhunjhunwala S, Aresta-DaSilva S, Tang K, et al. Neutrophil Responses to Sterile Implant Materials. PLoS ONE. 2015;10:e0137550. doi: 10.1371/journal.pone.0137550. [DOI] [PMC free article] [PubMed] [Google Scholar]
- 15.Zeng C, Pan F, Jones LA, et al. Evaluation of 5-ethynyl-2′-deoxyuridine staining as a sensitive and reliable method for studying cell proliferation in the adult nervous system. Brain Res. 2010;1319:21–32. doi: 10.1016/j.brainres.2009.12.092. [DOI] [PMC free article] [PubMed] [Google Scholar]
- 16.Furze RC, Rankin SM. The role of the bone marrow in neutrophil clearance under homeostatic conditions in the mouse. FASEB J. 2008;22:3111–3119. doi: 10.1096/fj.08-109876. [DOI] [PMC free article] [PubMed] [Google Scholar]
- 17.Cheraghali AM, Kumar R, Knaus EE, et al. Pharmacokinetics and bioavailability of 5-ethyl-2’-deoxyuridine and its novel (5R,6R)-5-bromo-6-ethoxy-5,6-dihydro prodrugs in mice. Drug Metab Dispos. 1995;23:223–226. [PubMed] [Google Scholar]
- 18.Press WH, editor. Numerical recipes: the art of scientific computing. 3rd ed Cambridge University Press; Cambridge, UK ; New York: 2007. [Google Scholar]
- 19.Beaumont MA, Zhang W, Balding DJ. Approximate Bayesian Computation in Population Genetics. Genetics. 2002;162:2025–2035. doi: 10.1093/genetics/162.4.2025. [DOI] [PMC free article] [PubMed] [Google Scholar]
- 20.Chhajer H, Rizvi VA, Roy R. Life cycle process dependencies of positive-sense RNA viruses suggest strategies for inhibiting productive cellular infection. Microbiology. doi: 10.1101/2020.09.19.304576. Preprint, Epub ahead of print September 19, 2020. [DOI] [PMC free article] [PubMed] [Google Scholar]
- 21.Hentschke H. hhentschke/measures-of-effect-size-toolbox. [Accessed February 1, 2021]. https://github.com/hhentschke/measures-of-effect-size-toolbox. Available from: https://github.com/hhentschke/measures-of-effect-size-toolbox. Accessed February 1, 2021.
- 22.Ito Y, Kinashi H, Katsuno T, et al. Peritonitis-induced peritoneal injury models for research in peritoneal dialysis review of infectious and non-infectious models. Ren Replace Ther. 2017;3:16. [Google Scholar]
- 23.Rao TS, Currie JL, Shaffer AF, et al. In vivo characterization of zymosan-induced mouse peritoneal inflammation. J Pharmacol Exp Ther. 1994;269:917–925. [PubMed] [Google Scholar]
- 24.Miyazaki S, Ishikawa F, Fujikawa T, et al. Intraperitoneal Injection of Lipopolysaccharide Induces Dynamic Migration of Gr-1high Polymorphonuclear Neutrophils in the Murine Abdominal Cavity. Clin Diagn Lab Immunol. 2004;11:452–457. doi: 10.1128/CDLI.11.3.452-457.2004. [DOI] [PMC free article] [PubMed] [Google Scholar]
- 25.Jhunjhunwala S, Alvarez D, Aresta-DaSilva S, et al. Splenic progenitors aid in maintaining high neutrophil numbers at sites of sterile chronic inflammation. Journal of Leukocyte Biology. 2016;100:253–260. doi: 10.1189/jlb.1HI0615-248RR. [DOI] [PMC free article] [PubMed] [Google Scholar]
- 26.Hoemann CD, Fong D. Chitosan Based Biomaterials. Vol. 1. Elsevier; Immunological responses to chitosan for biomedical applications; pp. 45–79. [Google Scholar]
- 27.Manz MG, Boettcher S. Emergency granulopoiesis. Nat Rev Immunol. 2014;14:302–314. doi: 10.1038/nri3660. [DOI] [PubMed] [Google Scholar]
- 28.Evrard M, Kwok IWH, Chong SZ, et al. Developmental Analysis of Bone Marrow Neutrophils Reveals Populations Specialized in Expansion, Trafficking, and Effector Functions. Immunity. 2018;48:364–379.:e8. doi: 10.1016/j.immuni.2018.02.002. [DOI] [PubMed] [Google Scholar]
- 29.Fortunati E, Kazemier KM, Grutters JC, et al. Human neutrophils switch to an activated phenotype after homing to the lung irrespective of inflammatory disease. Clin Exp Immunol. 2009;155:559–566. doi: 10.1111/j.1365-2249.2008.03791.x. [DOI] [PMC free article] [PubMed] [Google Scholar]
- 30.Bellman R, Åström KJ. On structural identifiability. Math Biosci. 1970;7:329–339. [Google Scholar]
- 31.Villaverde AF. Observability and Structural Identifiability of Nonlinear Biological Systems. Complexity. 2019;2019:1–12. [Google Scholar]
- 32.Raue A, Kreutz C, Maiwald T, et al. Structural and practical identifiability analysis of partially observed dynamical models by exploiting the profile likelihood. Bioinformatics. 2009;25:1923–1929. doi: 10.1093/bioinformatics/btp358. [DOI] [PubMed] [Google Scholar]
- 33.Lehmann EL, Casella G. Theory of Point Estimation {Springer Texts in Statistics} Springer-Verlag New York Inc; Dordrecht: 2001. [Google Scholar]
- 34.McGraw KO, Wong SP. A common language effect size statistic. Psychol Bull. 1992;111:361–365. [Google Scholar]
- 35.Mayadas TN, Cullere X, Lowell CA. The Multifaceted Functions of Neutrophils. Annu Rev Pathol Mech Dis. 2014;9:181–218. doi: 10.1146/annurev-pathol-020712-164023. [DOI] [PMC free article] [PubMed] [Google Scholar]
- 36.Zhou GX, Liu ZJ. Potential roles of neutrophils in regulating intestinal mucosal inflammation of inflammatory bowel disease: Role of neutrophils in IBD. J Dig Dis. 2017;18:495–503. doi: 10.1111/1751-2980.12540. [DOI] [PubMed] [Google Scholar]
- 37.Wright HL, Moots RJ, Edwards SW. The multifactorial role of neutrophils in rheumatoid arthritis. Nat Rev Rheumatol. 2014;10:593–601. doi: 10.1038/nrrheum.2014.80. [DOI] [PubMed] [Google Scholar]
- 38.Yang S-C, Tsai Y-F, Pan Y-L, et al. Understanding the role of neutrophils in acute respiratory distress syndrome. Biomed J. 2020:S2319417020301499. doi: 10.1016/j.bj.2020.09.001. [DOI] [PMC free article] [PubMed] [Google Scholar]
- 39.Németh T, Sperandio M, Mócsai A. Neutrophils as emerging therapeutic targets. Nat Rev Drug Discov. 2020;19:253–275. doi: 10.1038/s41573-019-0054-z. [DOI] [PubMed] [Google Scholar]
- 40.Xie X, Shi Q, Wu P, et al. Single-cell transcriptome profiling reveals neutrophil heterogeneity in homeostasis and infection. Nature Immunology. 2020;21:1119–1133. doi: 10.1038/s41590-020-0736-z. [DOI] [PMC free article] [PubMed] [Google Scholar]
- 41.Boettcher S, Gerosa RC, Radpour R, et al. Endothelial cells translate pathogen signals into G-CSF–driven emergency granulopoiesis. Blood. 2014;124:1393–1403. doi: 10.1182/blood-2014-04-570762. [DOI] [PMC free article] [PubMed] [Google Scholar]
- 42.Rosinski M, Yarmush ML, Berthiaume F. Quantitative Dynamics of in Vivo Bone Marrow Neutrophil Production and Egress in Response to Injury and Infection. Ann Biomed Eng. 2004;32:1109–1120. doi: 10.1114/b:abme.0000036647.81372.ce. [DOI] [PubMed] [Google Scholar]
- 43.McCracken JM, Allen L-AH. Regulation of Human Neutrophil Apoptosis and Lifespan in Health and Disease. J Cell Death. 2014;7:15–23. doi: 10.4137/JCD.S11038. [DOI] [PMC free article] [PubMed] [Google Scholar]
- 44.Filep JG, Ariel A. Neutrophil heterogeneity and fate in inflamed tissues: implications for the resolution of inflammation. Am J Physiol Cell Physiol. 2020;319:C510–C532. doi: 10.1152/ajpcell.00181.2020. [DOI] [PMC free article] [PubMed] [Google Scholar]
- 45.Nourshargh S, Renshaw SA, Imhof BA. Reverse Migration of Neutrophils: Where, When, How, and Why? Trends Immunol. 2016;37:273–286. doi: 10.1016/j.it.2016.03.006. [DOI] [PubMed] [Google Scholar]
- 46.Jhunjhunwala S. Biomaterials for Engineering Immune Responses. J Indian Inst Sci. 2018;98:49–68. [Google Scholar]
- 47.Mariani E, Lisignoli G, Borzì RM, et al. Biomaterials: Foreign Bodies or Tuners for the Immune Response? Int J Mol Sci. 20 doi: 10.3390/ijms20030636. Epub ahead of print February 1, 2019. [DOI] [PMC free article] [PubMed] [Google Scholar]
- 48.Sadtler K, Singh A, Wolf MT, et al. Design, clinical translation and immunological response of biomaterials in regenerative medicine. Nat Rev Mater. 2016;1:16040 [Google Scholar]
- 49.Oakes RS, Froimchuk E, Jewell CM. Engineering Biomaterials to Direct Innate Immunity. Adv Therap. 2019;2:1800157. doi: 10.1002/adtp.201800157. [DOI] [PMC free article] [PubMed] [Google Scholar]
Associated Data
This section collects any data citations, data availability statements, or supplementary materials included in this article.
Supplementary Materials
Data Availability Statement
The code required to apply the mathematical model and perform the parameter estimation is available at https://github.com/Immunoengineeringlab/Neutrophil-kinetics_genetic-algorithm.
These may be used to fit the model to other datasets or obtain new parameter distributions for a different set of experiments.


