Abstract
Background
Gait impairment has a major impact on quality of life in patients with Parkinson’s disease (PD). It is believed that basal ganglia oscillatory activity at β frequencies (15–30 Hz) may contribute to gait impairment, but the precise dynamics of this oscillatory activity during gait remain unclear. Additionally, auditory cues are known to lead to improvements in gait kinematics in PD. If the neurophysiological mechanisms of this cueing effect were better understood they could be leveraged to treat gait impairments using adaptive Deep Brain Stimulation (aDBS) technologies.
Objective
We aimed to characterize the dynamics of subthalamic nucleus (STN) oscillatory activity during stepping movements in PD and to establish the neurophysiological mechanisms by which auditory cues modulate gait.
Methods
We studied STN local field potentials (LFPs) in eight PD patients while they performed stepping movements. Hidden Markov Models (HMMs) were used to discover transient states of spectral activity that occurred during stepping with and without auditory cues.
Results
The occurrence of low and high β bursts was suppressed during and after auditory cues. This manifested as a decrease in their fractional occupancy and state lifetimes. Interestingly, α transients showed the opposite effect, with fractional occupancy and state lifetimes increasing during and after auditory cues.
Conclusions
We show that STN oscillatory activity in the α and β frequency bands are differentially modulated by gait-promoting oscillatory cues. These findings suggest that the enhancement of α rhythms may be an approach for ameliorating gait impairments in PD.
Keywords: Brain-states decoding, Auditory cues, Parkinson’s disease, Masking empirical mode decomposition, Hidden Markov model
1. Introduction
Gait impairment is a major cause of disability in Parkinson’s disease (PD) [1]. Gait disturbances confer an increased risk of falls, in turn leading to morbidity related to injury and a loss of both independence and quality of life [2,3]. Traditional therapeutic approaches for PD, including dopaminergic drug therapy and deep brain stimulation (DBS) of basal ganglia structures (e.g., subthalamic nucleus (STN) or globus pallidus), are often insufficiently effective for treating gait symptoms and may even lead to a worsening of gait [ [4–6]]. There is consequently a need to develop a better understanding of the neurophysiology of gait impairments, so that improved therapies can be developed.
Recent studies of patients undergoing DBS surgery have revealed how synchronized oscillatory activity across the cortico-basal ganglia circuit can contribute to gait kinematics and motoric impairments in PD [ [7–11]]. For example, it has been shown that excessive STN activity at beta frequencies (15–30 Hz), which is traditionally thought to be related to both bradykinesia and rigidity, can also precede episodes of freezing of gait (FOG). Consistent with this observation is the finding that both motor cortical and STN beta activity display gait phase-locked modulations during walking [9]. Interestingly, cortico-STN synchronisation at lower frequencies within the alpha band (8–12 Hz) is also observed during gait execution, with FOG episodes being reportedly accompanied by transient decoupling of alpha synchronisation [11]. These findings suggest opposing roles for alpha and beta synchronisation in gait control.
One way of improving gait coordination in PD is to present rhythmic visual or auditory cues during stepping [ [12–15]]. Auditory cueing may enhance both walking speed and stride length, in addition to amelio-rating FOG episodes [ [14–23]]. Although we have previously shown that cueing to the timing of a heel strike can modulate STN beta activity, the short timescale dynamics of cue-related STN activity modulations remain unclear [9]. Establishing these dynamics would be important for identifying biomarkers of both normal and abnormal gait in PD. Specifically, the discovery of oscillatory signatures that reliably reflect clinical state is of great interest, given that these signals could be selectively modulated (either amplified or suppressed) using adaptive DBS (aDBS) regimes [24,25].
Traditional approaches for identifying spectral activations at short timescales (known as bursts) rely on the prior specification of an amplitude threshold, which defines the onset and offset of a burst [[26–28]]. This method becomes challenging when attempting to define bursts over multiple participants and frequency bands [29,30]. In this paper, we overcome these limitations by using an unsupervised machine learning approach - Hidden Markov Modelling (HMM) [31] - to detect bursting dynamics within the STN during stepping in PD patients. We hypothesized that: (1) STN bursting activity within the alpha and beta bands would be differentially modulated during stepping, in keeping with the notion that activity within these frequency bands has opposing effects on gait, and (2) that auditory cues enhance gait-related modulation of activity within these two frequency bands.
2. Materials and methods
2.1. Patients and experiments
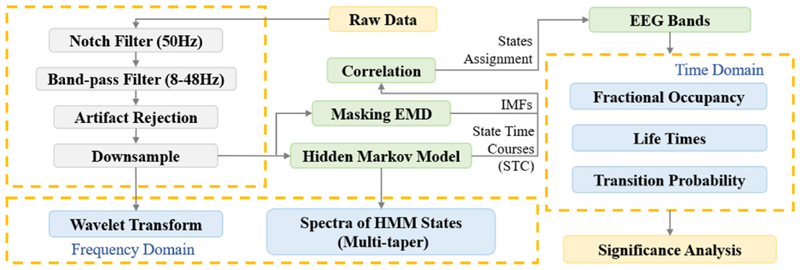
Eight PD patients with bilateral STN DBS electrodes were included (clinical details in Table 1). These data have been previously used to study the effects of rhythmic auditory cues on STN β band modulation during periodic alternating stepping movements in the seated position, and behavioral analyses (step-to-cue difference and step-to-step duration) have been performed to measure the synchronisation of stepping to auditory cues [9]. In this study, we investigate the short timescale spectral dynamics of the STN LFP during visually cued alternating stepping movements: 1) prior to the delivery of auditory cues, 2) during the occurrence of auditory cues, and 3) after the occurrence of auditory cues. We refer to these three experimental conditions as the pre-sound, on-sound and post-sound conditions. The inclusion of a post-sound condition allowed us to explore the carry-over effects of the auditory cueing rhythm. The overall algorithm flow is shown in Fig. 1.
Table 1. Clinical characteristics of study participants.
| SUB ID | Age | Gender | Main Symptom | Disease Duration (yrs) |
UPDRS-III OFF/ON Levodopa | Levodopa equivalent dose (mg/d) | DBS Lead |
|---|---|---|---|---|---|---|---|
| 1 | 59 | M | tremor, bradykinesia, dyskinesia | 7 | 53/18 | 1195 | Boston Scientific DB-2202 |
| 2 | 64 | F | rigidity, tremor, FOG | 16 | 66/36 | 1628 | Boston Scientific DB-2202 |
| 3 | 59 | M | fluctuations, tremor | 14 | 36/8 | 1062 | Medtronic3389 |
| 4 | 56 | M | fluctuations, dyskinesia | 7 | 42/26 | 1365 | Medtronic3389 |
| 5 | 62 | M | tremor, rigidity, dyskinesia, mild FOG | 12 | 59/15 | 1000 | Medtronic3389 |
| 6 | 71 | M | tremor, FOG | 15 | 36/18 | 785 | Boston Scientific DB-2202 |
| 7 | 61 | M | rigidity | 9 | 33/11 | 1293 | Medtronic3389 |
| 8 | 59 | M | tremor, mild FOG |
10 | 28/8 | 1010 | Boston Scientific DB-2202 |
M, male; F, female; FOG, freezing of gait.
Fig. 1. Our proposed algorithm for detecting transient oscillatory states in STN activity during stepping.
Patients had an average age of 61.4 ± 4.6 yrs (range 56–71 yrs) and an average disease duration of 11.3 ± 3.5 yrs (range 7–16 years). The mean Unified Parkinson’s Disease Rating Scale (UPDRS) scores (part III) were 44.1 ± 13.6 (range 28–66) and 17.5 ± 9.6 (range 8–36) in the off-levodopa and on-levodopa states. All experimental procedures were approved by the local ethics committee with informed written consent being sought from all participants. LFP recordings were performed in the on-levodopa state, 3–7 days after electrode implantation surgery.
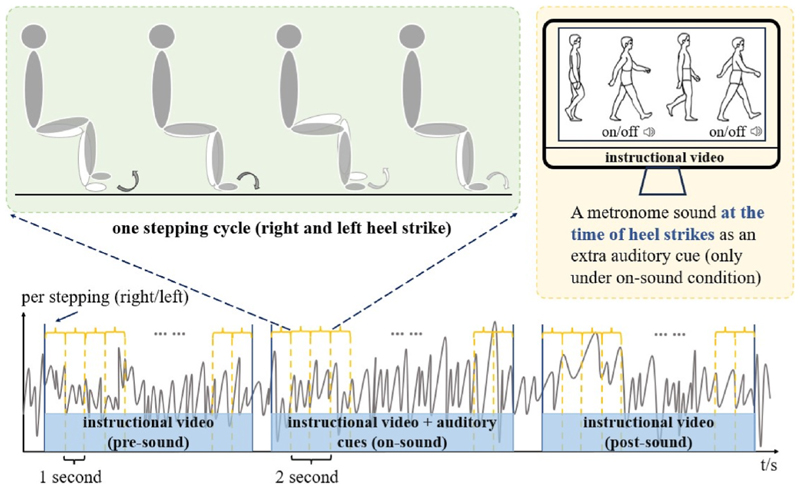
During recordings, patients sat in a chair with their arms resting on their laps. Two flat-plate pressure sensors were placed on the floor to record right- and left-foot stepping movements. An instructional walking video that looped after each stepping cycle (alternate left and right foot heel strike, separated by a delay of 1 s) was displayed on a laptop in front of the patient. Patients were instructed to synchronize the timing of their footsteps to match the timing of the footsteps of the video character. A metronome sound was provided at the time of each heel strike displayed in the video besides visual cues. This provided additional information. Patients performed three different stepping conditions in a fixed order, each with a duration of 84 s. In the pre-sound and post-sound conditions, stepping was performed only with the visual cue, whilst in the on-sound condition both auditory and visual cues were provided, thereby allowing us to investigate the carry-over effects of exposure to the auditory cue. Fig. 2 depicts the experimental paradigm with the three different stepping conditions. Based on the timing of the actual heel strikes and the timing of the heel strikes in the instructional video, we calculated the step-cue interval (the time difference between each real heel strike and the nearest corresponding heel strike in the video) and the step-step interval (time interval between the present heel strike and the next (contralateral) heel strike) as measures of gait performance. These measures were then compared between the three sound conditions.
Fig. 2. Illustration of the experimental task with the three different stepping conditions (pre-sound, on-sound, and post-sound).
An instructional video is displayed in all three conditions, whilst an auditory cue is delivered only in the on-sound condition.
A TMSi Porti amplifier (TMS International) with a common average reference was used to record STN-LFPs in a monopolar configuration from each of four electrode contacts (0, 1, 2, and 3; 0 being the most caudal), with a sampling rate of 2048 Hz. The data were re-referenced offline to obtain more spatially focal bipolar signals by subtracting data from neighboring electrode contacts. Consequently, the three resulting bipolar signals were derived from contacts 0–1, 1–2, and 2–3. Before further analysis, the reconstructed bipolar signals were downsampled to a frequency of 1000 Hz.
Localisation of the electrodes with respect to the STN was confirmed by inspection of the post-operative CT, which was fused to the pre-operative MRI scan [9]. For all electrodes, at least one of the selected contacts was visually confirmed to lie within the motor part of the STN [9].
2.2. Data processing and time-frequency analysis
All data processing and analysis were performed in MATLAB (v2019a, MathWorks, Natick, MA). For each subject, the single bipolar STN LFP channel with the greatest mean power over the uniform distributed 8–35 Hz frequency range (including alpha and beta bands) was selected for further analysis. Raw LFPs were notch filtered at 50 Hz to suppress power line noise, and then high pass filtered at 8 Hz, using a sixth-order Butterworth filter. Data fragments with poor filtering effects were discarded by visual inspection (i.e., strong instrument noise). Of note, data containing steps that failed to synchronize to the visual cues (i.e., a step-cue interval longer than 1 s and a step-step interval longer than 2 s) were rejected. Across subjects, the mean number of steps rejected due to poor synchronisation was 4.2 % (see Supplementary Table 1 for further details). This procedure ensured that data segments that were contaminated by brief FOG episodes or attentional lapses were excluded from analysis. Next, signals were lowpass filtered at 48 Hz (using a sixth-order Butterworth filter), before being downsampled to a frequency of 100 Hz.
To observe how the frequency dynamics of a signal vary over time, the spectrogram of the preprocessed LFP was constructed by continuous Morlet wavelet transform with the wavelet cycle set to span six cycles [32].
2.3. Time-delay embedded hidden Markov model
The Hidden Markov model (HMM) is an unsupervised machine learning approach for detecting transient states within the data such as spectral events or bursts [27, 29, [33–35]]. The HMM assumes that data are generated from a hidden sequence of a finite number of states. At each time point, only one state is active, and the data observed in each state are drawn from a probabilistic observation model, i.e., a multi-variate Gaussian.
We used a specific variant of the HMM known as the time-delay embedded hidden Markov model (TDE-HMM). In this approach, an input signal is shifted by N different time lags on either side of the current time point, giving 2N + 1 channels for HMM inference [27,35]. This allows the model to infer states as periods of distinct autocovariance representing transient episodes of distinct spectral content [29]. In contrast to traditional threshold-based approaches, HMMs allow for the automatic detection of bursting activity across multiple frequency bands [26,27].
TDE-HMM inference requires the number of states and time lags under consideration to be predefined. The number of time lags determines the window duration such that N lags means that the window includes N data points on either side of the timepoint under analysis. Short windows allow for better temporal resolution at the expense of frequency resolution. Here, we performed inference for 12 states and 3-time lags (further details regarding parameter selection are provided in the Supplementary Material). The TDE-HMM analysis was performed using the HMM-MAR MATLAB toolbox (https://github.com/OHBA-analysis/HMM-MAR).
2.4. Masking empirical mode decomposition
Empirical mode decomposition (EMD) decomposes signals into a finite number of intrinsic mode functions (IMFs), wherein each IMF contains local characteristic information of the original signal at different time scales [36]. The input signal can therefore be expressed as the sum of multiple IMFs and a residual term:
| (1) |
where I(t) is the input signal, IMFm (t) denotes the mth IMF component, and Res(t) stands for the Residual term.
Developments in EMD approaches include the masking EMD (MEMD) algorithm, which can overcome issues of mode mixing and mode splitting [ [37–40]]. MEMD involves the application of a continuous sinusoidal masking signal that is closely related in frequency to a physiological band of interest. The masking signal can be subsequently removed from an associated IMF, allowing that IMF to capture dynamics within a frequency band of interest [41,42]. In this study, the frequency bands of interest were the alpha (α, 8–12 Hz), low beta (Lβ, 13–21 Hz), high beta (Hβ, 22–35 Hz), and gamma (γ ~ 40Hz) bands.
2.5. Assigning HMM states to IMF frequency bands
We used IMFs corresponding to the four frequency bands of interest, to select states identified from the HMM for further analysis. We correlated each state time course identified from the HMM with Hilbert envelopes of the α, low-β, high-β, and γ frequency activities obtained by MEMD (i.e., IMFs). HMM states with exclusively negative correlation coefficients were assigned to background activity (BG). States with positive correlations were assigned to the frequency band with which they were maximally correlated. This procedure meant that more than one HMM state could be assigned to a single frequency band [27] and allowed us to ensure that our states captured information about transient spectral activity within physiological bands of interest.
2.6. Feature extraction of HMM states
The above procedure was applied for the selected channel of all subjects. Spectral characteristics of identified states were determined using the multitaper method [43], with a taper smoothing frequency of 3.125 Hz (the time-half-bandwidth product was 4 and the total number of tapers used was 7).
Time domain features [44] were also extracted from the model for comparison across the three sound conditions. These included fractional occupancy (FO), which was defined as the proportion of time that each HMM state occupied over the entire time sequence. The FO of a specific state k is given by:
| (2) |
where T is the total number of time points, and st is the number of time points at which state k was active. State lifetime (LT) was defined as the average duration of each state before transition to another state. For a specific state k this is defined as:
| (5) |
where occ(k) represents the number of occurrences of state k.
The transition probability (TP) from each state to every other state (including itself) was also obtained from the TDE-HMM model.
2.7. Burst recognition by amplitude thresholding
We compared our automated TDE-HMM based pipeline for detecting bursts, to a manual pipeline based on threshold crossings of the amplitude envelope of band-filtered signals [28]. The 75th percentile [28] of the Hilbert envelope of each band-filtered signal (corresponding to the α, Lβ, Hβ, and γ bands) was used as a threshold to define the occurrence of bursting activity. Importantly, a common threshold was used across experimental conditions separately for each band. This was calculated by averaging the thresholds across conditions. Such threshold-based approaches allow for states to be co-active (not mutually exclusive), but a major drawback is the assumption of a fixed FO (of 25 %) across conditions for each band. State LTs were estimated as before for each band, for each of the three different experimental conditions. For the threshold-based approach, there is no generative model with which to infer a transition probability matrix. The results of this approach are discussed in the Supplementary Material (see Supplementary Fig. 2).
2.8. Statistical analysis
For comparing state features across frequency bands and sound conditions, we used the Wilcoxon signed-rank test, (α = 0.05). Multiple comparison correction was performed using the Benjamini-Hochberg false discovery rate (FDR) method on the comparisons between the three sound conditions in each frequency band and the 25 comparisons of the transition probabilities. All results are presented in box-and-whisker plots with a box from the first quartile to the third quartile and a horizontal line in the middle representing the median. The top and bottom whiskers link the maximum and minimum values.
3. Results
3.1. Comparing gait performance between experimental conditions
The mean and variance across patients of the step-cue interval is shown in Fig. 3. The mean step-cue interval was significantly lower in the post-sound condition than in the pre-sound condition (p = 0.0469). For the comparison between the on-sound condition and the pre-sound condition, there was a trend towards a significant effect (p = 0.0586). Additionally, the variance of the step-cue interval was reduced in the on-sound and in the post-sound conditions compared to the pre-sound condition (on vs. pre: p = 0.0234; post vs. pre: p = 0.0234). For the step-step interval, the only significant effect was a reduction in the mean in the post-sound condition, compared to the on-sound condition (p = 0.0469). Taken together, these results suggest that auditory cues result in sustained improvements in gait performance in PD.
Fig. 3. Comparisons of gait performance (step-cue intervals and step-step intervals) between the three sound conditions.
Box-and-whisker plots of the (a) mean step-cue interval, (b) step-cue interval variance, (c) mean step-step interval, and (d) step-step interval variance, for 8 subjects. *p < 0.05, **p < 0.01, ***p < 0.001.
3.2. Decoding HMM states
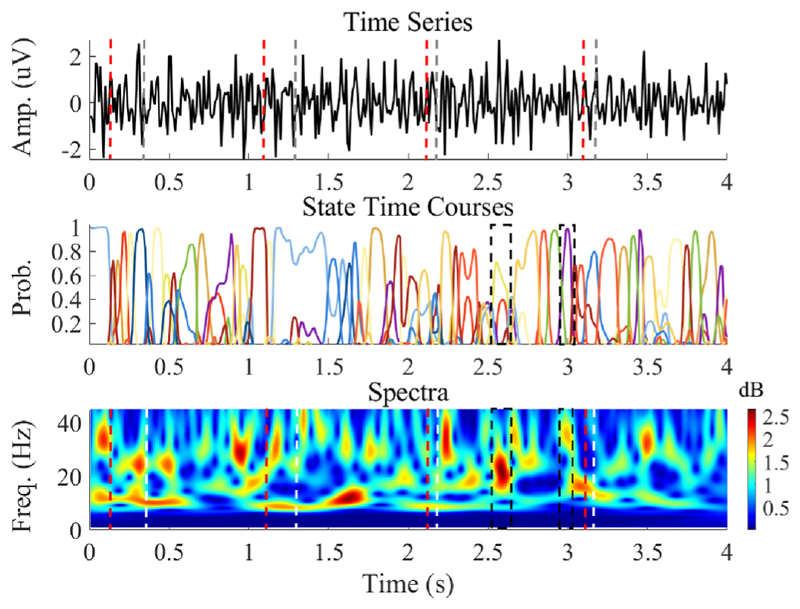
We observed that the TDE-HMM effectively identifies transient spectral states in the STN LFP. Fig. 4 shows the results of state estimation for a 4-s long LFP in a single participant (Subject 4) during the experimental paradigm. The second panel in this figure displays the time course for each different state. For example, between 2.52 and 2.64 s, there was a spectral peak at ~20 Hz which corresponded to a single state shown in the yellow line (black botted box). Between 2.95 and 3.04 s, there was a spectral peak at ~36 Hz which corresponded to a single state shown in the purple line (black dotted box).
Fig. 4. A 4-s long preprocessed LFP recording (Subject 4) which contains 4 steps.
The top panel is the preprocessed LFP. The red dashed lines represent auditory cues, whilst the grey lines correspond to the stepping movements. The middle panel displays the probability time courses for the HMM states. The bottom panel shows the corresponding time-frequency spectra calculated using the wavelet transform. In this, the red dashed line represents auditory cues, whilst the white dashed line represents stepping movements.
3.3. Decomposition performance using masking EMD
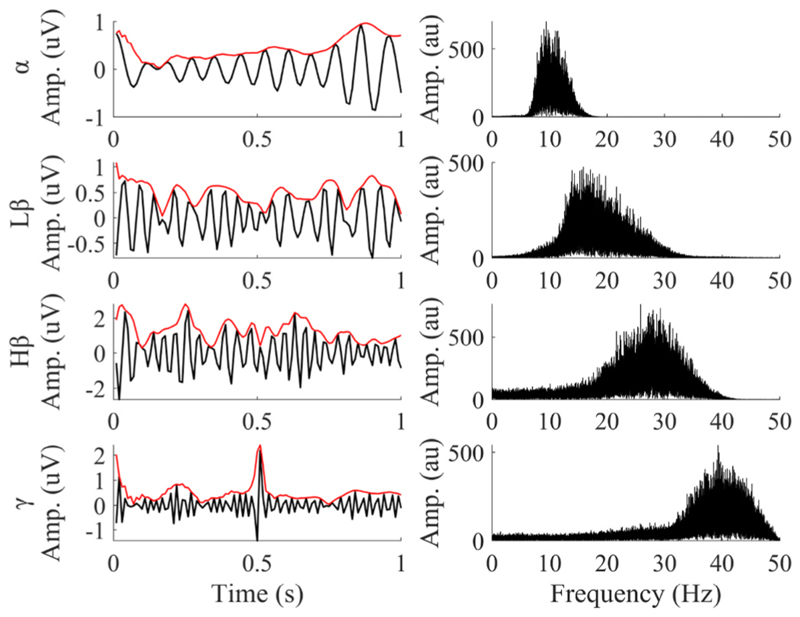
Masking EMD was used to extract IMFs corresponding to the classical LFP frequency bands. Illustrative results of this decomposition for Subject 4 are shown in Fig. 5. The left-hand side of the figure shows IMFs corresponding to the canonical LFP bands (α, low-β, high-β, and γ), whilst the right-hand side displays the corresponding frequency spectra of the IMFs. The four IMFs shown have spectral power peaks at about 10 Hz, 18 Hz, 29 Hz, and 40 Hz, respectively.
Fig. 5. Time series and spectral power of four IMFs extracted from the STN LFP using MEMD in Subject 4.
The extracted IMFs have frequency spectra corresponding to four canonical LFP frequency bands. The solid red line is the Hilbert envelopes of IMFs.
3.4. Assigning HMM states to canonical frequency bands
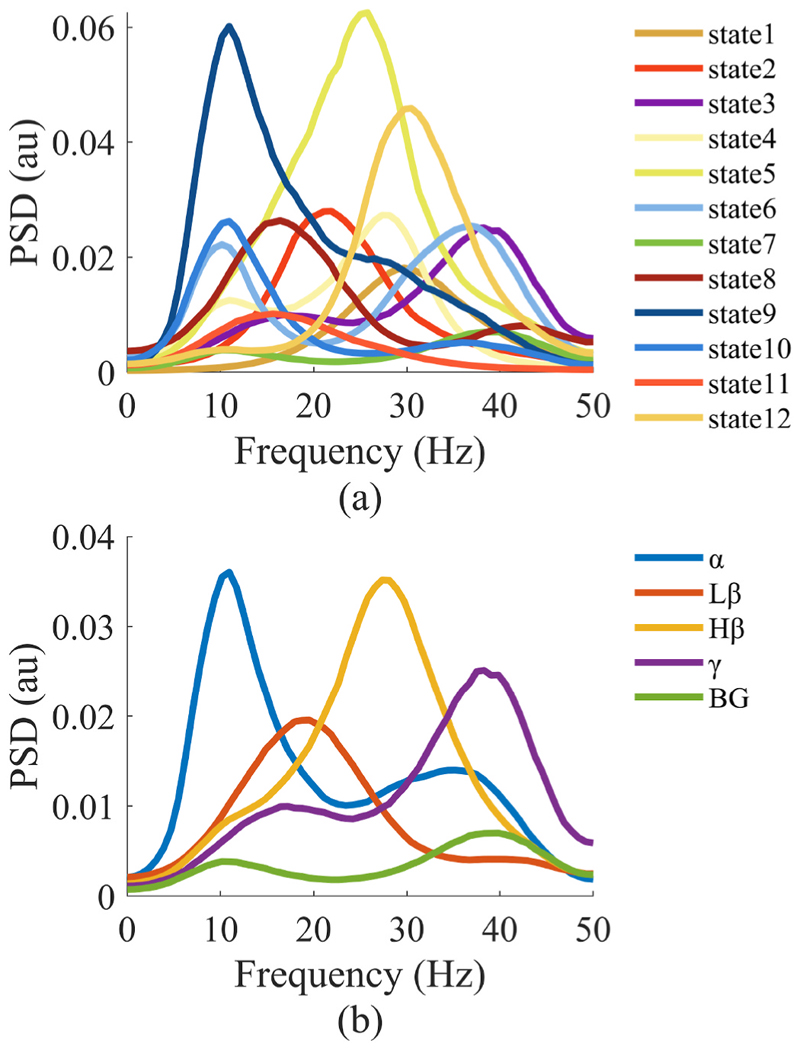
By assigning HMM states to the canonical frequency bands, we were able to compare states across subjects [35]. Fig. 6(a) shows 12 states that were decoded from HMM analysis in a single patient (Subject 4) during the stepping task. Following the correlation of the state time courses with IMFs, we were able to narrow down the selected states to those that corresponded most to each canonical frequency band. The spectra of states corresponding to each canonical frequency band are shown in Fig. 6(b).
Fig. 6. Assigning HMM states to canonical LFP frequency bands.
Exemplar data are shown from Subject 4. (a) Spectra of HMM states decoded from the preprocessed LFP are shown. (b) Spectra of the HMM states corresponding to each of the five canonical frequency bands are shown. In (a), the states classified to the same frequency band are averaged to obtain (b) (Lβ: low β, Hβ: high β, BG: background activities).
3.5. Temporal features dynamics of LFP in different bands during stepping
To probe the influence of different sound conditions on the temporal dynamics of frequency band-specific HMM states, we compared two different time domain features (fractional occupancy and state lifetimes).
Fig. 7 reveals that auditory cues resulted in differential effects on FO within the α and Lβ bands. In the α band, FO increased in the on-sound and post-sound conditions compared to the pre-sound condition (on vs Similarly, Fig. 10 shows the comparison of transition probability pre: p = 0.0117; post vs pre: p = 0.0117). In the Lβ band, FO was significantly reduced in the on-sound condition compared to the pre-sound condition (p = 0.0234).
Fig. 7.
Comparisons of fractional occupancy between the three sound conditions (pre, on, and post sound cues) for the different frequency bands (α, Lβ, Hβ, γ, BG from left to right panels). Each dot represents one subject. *p < 0.05, **p < 0.01, ***p < 0.001.
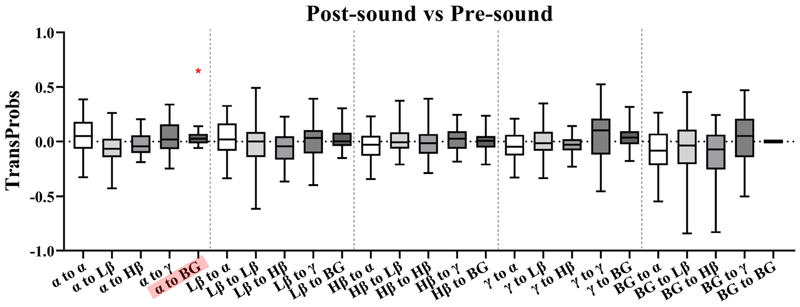
Fig. 10. Pairwise band comparisons of transition probability differences between the post-sound and pre-sound conditions.
*p < 0.05, **p < 0.01, ***p < 0.001.
Effects on state lifetimes are shown in Fig. 8. For the α band, state lifetimes were significantly higher in the on-sound condition compared to the pre-sound condition (on vs pre: p = 0.0234).
Fig. 8.
Comparisons of state lifetimes between the three sound conditions (pre, on, and post sound cues) for the different frequency bands (α, Lβ, Hβ, γ, BG from left to right panels). Each dot represents one subject. *p < 0.05, **p < 0.01, ***p < 0.001.
Lβ band state lifetimes were shorter on-sound and post-sound compared to pre-sound (on vs pre: p = 0.0352, post vs pre: p = 0.0234).
Similar effects were also observed for the Hβ band (on vs pre: p = 0.0234, post vs pre: p = 0.0234). No significant differences were observed in other bands.
3.6. The effect of auditory cues on transition probabilities
Next, we examined how transitions between states were influenced during auditory cueing. We explored differences in the transition probabilities between states for all pairwise comparisons of the three different auditory conditions.
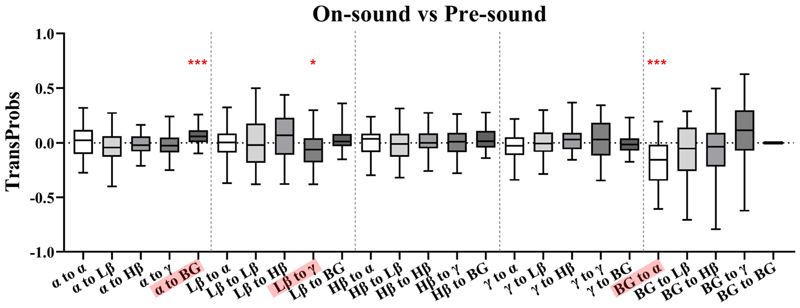
Fig. 9 shows the comparison of transition probability differences between the on-sound and pre-sound conditions for different frequency bands. In the on-sound condition, there was a significant increase in the probability of transitioning from the α band to BG (p < 0.001). Additionally, decreased transition probabilities were found for the following state transitions: 1) Lβ to γ (p = 0.0122), 2) BG to α (p < 0.001).
Fig. 9. Pairwise band comparisons of transition probability differences between the on-sound and pre-sound conditions.
*p < 0.05, **p < 0.01, ***p < 0.001.
Similarly, Fig. 10 shows the comparison of transition probability differences between the post-sound and pre-sound conditions. Only a significant increase for the α to BG transition (α to BG: p = 0.0173) was observed.
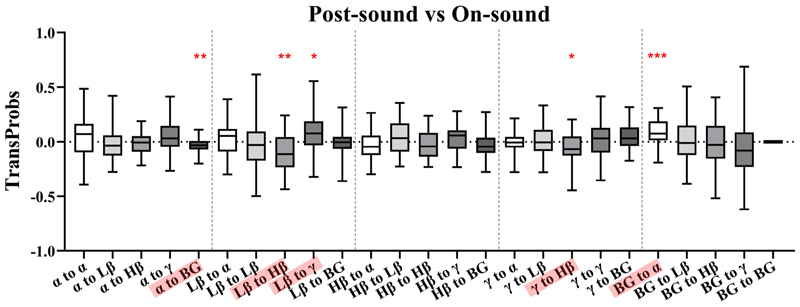
Fig. 11 compares transition probabilities for the post-sound and on-sound conditions. For the α band, there was a significant decrease in the probability of transitioning to the BG (p = 0.0076). For Lβ band, transitions to Hβ were less likely (p = 0.0038), whilst transitions to γ were more likely (p = 0.0310). Additionally, γ band transitions to Hβ (p = 0.0155) were less likely. Finally, an increase in the probability of transitioning from the BG state to α (p < 0.001) was observed.
Fig. 11. Pairwise band comparisons of transition probability differences between the post-sound and on-sound conditions.
*p < 0.05, **p < 0.01, ***p < 0.001.
4. Discussion
In this study, we develop a novel decoding approach - based on the combination of MEMD and TDE-HMM - for discovering how auditory cues modulate STN activity at short timescales during stepping in PD patients. We show that auditory cues can influence the properties of states corresponding to activity within multiple frequency bands. Our findings shed light on the mechanisms through which auditory cues improve gait and suggest biomarkers for gait improvement which could be targeted using aDBS strategies. We will first discuss some technical nuances of our approach, before focusing on physiological insights.
4.1. Performance of MEMD-based TDE-HMM in decoding STN oscillatory states
Compared to traditional manual thresholding-based approaches for burst detection [28], the combination of MEMD and TDE-HMM allows for the automated identification of bursts across multiple frequency bands, without imposing fractional occupancy constraints (see Supplementary Materials for further discussion).
MEMD is an improved method for non-stationary time series that is based on standard EMD. In addition to minimizing mode mixing [38] and mode splitting [37], MEMD enables the resultant IMFs to more accurately reflect activity within classical EEG bands of interest (i.e., α band, β band, etc. See Fig. 5).
By correlating HMM-identified state time courses with the Hilbert envelope of each IMF, we were able to reliably identify states that captured activity within physiological bands of interest across subjects.
One important limitation of the HMM however is the assumption that different states are mutually exclusive [27,45]. The model selected the state with the highest occurrence probability from multiple states inferred at each time point to form STCs. Brain dynamics are complex, and it may be an oversimplification to assume that multiple states cannot be simultaneously active.
4.2. Modulatory effect of auditory cues on gait and STN oscillatory states
In keeping with previous studies, we observed that auditory cues improved gait performance in PD patients [14,15]. This was evidenced by a cue-related reduction in both the mean and the variance of the step-cue interval (see Fig. 3). Importantly, cueing effects were persistent and continued into the post-sound period, suggesting sustained modulations of neural activity.
We next explored auditory cue-related modulations in the short timescale spectral dynamics of stepping-related STN activity. Our analyses focused on four canonical frequency bands, α, Lβ, Hβ, and γ. We observed that the FO and LTs of β states, particularly Lβ states, were reduced during stepping with auditory cues. Interestingly, auditory cues had a prolonged effect on Lβ and Hβ state LTs, such that they were reduced after the cueing had stopped in the post-sound condition (Figs. 7 (b) and Fig. 8(b)).
Our findings suggest that auditory cueing may promote gait partly through the suppression of exaggerated STN β band activity. This is perhaps not surprising given that exaggerated oscillatory activity within this frequency range has been closely associated with motoric impairments including gait freezing [10, 26, [46–49]].
In contrast to the β band, α band states displayed enhanced FO and LTs during and after auditory cues. Although the precise role of alpha band activity is unclear, recent reports suggest that synchronizing activity within this frequency range may produce prokinetic effects [50]. Another equally plausible possibility is that α band synchronisation may support attentional and executive processing involved in gait and motor preparation [51]. Although γ band activities are widely believed to have prokinetic effects [52], we observed no auditory cue-related changes in their FO and state LTs.
Finally, we observed that auditory cues also modulated the transition probabilities of individual states, including the α, Lβ, γ, and background activity bands. The reduced transition probability from background activity to α states indicates that alpha states were more sustained, or potentially stable as also shown in the lifetime analysis. However, we also observed an increased probability of alpha to background state transitions, which was most pronounced when the sound was present and persisted – although weaker – during post-sound stepping. An increased likelihood of transitioning to BG activity should go hand in hand with a reduced likelihood of transitioning from alpha to beta and gamma states - however, these changes were only moderate and not significant.
Interestingly, the probability of state transitions from low beta to gamma in the on-sound condition was reduced, although this was accompanied by a non-significant effect of reduced transitions from the alpha and BG states to low beta activity. These unbalanced and opposing effects may explain the relative reduction in cue-related low beta FO and state LTs.
Previous analysis of the same data has shown that high beta activity was particularly strongly modulated by the left-right alternating stepping cycle, and that bursts around 30 Hz were more likely during the contralateral stance period, which was further enhanced with auditory cueing [9]. Splitting the high beta band further into 20–25 and 26–30 Hz might have resulted in more pronounced changes in the higher Hβ band. However, correcting for an even larger number of multiple comparisons would have reduced our chance of identifying small effects.
The observed changes in state transition probabilities may be the mechanism that underlies the observed changes in FO and state LTs for the α and β bands. Future studies with larger sample sizes could enable more detailed examinations of this.
4.3. Limitations
Several limitations should be highlighted for interpreting the results of this study. Firstly, LFP recordings could potentially have been affected by microlesions caused by the electrode insertion procedure. Secondly, LFPs were recorded while patients performed stepping movements whilst seated. Reassuringly, however, previous analysis of a subset of data from the same subjects included in this study has revealed very similar STN spectral modulations during stepping while standing, and free walking [9]. This serves to highlight the potential applicability of our findings to cued free walking.
5. Conclusions
We have combined MEMD and TDE-HMM to decode dynamic brain states during cued stepping in PD patients. Our results indicate that auditory cues, which are known to improve gait performance, exert differential effects on STN LFP activity within the α and β bands. Specifically, auditory cues led to the enhancement of α band activity, whilst reducing the probability of β synchronisation. Our findings reveal a potential neurophysiological mechanism for the effects of auditory cues and could help inform therapeutic aDBS strategies that could be tailored to intermittently enhance α band activity while suppressing β.
Supplementary Material
Supplementary data to this article can be found online at https://doi.org/10.1016/j.brs.2024.04.006.
Acknowledgments
This work is supported by the National Natural Science Foundation of China (62001026, 62171028), the Beijing Natural Science Foundation (L232139), the Open Project of Key Laboratory of Medical Electronics and Digital Health of Zhejiang Province (MEDH202204, MEDC202303), and the High-level Fellow Research Fund Program (3050012222022). H.T. is supported by the Medical Research Council UK (MC_UU_00003/2, MR/V00655X/1, MR/P012272/1), the National Institute for Health Research (NIHR) Oxford Biomedical Research Centre (BRC) and the Rosetrees Trust, UK. A.O. is supported by an MRC Clinician Scientist Fellowship (MR/W024810/1).
Footnotes
CRediT authorship contribution statement
Chien-Hung Yeh: Writing – review & editing, Software, Methodology, Funding acquisition, Conceptualization. Yifan Xu: Writing – original draft, Visualization, Software, Formal analysis, Data curation. Wenbin Shi: Writing – review & editing, Methodology, Funding acquisition, Conceptualization. James J. Fitzgerald: Writing – review & editing, Resources, Data curation. Alexander L. Green: Writing – review & editing, Resources, Data curation. Petra Fischer: Writing – review & editing, Resources, Formal analysis, Data curation. Huiling Tan: Writing – review & editing, Resources, Funding acquisition, Formal analysis, Data curation. Ashwini Oswal: Writing – review & editing, Funding acquisition, Formal analysis.
Declaration of competing interest
The authors declare that they have no known competing financial interests or personal relationships that could have appeared to influence the work reported in this paper.
Data availability
The datasets used for the current study are available from the corresponding author on reasonable request and will be deposited on the MRC Brain Network Dynamics Unit data-sharing platform (https://data.mrc.ox.ac.uk/data-set/).
References
- [1].Mirelman A, et al. Gait impairments in Parkinson’s disease. Lancet Neurol. 2019;18:697–708. doi: 10.1016/S1474-4422(19)30044-4. [DOI] [PubMed] [Google Scholar]
- [2].Fasano A, Aquino CC, Krauss JK, Honey CR, Bloem BR. Axial disability and deep brain stimulation in patients with Parkinson disease. Nat Rev Neurol. 2015;11:98–110. doi: 10.1038/nrneurol.2014.252. [DOI] [PubMed] [Google Scholar]
- [3].Cabañes-Martínez L, Villadóniga M, San Millán A, Del AÁlamo M, Regidor I. Effects of deep brain stimulation on the kinematics of gait and balance in patients with idiopathic Parkinson’s disease. Clin Biomech. 2022;98:105737. doi: 10.1016/j.clinbiomech.2022.105737. [DOI] [PubMed] [Google Scholar]
- [4].Kwon DK, Kwatra M, Wang J, Ko HS. Levodopa-induced dyskinesia in Parkinson’s disease: pathogenesis and emerging treatment strategies. Cells. 2022;11:3736. doi: 10.3390/cells11233736. [DOI] [PMC free article] [PubMed] [Google Scholar]
- [5].Collomb-Clerc A, Welter ML. Effects of deep brain stimulation on balance and gait in patients with Parkinson’s disease: a systematic neurophysiological review. Neurophysiol Clin-Clin Neurophysiol. 2015;45:371–88. doi: 10.1016/j.neucli.2015.07.001. [DOI] [PubMed] [Google Scholar]
- [6].Reich MM, et al. Progressive gait ataxia following deep brain stimulation for essential tremor: adverse effect or lack of efficacy? Brain. 2016;139:2948–56. doi: 10.1093/brain/aww223. [DOI] [PubMed] [Google Scholar]
- [7].Shi W, Feng H, Zhang X, Yeh CH. Amplitude modulation multiscale entropy characterizes complexity and brain states. Chaos, Solit Fractals. 2023;173:113646 [Google Scholar]
- [8].Yeh CH, et al. Cross-frequency coupling and intelligent neuromodulation. Cyborg Bionic Syst. 2023;4:34. doi: 10.34133/cbsystems.0034. [DOI] [PMC free article] [PubMed] [Google Scholar]
- [9].Fischer P, et al. Alternating modulation of subthalamic nucleus beta oscillations during stepping. J Neurosci. 2018;38:5111–21. doi: 10.1523/JNEUROSCI.3596-17.2018. [DOI] [PMC free article] [PubMed] [Google Scholar]
- [10].Chen CC, et al. Subthalamic nucleus oscillations correlate with vulnerability to freezing of gait in patients with Parkinson’s disease. Neurobiol Dis. 2019;132:104605. doi: 10.1016/j.nbd.2019.104605. [DOI] [PMC free article] [PubMed] [Google Scholar]
- [11].Pozzi NG, et al. Freezing of gait in Parkinson’s disease reflects a sudden derangement of locomotor network dynamics. Brain. 2019;142:2037–50. doi: 10.1093/brain/awz141. [DOI] [PMC free article] [PubMed] [Google Scholar]
- [12].Russo Y, et al. Does visual cueing improve gait initiation in people with Parkinson’s disease? Hum Mov Sci. 2022;84:102970. doi: 10.1016/j.humov.2022.102970. [DOI] [PubMed] [Google Scholar]
- [13].Ginis P, Nackaerts E, Nieuwboer A, Heremans E. Cueing for people with Parkinson’s disease with freezing of gait: a narrative review of the state-of-the-art and novel perspectives. Ann Phys Rehabil Med. 2018;61:407–13. doi: 10.1016/j.rehab.2017.08.002. [DOI] [PubMed] [Google Scholar]
- [14].Rochester L, Burn DJ, Woods G, Godwin J, Nieuwboer A. Does auditory rhythmical cueing improve gait in people with Parkinson’s disease and cognitive impairment? A feasibility study. Mov Disord. 2009;24:839–45. doi: 10.1002/mds.22400. [DOI] [PubMed] [Google Scholar]
- [15].Yogev-Seligmann G, et al. The development of a home-based technology to improve gait in people with Parkinson’s disease: a feasibility study. Biomed Eng Online. 2023;22:1–15. doi: 10.1186/s12938-023-01066-2. [DOI] [PMC free article] [PubMed] [Google Scholar]
- [16].Howe TE, Lövgreen B, Cody FW, Ashton VJ, Oldham JA. Auditory cues can modify the gait of persons with early-stage Parkinson’s disease: a method for enhancing parkinsonian walking performance? Clin Rehabil. 2003;17:363–7. doi: 10.1191/0269215503cr621oa. [DOI] [PubMed] [Google Scholar]
- [17].Nieuwboer A, et al. Cueing training in the home improves gait-related mobility in Parkinson’s disease: the RESCUE trial. J Neurol Neurosurg Psychiatry. 2007;78:134–40. doi: 10.1136/jnnp.200X.097923. [DOI] [PMC free article] [PubMed] [Google Scholar]
- [18].Nieuwboer A, et al. The short-term effects of different cueing modalities on turn speed in people with Parkinson’s disease. Neurorehabilitation Neural Repair. 2009;23:831–6. doi: 10.1177/1545968309337136. [DOI] [PubMed] [Google Scholar]
- [19].Young WR, Shreve L, Quinn EJ, Craig C, Bronte-Stewart H. Auditory cueing in Parkinson’s patients with freezing of gait. What matters most: action-relevance or cue-continuity? Neuropsychologia. 2016;87:54–62. doi: 10.1016/j.neuropsychologia.2016.04.034. [DOI] [PubMed] [Google Scholar]
- [20].Cancela J, Moreno EM, Arredondo MT, Bonato P. Designing auditory cues for Parkinson’s disease gait rehabilitation; Annu Int Conf IEEE Eng Med Biol Soc; 2014. pp. 5852–5. [DOI] [PubMed] [Google Scholar]
- [21].Willems AM, et al. The use of rhythmic auditory cues to influence gait in patients with Parkinson’s disease, the differential effect for freezers and non-freezers, an explorative study. Disabil Rehabil. 2006;28:721–8. doi: 10.1080/09638280500386569. [DOI] [PubMed] [Google Scholar]
- [22].Marmelat V, Duncan A, Meltz S, Meidinger RL, Hellman AM. Fractal auditory stimulation has greater benefit for people with Parkinson’s disease showing more random gait pattern. Gait Posture. 2020;80:234–9. doi: 10.1016/j.gaitpost.2020.05.021. [DOI] [PMC free article] [PubMed] [Google Scholar]
- [23].Çarıkcı S, Ünlüer NÖ, Torun Ş. Effects of cadence-compatible melodic rhythmic auditory stimulation implementation on gait in patients with Parkinson’s disease. Somatosens Mot Res. 2021;38:108–16. doi: 10.1080/08990220.2020.1864314. [DOI] [PubMed] [Google Scholar]
- [24].Tan H. Towards adaptive deep brain stimulation for freezing of gait. Brain. 2022;145:2236–8. doi: 10.1093/brain/awac172. [DOI] [PMC free article] [PubMed] [Google Scholar]
- [25].Little S, et al. Adaptive deep brain stimulation in advanced Parkinson disease. Ann Neurol. 2013;74:449–57. doi: 10.1002/ana.23951. [DOI] [PMC free article] [PubMed] [Google Scholar]
- [26].Tinkhauser G, et al. Beta burst dynamics in Parkinson’s disease OFF and ON dopaminergic medication. Brain. 2017;140:2968–81. doi: 10.1093/brain/awx252. [DOI] [PMC free article] [PubMed] [Google Scholar]
- [27].Khawaldeh S, et al. Balance between competing spectral states in subthalamic nucleus is linked to motor impairment in Parkinson’s disease. Brain. 2022;145:237–50. doi: 10.1093/brain/awab264. [DOI] [PMC free article] [PubMed] [Google Scholar]
- [28].Tinkhauser G, et al. The modulatory effect of adaptive deep brain stimulation on beta bursts in Parkinson’s disease. Brain. 2017;140:1053–67. doi: 10.1093/brain/awx010. [DOI] [PMC free article] [PubMed] [Google Scholar]
- [29].Quinn AJ, et al. Unpacking transient event dynamics in electrophysiological power spectra. Brain Topogr. 2019;32:1020–34. doi: 10.1007/s10548-019-00745-5. [DOI] [PMC free article] [PubMed] [Google Scholar]
- [30].Zich C, Quinn AJ, Mardell LC, Ward NS, Bestmann S. Dissecting transient burst events. Trends Cognit Sci. 2020;24:784–8. doi: 10.1016/j.tics.2020.07.004. [DOI] [PMC free article] [PubMed] [Google Scholar]
- [31].Vidaurre D, et al. Spectrally resolved fast transient brain states in electrophysiological data. Neuroimage. 2016;126:81–95. doi: 10.1016/j.neuroimage.2015.11.047. [DOI] [PMC free article] [PubMed] [Google Scholar]
- [32].Wang Y, Shi W, Yeh CH. A novel measure of cardiopulmonary coupling during sleep based on the synchrosqueezing transform algorithm. IEEE J Biomed Health Inform. 2023;27:1790–800. doi: 10.1109/JBHI.2023.3237690. [DOI] [PubMed] [Google Scholar]
- [33].Vidaurre D, Smith SM, Woolrich MW. Brain network dynamics are hierarchically organized in time. Proc Natl Acad Sci USA. 2017;114:12827–32. doi: 10.1073/pnas.1705120114. [DOI] [PMC free article] [PubMed] [Google Scholar]
- [34].Vidaurre D, et al. Discovering dynamic brain networks from big data in rest and task. Neuroimage. 2018;180:646–56. doi: 10.1016/j.neuroimage.2017.06.077. [DOI] [PMC free article] [PubMed] [Google Scholar]
- [35].Vidaurre D, et al. Spontaneous cortical activity transiently organises into frequency specific phase-coupling networks. Nat Commun. 2018;9:1–13. doi: 10.1038/s41467-018-05316-z. [DOI] [PMC free article] [PubMed] [Google Scholar]
- [36].Huang NE, et al. The empirical mode decomposition and the Hilbert spectrum for nonlinear and non-stationary time series analysis. Proc Roy Soc Lond A. 1998;454:903–95. [Google Scholar]
- [37].Wang YH, Hu K, Lo MT. Uniform phase empirical mode decomposition: an optimal hybridization of masking signal and ensemble approaches. IEEE Access. 2018;6:34819–33. doi: 10.1109/ACCESS.2018.2847634. [DOI] [PMC free article] [PubMed] [Google Scholar]
- [38].Deering R, Kaiser JF. The use of a masking signal to improve empirical mode decomposition; IEEE Int Conf Acoust, Speech, Signal Processing; 2005. pp. 485–8. [Google Scholar]
- [39].Yeh CH, Shi W. Identifying phase-amplitude coupling in cyclic alternating pattern using masking signals. Sci Rep. 2018;8:2649. doi: 10.1038/s41598-018-21013-9. [DOI] [PMC free article] [PubMed] [Google Scholar]
- [40].Zhang C, Yeh CH, Shi W. Variational phase-amplitude coupling characterizes signatures of anterior cortex under emotional processing. IEEE J Biomed Health Inform. 2023;27:1935–45. doi: 10.1109/JBHI.2023.3243275. [DOI] [PubMed] [Google Scholar]
- [41].Jin L, Shi W, Zhang C, Yeh CH. Frequency nesting interactions in the subthalamic nucleus correlate with the step phases for Parkinson’s disease. Front Physiol. 2022;13:890753. doi: 10.3389/fphys.2022.890753. [DOI] [PMC free article] [PubMed] [Google Scholar]
- [42].Hu Y, Shi W, Yeh CH. A novel nonlinear bispectrum analysis for dynamical complex oscillations. Cog Neurodynamics. 2023:1–21. doi: 10.1007/s11571-023-09953-z. [DOI] [PMC free article] [PubMed] [Google Scholar]
- [43].Mitra PP, Pesaran B. Analysis of dynamic brain imaging data. Biophys J. 1999;76:691–708. doi: 10.1016/S0006-3495(99)77236-X. [DOI] [PMC free article] [PubMed] [Google Scholar]
- [44].Hunyadi B, Woolrich MW, Quinn AJ, Vidaurre D, De Vos M. A dynamic system of brain networks revealed by fast transient EEG fluctuations and their fMRI correlates. Neuroimage. 2019;185:72–82. doi: 10.1016/j.neuroimage.2018.09.082. [DOI] [PubMed] [Google Scholar]
- [45].Quinn AJ, et al. Task-evoked dynamic network analysis through hidden Markov modeling. Front Neurosci. 2018;12:603. doi: 10.3389/fnins.2018.00603. [DOI] [PMC free article] [PubMed] [Google Scholar]
- [46].Deffains M, Iskhakova L, Katabi S, Israel Z, Bergman H. Longer β oscillatory episodes reliably identify pathological subthalamic activity in Parkinsonism. Mov Disord. 2018;33:1609–18. doi: 10.1002/mds.27418. [DOI] [PubMed] [Google Scholar]
- [47].Anidi C, et al. Neuromodulation targets pathological not physiological beta bursts during gait in Parkinson’s disease. Neurobiol Dis. 2018;120:107–17. doi: 10.1016/j.nbd.2018.09.004. [DOI] [PMC free article] [PubMed] [Google Scholar]
- [48].Pauls KAM, et al. Cortical beta burst dynamics are altered in Parkinson’s disease but normalized by deep brain stimulation. Neuroimage. 2022;257:119308. doi: 10.1016/j.neuroimage.2022.119308. [DOI] [PubMed] [Google Scholar]
- [49].Torrecillos F, et al. Modulation of beta bursts in the subthalamic nucleus predicts motor performance. J Neurosci. 2018;38:8905–17. doi: 10.1523/JNEUROSCI.1314-18.2018. [DOI] [PMC free article] [PubMed] [Google Scholar]
- [50].Lee LHN, et al. Deep brain stimulation rectifies the noisy cortex and irresponsive subthalamus to improve parkinsonian locomotor activities. Npj Parkinson’s Dis. 2022;8:77. doi: 10.1038/s41531-022-00343-6. [DOI] [PMC free article] [PubMed] [Google Scholar]
- [51].Litvak V, et al. Resting oscillatory cortico-subthalamic connectivity in patients with Parkinson’s disease. Brain. 2011;134:359–74. doi: 10.1093/brain/awq332. [DOI] [PubMed] [Google Scholar]
- [52].Lofredi R, et al. Dopamine-dependent scaling of subthalamic gamma bursts with movement velocity in patients with Parkinson’s disease. Elife. 2018;7:e31895. doi: 10.7554/eLife.31895. [DOI] [PMC free article] [PubMed] [Google Scholar]
Associated Data
This section collects any data citations, data availability statements, or supplementary materials included in this article.
Supplementary Materials
Data Availability Statement
The datasets used for the current study are available from the corresponding author on reasonable request and will be deposited on the MRC Brain Network Dynamics Unit data-sharing platform (https://data.mrc.ox.ac.uk/data-set/).


