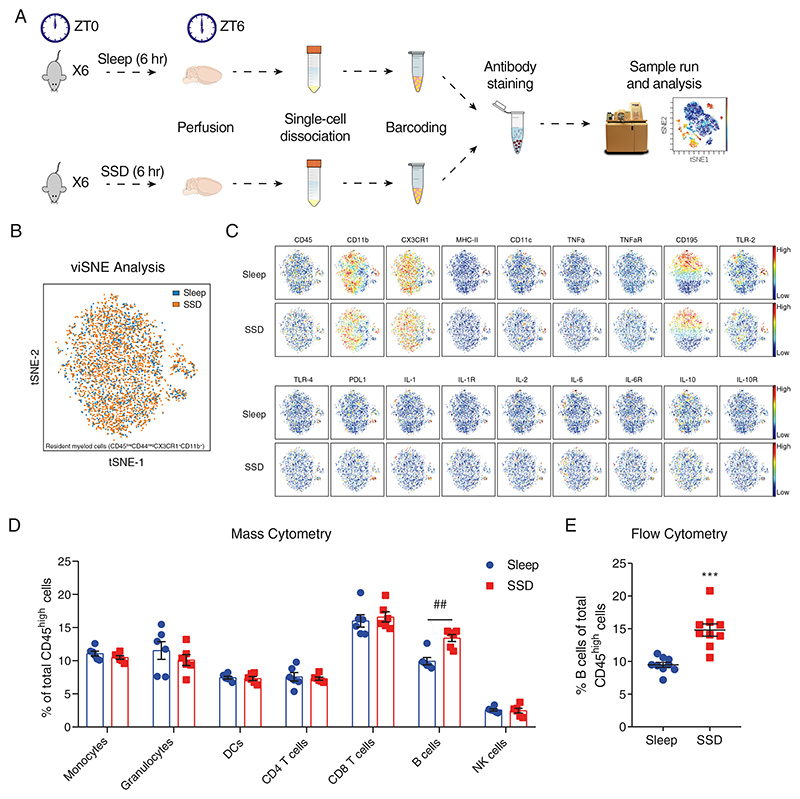
Figure 1. Characterization of immune cells in the brain compartment following short-term sleep deprivation.
(A) Schematic representation of the experimental procedure. Following 6 hours of sleep or sleep deprivation (ZT0 to ZT6), mice were sacrificed and perfused. Each mouse brain was dissociated to a single-cell suspension. Pools of single-cell suspensions from 6 mouse brains per group were barcoded, stained and analyzed using a mass cytometer. (B) viSNE analysis of sleep-control and sleep-deprived resident myeloid cells in an overlaid dot plot, and (C) in a color gradient plot for each marker. (D) The various blood-derived immune cell populations in the brain compartment, following 6 hours of sleep (sleep; left) or 6 hours of sleep deprivation (SSD; right), and the cell subset proportions of each group. Data are presented as mean±sem; multiple t-tests, n=6 pooled specimens of six mice in each sample, corrected p-value ##P<0.002; data of three experiments. (E) Flow cytometry analysis of the percentage of B cells (CD45high/+CD19+MHC-II+) of total CD45high cells in the brain compartment, following 6 hours of sleep (sleep; blue circle) or sleep deprivation (SSD; red square). Data are presented as mean±sem; Student’s t-test, n=9 individual mice; ***P<0.001; representative data of three experiments.

