Abstract
Micro-flow liquid chromatography tandem mass spectrometry (μLC–MS/MS) is becoming a viable alternative to nano-flow LC–MS/MS for the analysis of proteomes. We have recently demonstrated the potential of such a system operating with a 1 mm i.d. × 150 mm column and at a flow rate of 50 μl/min for high-throughput applications. Based on the analysis of ~38,000 samples measured on two instruments over the past two years, we now show that the approach is extremely robust. Up to 1,500 analysis were performed within one month and >14,000 samples could be analyzed on a single column without loss of chromatographic performance. Samples included proteomes of cell lines, tissues and human body fluids, which were analyzed with or without prior peptide fractionation or stable isotope labeling. We show that the μLC–MS/MS system is capable of measuring 2,600 proteins from undepleted human plasma and ~5,000 proteins from crude human urine in one day, demonstrating its potential for in-depth as well as high-throughput clinical application.
Introduction
Nano-flow liquid chromatography tandem mass spectrometry (nLC–MS/MS) has been tremendously successful in proteomics due to its very high sensitivity1,2. However, this often comes at the cost of throughput and robust operation3,4. The latter is particularly challenging when analysing molecularly very complex or high dynamic range proteomes such as animal and plant tissues or body fluids5. Both these factors can, in part, be addressed by micro-flow or analytical-flow liquid chromatography, which is very successfully used in the field of bioanalysis6–8. However, the much higher flow rates required by larger bore columns reduce the efficiency of electrospray ionization, in turn reducing sensitivity. As mass spectrometers have been greatly improved over the past 10 years, sensitivity has become a lesser issue for applications where sample quantities are not extremely scarce9–11. This has prompted us and others to revisit μLC–MS/MS for proteome analysis with very encouraging results12–14. For instance, our prior work using a 1 × 150 mm reversed phase HPLC column operating at a flow rate of 50 μl/min12 in conjunction with an HF-X Orbitrap mass spectrometer enabled proteome analysis of cell lines and tissues to a depth of 8,000-10,000 proteins within one day. At the same time, the data collected for body fluids showed a very high level of quantitative reproducibility and the analysis of ~2,000 samples provided good preliminary indications that the approach can be robust and high-throughput at the same time. Based on the analysis of >38,000 proteomic samples of diverse origin over the past two years, we show here, that this is indeed the case.
Results and Discussion
Analysis of 38,000 proteomic samples demonstrates high-throughput capabilities
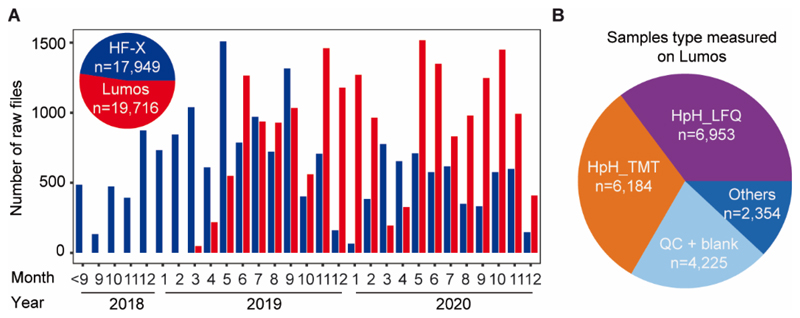
Inspired by the work of Cambers et al.7 and Lenčo et al.13, we started experimenting with μLC–MS/MS using a 1 mm ID column at 50 μl/min flow rate coupled to an Orbitrap HF-X mass spectrometer in mid 2018. We chose Acclaim PepMap C18 columns because the material is widely used in the field and provides a good balance between loading capacity (15% carbon load) and separation characteristics for hydrophilic and hydrophobic peptides. The setup was commissioned to routine use in early 2019 and has since seen continuous operation for over two years and performing ~18,000 analysis. The same μLC setup was implemented on an Orbitrap Fusion Lumos soon thereafter and has performed nearly 20,000 analysis to date (Figure 1A; Table S1). To the best of our knowledge, throughput of this scale has not been demonstrated before. In an earlier report, we systematically investigated the sensitivity and reproducibility characteristics of the micro-flow system, which is why we do not detail these here again12. The above figures show, that the earlier indications of the systems’ ability to perform high-throughput proteome analysis can be unequivocally confirmed. Because of the short overhead times for sample loading and column equilibration, the system is particularly well suited to run short gradient LC-MS/MS. This is reflected in the distribution of the types of samples analysed on the Orbitrap Lumos. About two thirds of all samples were fractions of off-line high pH reversed phase separations of complex proteomic digests and that either used tandem mass tags for quantification (TMT; 6,184 runs; 25 min gradient; 30 min turnaround time) or label-free quantification (MaxQuant LFQ; 6,953 runs; 15 min gradient; 20 min turnaround time; Figure 1B). For these applications, the system is capable of delivering a throughput of 48 (TMT) or 72 (LFQ) analysis per day and the above (which also includes 30 and 60 min gradient experiments) demonstrates that a high level of sample throughput can be sustained over extended periods of time. We note that we allow for longer gradient times for the analysis of TMT samples to off-set the additional time requirements of MS3 vs MS2 tandem MS analysis.
Figure 1. Summary of the number and types of samples analyzed on two micro-flow LC-MS/MS systems.
(A) Bar chart showing the number of samples analyzed by micro-flow LC-MS/MS on an Orbitrap HF-X (blue) and Orbitrap Lumos (red) mass spectrometer over time. The inset shows the total number of samples for each instrument. (B) Distribution of the types of samples analyzed by micro-flow LC-MS/MS on the Orbitrap Lumos. TMT: tandem mass tags; LFQ: label-free quantification; HpH: high pH reversed phase chromatography.
Robustness of micro-flow LC columns
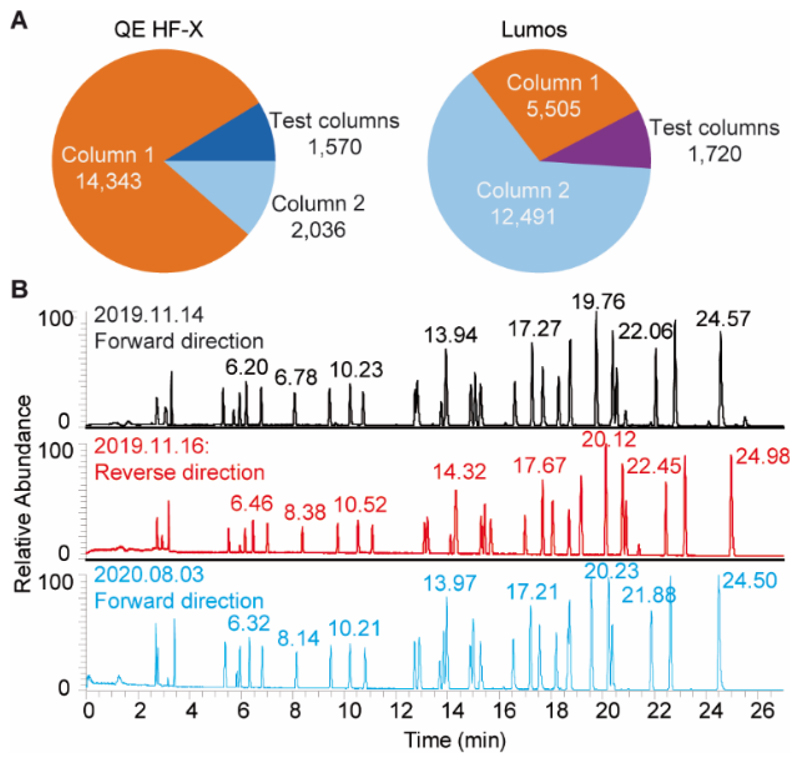
As shown in Figure 2A, more than 14,000 or 12,000 samples were separated by the same column connected to the HF-X and Lumos mass spectrometers respectively and both columns were still running at the time of manuscript preparation. Although all five columns tested so far showed good performance, the authors point out that minor column-to-column variation does exist (Figure S1). The ability to analyze such large numbers of samples on a single column is not only surprising to scientists used to working with nano-flow LC columns, it is obviously of considerable advantage when analyzing large sample cohorts. The robustness of the chromatography also relies on careful sample preparation, particularly as our LC system uses direct sample injection to save overhead time. While high pH reversed phase fractions are typically very clean samples, unfractionated digests can lead to accumulation of insoluble material at the head of the column, which can block the column or substantially increase backpressure. For instance, column 1 of the Lumos stopped working after 5,500 injections because one sample irreversibly blocked the column. More frequently, we observed reversible partial column blocking when analyzing samples prepared by affinity purifications (e. g. HLA immunopeptidome preparations) presumably because of the presence of the high quantities of antibody and detergents used for preparing these samples from human tumor cells. An example is shown in Figure S2, where column backpressure increased from one sample to the next by >100 bar and remained unstable across the separation. The QC run before this partial block is shown in Figure 2B (top panel) and displays the typical separation characteristics for this column. To prevent further damage, the blocked column was connected to the LC system in the reverse direction and flushed with acetonitrile. This procedure returned backpressure to normal values in reverse flow almost immediately but not in forward flow, indicating persisting blockage at the head of the column that could not be removed easily by solvent. As one might expect for a well-packed column, separation performance was also very good in the reversed flow direction (Figure 2B, middle panel) and we continued to operate this column for more than 8 months in this configuration before returning it again into the original forward flow direction (Figure 2B, bottom panel). We note that there are differences in the retention times of PROCAL peptides between forward and reverse flow but these did not lead to noticeable differences in performance for the analysis of proteomic samples. Surprisingly, the retention times of the forward flow chromatograms were nearly identical despite the very long time and the many samples between these two analyses.
Figure 2.
(A) Pie charts summarizing the number of samples analyzed using different columns on the Orbitrap HF-X and Lumos instruments. (B) Base peak chromatograms of 500 fmol of PROCAL peptides separated on the same PepMap column (1#) connected to the Orbitrap HF-X in the forward flow direction (upper panel; November 14th 2019), reverse flow direction (middle panel; November 16th 2019), and again in forward flow direction (bottom panel; August 3rd 2020).
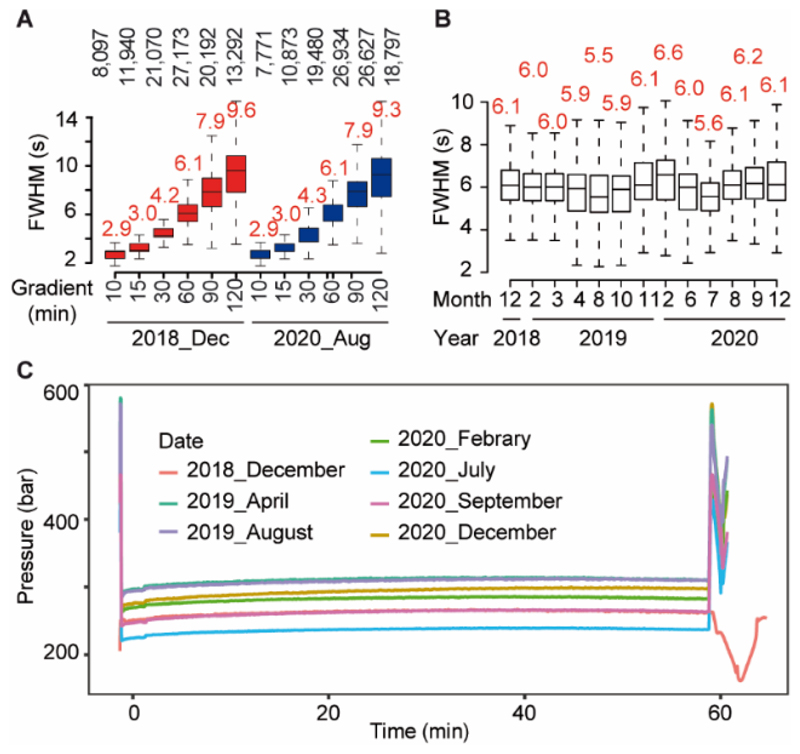
As another metric for assessing column robustness, we compared results of HeLa protein digest separations (2 μg) using different gradient lengths on the same column performed 20 months apart (Figure 3A). As is apparent, chromatographic separation performance was nearly identical (Figure 3A, Figure S3) even though >12,000 samples had been analysed on this column within this time. The small differences in the number of identified peptides in both analyses are likely due to variations in performance of the mass spectrometer and the fact that the HeLa digest stocks were not identical. As part of the laboratory’s QC procedures, we regularly test all LC-MS/MS instruments using standard HeLa digests using 60 min gradients. Again, comparing results of 13 representative samples over a period of two years showed very little variation in LC peak widths (Figure 3B) and column pressure (Figure 3C).
Figure 3. Chromatographic stability of the same PepMap column over a 20 months interval.
(A) Boxplots showing the chromatographic peak width (full width at half-maximum; FWHM) distributions of Hela peptides separated on the same PepMap column with different gradients in 2018 (red) and 2020 (blue; Orbitrap HF-X). (B) Boxplots showing the chromatographic peak width (full width at half-maximum; FWHM) distributions of Hela peptides separated on the same column using 60 min gradient between 2018 to 2020. Boxes cover 50% and whiskers represent 1.5 times the interquartile range of the data. (C) Overlaid pressure curves of Hela peptides separated on the same column between 2018 to 2020 using a 60 min gradient.
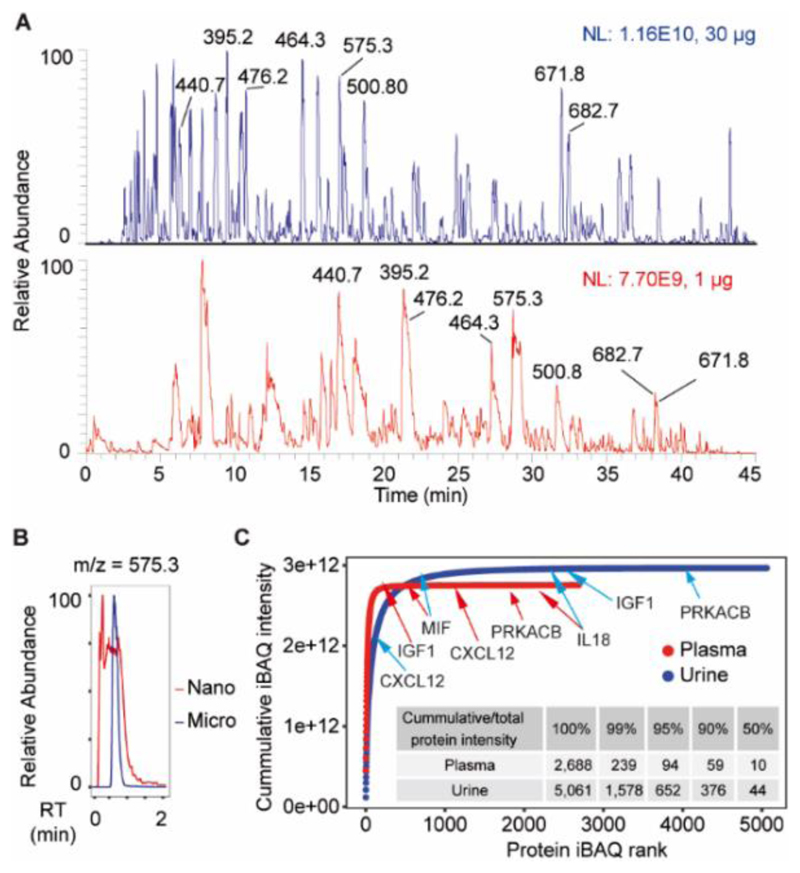
Robust operation of any LC-MS/MS setup requires that columns are not overloaded, a chromatographic rule that is often violated or overlooked in proteomics using nanoLC-MS/MS, particularly when analyzing body fluids that are characterized by extreme protein abundance differences. This is illustrated by the chromatograms shown in Figures 4A and 4B. While the separation of 1 μg of a crude plasma protein digest by nanoLC-MS/MS (data from reference15) showed clear signs of overloading, peak shapes in the μLC-MS/MS separation of 30 μg crude plasma digest are still very good. Overloading will not only lead to poor peak shapes, but also compromise quantification and increases the danger of substantial run-to-run sample carryover. Therefore, the authors recommend restricting sample loading on 75 μm nano-LC columns to 200 ng and typical sample quantities for μLC-MS/MS are 100 ng – 1 μg, 500 ng – 5 μg, and 2 μg – 10 μg for 15 min, 30 min and 60 min gradients respectively. We empirically observed that μLC-MS/MS of proteomic samples keeps the mass spectrometer cleaner for longer compared to nanoLC-MS/MS. In the author’s laboratory, the cleaning cycles were about two months for the HF-X instrument and more than six months for the Lumos. It should be noted though that this period is more dependent on how much sample is injected for each analysis rather than the number of analysis performed per se.
Figure 4. Application of the μLC-MS/MS system to the analysis of body fluid proteomes.
(A) Base peak chromatograms of crude plasma protein digest separated by micro-flow (upper panel, blue) and nano-flow (bottom panel, red) LC-MS/MS using 45 min measurement time. Selected peaks are annotated with peptide mass to charge (m/z) values. (B) Extracted ion chromatograms of one highly abundant peptide of m/z = 395.24. The x-axis represents a relative time scale to allow alignment of the two chromatograms. (C) Cumulative iBAQ (intensity based absolute quantification) intensity distribution of all quantified plasma and urine proteins following fractionation (48 fractions) by high-pH reversed phase chromatography and μLC-MS/MS analysis using 30 min gradient. Selected proteins of different abundance are marked by arrows. The inserted table shows how many proteins represent how much of the total iBAQ intensity.
Deep profiling of plasma and urine proteomes by micro-flow LC-MS/MS
The above shows that μLC-MS/MS is a highly performant and robust approach to proteome analysis. This mirrors the experience made in the field of bioanalysis where μLC-MS/MS has turned out to be a ‘sweet spot’ for many applications6,16,17 and, as a result, the respective equipment and expertise has also found its way into diagnostics laboratories. It can be anticipated that this will substantially aid in establishing proteome analysis of typical clinical samples (plasma, urine, CSF, etc.) in the routine laboratory. To show that μLC-MS/MS enables deep body fluid proteome profiling is feasible within a reasonable amount of time, crude plasma and urine protein digests were separated by offline high pH reversed phase HPLC, pooled into 48 fractions, and analyzed by μLC-MS/MS using a 30 min gradient on an HF-X mass spectrometer (1 day total analysis time). This resulted in 21,084 unique peptide sequences corresponding to 2,688 proteins and 35,372 unique peptide sequences corresponding to 5,061 proteins quantified from plasma and urine samples, respectively (Figure 4C; Table S2). As expected, the total signal obtained from both samples was dominated by few proteins and this was more pronounced for plasma than for urine. Still the dynamic range (7 logs of iBAQ intensity) of the μLC-MS/MS system was sufficient to detect proteins that were present at low relative abundance. Examples of the latter include IGF1 (Insulin-like growth factor I), MIF (Macrophage migration inhibitory factor), CXCL12 (Stromal cell-derived factor 1), PRKACB (cAMP-dependent protein kinase catalytic subunit beta), and IL18 (Interleukin-18).
Both these body fluids have been analysed even more deeply by others before (Figure S4). For instance, Dey et al. identified 4,826 plasma proteins from Alzheimer’s disease patients but a total of 22.5 days of instrument time was required for a single case18. Similarly, Zhao et al. reported the identification of 6,085 proteins from urine, which needed 26.6 days of nanoLC-MS/MS gradient time19. While achieving an impressive proteomic depth, such effort is incompatible with the analysis of clinical cohorts. For plasma, our data covered 72% of Dey’s list (1,952 proteins) in<5% of the time. Still, one day per sample is still too long to be clinically useful but the plasma and urine μLC-MS/MS data collected here may be useful for building spectral libraries to support much faster data independent measurements on the same platform in the future.
In conclusion, this work adds substantial further evidence that μLC-MS/MS is not only a viable, but often the preferred alternative approach to nanoLC-MS/MS analysis for the analysis of (clinical) proteomic samples, particularly when available sample quantities are not extremely scarce. Therefore, the authors anticipate that the approach will be more widely adopted in the future.
Supplementary Material
All experimental procedures and additional experimental results, including column to column variation, pressure curves, number of peptide identifications with different gradient length, comparison of identified plasma and urine proteins with literatures, summary of raw files generated by two μLC-MS/MS systems, summary of proteins and peptides identified from plasma and urine samples in the published literatures and this study.
Acknowledgements
Y.B. is grateful for postdoctoral fellowships by the Alexander von Humboldt Foundation, the Carl Friedrich von Siemens Foundation and the National Natural Science Foundation of China (81600046). This work was also supported, in part, by grants from the German Science foundation (DFG, SFB1309 grant no. 325871075 and SFB1321, grant no. 329628492), the German Ministry for Science and Research (BMBF, grant no. 031L0008A) and an ERC Advanced Grant (grant no. 833710). The authors wish to thank all members of the Kuster group for technical assistance and fruitful discussions.
Footnotes
Author contributions
B.K. and Y.B. developed and designed the study. Y.B., O.B., and R.Z. set up and optimized the micro-flow LC system. Y.B., F.P.B., S.G., Y.-C.C., and N. D. performed experiments and generated data. Y.B. and C.M. analyzed data. Y.B. and B.K. wrote the manuscript with contributions from all authors.
Competing financial interests
B.K. is a founder and shareholder of OmicScouts and msAId. He has no operational role in either company. O.B. and R.Z. are employees of Thermo Fisher Scientific. The other authors declare no competing interests.
Data availability
The mass spectrometry proteomics raw data and MaxQuant search results have been deposited with the ProteomeXchange Consortium via the PRIDE20 partner repository with the dataset identifier PXD023650 and the username: reviewer_pxd023650@ebi.ac.uk, and password: DRXMkBEP.
References
- 1.Wilm M, Mann M. Analytical properties of the nanoelectrospray ion source. Anal Chem. 1996;68:1–8. doi: 10.1021/ac9509519. [DOI] [PubMed] [Google Scholar]
- 2.Gatlin CL, Kleemann GR, Hays LG, Link AJ, Yates JR., III Protein identification at the low femtomole level from silver-stained gels using a new fritless electrospray interface for liquid chromatography–microspray and nanospray mass spectrometry. Anal Biochem. 1998;263:93–101. doi: 10.1006/abio.1998.2809. [DOI] [PubMed] [Google Scholar]
- 3.Wilson SR, Vehus T, Berg HS, Lundanes E. Nano-LC in proteomics: recent advances and approaches. Bioanalysis. 2015;7:1799–1815. doi: 10.4155/bio.15.92. [DOI] [PubMed] [Google Scholar]
- 4.Angel TE. Mass spectrometry-based proteomics: existing capabilities and future directions. Chem Soc Rev. 2012;41:3912–3928. doi: 10.1039/c2cs15331a. [DOI] [PMC free article] [PubMed] [Google Scholar]
- 5.Bache N. A Novel LC System Embeds Analytes in Pre-formed Gradients for Rapid, Ultra-robust Proteomics. Mol Cell Proteomics. 2018;17:2284–2296. doi: 10.1074/mcp.TIR118.000853. [DOI] [PMC free article] [PubMed] [Google Scholar]
- 6.Needham SR, Valaskovic GA. Microspray and microflow LC–MS/MS: the perfect fit for bioanalysis. Bioanalysis. 2015;7:1061–1064. doi: 10.4155/bio.15.42. [DOI] [PubMed] [Google Scholar]
- 7.Chambers AG, Percy AJ, Yang J, Borchers CH. Multiple Reaction Monitoring Enables Precise Quantification of 97 Proteins in Dried Blood Spots. Mol Cell Proteomics. 2015;14:3094–3104. doi: 10.1074/mcp.O115.049957. [DOI] [PMC free article] [PubMed] [Google Scholar]
- 8.Distler U, Łącki MK, Schumann S, Wanninger M, Tenzer S. Enhancing Sensitivity of Microflow-Based Bottom-Up Proteomics through Postcolumn Solvent Addition. Anal Chem. 2019;91:7510–7515. doi: 10.1021/acs.analchem.9b00118. [DOI] [PubMed] [Google Scholar]
- 9.Shishkova E, Hebert AS, Coon JJ. More Than Ever, Proteomics Needs Better Chromatography. Cell Syst. 2016;3:321–324. doi: 10.1016/j.cels.2016.10.007. [DOI] [PMC free article] [PubMed] [Google Scholar]
- 10.Schubert OT, Röst HL, Collins BC, Rosenberger G, Aebersold R. Quantitative proteomics: challenges and opportunities in basic and applied research. Nat Protoc. 2017;12:1289. doi: 10.1038/nprot.2017.040. [DOI] [PubMed] [Google Scholar]
- 11.Hahne H. DMSO enhances electrospray response, boosting sensitivity of proteomic experiments. Nat Methods. 2013;10:989. doi: 10.1038/nmeth.2610. [DOI] [PubMed] [Google Scholar]
- 12.Bian Y. Robust, reproducible and quantitative analysis of thousands of proteomes by micro-flow LC-MS/MS. Nat Commun. 2020;11:157. doi: 10.1038/s41467-019-13973-x. [DOI] [PMC free article] [PubMed] [Google Scholar]
- 13.Lenco J. Conventional-Flow Liquid Chromatography-Mass Spectrometry for Exploratory Bottom-Up Proteomic Analyses. Anal Chem. 2018;90:5381–5389. doi: 10.1021/acs.analchem.8b00525. [DOI] [PubMed] [Google Scholar]
- 14.Vowinckel J. Cost-effective generation of precise label-free quantitative proteomes in high-throughput by microLC and data-independent acquisition. Sci Rep. 2018;8:4346. doi: 10.1038/s41598-018-22610-4. [DOI] [PMC free article] [PubMed] [Google Scholar]
- 15.Geyer PE. Proteomics reveals the effects of sustained weight loss on the human plasma proteome. Mol Syst Biol. 2016;12:901. doi: 10.15252/msb.20167357. [DOI] [PMC free article] [PubMed] [Google Scholar]
- 16.Zhang M. Sensitive, high-throughput, and robust trapping-micro-LC-MS strategy for the quantification of biomarkers and antibody biotherapeutics. Anal Chem. 2018;90:1870–1880. doi: 10.1021/acs.analchem.7b03949. [DOI] [PMC free article] [PubMed] [Google Scholar]
- 17.Meding S, Boychenko A. Capillary Flow LC-MS Unites Sensitivity and Throughput. Chromatography Today. 2016:43–45. [Google Scholar]
- 18.Dey KK. Deep undepleted human serum proteome profiling toward biomarker discovery for Alzheimer’s disease. Clinical proteomics. 2019;16:16. doi: 10.1186/s12014-019-9237-1. [DOI] [PMC free article] [PubMed] [Google Scholar]
- 19.Zhao M. A comprehensive analysis and annotation of human normal urinary proteome. Sci Rep. 2017;7:3024. doi: 10.1038/s41598-017-03226-6. [DOI] [PMC free article] [PubMed] [Google Scholar]
- 20.Perez-Riverol Y. The PRIDE database and related tools and resources in 2019: improving support for quantification data. Nucleic Acids Res. 2019;47:D442–D450. doi: 10.1093/nar/gky1106. [DOI] [PMC free article] [PubMed] [Google Scholar]
Associated Data
This section collects any data citations, data availability statements, or supplementary materials included in this article.
Supplementary Materials
Data Availability Statement
The mass spectrometry proteomics raw data and MaxQuant search results have been deposited with the ProteomeXchange Consortium via the PRIDE20 partner repository with the dataset identifier PXD023650 and the username: reviewer_pxd023650@ebi.ac.uk, and password: DRXMkBEP.


