Abstract
A novel coronavirus was recently discovered and termed SARS-CoV-2. Human infection can cause coronavirus disease 2019 (COVID-19), which has been rapidly spreading around the globe1,2. SARS-CoV-2 shows some similarities to other coronaviruses. However, treatment options and a cellular understanding of SARS-CoV-2 infection are lacking. Here we identify the host cell pathways modulated by SARS-CoV-2 infection and show that inhibition of these pathways prevent viral replication in human cells. We established a human cell culture model for infection with SARS-CoV-2 clinical isolate. Employing this system, we determined the SARS-CoV-2 infection profile by translatome3 and proteome proteomics at different times after infection. These analyses revealed that SARS-CoV-2 reshapes central cellular pathways, such as translation, splicing, carbon metabolism and nucleic acid metabolism. Small molecule inhibitors targeting these pathways prevented viral replication in cells. Our results reveal the cellular infection profile of SARS-CoV-2 and led to the identification of drugs inhibiting viral replication. We anticipate our results to guide efforts to understand the molecular mechanisms underlying host cell modulation upon SARS-CoV-2 infection. Furthermore, our findings provide insight for the development of therapy options for COVID-19.
At the end of the year 2019, a cluster of severe pneumonia of unknown cause was described in Wuhan (Eastern China) and strikingly a SARS-like acute respiratory distress syndrome (ARDS) noted in many patients. Early in January 2020, next generation sequencing revealed a novel coronavirus (SARS-CoV-2) as the causal factor for the disease later designated COVID-191. SARS-CoV-2 shows high infectivity, which has resulted in rapid global spreading2.
Currently, there is no established therapy for COVID-19. Treatment is mainly based on supportive and symptomatic care4,5. Therefore, the development of therapies inhibiting SARS-CoV-2 infection or replication are urgently needed. Molecular examination of infected cells by unbiased proteomics approaches offers a potent strategy for revealing pathways relevant for viral pathogenicity to identify potential drug targets. However, this strategy depends on the availability of cell culture models permissive for virus infection and sensitive proteomics approaches for temporal infection profiling in cells. We recently succeeded isolating SARS-CoV-2 using the human colon epithelial carcinoma cell line Caco-26. SARS-CoV-2 replicates in gastrointestinal cells in in vivo7 and is frequently detected in stool – regardless of diarrhea8. Caco-2 cells were extensively used to study SARS-CoV-1 and are permissible for SARS-CoV-26,9. For proteome analysis, we recently described a novel method – multiplexed enhanced protein dynamics (mePROD) proteomics – enabling the determination of translatome and proteome changes at high temporal resolution3. Due to quantification of translation changes by naturally occurring heavy isotope SILAC labelling, this method does not affect cellular behaviour and therefore allows a perturbation-free and unbiased analysis of the cellular response to viral infection.
In this study, we used quantitative translatome and proteome proteomics to obtain an unbiased profile of the cellular response to SARS-CoV-2 infection in human cells. We monitored different time points post infection and identified key determinants of the host cell response to infection. These findings revealed pathways relevant for SARS-CoV-2 infection. We tested several drugs targeting these pathways – translation, proteostasis, glycolysis, splicing and nucleotide synthesis. These drugs inhibited SARS-CoV-2 replication at non-toxic concentrations, indicating therapeutic strategies for COVID-19.
SARS-CoV-2 rapidly replicates in cells
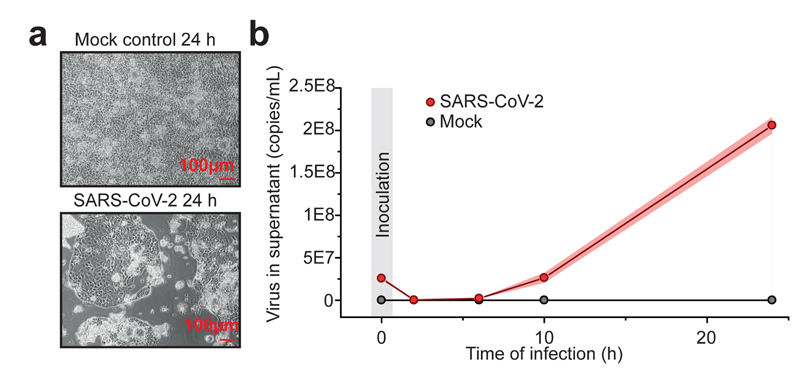
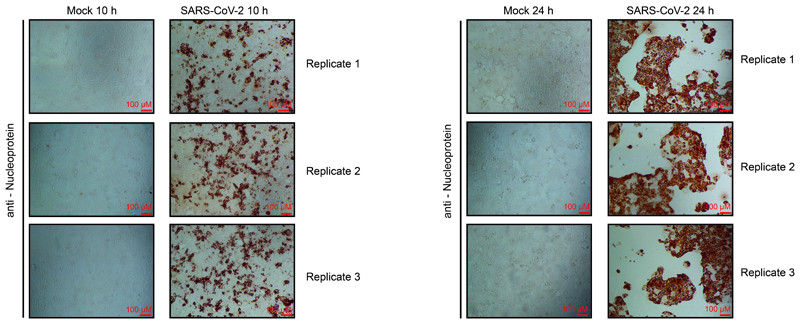
To investigate potential antiviral compounds against SARS-CoV-2, we established a highly permissive SARS-CoV-2 cell culture model in Caco-2 cells. Addition of SARS-CoV-2 at a multiplicity of infection (MOI) of one (to allow infection of a majority of cells while preventing multiple infection) led to a fast progression of viral infection with visible cytopathogenic effect (CPE) apparent after 24 hours (Fig. 1a). To determine if productive viral infection takes place in this model, we measured viral RNA copies in the supernatant during a 24-hour time period. SARS-CoV-2 RNA molecules increased continuously after infection (Fig. 1b), indicating that the virus underwent full replication cycles. Staining for viral nucleoprotein additionally revealed production of viral protein in a majority of cells (Extended Data Figure 1). Taken together, we established a functional SARS-CoV-2 cell culture model that allows investigation of the different steps of the SARS-CoV-2 life cycle in cells.
Fig. 1. SARS-CoV-2 replication model in in human cells.
a,Caco-2 cells were either mock or SARS-CoV-2 infected and cultured for 24 h. Microscopy pictures were taken to demonstrate cytopathic effect. Scale bars indicate 100 µm. Representative pictures from three independent biological replicates are shown. b, Quantitative PCR analysis of viral genome copies per mL cell culture after indicated infection time points (n = 3 independent biological samples). Points indicate mean of replicate measurements and shades represent s.d..
Translation inhibitors block replication
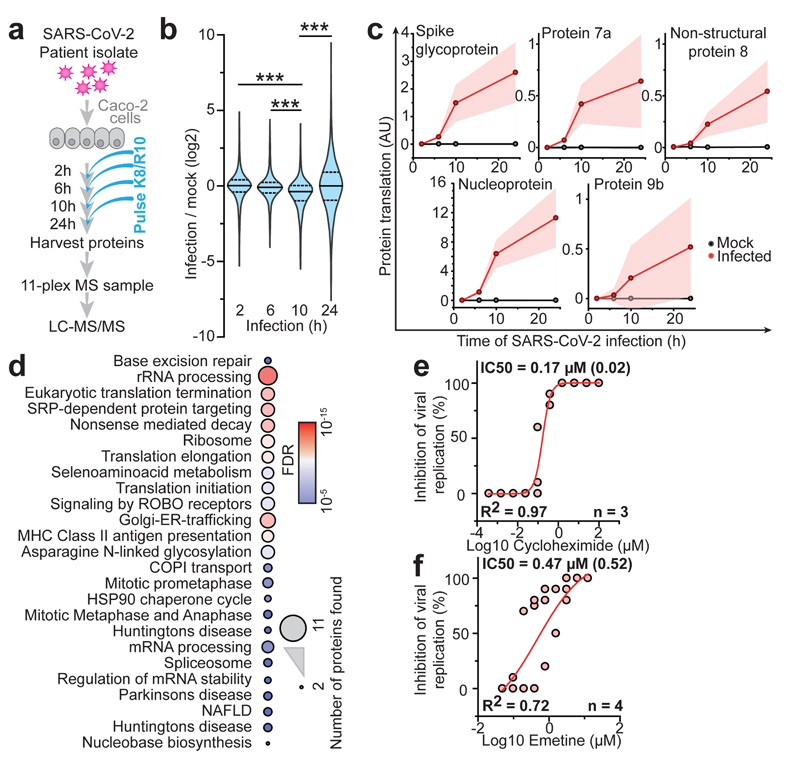
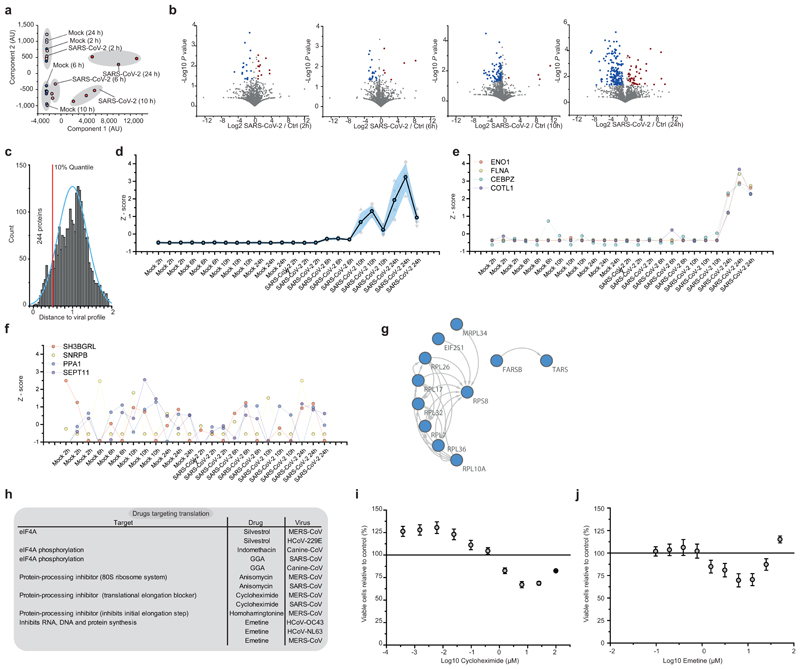
To determine the temporal profile of SARS-CoV-2 infection, we infected Caco-2 cells with SARS-CoV-2, cultured them for a range of 2-24 hours and quantified translatome and proteome changes by mePROD proteomics compared to time-matched mock-infected samples (Fig. 2a). Across all replicates, we quantified translation for 2,715 proteins and total protein levels for 6,382 proteins (Supplementary Table 1). Principal component analysis showed replicates clustering closely and first separation of infected samples after 6 hours (Extended Data Fig. 2a). Many RNA viruses decrease cellular protein synthesis, as has been suggested for SARS-CoV-110. When monitoring global translation rates, only minor translation changes were observed (Fig. 2b and Extended Data Fig. 2b). We detected translation rates for five viral proteins, all of which exhibited increasing translation rates over time (Fig. 2c). To identify pathways potentially important for virus amplification, we determined host proteins exhibiting translation kinetics correlating with viral proteins. Averaged profiles of all quantified viral proteins were used as reference profiles, distance to this profile calculated for all quantified host proteins and a network analysis carried out for the top 10% quantile of nearest profiles (244 proteins; Extended Data Fig. 2c-f). Pathway analyses of the network revealed an extensive increase in the host translation machinery (Fig. 2d and Extended Data Fig. 2g). In addition, we detected significant enrichment of components of several other pathways, such as splicing and nucleobase synthesis.
Fig. 2. Host cell translation changes upon SARS-CoV-2 infection.
a, Experimental scheme for translatome and proteome measurements. Caco-2 cells were infected with SARS-CoV-2 isolated from patients, incubated as indicated and analysed by quantitative translation and whole-cell proteomics. b, Global translation rates, showed by distribution plots of mean fold changes (log2) of replicates to mock control for each time point and protein. Black line indicates median and dashed lines indicate 25%/75% quantiles. Significance was tested by one-way ANOVA and two-sided post-hoc Bonferroni test. *** P value < 0.001 (10h/2h: 4x10-26; 10h/6h: 2.4x10⁻²³; 10h/24h: 2.3x10⁻²⁸, n = 2,716 measured proteins averaged from 3 independent biological samples). c, Translation of viral proteins over time. Mean translation in AU (normalised and corrected summed PSMs were averaged) is plotted for control and infected samples. Shades indicate s.d. (n = 3). d, Reactome pathway analysis of top 10% proteins following viral gene expression. Pathway results are shown with number of proteins found in dataset and computed FDR for pathway enrichment. e, f, Antiviral assay showing inhibition of viral replication in dependency of cycloheximide (e, n = 3) and emetine (f, n = 4) concentration. Each data point indicates biological replicates and red line shows dose response curve fit. R2 and IC50 values were computed from the curve fit and SD of IC50 is indicated in brackets. All n numbers represent independent biological samples if not stated otherwise.
Host translation has been previously targeted to pharmacologically inhibit replication of diverse coronaviruses, such as SARS-CoV-1 or MERS-CoV (Extended Data Fig. 2h)11,12. As components of the translation machinery were translated at higher rates (Fig. 2d), we speculated that SARS-CoV-2 replication might be sensitive to translation inhibition. We tested two translation inhibitors – cycloheximide (inhibitor of translation elongation) and emetine (inhibits 40S ribosomal protein S14) – for their ability to reduce SARS-CoV-2 replication. Both compounds significantly inhibited SARS-CoV-2 replication at non-toxic concentrations (Fig. 2e, f, Extended Data Fig. 2i, j). Taken together, translatome analyses of cells infected with SARS-CoV-2 revealed the temporal profile of viral and host protein responses with prominent increases in the translation machinery. Translation inhibitors prevented SARS-CoV-2 replication in cells.
Pathways changed by SARS-CoV-2 infection
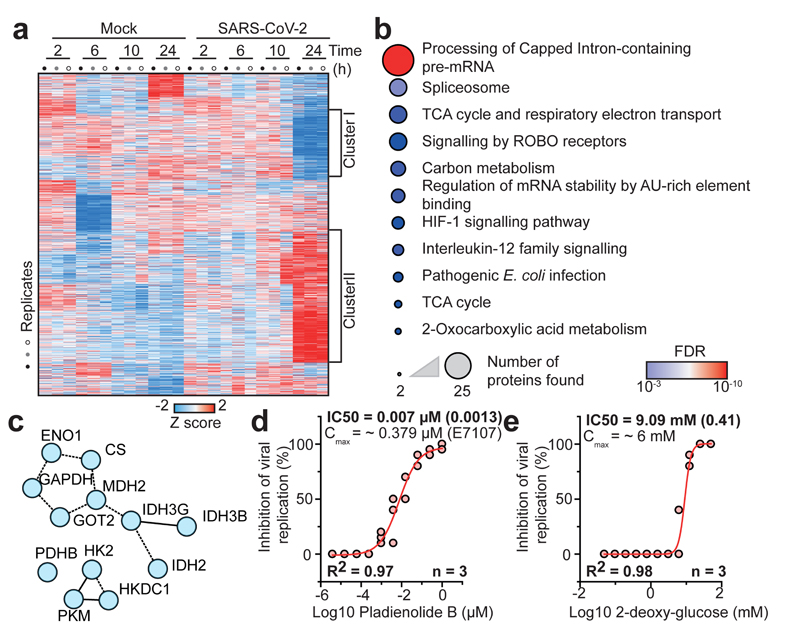
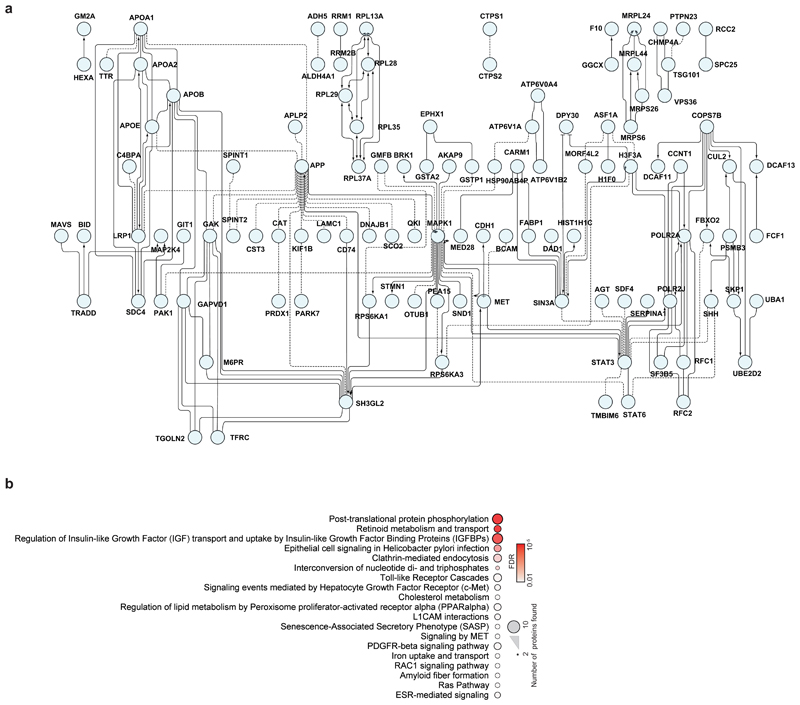
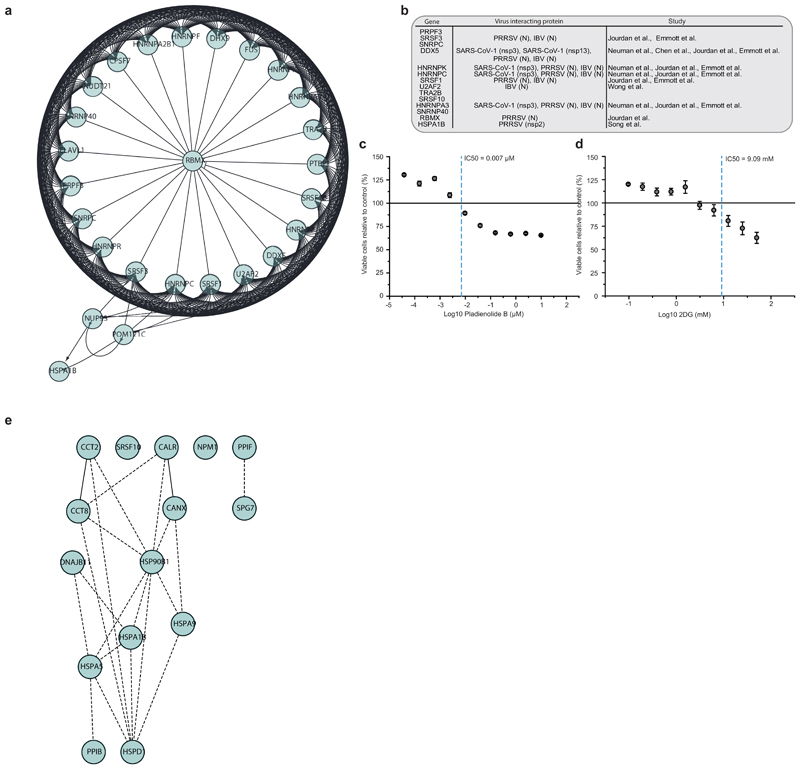
To obtain a general understanding of host proteome changes after infection, we analysed system-wide differences in protein levels over time (Fig. 3a, Supplementary Table 2). While early time points only showed minor host proteome changes, the proteome underwent extensive modulation 24 hours post infection (Fig. 3a and Extended Data Fig. 3). Hierarchical clustering identified two main clusters of proteins regulated: The first cluster consisted of proteins reduced during infection and was enriched in proteins belonging to cholesterol metabolism (Extended Data Fig. 4a, b and Supplementary Table 3). The second cluster was composed of proteins increased by infection and revealed strong increases in RNA modifiers, such as spliceosome components (consistent with translatome measurements in Fig. 2d), and carbon metabolism (Fig. 3b, c, Extended data Fig. 5a and Supplementary Table 4). Remarkably, for 14 of 25 spliceosome components increased upon SARS-CoV-2 infection, direct binding to viral proteins of SARS-CoV-1 or other coronaviruses had been shown (Extended data Fig. 5b)13–16. Thus, we tested whether inhibition of splicing or glycolysis may be able to prevent SARS-CoV-2 replication. Addition of pladienolide B, a spliceosome inhibitor targeting splicing factor SF3B117, prevented viral replication at non-toxic concentrations (Fig. 3d, Extended Data Fig. 5c), revealing splicing as an essential pathway for SARS-CoV-2 replication and potential therapeutic target.
Fig. 3. SARS-CoV-2 infection profiling reveals cellular pathways essential for replication.
a, Patterns of protein levels across all samples. Shown are proteins tested significant (two-sided, unpaired t-test with equal variance assumed, P < 0.05, n = 3) in at least one infected sample compared to corresponding control. Data was standardized using Z scoring before row-wise clustering and plotting. b, Reactome pathway analysis of protein network created from cluster II (a, see Table S4). Pathway results are shown with number of proteins found in dataset and computed FDR for pathway enrichment. c, Functional interaction network of proteins found annotated to carbon metabolism in Reactome pathway analysis. Lines indicate functional interaction. d, e, Antiviral assay showing inhibition of viral replication in dependency of pladienolide B (d, n = 3) and 2-deoxy-glucose (e, n = 3) concentration. Each data point indicates a biological replicate and red line shows dose response curve fit. R2 and IC50 values were computed from the curve fit and s.d. of IC50 is indicated in brackets. All n numbers represent independent biological samples.
Next, we assessed the effects of carbon metabolism (i.e. glycolysis) inhibition on SARS-CoV-2 replication. 2-deoxy-D-glucose (2-DG), an inhibitor of hexokinase, the rate limiting enzyme in glycolysis, had previously been shown to be effective against other viruses in cell culture and suppressed rhinovirus infection in mice18. Blocking glycolysis with non-toxic concentrations of 2-DG prevented SARS-CoV-2 replication in Caco-2 cells (2-DG, Fig. 3e, Extended Data Fig. 5d). Notably, we also observed changes in ER resident proteins reshaping lipid metabolism (Extended Data Fig. 6), consistent with previous reports on other coronaviruses19. Together, our quantitative analyses of proteome changes upon SARS-CoV-2 infection revealed host pathways changes upon infection and revealed spliceosome and glycolysis inhibitors as potential therapeutic agents for COVID-19.
Kinetic infection proteome profiling
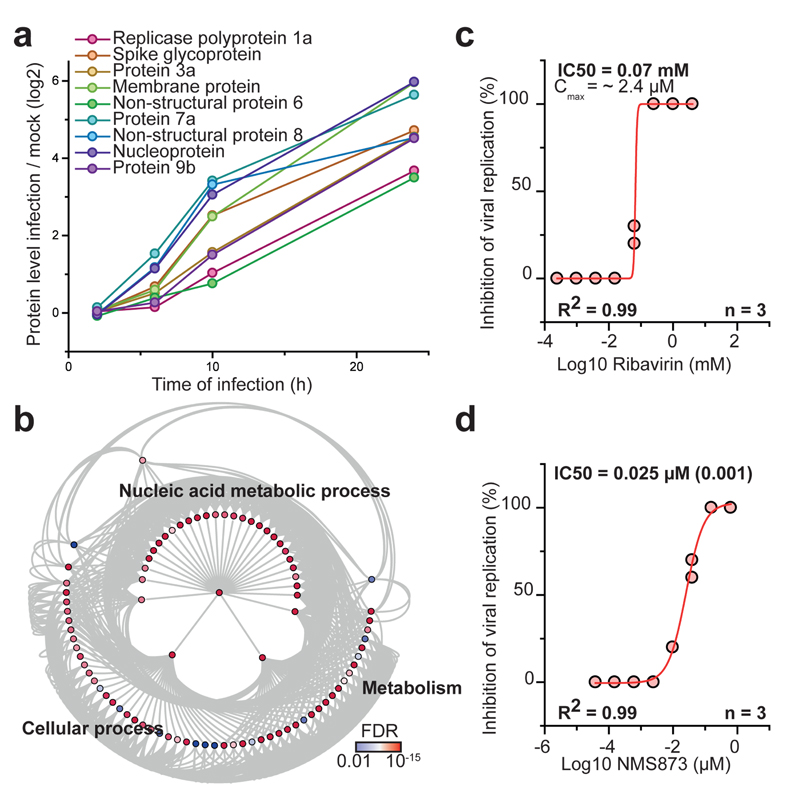
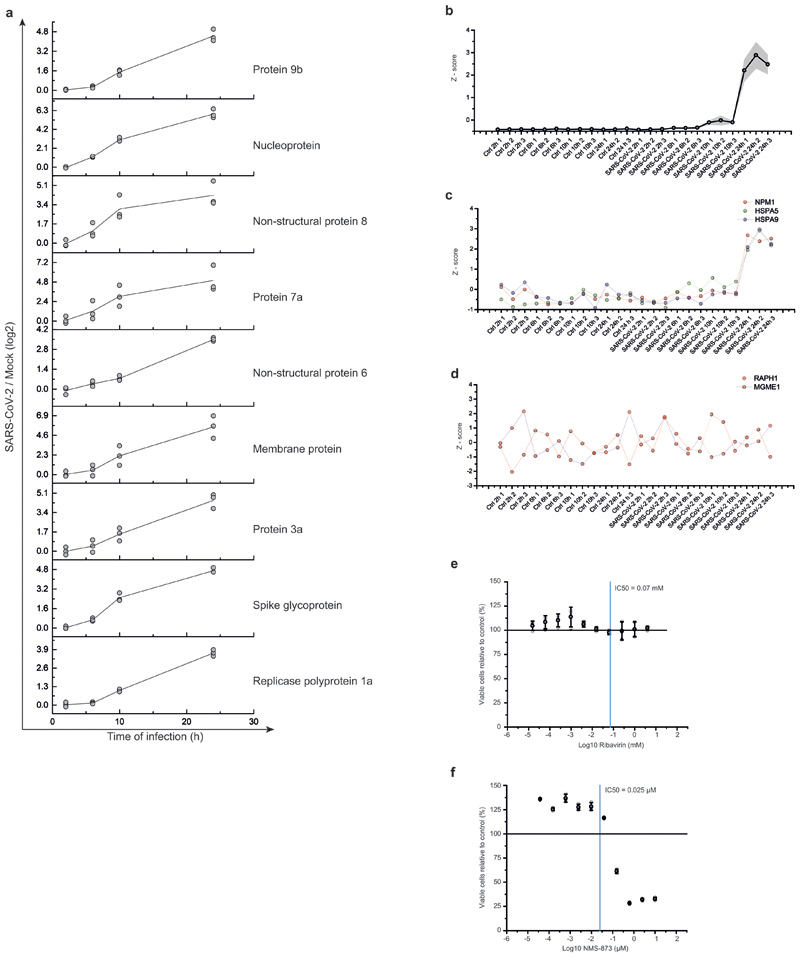
To identify additional potential inhibitors of SARS-CoV-2 replication, we determined proteins with abundance trajectories similar to the detected nine viral proteins (Fig. 4a and Extended Data Fig. 7a - d; measurement depth does not allow to distinguish polyprotein from processed protein). We compared distance and false discovery rate for each protein to an averaged viral protein profile and performed gene ontology (GO) analysis (459 proteins with a FDR < 0.01). We identified a major cluster of metabolic pathways consisting of diverse nucleic acid metabolism sub-pathways (Fig. 4b, Supplementary Table 5). Coronavirus replication depends on availability of cellular nucleotide pools20. Compounds interfering with nucleic acid metabolism, such as ribavirin, have been used in the past to inhibit viral replication21. We tested the effect of inhibition of nucleotide synthesis on SARS-CoV-2 replication in cells. Ribavirin, which inhibits inosine monophosphate dehydrogenase (IMPDH), the rate-limiting enzyme in de novo synthesis of guanosine nucleotides, inhibited SARS-CoV-2 replication at low micromolar and clinically achievable concentrations (Fig. 4c, Extended Data Fig. 7e)22, consistent with data in monkey cells23. Inhibition of IMPDH had been shown to prevent replication of coronaviruses HCoV-43, CoV-NL63 and MERS-CoV but not of SARS-CoV-124. Considering the clinical use of ribavirin to treat viruses such as hepatitis C and respiratory syncytial virus25,26, it may be regarded as treatment option for COVID-19 patients.
Fig. 4. Inhibition of host cell pathways induced upon infection prevent SARS-CoV-2 replication.
a, Protein levels of all detected viral proteins are plotted with their log2 changes to corresponding control for different infection times. Mean fold changes are plotted (n = 3). b, Gene ontology network analysis of host proteins correlating with viral protein expression (FDR < 0.01). Proteins were clustered for biological process GO term and plotted as network with FDR colour coding. Annotated pathways represent parent pathways in the network. c, d, Antiviral assay showing inhibition of viral replication in dependency of Ribavirin (c, n = 3) and NMS873 (d, n = 3) concentration. Each data point indicates a biological replicate and red line indicates dose response curve fit. R2 and IC50 values were computed from the curve fit and s.d. of IC50 is indicated in brackets. All n numbers represent independent biological samples.
Components of the protein homeostasis (proteostasis) machinery also showed a behaviour highly comparable to the viral proteins (Extended Data Fig. 3e), consistent with a perturbation of host cell proteostasis due to the higher folding load, resulting from high translation rates of viral proteins. Therefore, we tested the effects of proteostasis perturbation on SARS-CoV-2 replication using NMS-873, a small molecule inhibitor of the AAA ATPase p97. p97 is a key component of proteostasis affecting protein degradation, membrane fusion, vesicular trafficking and disassembly of stress granules27. NMS-873 has been shown to inhibit influenza A and B replication previously28. Here, NMS-873 inhibited SARS-CoV-2 replication at low nanomolar concentrations (Fig. 4d, Extended Data Fig. 7f). In summary, analyses of the effects of SARS-CoV-2 infection on the host cell proteome revealed major readjustments in cellular function, particularly of splicing, proteostasis and nucleotide biosynthesis. Compounds modulating these pathways prevented SARS-CoV-2 replication in cells.
Discussion
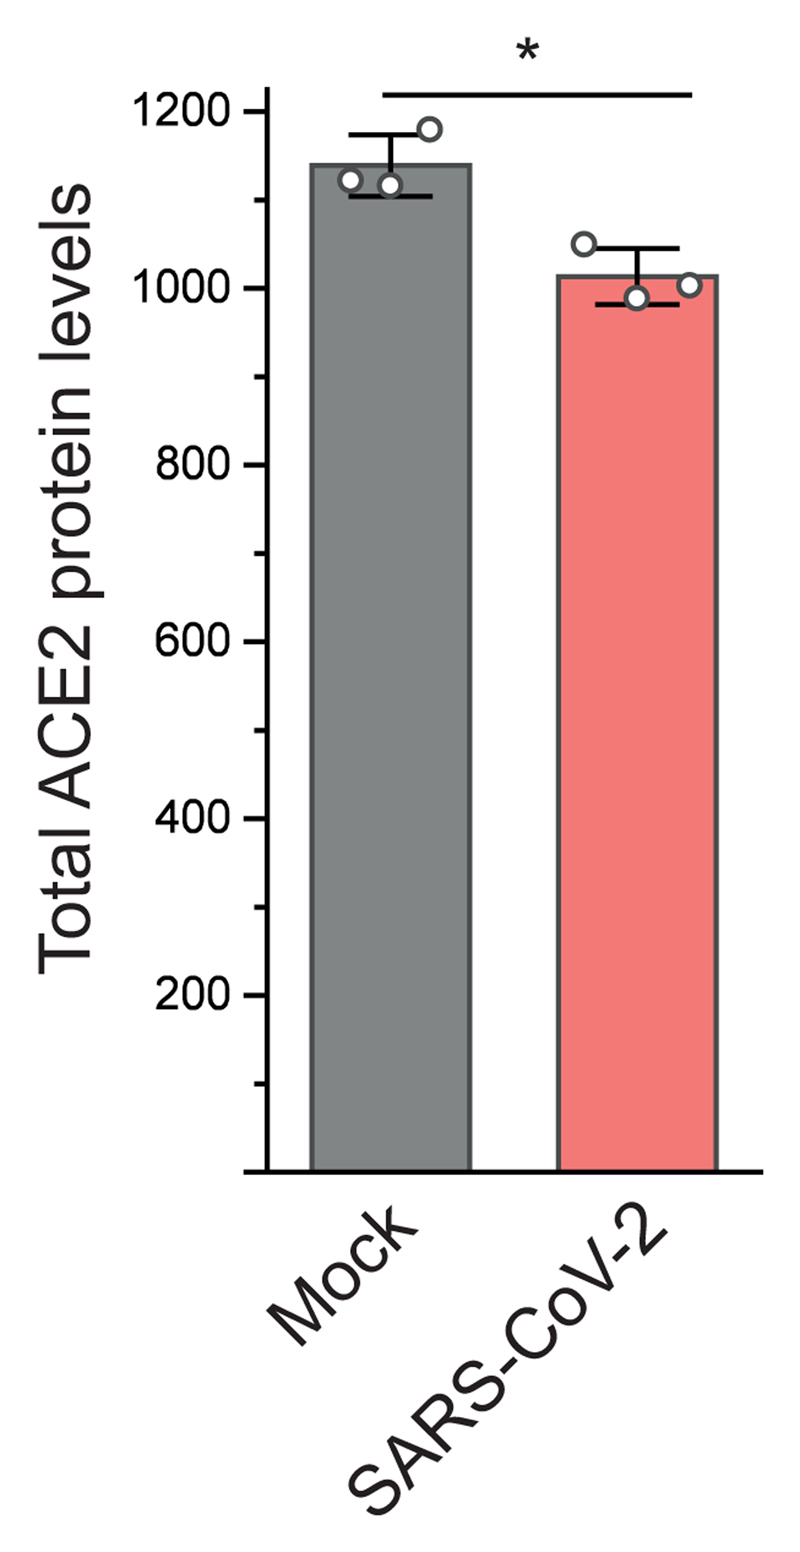
Identifying and testing potential drug candidates for COVID-19 is of high priority. So far, only limited data has been obtained describing the host-cell response to SARS-CoV-2 infection, preventing data-based assessment of treatment options. We describe a SARS-CoV-2 cell infection system to determine changes in host-cell pathways upon infection, resulting from host-cell (antiviral) responses or viral effector proteins, and assess inhibitors. At the MOI used, a majority of cells was infected, allowing to determine global changes across the whole cell population with minimal ratio compression from uninfected cells. We found the previously described SARS-CoV-2 entry receptor ACE2 mildly reduced after infection (Extended Data Figure 8), consistent with a drop in ACE2 levels due to shedding by ADAM10 described for SARS-CoV-129. Temporal proteome and translatome proteomics showed limited translation attenuation and revealed core cellular pathways modulated upon infection (Fig. 2). For SARS-CoV-1 and other RNA viruses, severe effects on translation had been described30. Our observations suggest that SARS-CoV-2 reshapes host cell translation, likely by increasing production of translation machinery components to compensate host-cell translation inhibition. We tested two translation inhibitors with different modes of action and found these to efficiently prevent viral replication in cells. These findings encourage further testing of translation inhibitors for preventing SARS-CoV-2 replication.
Overall, our proteomics analyses suggested cellular pathways for therapeutic intervention, including a profound increase in spliceosome, proteostasis and nucleotide biosynthesis pathway components. Revealing these pathways provided with novel drug targets, which were based on the behaviour of SARS-CoV-2 in human cells and had not previously been tested with other coronaviruses. Some of the inhibitors, for which we observed inhibition of SARS-CoV-2, are approved drugs, such as ribavirin, or undergoing clinical trials (i.e. 2-DG). A clinical trial for ribavirin was recently initiated (ClinicalTrials.gov; NCT04356677).
Analysis of pathways important for viral infection in cells by combinatorial profiling using proteomics and translatomics represents a useful tool to propose likely pathways to inhibit viral replication. Determining possible compounds based on the specific cellular infection profile of the virus allows an unbiased determination of potential drug targets. Here, using such an experimental-data-driven approach, we identified several drugs preventing SARS-CoV-2 replication in cells for further testing in clinical settings for COVID-19.
Methods
Cell culture
Human Caco-2 cells, derived from colon carcinoma, was obtained from the Deutsche Sammlung von Mikroorganismen und Zellkulturen (DSMZ; Braunschweig, Germany AC169). Cell-authentification certificate from DSMZ is available and cells have been tested negative for mycoplasma infection.
Cells were grown at 37°C in Minimal Essential Medium (MEM) supplemented with 10% fetal bovine serum (FBS) and containing 100 IU/ml penicillin and 100 µg/ml streptomycin. All culture reagents were purchased from Sigma.
Virus preparation
SARS-CoV-2 was isolated from samples of travellers returning from Wuhan (China) to Frankfurt (Germany) using human colon carcinoma cell line CaCo-2 as described previously6. SARS-CoV-2 stocks used in the experiments had undergone one passage on CaCo-2 cells and were stored at –80° C. Virus titers were determined as TCID50/ml in confluent cells in 96-well microtitre plates.
Quantification of viral RNA
SARS-CoV-2 RNA from cell culture supernatant samples was isolated using AVL buffer and the QIAamp Viral RNA Kit (Qiagen) according to the manufacturer's instructions. Absorbance-based quantification of the RNA yield was performed using the Genesys 10S UV-Vis Spectrophotometer (Thermo Scientific). RNA was subjected to OneStep qRT-PCR analysis using the Luna Universal One-Step RT-qPCR Kit (New England Biolabs) and a CFX96 Real-Time System, C1000 Touch Thermal Cycler. Primers were adapted from the WHO protocol31 targeting the open reading frame for RNA-dependent RNA polymerase (RdRp): RdRP_SARSr-F2 (GTG ARA TGG TCA TGT GTG GCG G) and RdRP_SARSr-R1 (CAR ATG TTA AAS ACA CTA TTA GCA TA) using 0.4 µM per reaction. Standard curves were created using plasmid DNA (pEX-A128-RdRP) harboring the corresponding amplicon regions for RdRP target sequence according to GenBank Accession number NC_045512. For each condition three biological replicates were used. Mean and standard deviation were calculated for each group.
Antiviral and cell viability assays
Confluent layers of CaCo-2 cells in 96-well plates were infected with SARS-CoV-2 at MOI 0.01. Virus was added together with drugs and incubated in MEM supplemented with 2% FBS with different drug dilutions. Cytopathogenic effect (CPE) was assessed visually 48 h after infection. To assess effects of drugs on Caco-2 cell viability, confluent cell layers were treated with different drug concentration in 96-well plates. The viability was measured using the Rotitest Vital (Roth) according to manufacturer’s instructions. Data for each condition was collected for at least three biological replicates. For dose response curves, data was fitted with all replicates using OriginPro 2020 with the following equation:
IC50 values were generated by Origin together with metrics for curve fits.
Detection of SARS-CoV-2 nucleoprotein
Viral infection was assessed by staining of SARS-CoV-2 nucleoprotein. Briefly, cells were fixed with acetone/methanol (40:60) solution and immunostaining was performed using a monoclonal antibody directed against SARS-CoV-2 nucleoprotein (1:500, Sinobiological, Cat #40143-R019-100ul), which was detected with a peroxidase conjugated anti-rabbit secondary antibody (1:1000, Dianova), followed by addition of AEC substrate.
Isotope labelling and cell lysis
Two hours before harvest cells were washed twice with warm PBS to remove interfering medium and cultured for two additional hours with DMEM medium containing 84 mg/L L-Arginine (13C615N4; Cambridge Isotope Laboratories, Cat#CNLM-539-H) and 146 mg/L L-Lysine (13C615N2, Cambridge Isotope Laboratories, Cat#CNLM-291-H) to label nascent proteins. After labelling culture, the cells were washed three times with warm PBS and lysed with 95°C hot lysis buffer (100mM EPPS pH 8.2, 2% sodium deoxycholate, 1mM TCEP, 4mM 2-Chloracetamide, Protease inhibitor tablet mini EDTA-free [Roche]). Samples were then incubated for additional five minutes at 95°C, followed by sonication for 30s and further 10min incubation at 95°C.
Sample preparation for mass spectrometry
Samples were prepared as previously described3. Briefly, proteins were precipitated using methanol/chloroform precipitation and resuspended in 8M Urea/10mM EPPS pH 8.2. Isolated proteins were digested with 1:50 wt/wt LysC (Wako Chemicals) and 1:100 wt/wt Trypsin (Promega, Sequencing grade) overnight at 37°C after dilution to a final Urea concentration of 1M. Digests then were acidified (pH 2-3) using TFA. Peptides were purified using C18 (50mg) SepPak columns (Waters) as previously described. Desalted peptides were dried and 25µg of peptides were resuspended in TMT labelling buffer (200mM EPPS pH 8.2, 10% acetonitrile). Peptides were subjected to TMT labelling with 1:2 Peptide TMT ratio (wt/wt) for one hour at RT. Labelling reaction was quenched by addition of hydroxylamine to a final concentration of 0.5% and incubation at RT for additional 15min. Labelled peptides were pooled and subjected to High pH Reverse Phase fractionation with the HpH RP Fractionation kit (Thermo Fisher Scientific) following manufacturer’s instructions. All multiplexes were mixed with a bridge channel, that consists of control sample labelled in one reaction and split to all multiplexes in equimolar amounts.
Liquid chromatography mass spectrometry
Peptides were resuspended in 0.1% FA and separated on an Easy nLC 1200 (ThermoFisher Scientific) and a 22 cm long, 75 µm ID fused-silica column, which had been packed in house with 1.9 µm C18 particles (ReproSil-Pur, Dr. Maisch), and kept at 45°C using an integrated column oven (Sonation). Peptides were eluted by a non-linear gradient from 5-38% acetonitrile over 120 min and directly sprayed into a QExactive HF mass spectrometer equipped with a nanoFlex ion source (ThermoFisher Scientific) at a spray voltage of 2.3 kV. Full scan MS spectra (350-1400 m/z) were acquired at a resolution of 120,000 at m/z 200, a maximum injection time of 100 ms and an AGC target value of 3 x 10⁶. Up to 20 most intense peptides per full scan were isolated using a 1 Th window and fragmented using higher energy collisional dissociation (normalized collision energy of 35). MS/MS spectra were acquired with a resolution of 45,000 at m/z 200, a maximum injection time of 80 ms and an AGC target value of 1 x 10⁵. Ions with charge states of 1 and > 6 as well as ions with unassigned charge states were not considered for fragmentation. Dynamic exclusion was set to 20 s to minimize repeated sequencing of already acquired precursors.
Mass spectrometry data analysis
Raw files were analyzed using Proteome Discoverer (PD) 2.4 software (ThermoFisher Scientific). Spectra were selected using default settings and database searches performed using SequestHT node in PD. Database searches were performed against trypsin digested Homo Sapiens SwissProt database, SARS-CoV-2 database (Uniprot pre-release) and FASTA files of common contaminants (`contaminants.fasta` provided with MaxQuant) for quality control. Fixed modifications were set as TMT6 at the N-terminus and carbamidomethyl at cysteine residues. One search node was set up to search with TMT6 (K) and methionine oxidation as static modifications to search for light peptides and one search node was set up with TMT6+K8 (K, +237.177), Arg10 (R, +10.008) and methionine oxidation as static modifications to identify heavy peptides. Searches were performed using Sequest HT. After search, posterior error probabilities were calculated and PSMs filtered using Percolator using default settings. Consensus Workflow for reporter ion quantification was performed with default settings, except the minimal signal-to-noise ratio was set to 5. Results were then exported to Excel files for further processing. For proteome quantification all PSMs were summed intensity normalized, followed by IRS32 and TMM33 normalization and peptides corresponding to a given UniProt Accession were summed including all modification states.
For translatome measurements, Excel files were processed in Python, as previously described3. Python 3.6 was used together with the following packages: pandas 0.23.434, numpy 1.15.435, scipy 1.3.0. Excel files with normalized PSM data were read in and each channel was normalized to the lowest channel based on total intensity. For each peptide sequence, all possible modification states containing a heavy label were extracted and the intensities for each channel were averaged between all modified peptides. Baseline subtraction was performed by subtracting the measured intensities for the non-SILAC-labeled sample from all other values. Negative intensities were treated as zero. The heavy label incorporation at the protein level was calculated by summing the intensities of all peptide sequences belonging to one unique protein accession. These values were combined with the standard protein output of PD 2.4 to add annotation data to the master protein accessions.
Hierarchical clustering and profile comparison
Hierarchical cluster analysis and comparison with viral protein profiles for all samples was performed using Perseus36 software package (version 1.6.5.0) after centering and scaling of data (Z scores). K-means pre-processing was performed with a cluster number of 12 and a maximum of 10 iterations. For the comparison of profiles, the viral profiles were Z scored and averaged to generate reference profile. Profiles of all proteins were compared to the reference (Pearson), distances and False discovery rates computed.
Network analysis
For network analysis, Cytoscape 3.7.137 software was used with BiNGO 3.0.338 plugin for GO term analysis, EnrichmentMap 3.1.039 and ReactomeFI 6.1.040. For GO-term analyses, gene sets were extracted from data as indicated using fold change and significance cut-offs.
Statistical analysis
Significance was, unless stated otherwise, tested using unpaired two-sided students t-tests with equal variance assumed. Statistical analysis was performed using OriginPro 2020 analysis software. For network and GO analysis all statistical computations were performed by the corresponding packages.
Extended Data
Extended Data Fig. 1. Viral protein accumulation in Caco-2 cells after SARS-CoV-2 infection.
Cells were infected with SARS-CoV-2 at a MOI of 1 and incubated for 10 or 24 hours. Cells were fixed and stained with an antibody for SARS-CoV-2 nucleoprotein, followed by peroxidase conjugated secondary antibody and addition of substrate. Shown are three independent biological samples. n = 3 independent biological samples.
Extended Data Fig. 2. Translatome analysis of cells infected with SARS-CoV-2.
a, Principal component analysis of all replicate translatome measurements. Blue dots represent different mock controls, red dots different SARS-CoV-2 infected samples. b, Volcano plots showing differentially translated genes between infected cells and mock control group for each time point. Log2 fold changes are plotted against P values (two sided unpaired t-test with equal variance assumed; n = 3 independent biological samples). Blue dots indicate significant decrease in translation (FC < -0.5, P value < 0.05), red dots indicate significant increase in translation (FC > 0.5, P value < 0.05 c, Histogram of distances of host protein expression profile to viral proteins. Viral protein translation profiles were Z scored, averaged (5 viral proteins) and used as reference profile to compare to each host protein in dataset. The blue curve shows a distribution curve fitted to data, the red line indicates top 10% quantile of distances used for pathway analysis (in Fig. 2). d, Averaged viral protein translation Z-score profile over all replicate samples (5 viral proteins). Grey shade indicates SD of averaged profiles, coloured profiles in the background represent individual viral proteins. e, Translation Z score profiles for four example proteins (ENO1, FLNA, CEBPZ and COTL1) following viral profile from c. f, Translation Z score profiles for four example proteins (SH3BGRL, sNRPB, PPA1 and SEPT11) that do not follow viral reference profile. g, Network of functional interactions between proteins annotated with function in host translation. Arrows indicate functional interaction. h, Drugs targeting host translation that have been used in vitro for treatment of other (i.e. non-SARS-CoV-2) coronavirus infections. i, j, Cytotoxicity assays for different concentrations of cycloheximide (i) and emetine (j) relative to control. Mean values ± s.d. are plotted (n = 3 independent biological samples). Line represents 100% viable cells.
Extended Data Fig. 3. Volcano plots of total protein level change over time.
P values have been calculated using a two-sided, unpaired student’s t-test with equal variance assumed and were plotted against the log2 ratio between SARS-CoV-2 infected and mock cells for each time-point (n = 3 independent biological samples).
Extended Data Fig. 4. Network of proteins decreased during SARS-CoV-2 infection.
a, Proteins belonging to cluster I in Fig. 3a were used for functional interaction network creation. Lines indicate functional interactions. The network was created using the ReactomeFI plugin in cytoscape, protein names added in the plugin and the network adjusted by the yFiles Layout algorithm. b, ReactomeFI network analysis of proteins downregulated in total protein levels. Circle size represents number of proteins found in the pathway, colour shows FDR for enrichment.
Extended Data Fig. 5. Networks of proteins increased during infection.
a, Network of proteins increased during infection with spliceosome annotation in Reactome pathway analysis. Lines indicate functional interaction. b, Table summarising viral proteins (from different coronaviruses) interacting with various spliceosome components. c, d, Cytotoxicity assays for different concentrations of Pladienolide B (c) and 2-deoxy-glucose (d) relative to control. Mean values ± s.d. (n = 3 independent biological samples). Line represents 100% viable cells. e, Protein network showing increased proteins during infection with annotation to “unfolded protein binding” molecular function. Lines indicate functional interaction
Extended Data Fig. 6. Compartment analysis of proteins significantly regulated.
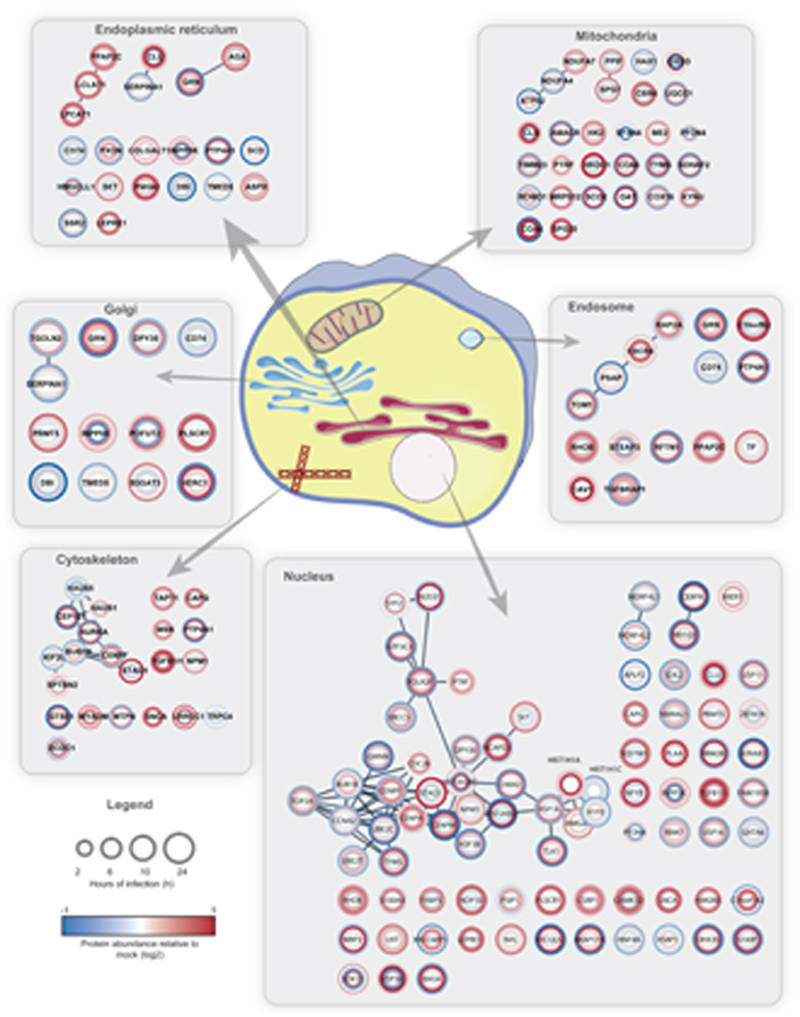
STRING network was created with proteins filtered for significant changes in protein levels (FC log2 > |0.35|, P value < 0.05) and filtered for each compartment (Cutoff maximum [5]). Circle heatmaps represent log2 ratios between infected and mock cells at different timepoints of infection starting at the innermost circle (2 hours) towards the outer circle (24 h).
Extended Data Fig. 7. Viral protein profiles and cytotoxicity assay for nucleic acid and p97 inhibitors.
a, Total protein profiles for each viral protein with individual replicate measurements to indicate variation. Log2 ratios of infected versus mock cells are plotted against time of infection. Line indicates averaged curve (n = 3 independent biological samples) and dots represent individual measurements. b, Averaged reference profile of total protein levels for all viral proteins from a(9 viral proteins). Shade indicates s.d.. c, Example profiles of three proteins (NPM1, HSPA5 and HSPA9) significantly following the viral reference profile. d, Example profiles of proteins (RAPH1, MGME1) not following the viral reference profile. e, f, Cytotoxicity assays for different concentrations of Ribavirin (e) and NSM-873 (f) relative to control. Mean values ± s.d. are plotted (n = 3 independent biological samples). Line represents 100% viable cells.
Extended Data Fig. 8. ACE2 total protein levels after 24 hours of infection.
Total ACE2 protein levels 24 hours after infection compared to mock samples (n = 3 independent biological samples). Significance was assessed by an unpaired, two-sided student´s t-test. * P value < 0.05.
Supplementary Material
Contains Uniprot Accession, Species annotation, Gene Symbol and normalized translation data for each replicate (Data was normalized using summed intensity normalisation for sample loading, followed by internal reference scaling and Trimmed mean of M normalisation). Log2 ratios and P values were computed for each group comparison (two-sided, unpaired t-test with equal variance assumed, n = 3 independent biological samples). See Fig. 2.
Contains UniProt Accession, Gene Symbol and normalized protein abundances for each sample. (Data was normalized using summed intensity normalisation for sample loading, followed by internal reference scaling and Trimmed mean of M normalisation). Log2 ratios and P values were computed for each group comparison (two-sided, unpaired t-test with equal variance assumed, n = 3 independent biological samples). See Fig. 3, 4.
Pathway names, size of pathway, proteins found in dataset, P values and FDR are given (P values by binomial test and FDR by binomial test and Benjamini-Hochberg correction).
Pathway names, size of pathway, proteins found in dataset, P values and FDR are given (P values by binomial test and FDR by binomial test and Benjamini-Hochberg correction).
GO term, proteins found in dataset, GO size, P value and FDR are given (P values by binomial test and FDR by binomial test and Benjamini-Hochberg correction).
Acknowledgements
We thank Christiane Pallas and Lena Stegmann for experimental support and Georg Tascher and Martin Adrian-Allgood for proteomics support. J.C. acknowledges funding by the Hilfe für krebskranke Kinder Frankfurt e.V. and the Frankfurter Stiftung für krebskranke Kinder. C.M. was supported by the European Research Council under the European Union’s Seventh Framework Programme (ERC StG 803565), CRC 1177 and the Emmy Noether Programme of the Deutsche Forschungsgemeinschaft (DFG, MU 4216/1-1), the Johanna Quandt Young Academy at Goethe, and Aventis Foundation Bridge Award.
Footnotes
Contributions
B.K., J.C. and C.M. conceived the study. D.B., carried out tissue culture work, virus experiments, and cytotoxicity assays. K.K. performed proteomic analyses of viral infection kinetics and bioinformatics analyses. M.W. carried out quantitative PCRs. B.K. analysed literature for established inhibitors in viral therapy. D.K. developed the online tool for data visualization. S.C., J.C. and C.M. supervised the work. K.K., J.C. and C.M. wrote the initial manuscript, with contributions from all authors. All authors read and approved the final manuscript.
Competing interests
The authors declare no competing interests.
Data availability
The mass spectrometry proteomics data have been deposited to the ProteomeXchange Consortium via the PRIDE41 partner repository with the dataset identifier PXD017710. We furthermore created a webpage (http://corona.papers.biochem2.com/) visualizing the presented data for easy access of the published data.
References
- 1.Zhu N, et al. A Novel Coronavirus from Patients with Pneumonia in China, 2019. N Engl J Med. 2020;382:727–733. doi: 10.1056/NEJMoa2001017. [DOI] [PMC free article] [PubMed] [Google Scholar]
- 2.Zhao S, et al. Preliminary estimation of the basic reproduction number of novel coronavirus (2019-nCoV) in China, from 2019 to 2020: A data-driven analysis in the early phase of the outbreak. Int J Infect Dis. 2020 doi: 10.1016/j.ijid.2020.01.050. [DOI] [PMC free article] [PubMed] [Google Scholar]
- 3.Klann K, Tascher G, Münch C. Functional Translatome Proteomics Reveal Converging and Dose-Dependent Regulation by mTORC1 and eIF2α. Mol Cell. 2020;77:913–925.e4. doi: 10.1016/j.molcel.2019.11.010. [DOI] [PMC free article] [PubMed] [Google Scholar]
- 4.Jin Y-H, et al. A rapid advice guideline for the diagnosis and treatment of 2019 novel coronavirus (2019-nCoV) infected pneumonia (standard version) Mil Med Res. 2020;7:4. doi: 10.1186/s40779-020-0233-6. [DOI] [PMC free article] [PubMed] [Google Scholar]
- 5.She J, et al. 2019 novel coronavirus of pneumonia in Wuhan, China: emerging attack and management strategies. Clin Transl Med. 2020;9:1–7. doi: 10.1186/s40169-020-00271-z. [DOI] [PMC free article] [PubMed] [Google Scholar]
- 6.Hoehl S, et al. Evidence of SARS-CoV-2 Infection in Returning Travelers from Wuhan, China. N Engl J Med. 2020 doi: 10.1056/NEJMc2001899. [DOI] [PMC free article] [PubMed] [Google Scholar]
- 7.Xiao F, et al. Evidence for gastrointestinal infection of SARS-CoV-2. Gastroenterology. 2020 doi: 10.1053/j.gastro.2020.02.055. [DOI] [PMC free article] [PubMed] [Google Scholar]
- 8.Young BE, et al. Epidemiologic features and clinical course of patients infected with SARS-CoV-2 in Singapore. Jama. 2020 doi: 10.1001/jama.2020.3204. [DOI] [PMC free article] [PubMed] [Google Scholar]
- 9.Cinatl J, et al. Treatment of SARS with human interferons. Lancet. 2003;362:293–294. doi: 10.1016/S0140-6736(03)13973-6. [DOI] [PMC free article] [PubMed] [Google Scholar]
- 10.Kamitani W, Huang C, Narayanan K, Lokugamage KG, Makino S. A two-pronged strategy to suppress host protein synthesis by SARS coronavirus Nsp1 protein. Nat Struct Mol Biol. 2009;16:1134–1140. doi: 10.1038/nsmb.1680. [DOI] [PMC free article] [PubMed] [Google Scholar]
- 11.Shen L, et al. High-throughput screening and identification of potent broad-spectrum inhibitors of coronaviruses. J Virol. 2019;93:e00023–19. doi: 10.1128/JVI.00023-19. [DOI] [PMC free article] [PubMed] [Google Scholar]
- 12.Pillaiyar T, Meenakshisundaram S, Manickam M. Recent discovery and development of inhibitors targeting coronaviruses. Drug Discov Today. 2020;25:668–688. doi: 10.1016/j.drudis.2020.01.015. [DOI] [PMC free article] [PubMed] [Google Scholar]
- 13.Neuman BW, et al. Proteomics analysis unravels the functional repertoire of coronavirus nonstructural protein 3. J Virol. 2008;82:5279–5294. doi: 10.1128/JVI.02631-07. [DOI] [PMC free article] [PubMed] [Google Scholar]
- 14.Jourdan SS, Osorio F, Hiscox JA. An interactome map of the nucleocapsid protein from a highly pathogenic N orth A merican porcine reproductive and respiratory syndrome virus strain generated using SILAC- based quantitative proteomics. Proteomics. 2012;12:1015–1023. doi: 10.1002/pmic.201100469. [DOI] [PMC free article] [PubMed] [Google Scholar]
- 15.Song T, et al. Quantitative interactome reveals that porcine reproductive and respiratory syndrome virus nonstructural protein 2 forms a complex with viral nucleocapsid protein and cellular vimentin. J Proteomics. 2016;142:70–81. doi: 10.1016/j.jprot.2016.05.009. [DOI] [PubMed] [Google Scholar]
- 16.Emmott E, et al. The cellular interactome of the coronavirus infectious bronchitis virus nucleocapsid protein and functional implications for virus biology. J Virol. 2013;87:9486–9500. doi: 10.1128/JVI.00321-13. [DOI] [PMC free article] [PubMed] [Google Scholar]
- 17.Cretu C, et al. Structural Basis of Splicing Modulation by Antitumor Macrolide Compounds. Mol Cell. 2018;70:265–273.e8. doi: 10.1016/j.molcel.2018.03.011. [DOI] [PubMed] [Google Scholar]
- 18.Gualdoni GA, et al. Rhinovirus induces an anabolic reprogramming in host cell metabolism essential for viral replication. Proc Natl Acad Sci. 2018;115 doi: 10.1073/pnas.1800525115. E7158 LP-E7165. [DOI] [PMC free article] [PubMed] [Google Scholar]
- 19.Yan B, et al. Characterization of the Lipidomic Profile of Human Coronavirus-Infected Cells: Implications for Lipid Metabolism Remodeling upon Coronavirus Replication. Viruses. 2019;11:73. doi: 10.3390/v11010073. [DOI] [PMC free article] [PubMed] [Google Scholar]
- 20.Pruijssers AJ, Denison MR. Nucleoside analogues for the treatment of coronavirus infections. Curr Opin Virol. 2019;35:57–62. doi: 10.1016/j.coviro.2019.04.002. [DOI] [PMC free article] [PubMed] [Google Scholar]
- 21.Saijo M, et al. Inhibitory effect of mizoribine and ribavirin on the replication of severe acute respiratory syndrome (SARS)-associated coronavirus. Antiviral Res. 2005;66:159–163. doi: 10.1016/j.antiviral.2005.01.003. [DOI] [PMC free article] [PubMed] [Google Scholar]
- 22.Wu LS, et al. Population Pharmacokinetic Modeling of Plasma and Intracellular Ribavirin Concentrations in Patients with Chronic Hepatitis C Virus Infection. Antimicrob Agents Chemother. 2015;59 doi: 10.1128/AAC.04618-14. 2179 LP - 2188. [DOI] [PMC free article] [PubMed] [Google Scholar]
- 23.Wang M, et al. Remdesivir and chloroquine effectively inhibit the recently emerged novel coronavirus (2019-nCoV) in vitro. Cell Res. 2020;30:269–271. doi: 10.1038/s41422-020-0282-0. [DOI] [PMC free article] [PubMed] [Google Scholar]
- 24.Cinatl J, et al. Glycyrrhizin, an active component of liquorice roots, and replication of SARS-associated coronavirus. Lancet. 2003;361:2045–2046. doi: 10.1016/S0140-6736(03)13615-X. [DOI] [PMC free article] [PubMed] [Google Scholar]
- 25.Martin P, Jensen DM. Ribavirin in the treatment of chronic hepatitis C. J Gastroenterol Hepatol. 2008;23:844–855. doi: 10.1111/j.1440-1746.2008.05398.x. [DOI] [PubMed] [Google Scholar]
- 26.Marcelin JR, Wilson JW, Razonable RR, Services TMCHTID. Oral ribavirin therapy for respiratory syncytial virus infections in moderately to severely immunocompromised patients. Transpl Infect Dis. 2014;16:242–250. doi: 10.1111/tid.12194. [DOI] [PubMed] [Google Scholar]
- 27.Ye Y, Tang WK, Zhang T, Xia D. A Mighty “Protein Extractor” of the Cell: Structure and Function of the p97/CDC48 ATPase. Frontiers in Molecular Biosciences. 2017;4:39. doi: 10.3389/fmolb.2017.00039. [DOI] [PMC free article] [PubMed] [Google Scholar]
- 28.Zhang J, et al. Identification of NMS-873, an allosteric and specific p97 inhibitor, as a broad antiviral against both influenza A and B viruses. Eur J Pharm Sci. 2019;133:86–94. doi: 10.1016/j.ejps.2019.03.020. [DOI] [PMC free article] [PubMed] [Google Scholar]
- 29.Jia HP, et al. Ectodomain shedding of angiotensin converting enzyme 2 in human airway epithelia. Am J Physiol Lung Cell Mol Physiol. 2009;297:L84–L96. doi: 10.1152/ajplung.00071.2009. [DOI] [PMC free article] [PubMed] [Google Scholar]
- 30.Narayanan K, et al. Severe Acute Respiratory Syndrome Coronavirus nsp1 Suppresses Host Gene Expression, Including That of Type I Interferon, in Infected Cells. J Virol. 2008;82 doi: 10.1128/JVI.02472-07. 4471 LP - 4479. [DOI] [PMC free article] [PubMed] [Google Scholar]
- 31.Corman VM, et al. Detection of 2019 novel coronavirus (2019-nCoV) by real-time RT-PCR. Euro Surveill. 2020;25 doi: 10.2807/1560-7917.ES.2020.25.3.2000045. 2000045. [DOI] [PMC free article] [PubMed] [Google Scholar]
- 32.Plubell DL, et al. Extended Multiplexing of Tandem Mass Tags (TMT) Labeling Reveals Age and High Fat Diet Specific Proteome Changes in Mouse Epididymal Adipose Tissue. Mol Cell Proteomics. 2017;16:873–890. doi: 10.1074/mcp.M116.065524. [DOI] [PMC free article] [PubMed] [Google Scholar]
- 33.Robinson MD, Oshlack A. A scaling normalization method for differential expression analysis of RNA-seq data. Genome Biol. 2010;11:R25. doi: 10.1186/gb-2010-11-3-r25. [DOI] [PMC free article] [PubMed] [Google Scholar]
- 34.McKinney W, et al. Data structures for statistical computing in python. Proceedings of the 9th Python in Science Conference; 2010. pp. 51–6. [Google Scholar]
- 35.van der Walt S, Colbert SC, Varoquaux G. The NumPy Array: A Structure for Efficient Numerical Computation. Comput Sci Eng. 2011;13:22–30. [Google Scholar]
- 36.Tyanova S, et al. The Perseus computational platform for comprehensive analysis of (prote)omics data. Nat Methods. 2016;13:731–740. doi: 10.1038/nmeth.3901. [DOI] [PubMed] [Google Scholar]
- 37.Shannon P, et al. Cytoscape: a software environment for integrated models of biomolecular interaction networks. Genome Res. 2003;13:2498–504. doi: 10.1101/gr.1239303. [DOI] [PMC free article] [PubMed] [Google Scholar]
- 38.Maere S, Heymans K, Kuiper M. BiNGO: a Cytoscape plugin to assess overrepresentation of Gene Ontology categories in Biological Networks. Bioinformatics. 2005;21:3448–3449. doi: 10.1093/bioinformatics/bti551. [DOI] [PubMed] [Google Scholar]
- 39.Merico D, Isserlin R, Stueker O, Emili A, Bader GD. Enrichment Map: A Network-Based Method for Gene-Set Enrichment Visualization and Interpretation. PLoS One. 2010;5:e13984. doi: 10.1371/journal.pone.0013984. [DOI] [PMC free article] [PubMed] [Google Scholar]
- 40.Wu G, Haw R. Functional Interaction Network Construction and Analysis for Disease Discovery. Humana Press; New York, NY: 2017. pp. 235–253. [DOI] [PubMed] [Google Scholar]
- 41.Perez-Riverol Y, et al. The PRIDE database and related tools and resources in 2019: improving support for quantification data. Nucleic Acids Res. 2019;47:D442–D450. doi: 10.1093/nar/gky1106. [DOI] [PMC free article] [PubMed] [Google Scholar]
Associated Data
This section collects any data citations, data availability statements, or supplementary materials included in this article.
Supplementary Materials
Contains Uniprot Accession, Species annotation, Gene Symbol and normalized translation data for each replicate (Data was normalized using summed intensity normalisation for sample loading, followed by internal reference scaling and Trimmed mean of M normalisation). Log2 ratios and P values were computed for each group comparison (two-sided, unpaired t-test with equal variance assumed, n = 3 independent biological samples). See Fig. 2.
Contains UniProt Accession, Gene Symbol and normalized protein abundances for each sample. (Data was normalized using summed intensity normalisation for sample loading, followed by internal reference scaling and Trimmed mean of M normalisation). Log2 ratios and P values were computed for each group comparison (two-sided, unpaired t-test with equal variance assumed, n = 3 independent biological samples). See Fig. 3, 4.
Pathway names, size of pathway, proteins found in dataset, P values and FDR are given (P values by binomial test and FDR by binomial test and Benjamini-Hochberg correction).
Pathway names, size of pathway, proteins found in dataset, P values and FDR are given (P values by binomial test and FDR by binomial test and Benjamini-Hochberg correction).
GO term, proteins found in dataset, GO size, P value and FDR are given (P values by binomial test and FDR by binomial test and Benjamini-Hochberg correction).
Data Availability Statement
The mass spectrometry proteomics data have been deposited to the ProteomeXchange Consortium via the PRIDE41 partner repository with the dataset identifier PXD017710. We furthermore created a webpage (http://corona.papers.biochem2.com/) visualizing the presented data for easy access of the published data.


