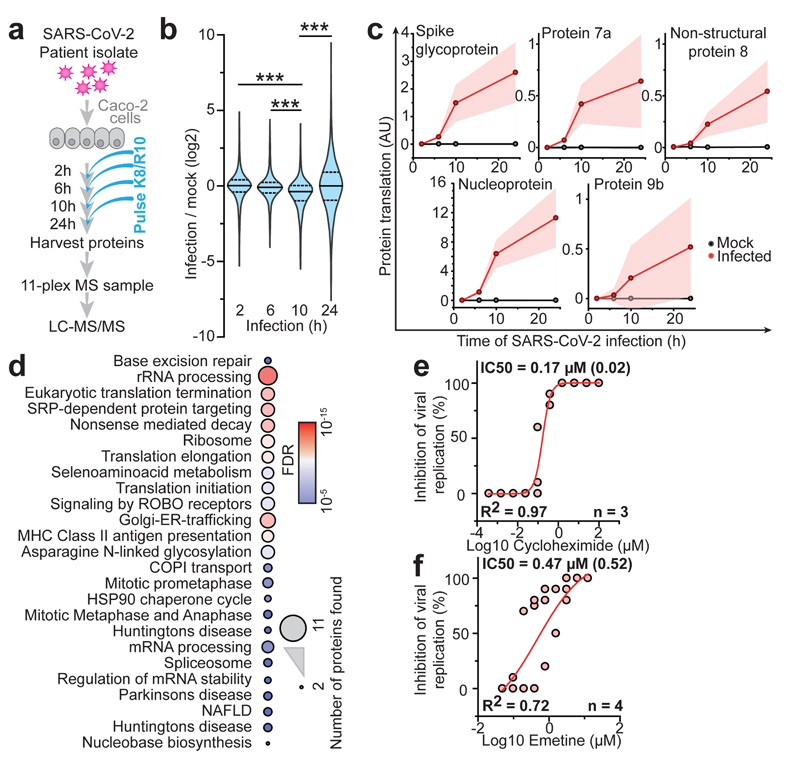
Fig. 2. Host cell translation changes upon SARS-CoV-2 infection.
a, Experimental scheme for translatome and proteome measurements. Caco-2 cells were infected with SARS-CoV-2 isolated from patients, incubated as indicated and analysed by quantitative translation and whole-cell proteomics. b, Global translation rates, showed by distribution plots of mean fold changes (log2) of replicates to mock control for each time point and protein. Black line indicates median and dashed lines indicate 25%/75% quantiles. Significance was tested by one-way ANOVA and two-sided post-hoc Bonferroni test. *** P value < 0.001 (10h/2h: 4x10-26; 10h/6h: 2.4x10⁻²³; 10h/24h: 2.3x10⁻²⁸, n = 2,716 measured proteins averaged from 3 independent biological samples). c, Translation of viral proteins over time. Mean translation in AU (normalised and corrected summed PSMs were averaged) is plotted for control and infected samples. Shades indicate s.d. (n = 3). d, Reactome pathway analysis of top 10% proteins following viral gene expression. Pathway results are shown with number of proteins found in dataset and computed FDR for pathway enrichment. e, f, Antiviral assay showing inhibition of viral replication in dependency of cycloheximide (e, n = 3) and emetine (f, n = 4) concentration. Each data point indicates biological replicates and red line shows dose response curve fit. R2 and IC50 values were computed from the curve fit and SD of IC50 is indicated in brackets. All n numbers represent independent biological samples if not stated otherwise.

