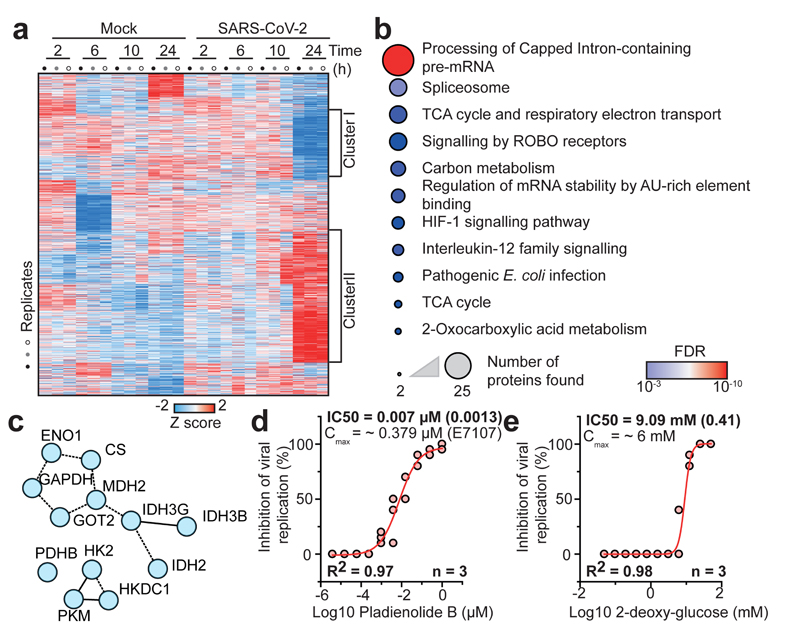
Fig. 3. SARS-CoV-2 infection profiling reveals cellular pathways essential for replication.
a, Patterns of protein levels across all samples. Shown are proteins tested significant (two-sided, unpaired t-test with equal variance assumed, P < 0.05, n = 3) in at least one infected sample compared to corresponding control. Data was standardized using Z scoring before row-wise clustering and plotting. b, Reactome pathway analysis of protein network created from cluster II (a, see Table S4). Pathway results are shown with number of proteins found in dataset and computed FDR for pathway enrichment. c, Functional interaction network of proteins found annotated to carbon metabolism in Reactome pathway analysis. Lines indicate functional interaction. d, e, Antiviral assay showing inhibition of viral replication in dependency of pladienolide B (d, n = 3) and 2-deoxy-glucose (e, n = 3) concentration. Each data point indicates a biological replicate and red line shows dose response curve fit. R2 and IC50 values were computed from the curve fit and s.d. of IC50 is indicated in brackets. All n numbers represent independent biological samples.

